Article

Design and Optimization of Valve Lift Curves for Piston-Type Expander at Different Rotational Speeds

by
Yongtao Sun
1,
Qihui Yu
1,2,*,
Zhenjie Han
1,
Ripeng Qin
1 and
Xueqing Hao
1
1
School of Mechanical Engineering, Inner Mongolia University of Science and Technology, Baotou 014010, China
2
Inner Mongolia Key Laboratory of Intelligent Diagnosis and Control of Mechatronic System, Baotou 014010, China
*
Author to whom correspondence should be addressed.
Fluids 2025, 10(8), 204; https://doi.org/10.3390/fluids10080204 (registering DOI)
Submission received: 26 June 2025 / Revised: 25 July 2025 / Accepted: 31 July 2025 / Published: 1 August 2025

Abstract

The piston-type expander (PTE), as the primary output component, significantly influences the performance of an energy storage system. This paper proposes a non-cam variable valve actuation system for the PTE, supported by a mathematical model. An enhanced S-curve trajectory planning method is used to design the valve lift curve. The study investigates the effects of various valve lift design parameters on output power and efficiency at different rotational speeds, employing orthogonal design and SPSS Statistics 27 (Statistical Product and Service Solutions) simulations. A grey comprehensive evaluation method is used to identify optimal valve lift parameters for each speed. The results show that valve lift parameters influence PTE performance to varying degrees, with intake duration having the greatest effect, followed by maximum valve lift, while intake end time has the least impact. The non-cam PTE outperforms the cam-based PTE. At 800 rpm, the optimal design yields 7.12 kW and 53.5% efficiency; at 900 rpm, 8.17 kW and 50.6%; at 1000 rpm, 9.2 kW and 46.8%; and at 1100 rpm, 12.09 kW and 41.2%. At these speeds, output power increases by 18.37%, 11.42%, 11.62%, and 9.82%, while energy efficiency improves by 15.01%, 15.05%, 14.24%, and 13.86%, respectively.

1. Introduction

Since implementing carbon peak and neutrality policies, renewable energy generation in China has experienced rapid growth, marked by a substantial increase in newly installed capacity [1]. However, the inherent intermittency of renewable sources, such as wind and solar energy, has raised significant concerns regarding grid security and reliability. Consequently, the development and deployment of advanced energy storage technologies have become essential for maintaining the stable operation of the energy system and ensuring energy security [2]. Among these technologies, compressed air energy storage (CAES) stands out as particularly promising due to its scalability, cost-effectiveness, and high energy-conversion efficiency [3]. Numerous studies have substantiated the feasibility of small-scale CAES systems for industrial applications, demonstrating their practical utility and effectiveness [4,5,6]. Within CAES systems, the expander plays a pivotal role in determining both output power and overall energy conversion efficiency. Piston-type expanders (PTEs) are particularly well-suited for small-scale CAES applications, owing to their capacity to operate at low flow rates while achieving high-pressure ratios [7,8]. This combination of characteristics not only optimizes system performance but also enhances the economic viability of CAES, thus contributing to the advancement of sustainable energy solutions.
The variable valve actuation (VVA) system of the PTE is critical for optimizing its output performance. Previous research has categorized VVA systems into two main types: cam-based and non-cam systems. A study conducted by Qihui Yu et al. on cam-based VVA systems demonstrated that, under specific intake pressures, both output power and efficiency initially rise with increasing load before subsequently declining. Additionally, elevated intake temperatures were found to positively influence both output power and efficiency, indicating potential operational advantages under varying thermal conditions [9]. In a complementary investigation, Qiyue Xu and colleagues explored the PTE’s functionality as a pneumatic engine, developing a parameter optimization methodology to assess the impact of various gas distribution parameters on performance metrics. This work establishes a theoretical foundation for future multi-objective optimization endeavors aimed at enhancing expander efficiency [10]. Furthermore, extensive studies on cam-based VVA systems highlight that the considerable exhaust pressure generated during PTE operation introduces significant resistance against piston motion during the exhaust phase, thereby detrimentally affecting the overall output performance of the PTE. This understanding underscores the necessity for further research into mitigating exhaust pressure effects to enhance expander efficiency.
To enhance intake flexibility and optimize the output performance of expansion engines, recent studies have increasingly focused on non-cam VVA systems, which primarily utilize electro-hydraulic, electro-pneumatic, and electromagnetic mechanisms [11]. These advanced systems allow for independent control of valve lift, timing, and duration through precision actuators, thereby significantly reducing throttling losses and enhancing overall energy efficiency [12]. Current research predominantly emphasizes electromagnetic VVA systems, particularly with respect to seat speed control and valve trajectory tracking [13,14]. Nonetheless, challenges such as the nonlinearity of electromagnetic forces and time delays associated with coil inductance impede response times, while the power requirements for valve actuation in these systems often surpass those of alternative VVA mechanisms. In parallel, electro-hydraulic VVA systems have gained attention [15,16], utilizing pressurized fluids for actuation. Although these systems offer more stable speed control compared to other non-cam configurations, their high fluid viscosity contributes to slower response times, complicating the precise control of low valve lift. This interplay of advantages and limitations underscores the necessity for ongoing research aimed at optimizing the performance and responsiveness of non-cam VVA systems in expansion engines.
Electro-pneumatic VVA systems present significant advantages, including rapid response times, cost-effectiveness, and environmental benefits, relative to other actuation mechanisms [17]. However, the compressibility of air introduces substantial nonlinearity, which constrains their development to an early stage. In their research, Ma et al. developed a nonlinear mathematical model for electro-pneumatic VVA systems, identifying critical parameters and designing control strategies for closed-loop tracking of valve lift and timing. Their findings revealed that at engine speeds of 1200 rpm and 5000 rpm, the actual valve lift maintained a deviation of less than 0.5 mm from the reference, with steady-state errors ranging between 0.4 mm and 1.3 mm across various lift levels [18]. Further advancing the field, Ma et al. proposed an integrated electro-pneumatic VVA system that combines hydraulic and pneumatic mechanisms, utilizing the hydraulic component to regulate valve seat speed. Simulations demonstrated a close correlation with experimental data across a spectrum of engine speeds and air pressures [19]. Similarly, Venkatesh et al. developed a camless engine incorporating an electro-pneumatic VVA system, which, through simulation studies, exhibited stable operation at speeds up to 1500 rpm, alongside notable improvements in both efficiency and performance [20]. Additionally, Srinibas et al. designed an electro-pneumatic VVA system that employed high-speed imaging techniques to accurately capture valve lift profiles, facilitating the achievement of various lift levels and enabling multi-cycle analyses of lift and speed curves [21]. Finally, Shi et al. introduced an electro-pneumatic VVA system that optimized intake valve duration to achieve an equilibrium between power output and energy efficiency, determining optimal valve lift profiles across different engine operating speeds [22]. Collectively, these advancements illustrate the potential of electro-pneumatic VVA systems in enhancing engine performance while addressing the challenges posed by air compressibility.
Electro-pneumatic systems face distinctive real-time control challenges due to the inherent compressibility of air, which introduces nonlinear response characteristics and time delays. As demonstrated in electromagnetic VVA systems, coil inductance-induced delays and force nonlinearities can impede response times exceeding 0.9 ms. In electro-pneumatic configurations, these challenges manifest as 1. pressure wave propagation delays in pneumatic circuits (typically 2–5 ms); 2. nonlinear flow–pressure relationships during valve transitions; and 3. hysteresis effects from seal friction.
The studies on camless VVA systems have validated their feasibility for applications in PTEs. Nonetheless, due to the inherent fluctuations in PTE power output and the uncertainties associated with load variations in CAES systems, the PTE encounters significant challenges in maintaining efficient operation under off-design conditions [23]. To mitigate these issues, this paper presents an innovative electro-pneumatic VVA system, accompanied by the development of its mathematical model. The valve lift curve was meticulously designed within specific operational constraints, and an orthogonal design methodology was employed to simulate and analyze the coupling effects of various valve lift parameters on system performance across a range of engine speeds. Utilizing the grey comprehensive evaluation method, optimal valve lift parameters were identified for different engine speeds, effectively balancing power output and energy efficiency. Consequently, the corresponding valve lift curves were derived, providing a comprehensive framework for enhancing the operational efficiency of the electro-pneumatic VVA system in PTE applications. This research not only contributes to the understanding of VVA dynamics but also offers practical insights into optimizing performance in variable operational contexts.

2. Mechanism and Modeling

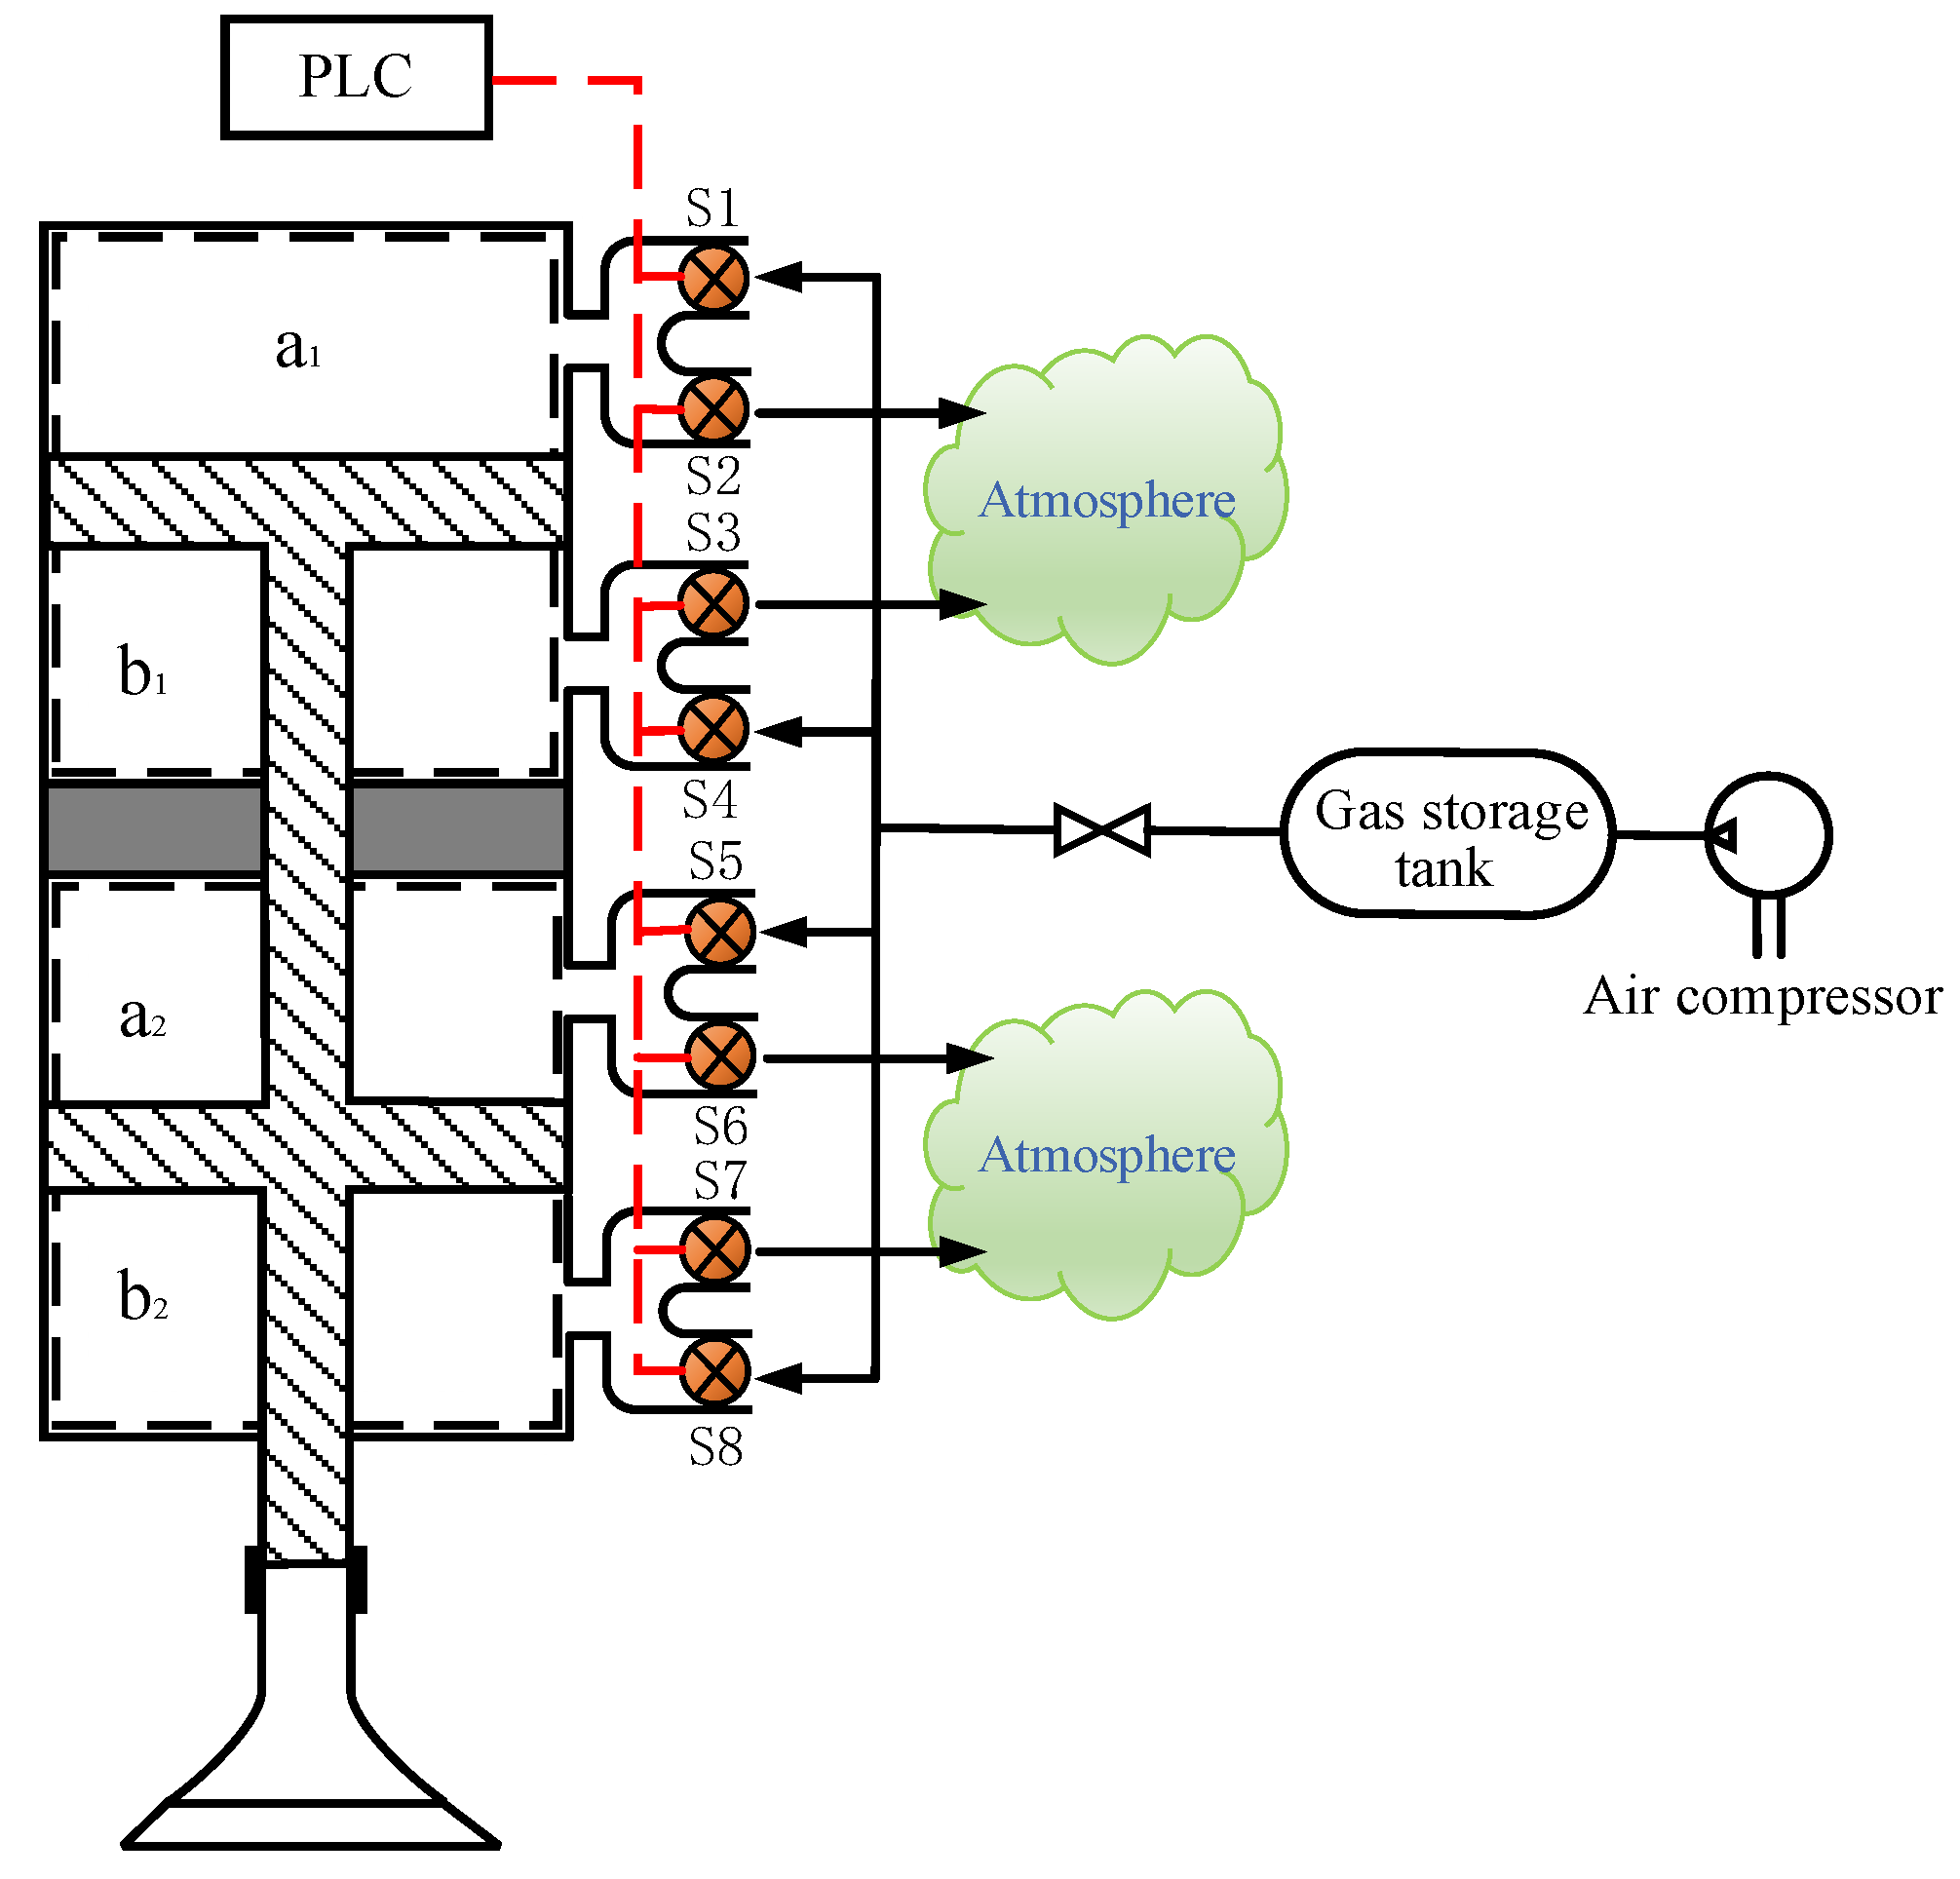
2.1. Introduction to the Electro-Pneumatic VVA System

This study introduces the design of an electro-pneumatic VVA system, as depicted in Figure 1. This system integrates a high-frequency solenoid valve electronic control mechanism with a pneumatic actuator to achieve precise valve actuation. Given the elevated in-cylinder pressures characteristic of PTEs compared to conventional engines, a higher driving force is requisite for effective valve operation. To meet this demand, a booster cylinder is employed as the pneumatic actuator, which not only delivers double the required driving force but also minimizes spatial requirements within the engine architecture. The piston rod of the booster cylinder is meticulously coupled to the valve to ensure precise axial alignment during operation. High-pressure gas, generated by the air compressor, is stored in a high-pressure tank, with a precision regulator modulating the pressure supplied to the actuator cylinder. High-frequency solenoid valves (S1–S8) are employed to control the flow of high-pressure air entering the cylinder, featuring a rated flow capacity of 100 L/min and a maximum switching frequency of 1000 Hz. The response times of these valves range from 0.4 ms to 0.9 ms, contingent upon the gas pressure. The solenoid valve’s switching frequency is regulated by pulse-width modulation signals generated by a programmable logic controller, enabling precise control. In contrast to traditional cam-based VVA systems, this electro-pneumatic configuration facilitates independent control of valve motion, thereby enhancing operational flexibility and responsiveness in varying engine conditions. This advancement not only optimizes performance but also contributes to the development of more efficient engine systems.

2.2. Mathematical Modeling of the Electro-Pneumatic VVA System

When constructing the mathematical model of the system, the following assumptions were made:
  • The working medium, compressed air, follows the ideal gas law;
  • There is no gas leakage in the system during operation;
  • The inflow and outflow of gas within the cylinder are considered quasi-steady, one-dimensional flows;
  • There is no leakage during the operation of the expander;
  • The state of the gas inside the cylinder remains uniform during operation;
  • Temperature variations inside the chamber are negligible compared to the supply air temperature
In analyzing pressure variations within the pneumatic actuator chambers, the intake chambers a 1 and a 2 are collectively designated as chamber a , while the exhaust chambers b 1 and b 2 are referred to as chamber b . The differential equations describing pressure changes in the intake and exhaust chambers are expressed as:
P a ˙ = 1 V a R T G a P a S a Z ˙
P b ˙ = 1 V b R T G b + P b S b Z ˙
where P is the chamber pressure, R is the ideal gas constant, T is the supply air temperature, V is the chamber volume, G is the mass flow rate into the chamber, S is the effective cross-sectional area of the chamber, and Z is the displacement of the piston rod.
The volume changes of the chambers can be expressed as:
V a = S a d + Z
V b = S b L d + Z
where d is the cylinder gap, and L is the cylinder stroke.
The mass flow rate equations for the gas entering each chamber can be expressed as:
G a 1 = U 1 G 1 U 2 G 2
G a 2 = U 4 G 4 U 3 G 3
G b 1 = U 5 G 5 U 6 G 6
G b 2 = U 8 G 8 U 7 G 7
where U 1 ~ U 8 is the discrete voltage inputs, and G 1 ~ G 8 is the mass flow rates through the eight valves. The mass flow rate entering the chamber is considered positive, while the mass flow rate exiting the chamber is regarded as negative.
The mass flow rate equations through the valves can be expressed as:
G i = S e p u Ψ T u
Ψ = k R 2 k + 1 k + 1 k 1 , p d p u 0.528 2 k k 1 1 R p d p u 2 k p d p u k + 1 k , p d p u > 0.528
where S e is the instantaneous effective cross-sectional area of the valve, p u is the upstream gas pressure, p d is the downstream gas pressure, T u is the temperature of the upstream air, and k is the adiabatic coefficient of air.
The motion equation of the piston within the pneumatic actuator can be expressed as:
Z ¨ = M g b Z ˙ + S a 1 P a 1 + S a 2 P a 2 S b 1 P b 1 S b 2 P b 2 F L M
where M is the mass of the piston rod, b is the viscous damping coefficient, and F L is the load driven by the piston motion, which is related to the pressure inside the cylinder.

3. Design and Optimization of the Valve Lift Curve

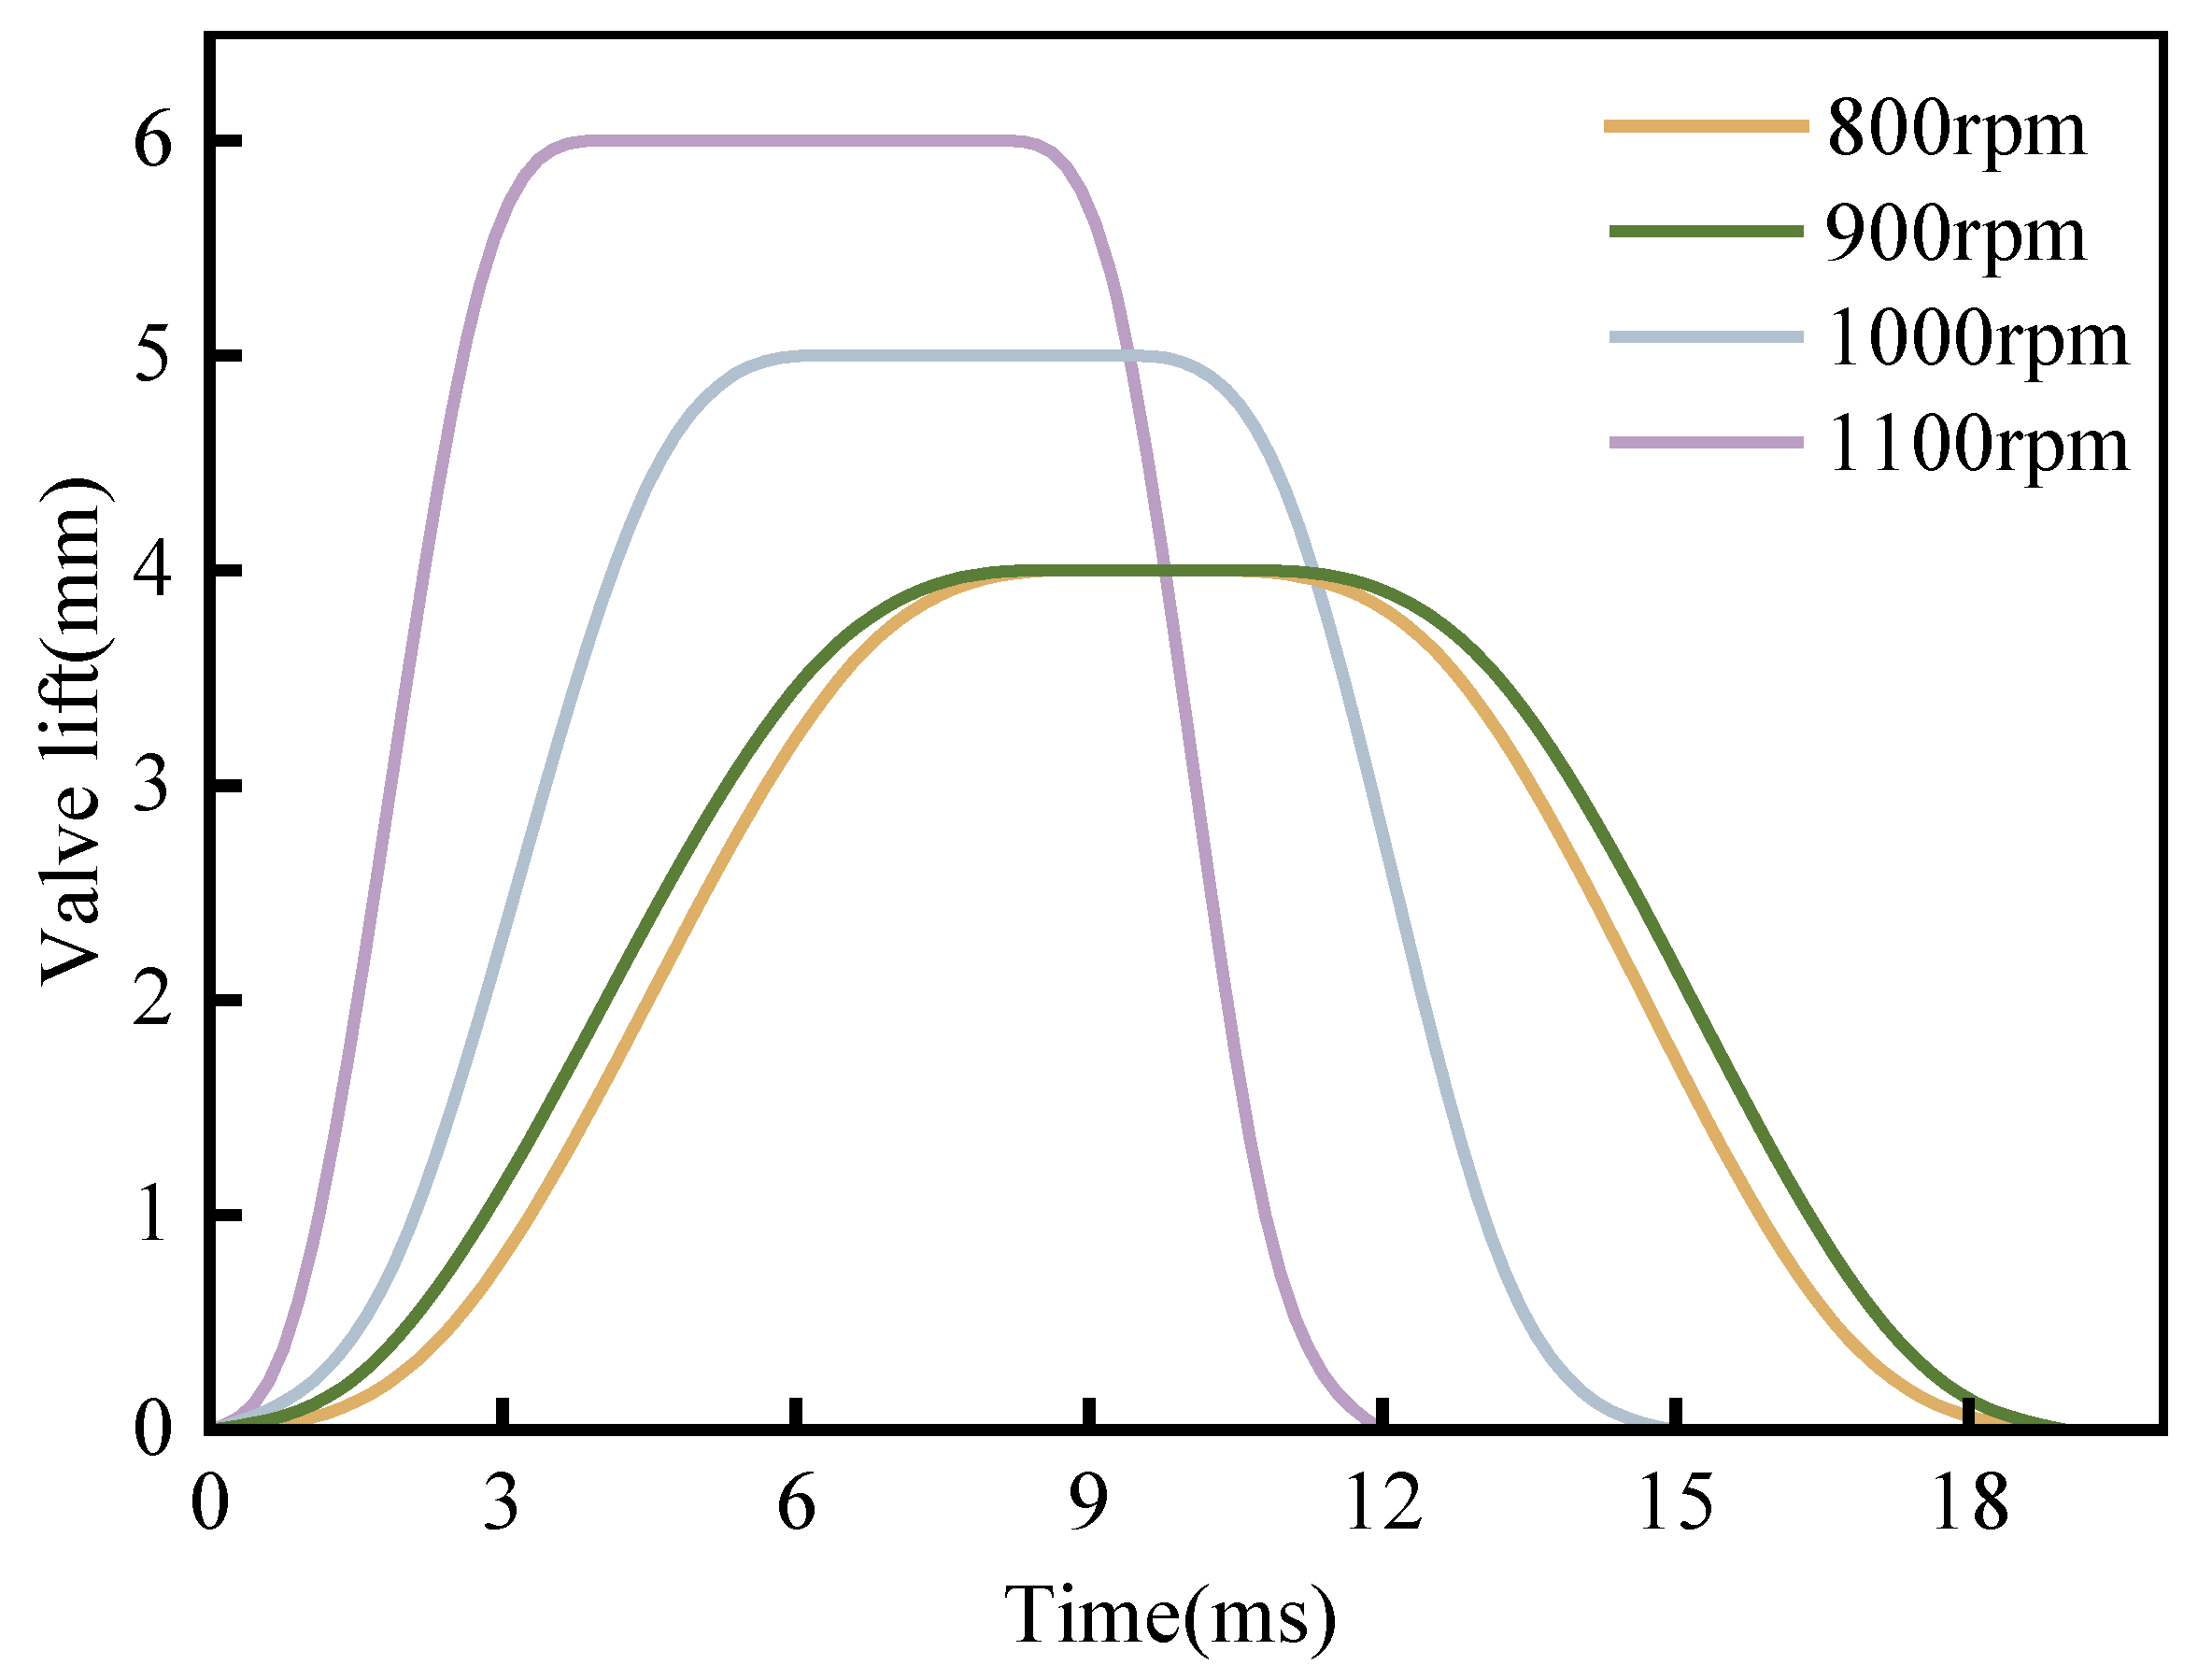
3.1. Design of the Valve Lift Curve

Under ideal conditions, the valve lift curve should be rectangular, meaning the valve should instantaneously reach its maximum lift upon opening, remain open for a certain period, and then close instantaneously. In this scenario, throttling losses are minimized, and intake efficiency is maximized. The fullness coefficient reflects the intake efficiency of the PTE. Its value can be expressed as the ratio of the area enclosed by the actual lift curve to the area of the corresponding rectangle. Without compromising the reliability and stability of the PTE, the fullness coefficient should be maximized. In practice, the optimization of the valve lift curve in PTE operation is a constrained nonlinear programming problem.
The valve lift curve can generally be divided into two segments: the rising and descending sections. To simplify the design of the valve lift curve, we assume that the designed curve is symmetrical, allowing us to derive the descending section from the rising section. During the rapid opening and closing of the valve, excessive acceleration can result in significant shocks and vibrations, leading to unstable system operation. To ensure smoother operation of the expander, the maximum valve acceleration must not exceed its allowable value, and the seating speed of the valve should also remain within permissible limits. According to the design requirements of the PTE, the following constraints must be satisfied:
a m a a a a m d a d v s = 0 v l m 1 = v l m 2 = 0 v m f v f
where a m a is the maximum allowable acceleration of the valve during motion, a m d is the maximum allowable deceleration, v s is the initial velocity of the valve, v f   is the permissible seating velocity, a a   is the allowable acceleration, a d is the allowable deceleration, v l m 1 and v l m 2 are the velocities at the end of the rising section and the beginning of the falling section, respectively, indicating the velocity when the valve reaches maximum lift, and v m f is the velocity at the end of the falling section, corresponding to the seating velocity of the valve.
When planning the trajectory of the lift curve during the ascent phase, an improved S-curve-based trajectory planning method was employed [24]. This method divides the trajectory into three phases: acceleration, constant velocity, and deceleration. The resulting velocity, acceleration, and jerk exhibit continuous changes, ensuring smooth transitions without abrupt acceleration variations.
In the acceleration phase, the jerk follows a quadratic curve. When t 0 , t 1 , the jerk reaches its maximum at t = 0 , and the jerk expression is defined as:
j t = m t 2 + n
where m and n are undetermined coefficients. By applying the integral relationships between various quantities in the motion equations, the equation of motion for the acceleration phase t [ 0 , t 1 ] is derived as:
j t = m t 2 + n a t = 1 3 m t 3 + n t v t = 1 12 m t 4 + 1 2 n t 2 + v s l t = 1 60 m t 5 + 1 6 n t 3 + v s t
During actual PTE operation, the fullness coefficient should be maximized, meaning the area enclosed by the displacement curve l t and the coordinate axis should be as large as possible. To ensure smooth PTE operation and satisfy the constraints in Equation (12), the following equation is established for the acceleration phase:
v 0 = v s v t 1 = v e a 0 = 0 a t 1 = 0 a t a = a m a
In the equation, t a [ 0 , t 1 ] , where the acceleration is at its maximum at time t a , and the jerk is equal to zero. By combining Equations (14) and (15), the values of m and n can be determined as follows:
m = 9 3 2 t 1 a m a n = 3 3 2 t 1 a m a
Substituting the solution from Equation (16) into Equation (14), the equation of motion for the acceleration phase is derived as:
a t = 3 3 a m a 2 t 1 3 t 3 + 3 3 a m a 2 t 1 t v t = 3 3 a m a 8 t 1 3 t 4 + 3 3 a m a 4 t 1 t 2 + v s l t = 3 3 a m a 40 t 1 3 t 5 + 3 a m a 4 t 1 t 3 + v s t
Similarly, the equation of motion for the constant velocity phase, where t t 1 , t 2 , is:
a t = 0 v t = v e l t = l 1 + v e ( t t 1 )
Likewise, the equation of motion for the deceleration phase, where t ( t 2 , t 3 ] , is:
a t = 3 3 a m d 2 t 3 t 2 3 t t 2 3 + 3 3 a m d 2 t 3 t 2 t t 2 v t = 3 3 a m d 8 t 3 t 2 3 t t 2 4 + 3 3 a m d 4 t 3 t 2 t t 2 2 + v e l t = l 2 3 3 a m d 40 t 3 t 2 3 t t 2 5 + 3 a m d 4 t 3 t 2 t t 2 3 + v e t t 2
In summary, the valve lift curve l u i v for the rising section can be expressed as:
l u i v = 3 3 a m a 40 t 1 3 t 5 + 3 a m a 4 t 1 t 3 + v s t ,                                                                                                             t [ 0 , t 1 ] l 1 + v e t t 1 ,                                                                                                                                                                 t ( t 1 , t 2 ] l 2 3 3 a m d 40 t 3 t 2 3 t t 2 5 + 3 a m d 4 t 3 t 2 t t 2 3 + v e t t 2 ,       t ( t 2 , t 3 ]
Similarly, the valve lift curve for the descending section can be obtained. The total valve lift curve l i v can be expressed as:
l i v = 3 3 a m a 40 t 1 3 t 5 + 3 a m a 4 t 1 t 3 + v s , t 0 , t 1 l 1 + v e t t 1 , t ( t 1 , t 2 ] l 2 3 3 a m d 40 t 3 t 2 3 t t 2 5 + 3 a m d 4 t 3 t 2 t t 2 3 + v e t t 2 , t ( t 2 , t 3 ]   l m , t ( t 3 , t 4 ) l m + 3 3 a m a 40 t 5 t 4 3 t t 4 5 3 a m a 4 t 5 t 4 t t 4 3 v s , t [ t 4 , t 5 ) l 2 v e t t 5 , t [ t 5 , t 6 ) l 1 + 3 3 a m d 40 t f t 6 3 t t 6 5 3 a m d 4 t f t 6 t t 6 3 v e t t 6 , t [ t 6 , t f ]
where l m is the maximum valve lift, and t f is the valve closing time.
According to the design requirements of PTE, based on the above equations, the time parameters t 1 , t 2 , and t 3 of the rising section can be obtained. The expressions are as follows:
t 1 = 8 3 v e v s 9 a m a t 2 = l m v e 56 3 v l m 1 v e 135 a m d v l m 1 8 3 v l m 1 v e 9 a m d 7 3 a m a 40 v e t 1 2 v s v e t 1 + t 1 t 3 = 8 3 v l m 1 v e 9 a m d + t 2
The schematic of the planned valve lift curve is shown in Figure 2.
The values t 4 , t 5 , and t 6 are related to the intake duration t c and the end time of the intake t f .

3.2. Optimization of the Valve Lift Curve

In practical applications, the output power P and energy efficiency η of the PTE are critical performance indicators. When calculating efficiency, the expansion energy of compressed air must be considered. The values of P and η can be computed using the following formulas:
P = n T o 9550
T o = T i t t
T i t = T i T d T r T L
η = P t m R T i n ln p i n p o u t
where n is the average rotational speed during stable operation, T o is the average output torque under steady conditions, T i t is the instantaneous torque, T i is the indicated torque, T r is the reciprocating torque, T L is the load torque, p i n is the intake pressure, and p o u t is the exhaust pressure.
The design parameters of the valve lift curve have a strong coupling effect on output performance. Therefore, to achieve optimal performance, it is essential to consider the influence of each design parameter. The optimization process incorporates three design parameters: maximum valve lift l m (design parameter A), intake duration t c (design parameter B), and intake closure time t f (design parameter C). Different combinations of these parameters yield varying intake volumes for a single intake cycle of the PTE. Additionally, the optimal intake volume required for PTE operation varies with different rotational speeds, necessitating different design parameter combinations for the valve lift curve.
The orthogonal design test method was introduced, and three levels were set for each design parameter of the test, and the levels of each design parameter at different rotational speeds are shown in Table 1. The impact of intake volume on the output power and efficiency of the PTE follows a similar pattern across different rotational speeds. The orthogonal design was carried out using the L 9 3 3 orthogonal table, and the orthogonal test scheme at a speed of 1000 rpm is shown in Table 2.
The design parameters of the valve lift curves in each scheme of Table 2 were input into the mathematical model and Simulink simulation model of PTE. The details of the relevant models have been described in our previously published literature [9]. The primary parameters of the PTE in the simulation model are shown in Table 3. Based on the orthogonal experiment in Table 2, the P and η of the PTE were analyzed under an intake pressure of 3 MPa at a rotational speed of 1000 rpm, with the simulation results shown in Figure 3.
The results indicate that the output power and efficiency of the PTE cannot simultaneously reach their optimal values across different experimental schemes, which is related to the variations in intake volume. At lower intake volumes, the efficiency is higher, but the output power is lower. As intake volume increases, output power also rises; however, higher intake volumes concurrently elevate the exhaust pressure within the cylinder, impeding piston work and reducing energy efficiency while also lowering output power.
To further clarify the independent effects of each design parameter on PTE performance, the results of the orthogonal experiments were analyzed using SPSS (Statistical Product and Service Solutions) statistical software. In this study, its ANOVA module was employed to calculate the range (R-value) of each design parameter’s effect. The range R of each column in the experimental results reflects the extent to which different parameters influence performance within the specified range. A larger R value indicates a greater effect of the parameter’s level change on performance, while a smaller R value signifies a lesser effect. Based on the calculations, the range analysis for output power and energy efficiency is shown in Table 4 and Table 5.
The analysis reveals that the design parameters selected within the defined range differentially impact PTE performance, with the influence on output power ranked as t c > l m > t f . Increasing the selected parameter values generally leads to greater intake volume during PTE operation, thus enhancing output power within certain limits. The impact on energy efficiency is similarly ranked as t c > l m > t f , though larger parameter values tend to diminish the efficiency of the PTE. The results indicate that optimal output power and efficiency cannot be achieved simultaneously, necessitating a comprehensive evaluation method to identify the optimal combination of design parameters based on both output power and efficiency. This study employs a grey comprehensive evaluation method to determine the optimal design parameter combinations. Orthogonal design and SPSS range analysis decouple the parameter effects. Grey relational evaluation (Equations (27)–(38)) then balances power and efficiency trade-offs. The calculation method for grey comprehensive evaluation is as follows:
Step 1: Construct the original dataset A . The original dataset comes from the output power P and energy efficiency η calculated under different combinations of design parameters of the valve lift curve, A = A i j = ( P , η ) :
A = 6 55.3 9.2 46.8 11.5 31.4 7.5 51.1 11.3 36.8 10.3 27.3 9 47.2 12 34.7 10.5 23.2
Step 2: Determine the optimal index set B . The optimal index set is derived from the original dataset, and in practice, we believe that the larger the output power and energy efficiency are, the better, so the optimal index set B consists of the maximum value of each column of the original dataset, which is denoted as B = A 01 A 02 :
B = 12 55
Step 3: Construct the original matrix C . The original matrix C consists of the original dataset and the optimal indicator set together: C = B A = A 01 A 02 A 11 A 12 A 91 A 92 .
C = 12 55.3 6 55.3 9.2 46.8 11.5 31.4 7.5 51.1 11.3 36.8 10.3 27.3 9 47.2 12 34.7 10.5 23.2
Step 4: Dimensionless processing of the original matrix. Data averaging is used, i.e., each column of the original matrix is divided by the average value of the data in that column to obtain the processed matrix D = D 01 D 02 D 11 D 12 D 91 D 92 :
D = 0.121 0.135 0.061 0.135 0.093 0.114 0.116 0.077 0.076 0.125 0.114 0.090 0.104 0.067 0.091 0.115 0.121 0.085 0.106 0.057
Step 5: Calculate the grey correlation coefficient and determine the evaluation matrix R . The grey correlation coefficient can be calculated using the following formula:
r i j = min i min j D 0 j D i j + ξ max i max j D 0 j D i j D 0 j D i j + ξ max i max j D 0 j D i j i = 9 ; j = 2
where ξ is the discrimination coefficient, generally located between 0 ~ 1 , here, take 0.5.
The evaluation matrix R for the grey correlation coefficient composition matrix is R = r 11 r 12 r 21 r 22 r 91 r 92 :
R = 0.333 1 0.517 0.65 0.857 0.402 0.4 0.796 0.811 0.464 0.638 0.364 0.5 0.661 1 0.438 0.278 0.333
Step 6: Determine the weight matrix of each evaluation index W :
W = W 1 , W 2
Here, the weights of output power and energy efficiency are calculated using the entropy weight method. Here, the information entropy can be calculated according to Equation (34), and the weights can be calculated according to Equation (35). So, W 1 = W 2 = 0.5 .
k j = 1 ln N i = 1 N P i j ln P i j .
where Pij represents the proportion of the value of the jth indicator of the ith variety to the total sum of the jth indicators of all varieties:
W j = 1 k j i = 1 N ( 1 k j )
Step 7: Calculate the grey correlation matrix E :
E = W T × R
In this case, the grey correlation of each evaluation object can be calculated according to the following formula:
e i = j = 1 2 w j × R
where E can be obtained according to the calculation:
E = 0.667 0.584 0.630 0.598 0.638 0.501 0.581 0.719 0.306
According to the calculated e i , the optimal design parameters can be determined. The larger e i represents the most in line with the expected indicators. The optimal valve lift curve design parameters and performance indexes at different speeds are shown in Table 6.
The optimal valve lift curves at different speeds are shown in Figure 4.

4. Comparative Analysis of the Performance of Non-Cam and Cam-Based Expanders

To validate the accuracy of the performance simulation for the non-cam expander, the simulated performance parameters were compared with those of the cam-based expander under identical conditions. Figure 5 and Figure 6 show the performance parameters for the non-cam simulation, cam-based simulation, and cam-based experimental results at various rotational speeds.
Figure 5 shows the higher output power of a non-cam expander compared to a cam-based expander at different speeds. Compared with the cam-based simulation, the non-cam simulation was improved by 18.37%, 11.42%, 11.62%, and 9.82%, respectively. Figure 6 shows the higher energy efficiency of a non-cam expander compared to a cam-based expander at different speeds. Compared with the cam-based simulation, the non-cam simulation is improved by 15.01%, 15.05%, 14.24%, and 13.86%, respectively, compared with the cam-based simulation at different speeds. The discrepancies between the simulation and the experiment based on the cam mechanism (as shown in Figure 5) mainly arise from the fact that during the experiment, the pressure inside the cylinder of the piston expander was higher than the simulated pressure at different rotational speeds, and more negative work was undertaken during the exhaust process, resulting in a significant difference between the experimental and simulated rotational speeds. Since the deviation was less than 8% at all rotational speeds and the non-cam simulation follows the same modeling method, this gap is within an acceptable analytical range.

5. Conclusions

In this paper, an electro-pneumatic camless VVA system is proposed, which can achieve independent and flexible control of intake and exhaust valves by switching the opening and closing states of different high-speed switching valves. The mathematical model of the electro-pneumatic VVA system is established, and the valve lift curve based on this VVA system is designed. Under different rotational speeds, the orthogonal test method was used to consider the influence of different combinations of valve lift curve design parameters on the performance of PTE, and the degree of independent influence of different design parameters on the performance of PTE was analyzed. Using the grey comprehensive evaluation method, the optimal valve lift curve design parameter combinations based on the output power and energy efficiency were optimally obtained under different rotational speeds, and the optimal valve lift curve was obtained. The following conclusions can be drawn:
(1)
Under certain constraints, the valve lift curve involved in the improved S-curve-based trajectory planning method has a high coefficient of fecundity.
(2)
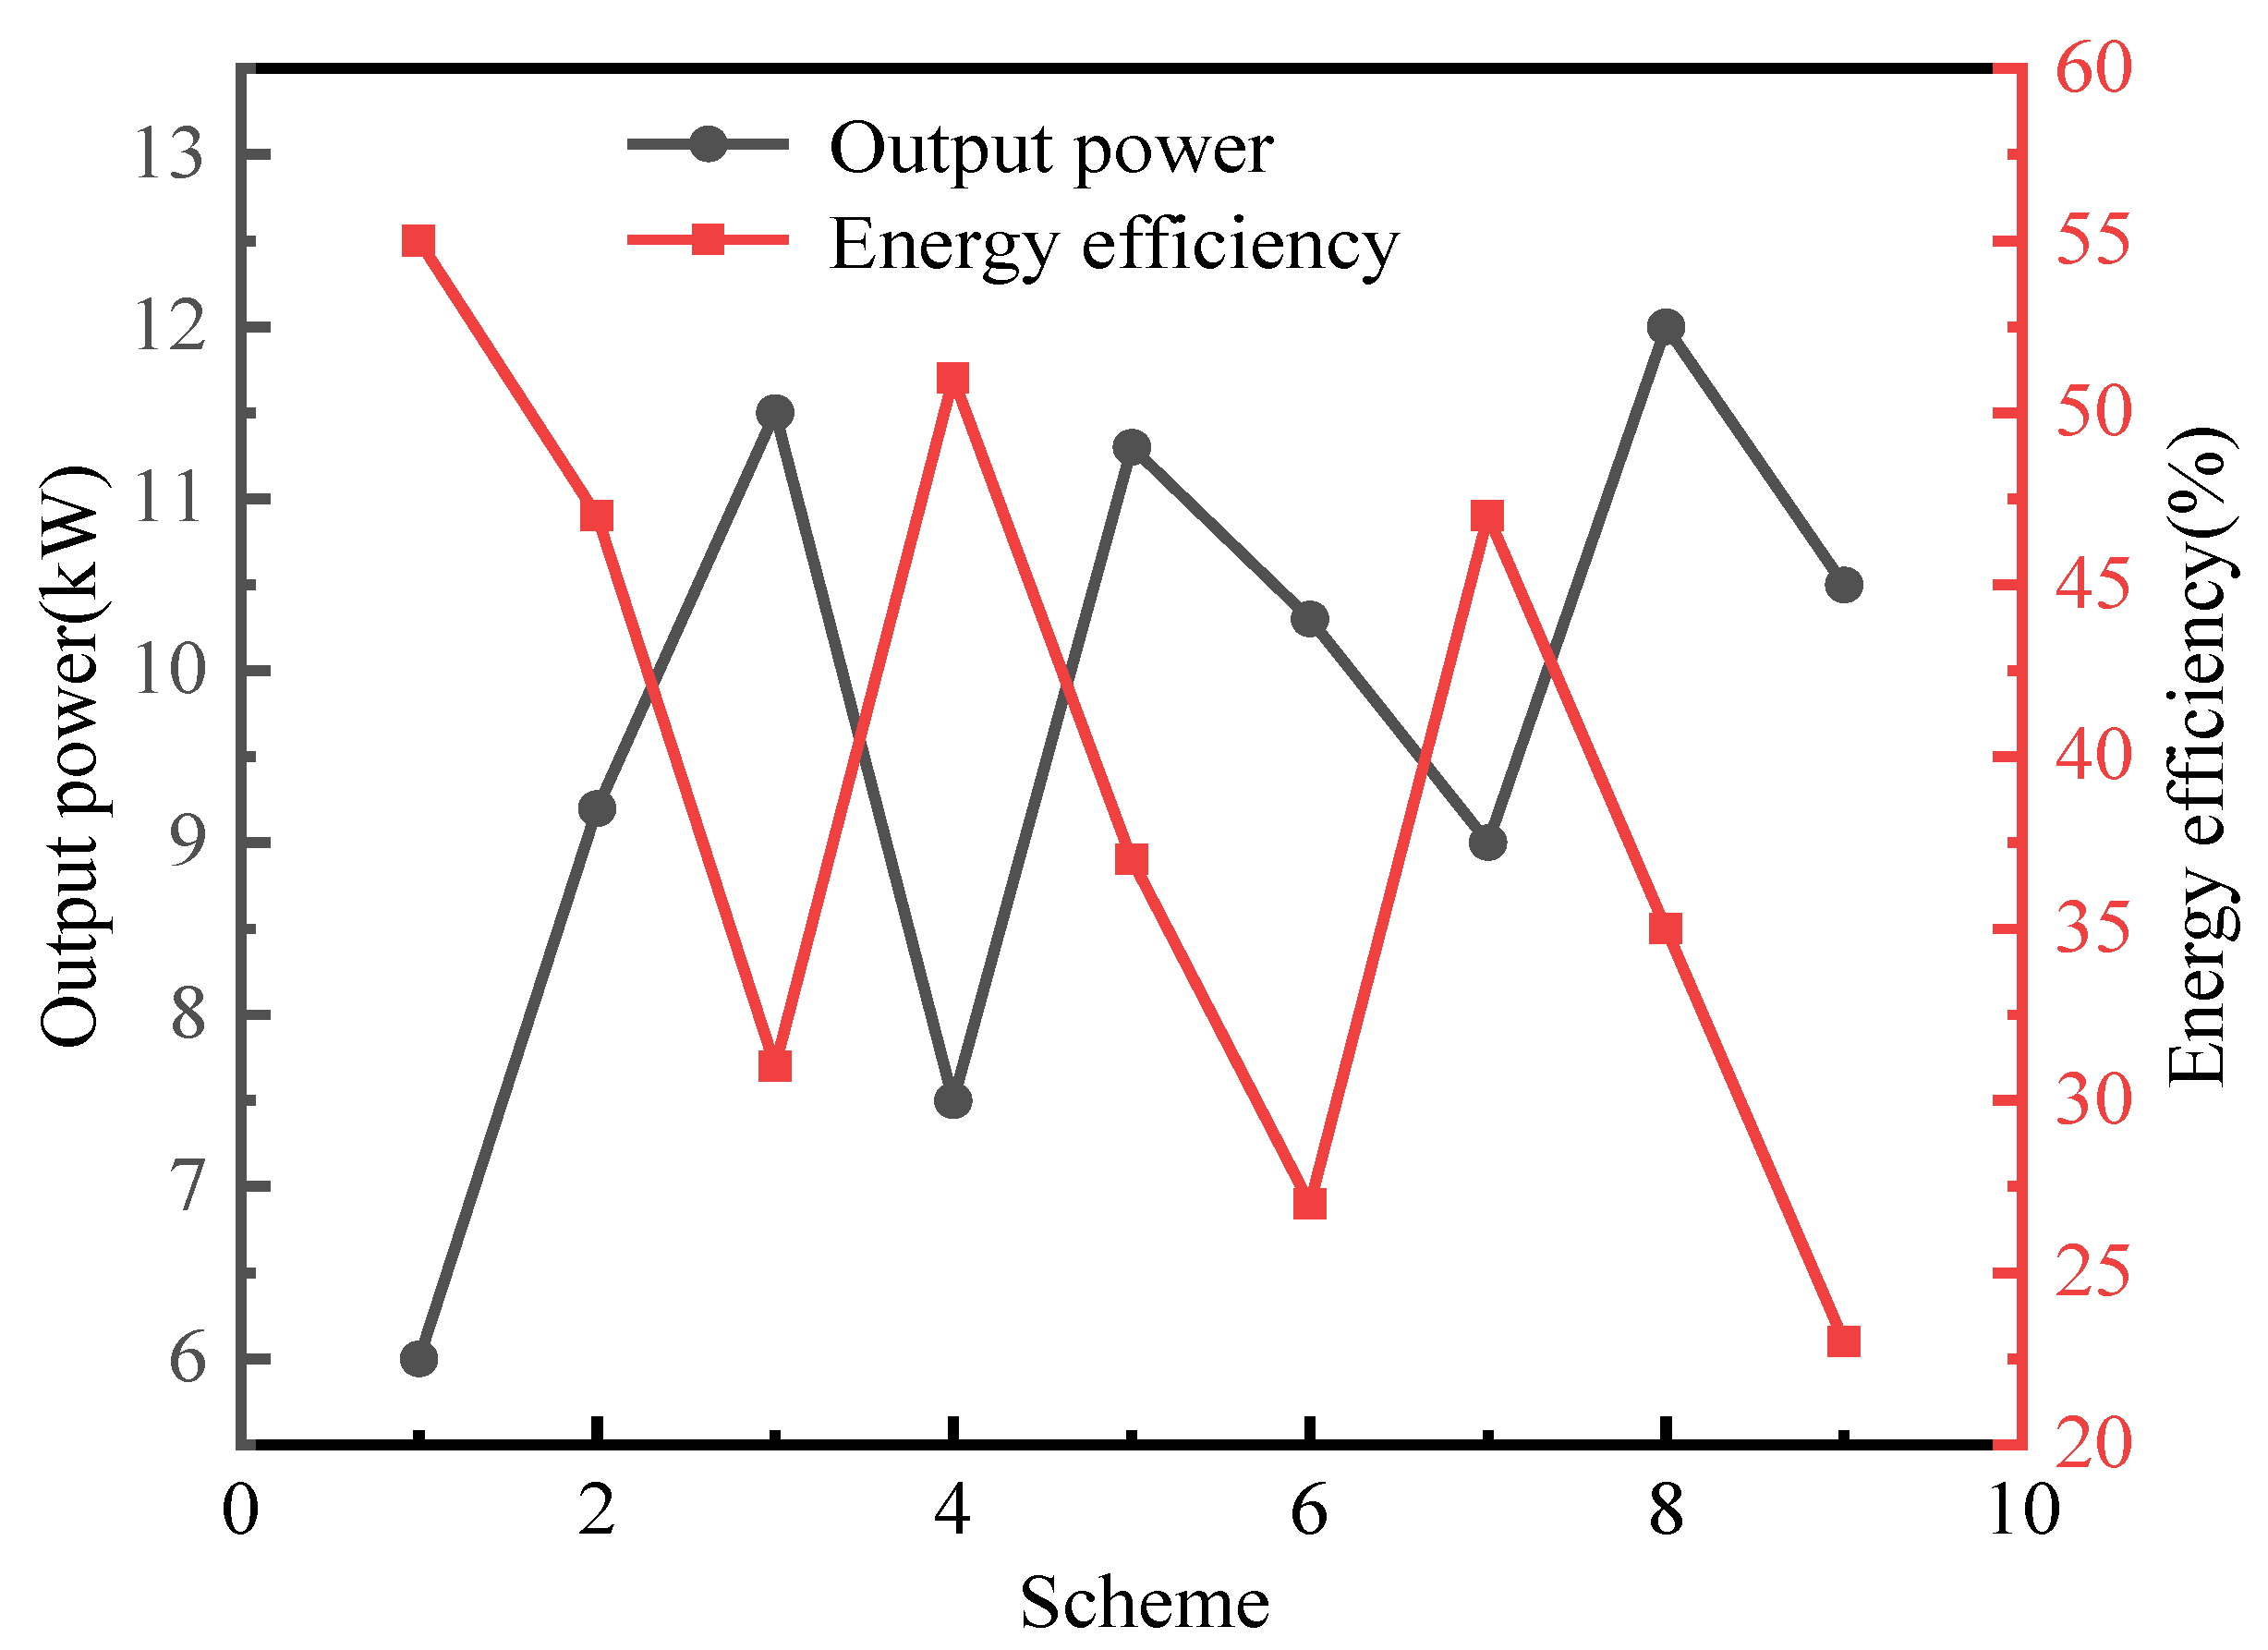
The degree of influence of different valve lift curve design parameters on the output power is t c > l m > t f . The larger the value of the selected parameter, the larger the intake air volume during PTE operation, which will increase the output power. The degree of influence of each parameter on energy efficiency is also t c > l m > t f . However, the larger the value of the selected parameter, the greater the energy efficiency of the PTE will be reduced.
(3)
Different combinations of parameters for the design of the optimal valve lift curve at different speeds. At 800 rpm, the optimal design parameter combination results in an output power of 7.12 kW and an energy efficiency of 53.5%. At 900 rpm, the optimal combination of design parameters results in an output power of 8.17 kW and an energy efficiency of 50.6%. At 1000 rpm, the optimum combination of design parameters results in an output power of 9.2 kW, with an energy efficiency of 46.8%. At 1100 rpm, the optimum combination of design parameters results in an output power of 12.09 kW with an energy efficiency of 41.2%.
(4)
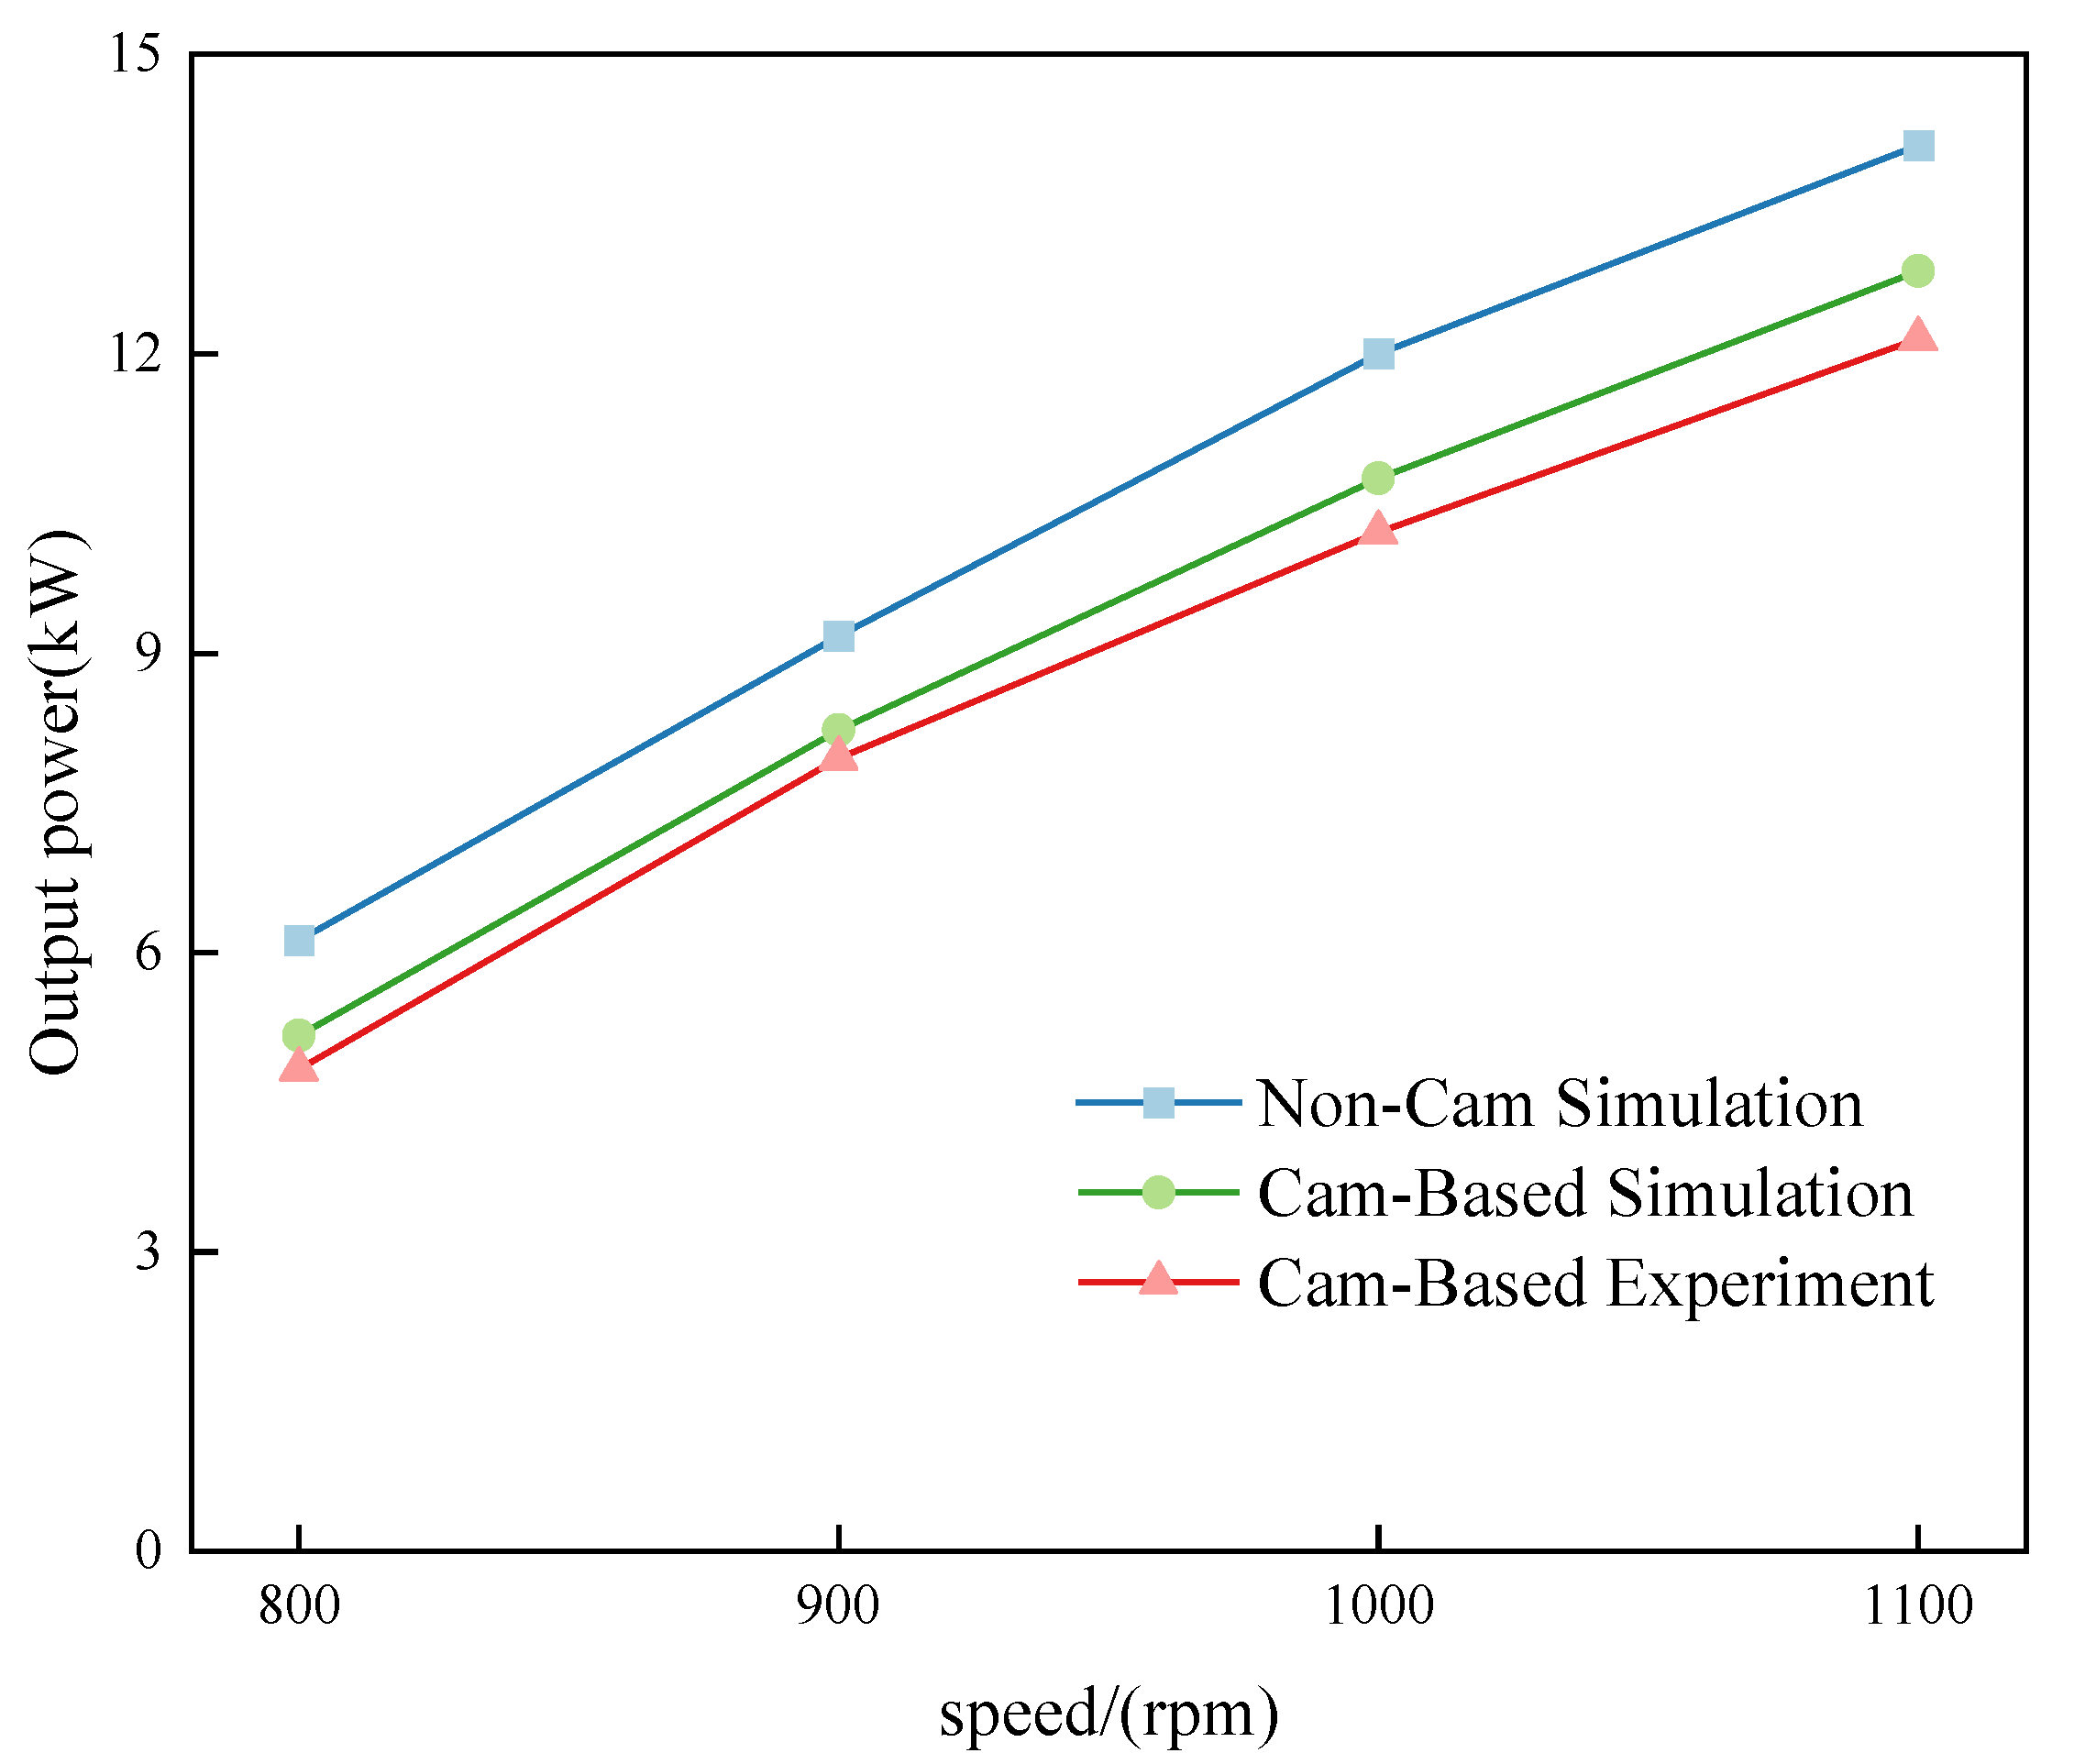
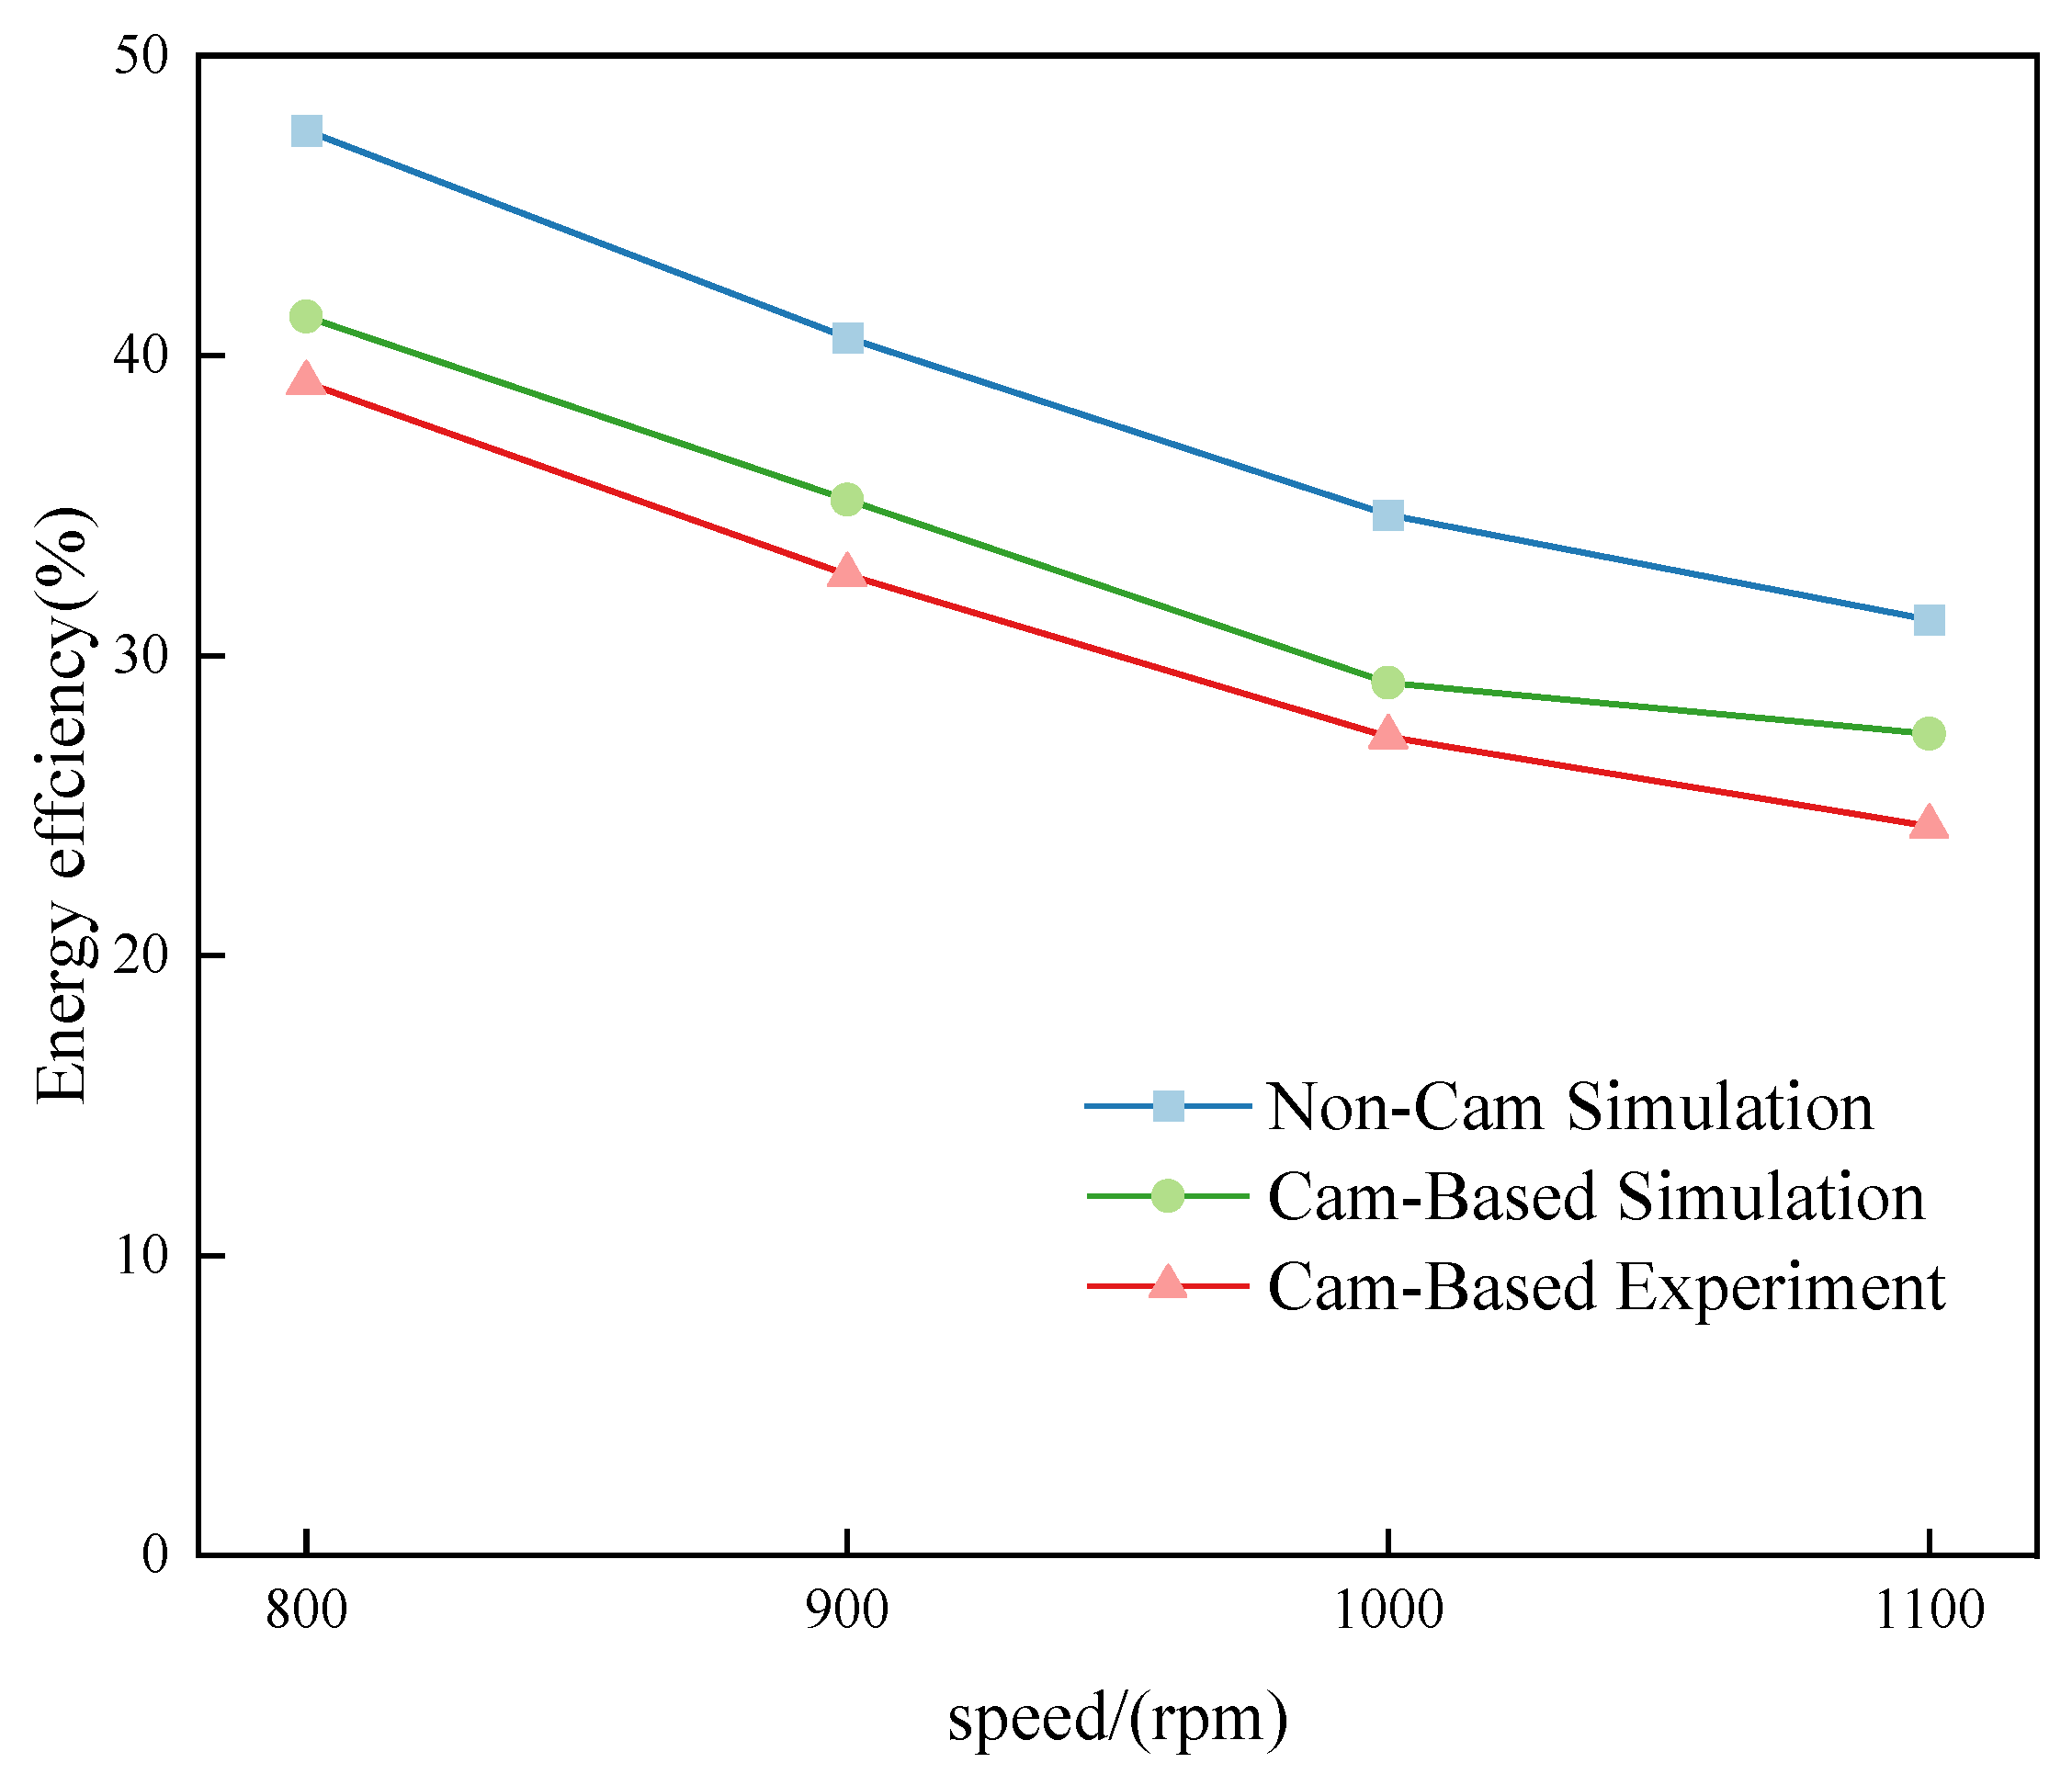
The output performance of a non-cam expander is better than that of a cam-based piston expander at different speeds. Through simulation comparison, the output power increased by 18.37%, 11.42%, 11.62%, and 9.82%, respectively, at different speeds. Energy efficiency improved by 15.01%, 15.05%, 14.24%, and 13.86%.
This study provides a theoretical basis for the design and optimization of the valve lift curves of non-cam PTEs at different speeds, and the next study will focus on the precise tracking control of the valve lift curves as well as the experimental study in order to comprehensively improve the performance of the PTE.

Author Contributions

Methodology, Z.H.; Software, R.Q.; Validation, X.H.; Writing—original draft, Y.S.; Writing—review & editing, Q.Y. All authors reviewed the manuscript. All authors have read and agreed to the published version of the manuscript.

Funding

The research work presented in this paper is financially supported by a grant (52465008) from the National Natural Science Foundation and a grant (2024QN05042) from the Inner Mongolia Autonomous Region Natural Science Foundation. The authors also acknowledge support from the Basic Scientific Research Fund Project of Universities Directly Under the Jurisdiction of the Inner Mongolia Autonomous Region through grant 2024QNJS070.

Institutional Review Board Statement

Not applicable.

Informed Consent Statement

Not applicable.

Data Availability Statement

Our study did not include any individual person’s data, images, or videos. Data are available on request from the authors.

Conflicts of Interest

All the authors certify that they have no affiliations with or involvement in any organization or entity with any financial interest or nonfinancial interest in the subject matter or materials discussed in this manuscript.

References

  1. Wu, Y. New energy storage enters large-scale development period. People’s Daily of China, 18 March 2024.
  2. Sun, X.; Gui, Z.; Zhang, X.; Li, Y.; Li, X.; Xu, Y.; Chen, H. Research progress on compressed air energy storage coupled with renewable energy. Chin. J. Electr. Eng. 2023, 43, 9224–9242. [Google Scholar]
  3. Lu, Y.; Xu, W. Analysis of frequency characteristics of compressed air energy storage for power generation. Hydraul. Pneum. 2024, 48, 124–130. [Google Scholar]
  4. Minutillo, M.; Lavadera, A.; Jannelli, E. Assessment of design and operating parameters for a small compressed air energy storage system integrated with a standalone renewable power plant. J. Energy Storage 2015, 4, 135–144. [Google Scholar] [CrossRef]
  5. Li, S.; Dai, Y. Design and simulation analysis of a small-scale compressed air energy storage system directly driven by vertical axis wind turbine for isolated areas. Energy Eng. 2015, 141, 4014032. [Google Scholar] [CrossRef]
  6. Farzaneh-Gord, M.; Izadi, S.; Pishbin, S.I.; Sheikhani, H.; Deymi-Dashtebayaz, M. Thermodynamic analysis of medium pressure reciprocating natural gas expansion engines. Pol. J. Chem. Technol. 2015, 17, 119–125. [Google Scholar] [CrossRef]
  7. He, W.; Wang, J. Optimal selection of air expansion machine in Compressed air energy storage: A review. Renew. Sustain. Energy Rev. 2018, 87, 77–95. [Google Scholar] [CrossRef]
  8. Olivier, D.; Antoine, P.; Remi, D.; Vincent, L. Experimental investigation and optimal performance assessment of four volumetric expanders (scroll, screw piston, and roots) tested in a small-scale organic Rankine cycle system. Energy 2018, 165, 1119–1127. [Google Scholar] [CrossRef]
  9. Yu, Q.; Li, X.; Li, X. Performance analysis and experimental verification of piston expander. Hydraul. Pneum. 2022, 46, 34–43. [Google Scholar]
  10. Xu, Q.; Cai, M.; Yu, Q. Multi-parameter and multi-objective optimisation method for pneumatic engines. J. Beijing Univ. Aeronaut. Astronaut. 2013, 39, 803–807. [Google Scholar]
  11. Hannibal, W.; Flierl, R.; Stiegler, L.; Meyer, R. Overview of Current Continuously Variable Valve Lift Systems for Fourstroke Spark-Ignition Engines and the Criteria for Their Design Ratings; SAE Technical Papers: Detroit, MI, USA, 2004. [Google Scholar]
  12. Fan, X.; Chang, S.; Lu, J.; Liu, L.; Yao, S.; Xiao, M. Energy consumption investigation of electromagnetic valve train at gas pressure conditions. Appl. Therm. Eng. 2019, 146, 768–774. [Google Scholar] [CrossRef]
  13. Dimitrova, Z.; Tari, M.; Lanusse, P.; Aioun, F.; Moreau, X. Robust control for an electromagnetic actuator for a camless engine. Mechatronics 2019, 57, 109–128. [Google Scholar] [CrossRef]
  14. Yang, X.; Liang, K. Measurement and modelling of a linear electromagnetic actuator driven camless valve train for spark ignition IC engines under full load condition. Mechatronics 2021, 77, 102604. [Google Scholar] [CrossRef]
  15. Du, Q.; Zhang, Z.; Zhao, C. Dynamic characteristic test of camless electro-hydraulic variable valve train. J. Intern. Combust. Engine 2023, 41, 271–279. [Google Scholar]
  16. Zhang, S.; Zhao, Z.; Zhao, C.; Zhang, F.; Wang, S. Development and validation of electro-hydraulic camless free-piston engine. Appl. Therm. Eng. 2016, 102, 1197–1205. [Google Scholar] [CrossRef]
  17. Watson, J.; Wakeman, R. Simulation of a Pneumatic Valve Actuation System for Internal Combustion Engine; SAE Technical Paper: Detroit, MI, USA, 2005. [Google Scholar] [CrossRef]
  18. Ma, J.; Stuecken, T.; Schock, H. Model Reference Adaptive Control of a Pneumatic Valve Actuator for Infinitely Variable Valve Timing and Lift; SAE Technical Paper: Detroit, MI, USA, 2007. [Google Scholar] [CrossRef]
  19. Ma, J.; Zhu, G.; Schock, H. A Dynamic Model of an Electropneumatic Valve Actuator for Internal Combustion Engines. J. Dyn. Syst. Meas. Control. 2010, 132, 021007. [Google Scholar] [CrossRef]
  20. Venkatesh, D.; Selvakumar, A. A Novel Design of Pneumatic Actuator for Camless Engines; SAE Technical Paper: Detroit, MI, USA, 2016. [Google Scholar] [CrossRef]
  21. Tripathy, S.; Das, A.; Sahu, B.; Srivastava, D.K. Electro-pneumatic variable valve actuation system for camless engine: Part I—development and characterization. Energy 2020, 193, 116740. [Google Scholar] [CrossRef]
  22. Shi, Y.; Yu, Q.; Sun, G.; Li, X. Intake Valve Profile Optimization for a Piston-Type Expander Based on Load. Process 2023, 11, 843. [Google Scholar] [CrossRef]
  23. Yu, Q.; Hao, X.; Tan, X. Comparative study on air distribution system for piston-type compressed air engine. Adv. Mech. Eng. 2017, 9, 1687814017697625. [Google Scholar] [CrossRef]
  24. Liu, Y.; Hu, B.; Zhang, H.; Guo, Q.; Zhang, Y.; Ll, H. Optimisation study of motion control trajectory of loading and unloading robot for CNC machine tools. Meas. Control. Technol. 2021, 40, 32–38. [Google Scholar]
Figure 1. Schematic diagram of the non-cam VVA system.
Fluids 10 00204 g001
Figure 2. Schematic diagram of the planned valve lift curve.
Fluids 10 00204 g002
Figure 3. Output power and energy efficiency under different schemes.
Fluids 10 00204 g003
Figure 4. Optimal valve lift curves at different speeds.
Fluids 10 00204 g004
Figure 5. Comparison of output power at different speeds.
Fluids 10 00204 g005
Figure 6. Comparison of energy efficiency at different speeds.
Fluids 10 00204 g006
Table 1. Design parameter levels at different rotational speeds.
Speed (rpm)SchemeParameter A (mm)Parameter B (ms)Parameter C (ms)
80013219
24322
35425
90013216
24319
35422
100014315
25418
36521
110015412
26515
37618
Table 2. Orthogonal test scheme for the design parameters at 1000 rpm.
SchemeParameter A (mm)Parameter B (ms)Parameter C (ms)
14315
24418
34521
45318
55421
65515
76321
86415
96518
Table 3. Primary structural parameters of PTE.
ParameterValue
Cylinder diameter (mm)0.085
Cylinder stroke (m)0.088
Crank radius (m)0.044
Connecting rod length (m)0.139
Clearance volume (m3)3.97 × 10⁻⁵
Piston ring thickness (m)0.0014
Piston mass (kg)1.011
Inlet and exhaust valve area (mm2)74.61
Table 4. Range analysis based on output power.
ParameterParameter AParameter BParameter C
K 1 8.97.59.33
K 2 9.710.839.07
K 3 10.510.7710.6
R1.63.331.53
Note: K is the sum of the indicators at each level for each design parameter in the same units as the indicators. 1, 2, and 3 are the three levels for each parameter.
Table 5. Range analysis based on energy efficiency.
ParameterParameter AParameter BParameter C
K 1 44.335139
K 2 38.3339.6740.33
K 3 352738.33
R9.33242
Table 6. Optimal parameter combinations and performance indexes at different speeds.
Speed (rpm)P (kW)η (%) l m  (mm) t c  (ms) t f  (ms)
8006.1247.54219
9009.1740.64319
10001234.75415
110014.0931.26412
Disclaimer/Publisher’s Note: The statements, opinions and data contained in all publications are solely those of the individual author(s) and contributor(s) and not of MDPI and/or the editor(s). MDPI and/or the editor(s) disclaim responsibility for any injury to people or property resulting from any ideas, methods, instructions or products referred to in the content.

