
Heat Transfer Characteristics of Thermosyphons Used in Vacuum Water Heaters


Abstract
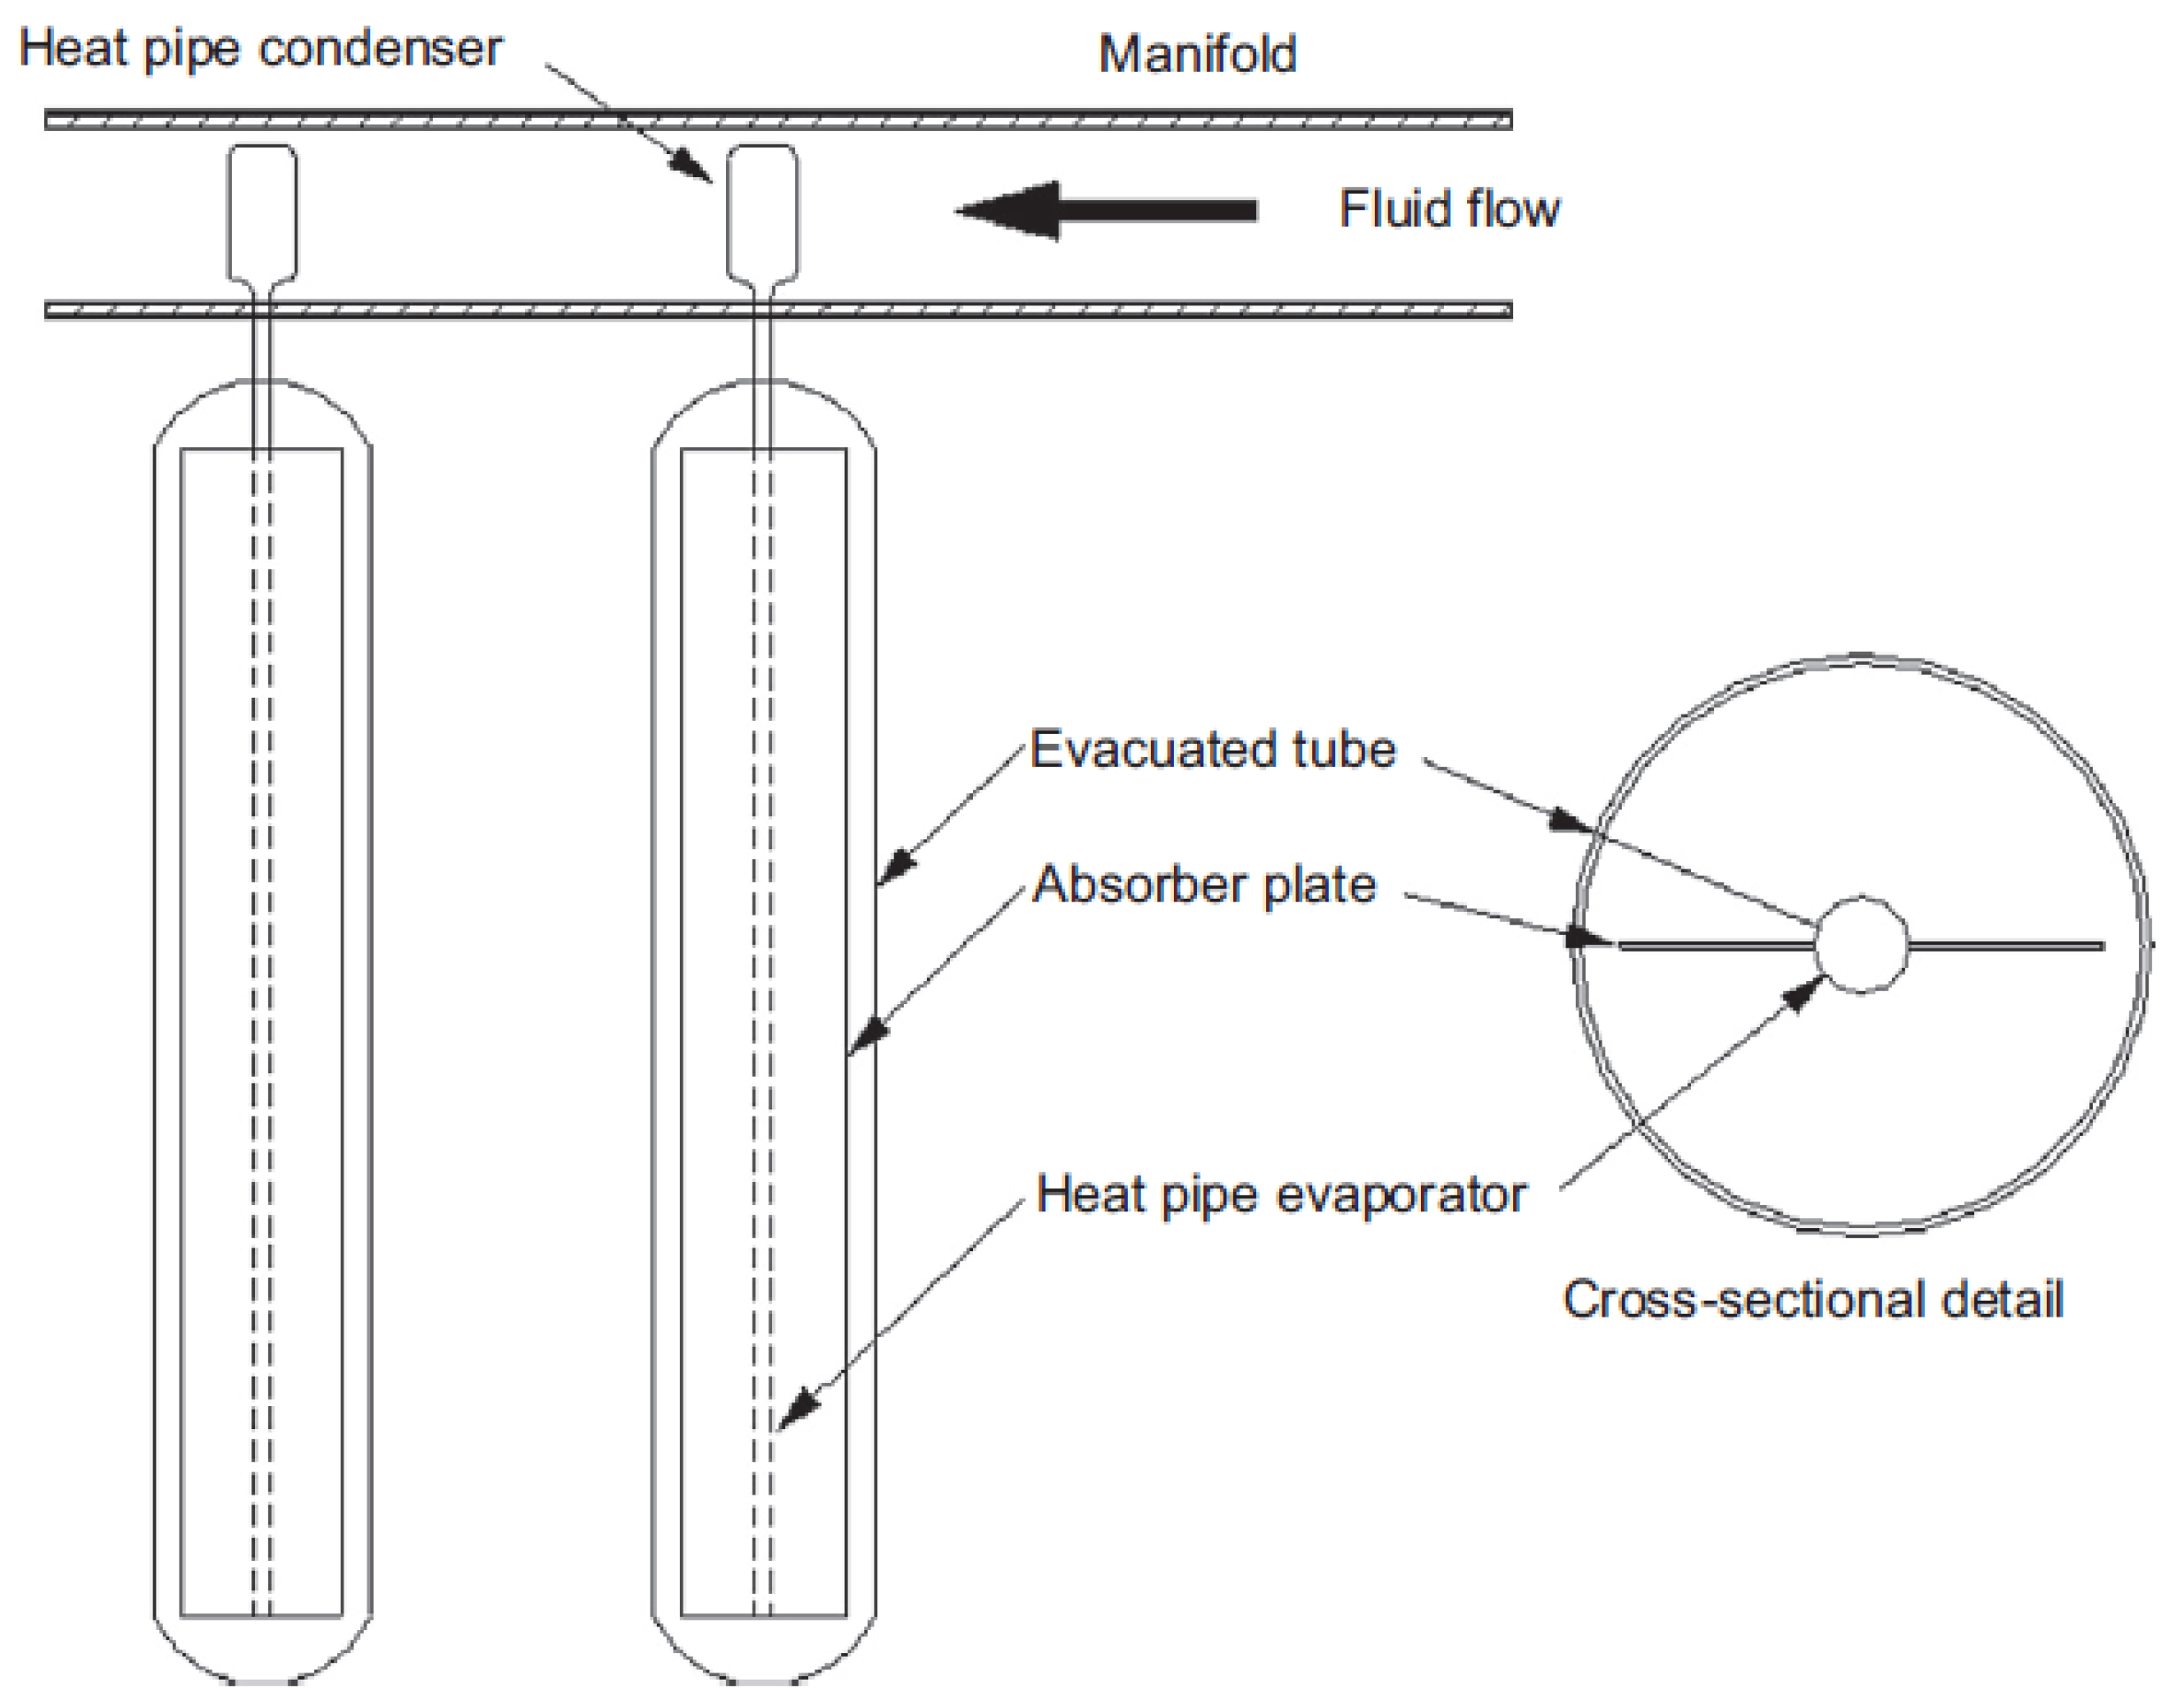
1. Introduction
2. The Thermosyphon Simulation Model
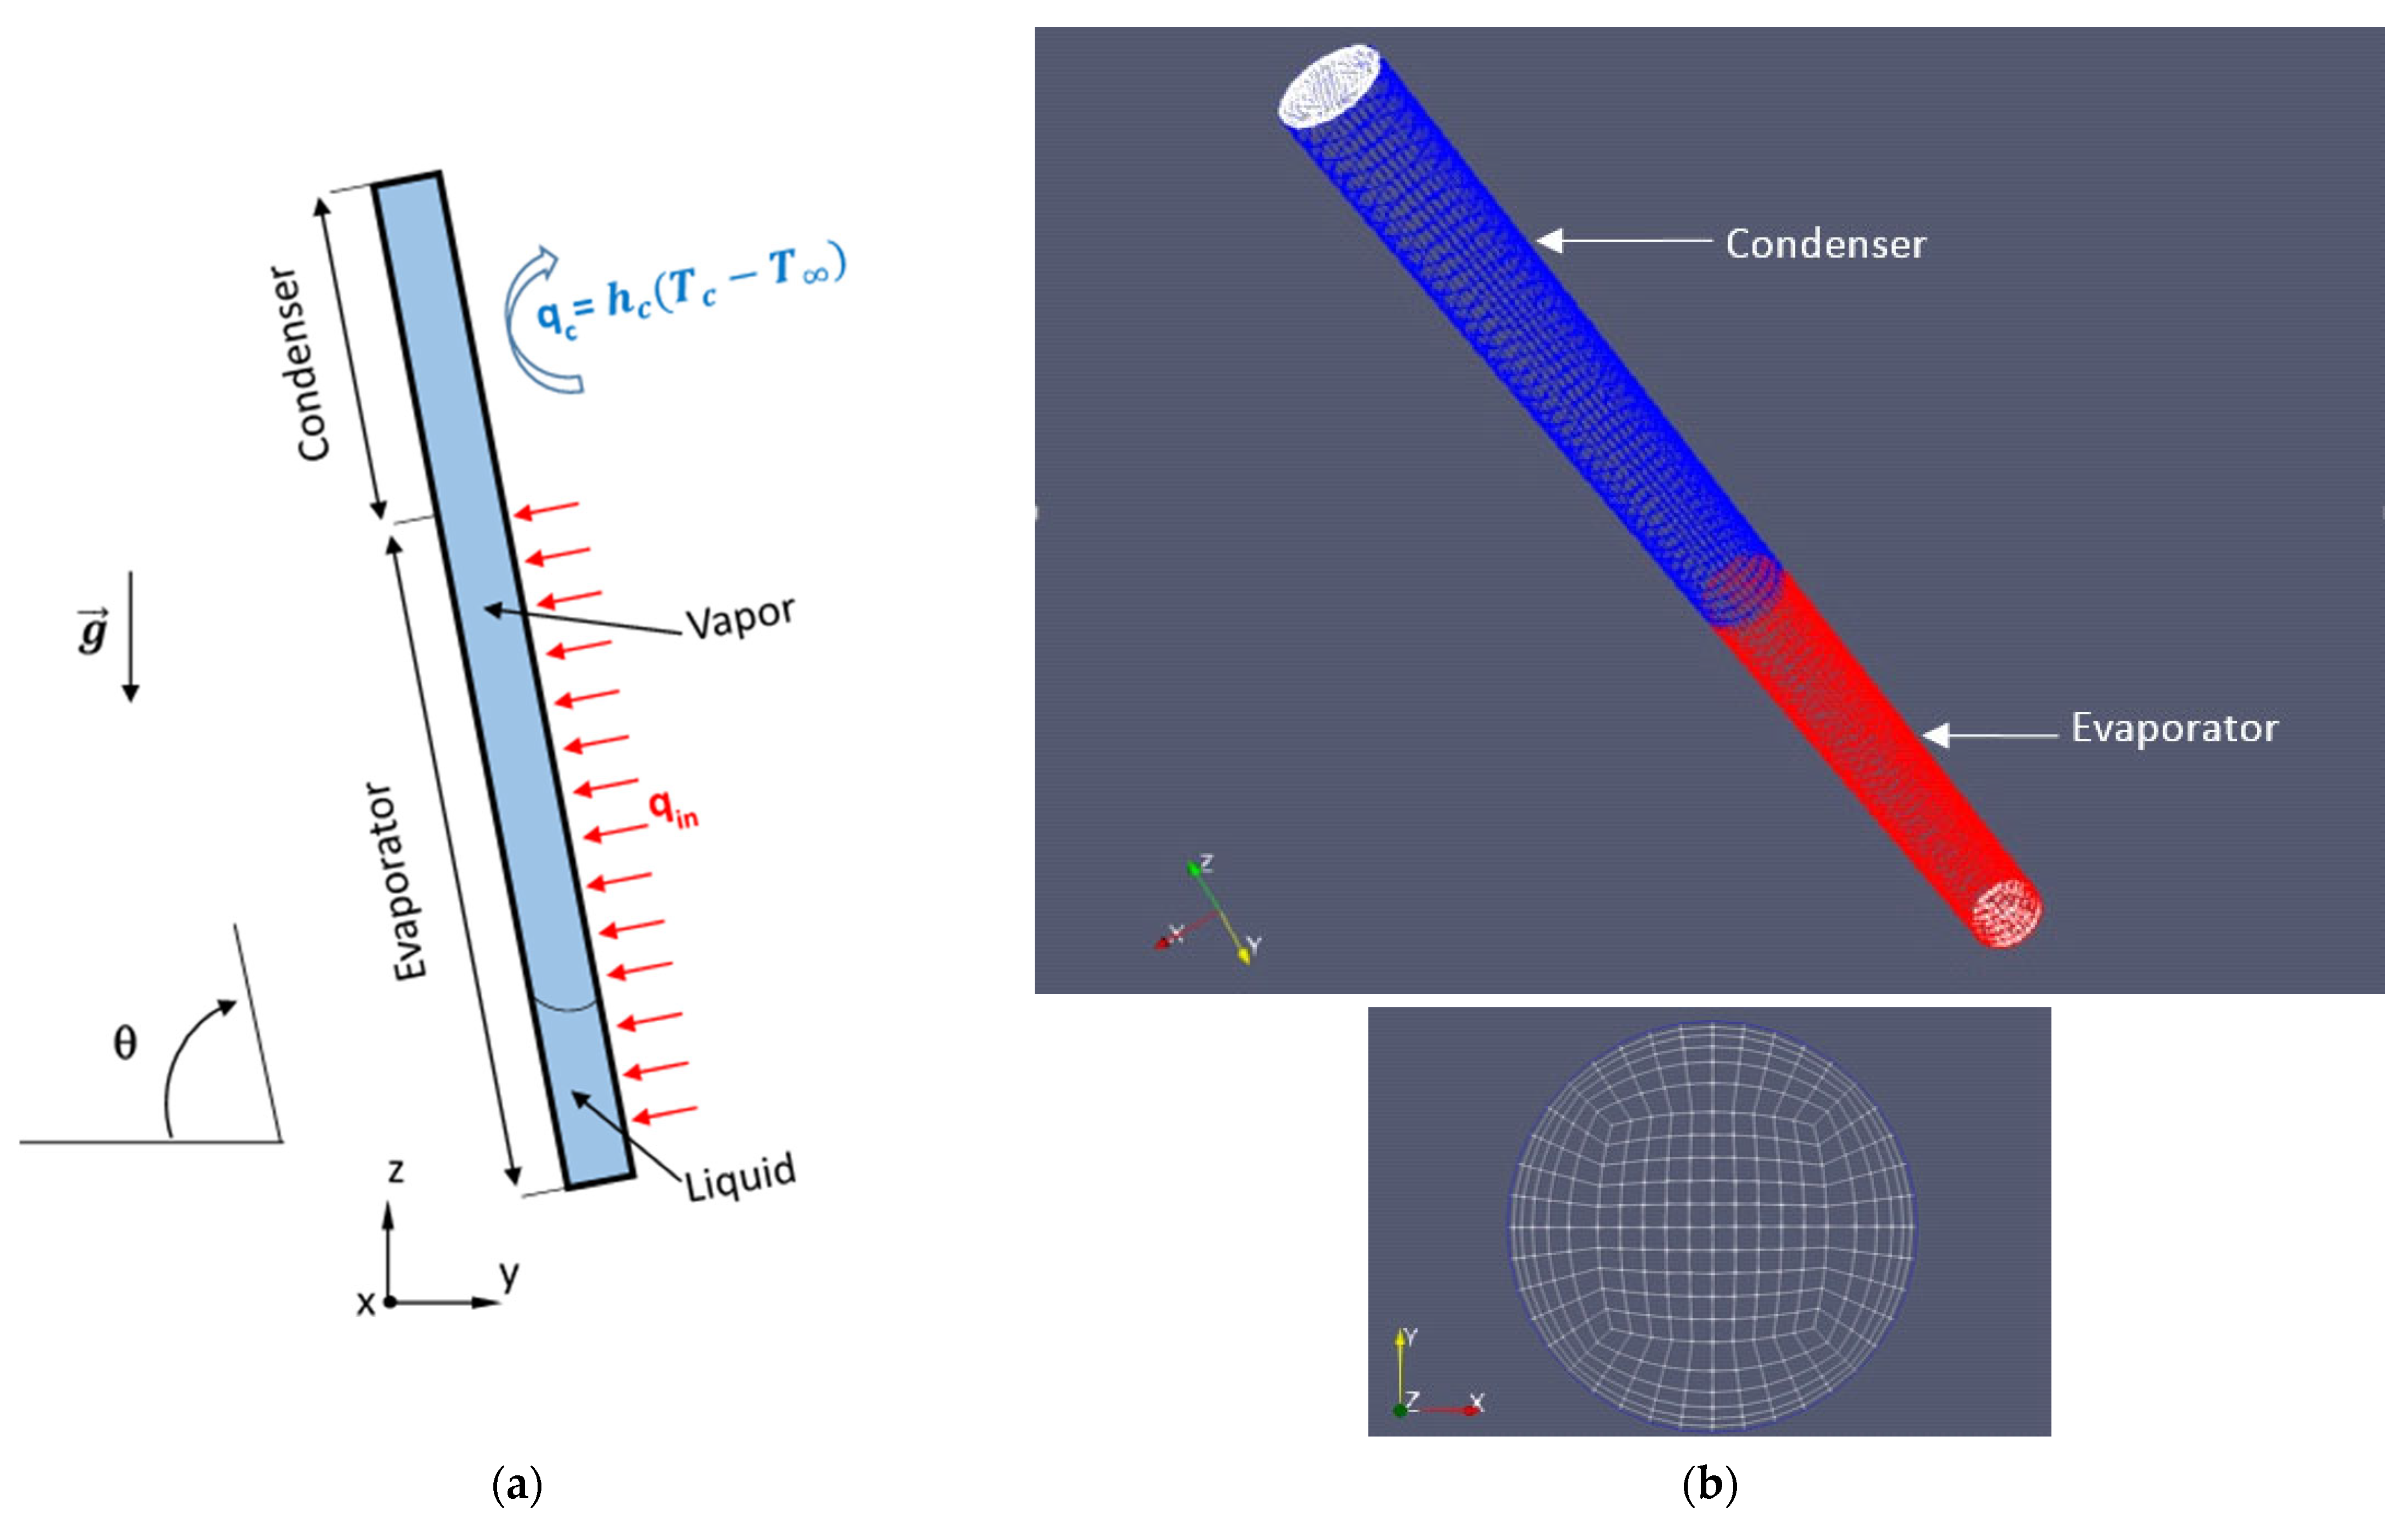
2.1. The Simulation Model
2.2. The Governing Equations
- -
- The vapor phase is considered as an ideal gas;
- -
- The liquid flow is incompressible;
- -
- The liquid–vapor phase change consists of nucleate boiling;
- -
- The liquid–vapor interface is considered locally in thermal and thermodynamic equilibrium even during the phase change process.
- -
- The continuity equation:
- -
- The momentum conservation equation:
- -
- The energy conservation equation:
- -
- For evaporation:
- -
- For condensation:
2.3. The Initial and Boundary Conditions
- -
- The evaporator is liquid-filled according to the experimental filling ratio (48%): = 1 for all the cells involving only the liquid phase (the liquid pool at the TPCT bottom). To ensure the stability of the numerical solution at the first simulation time steps, a 0.5 mm thin film along the TPCT internal wall is set along the TPCT internal wall. = 0 for all the remaining domain (filled with saturated vapor).
- -
- The temperature T is set, according to the experimental data [8], at the expected operating temperature value (≈Tsat).
- -
- The pressure is equal to the saturation pressure (Psat), which can be locally obtained from Equation (18).
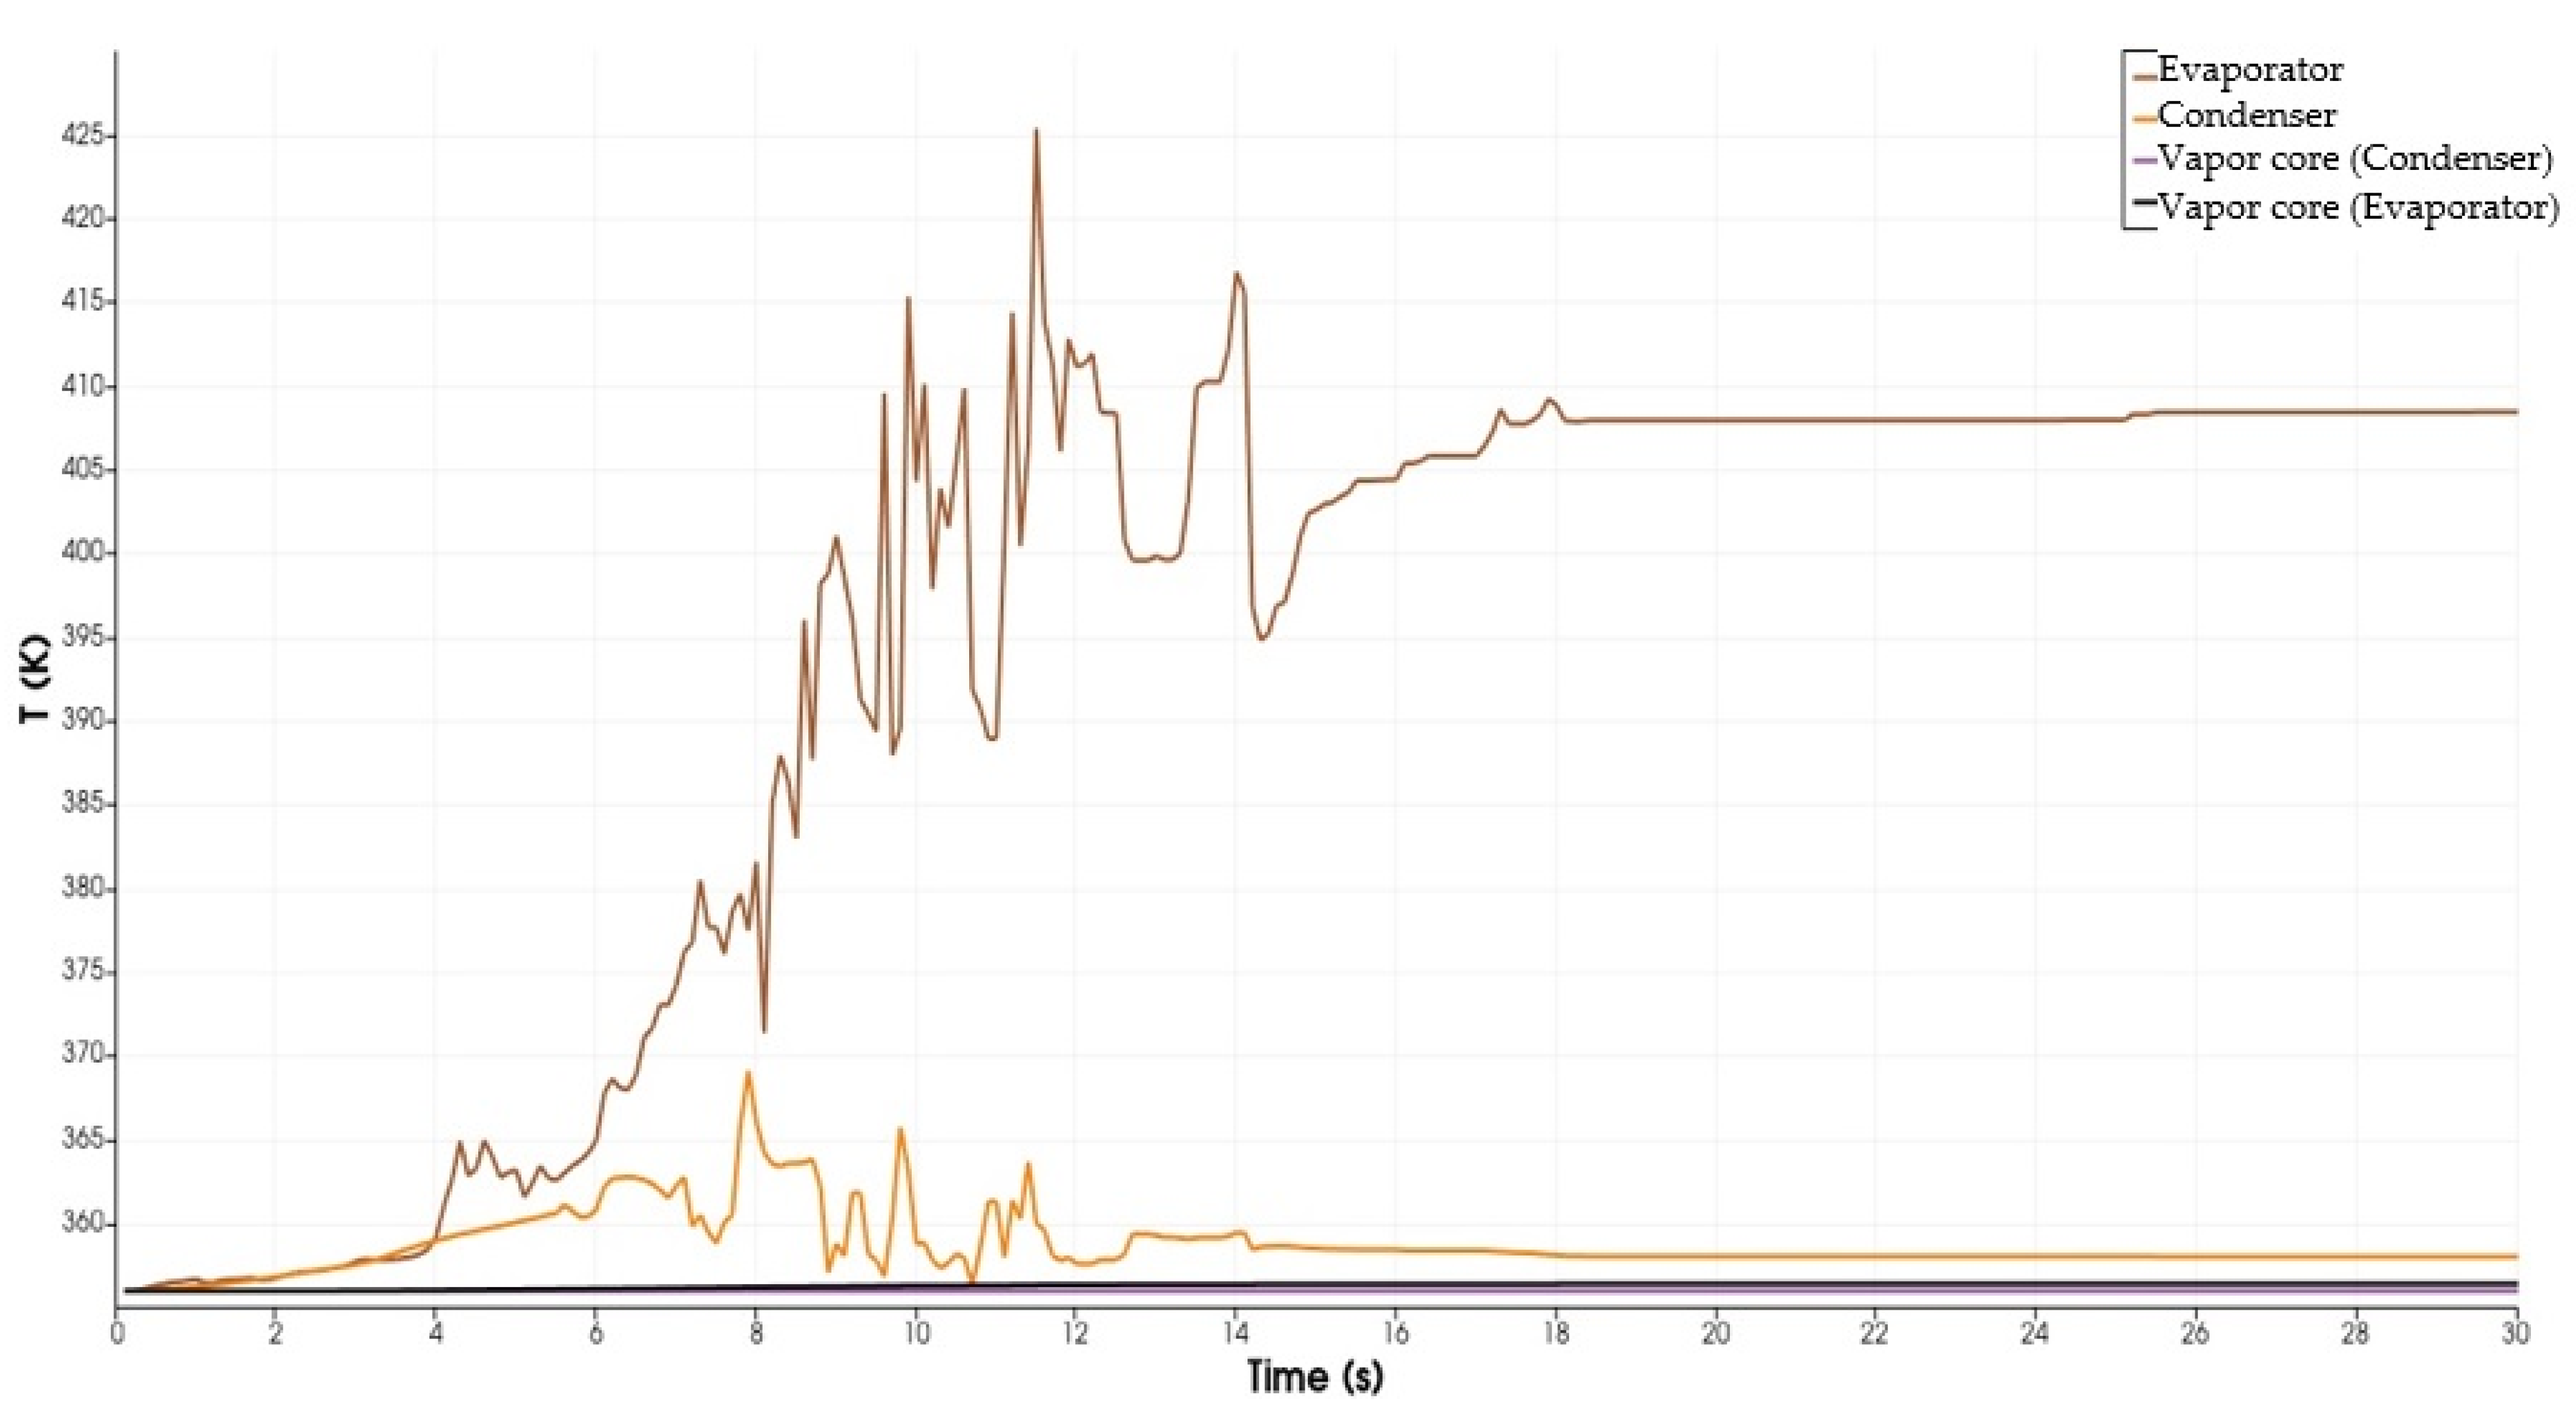
2.4. The Numerical Solution and Procedure
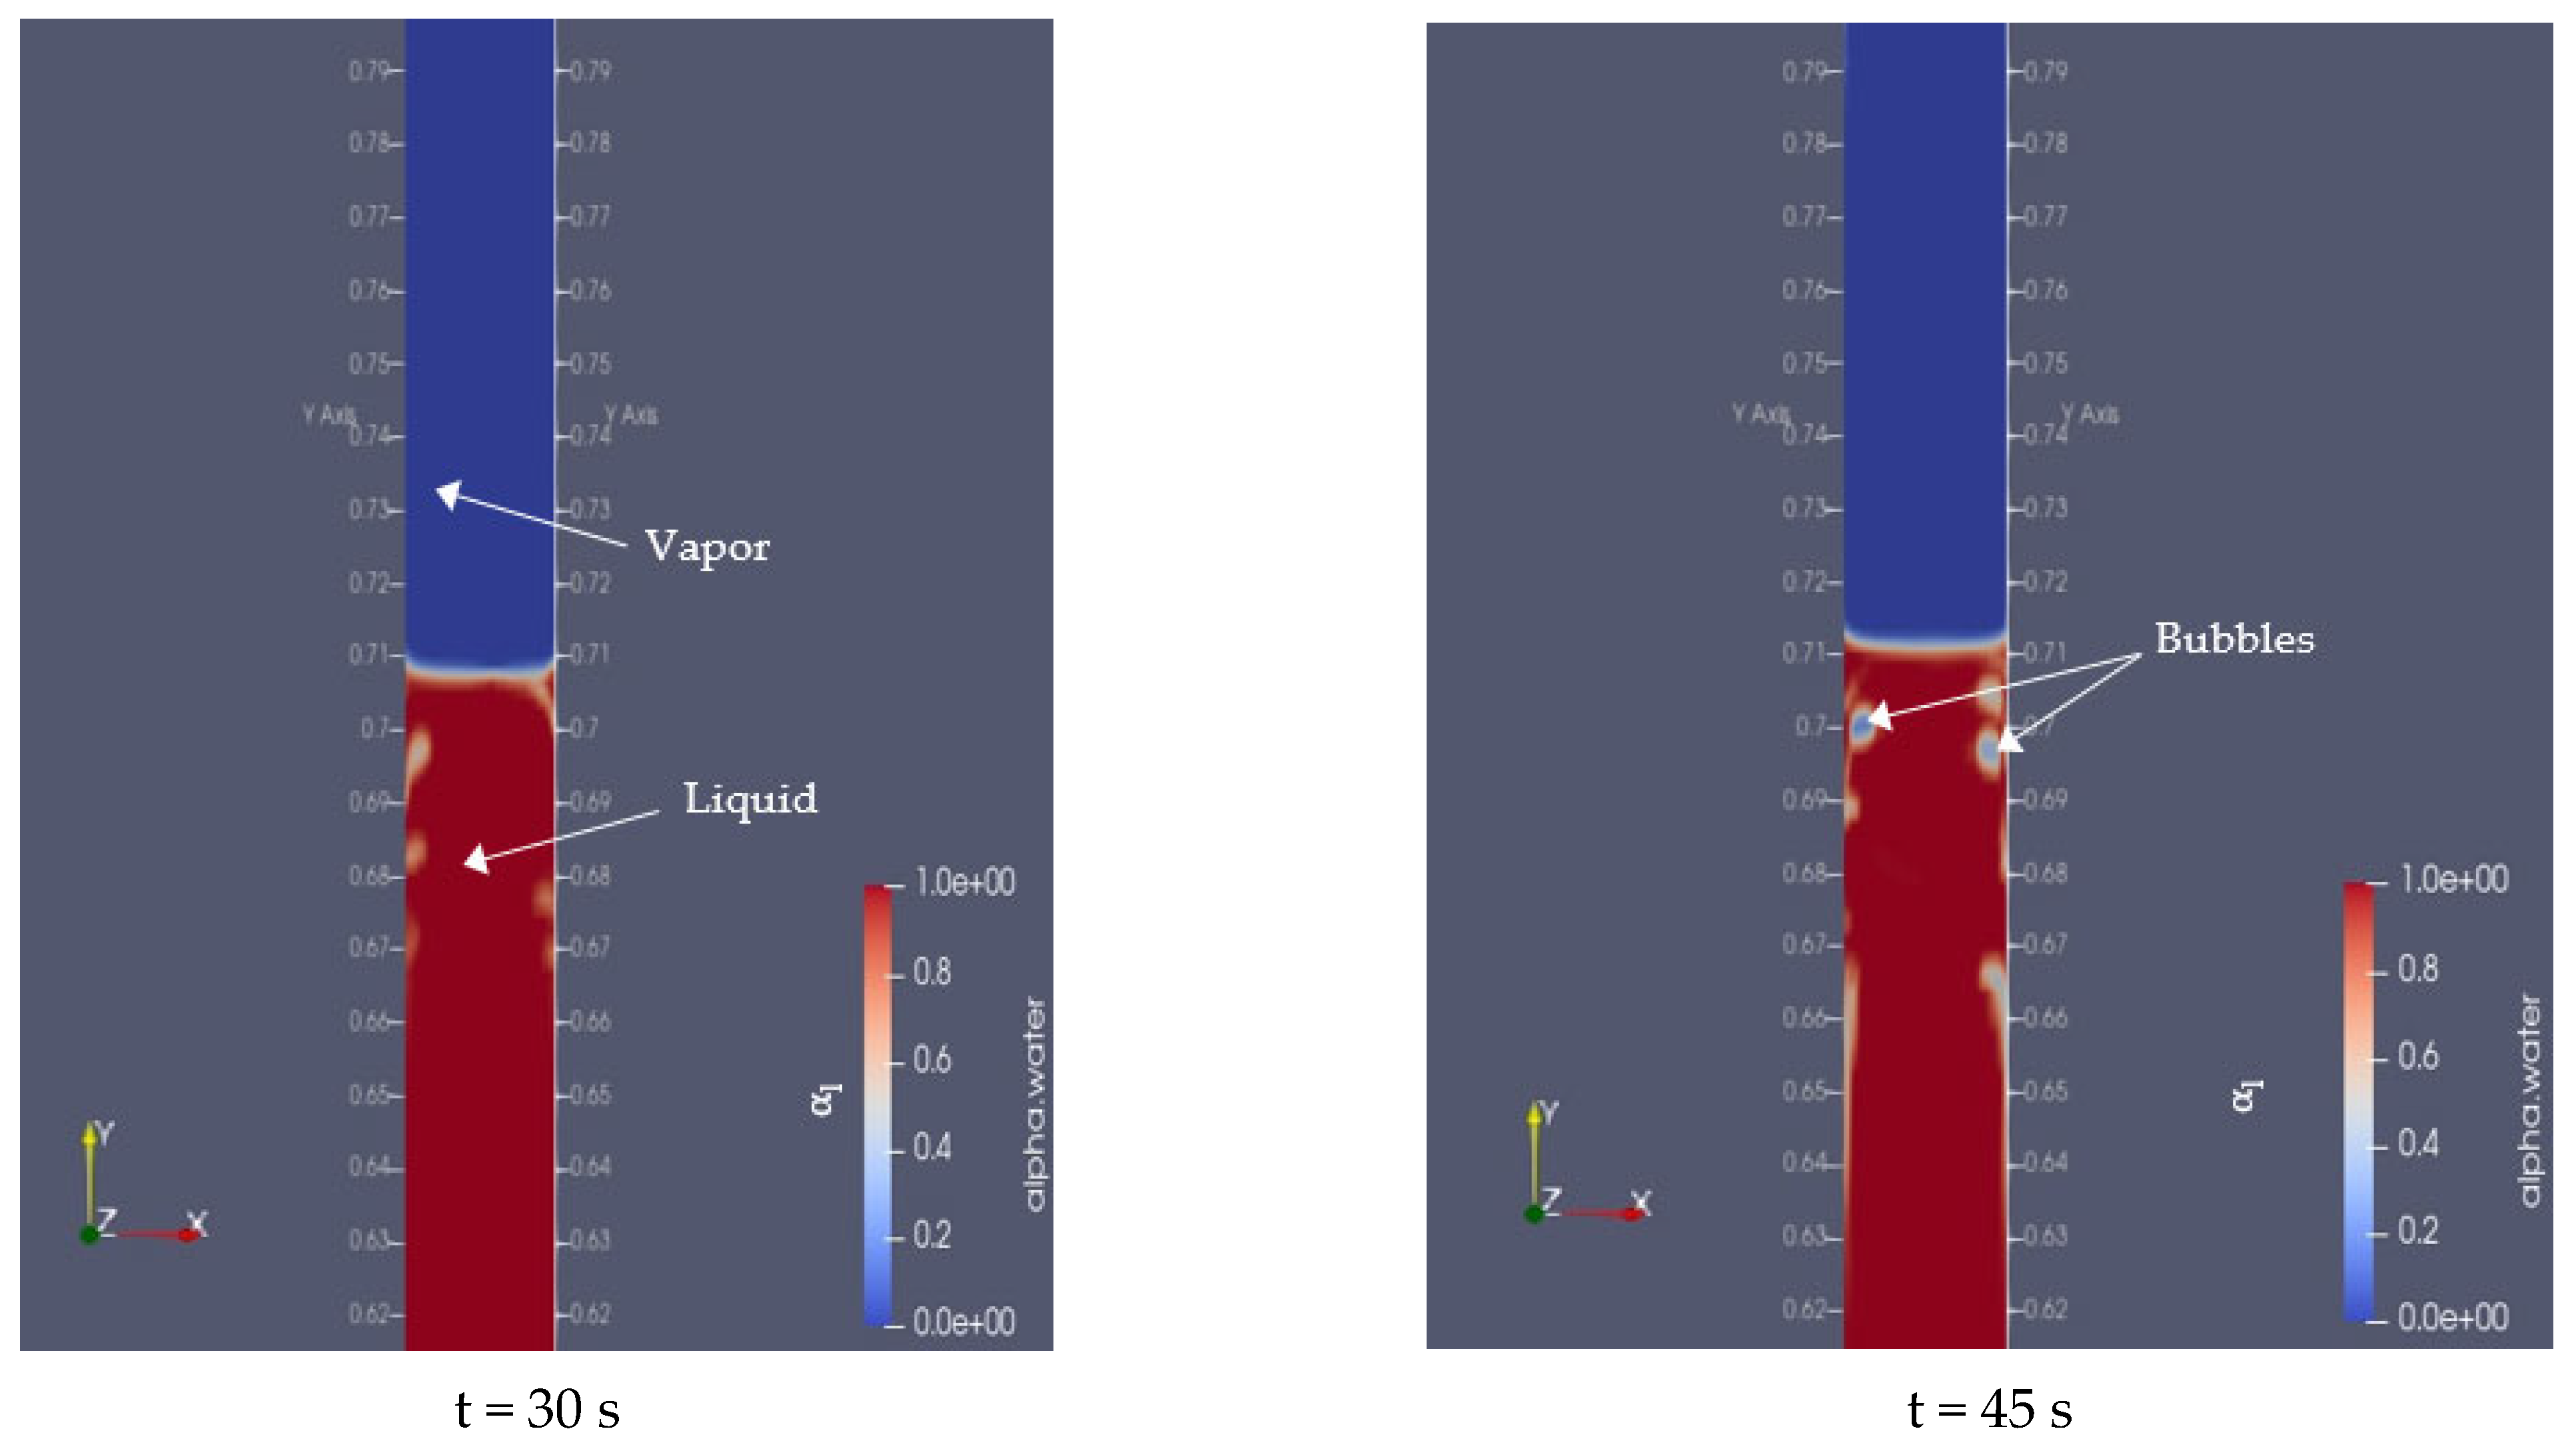
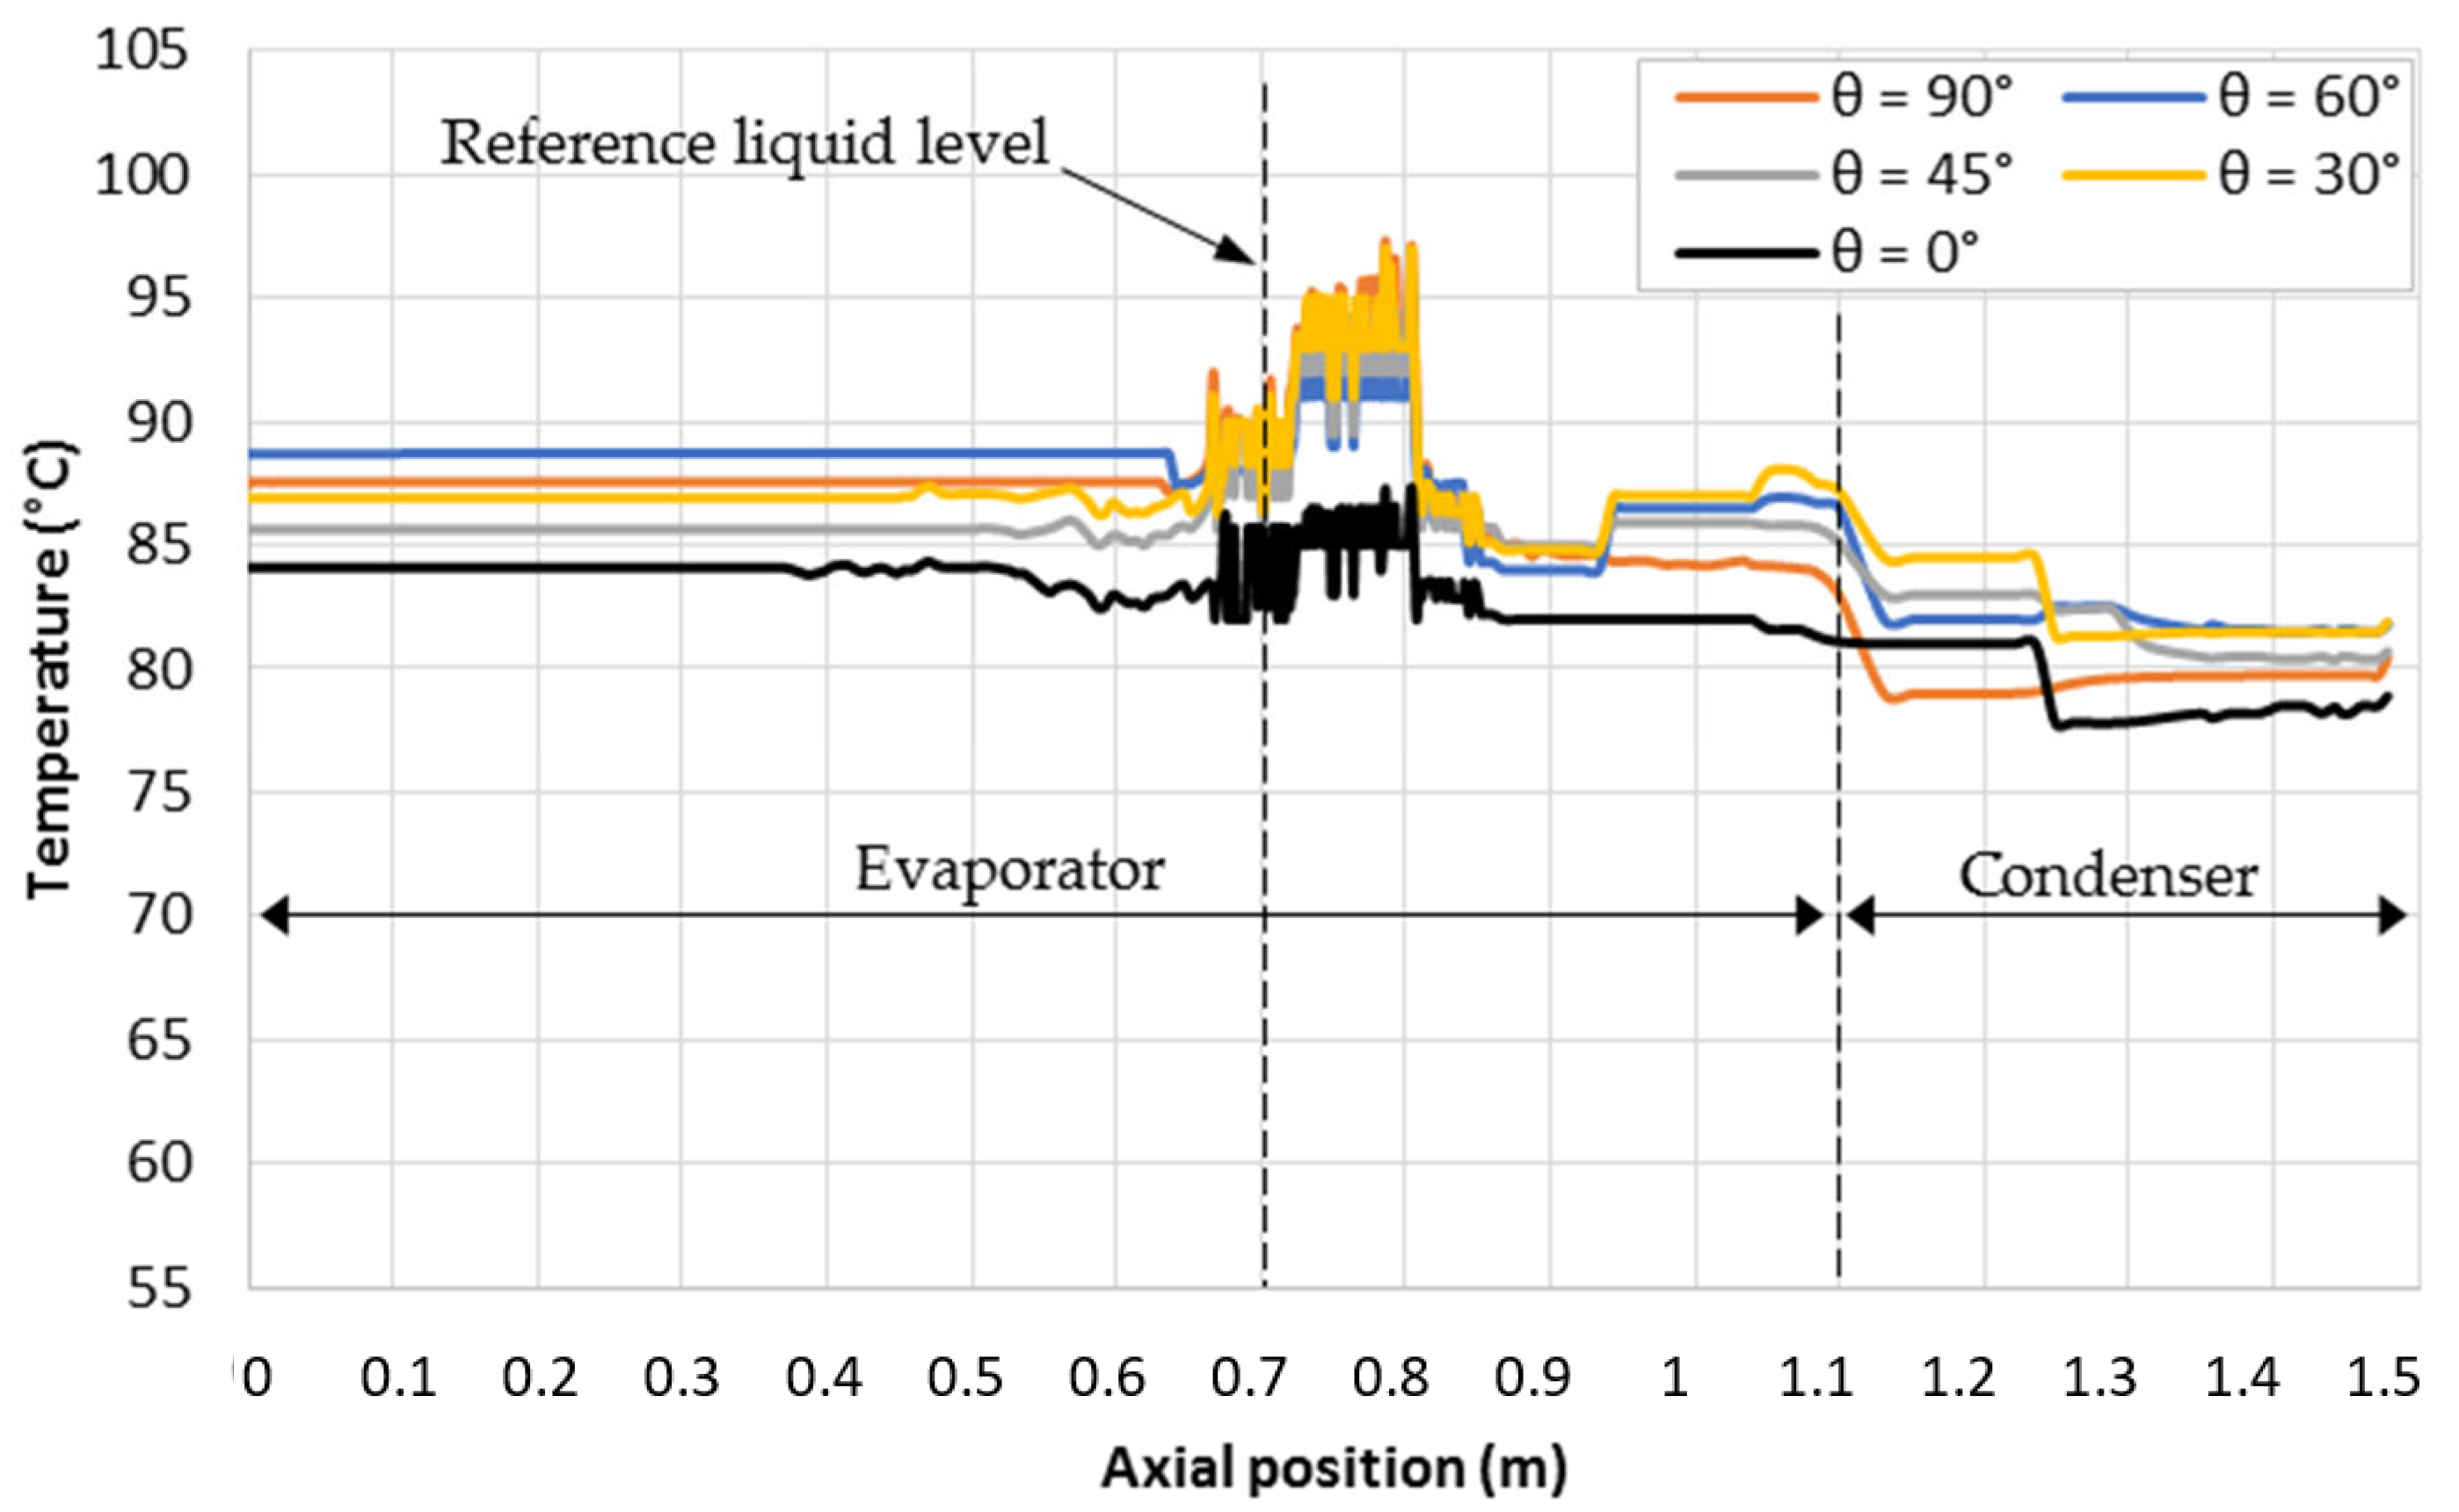
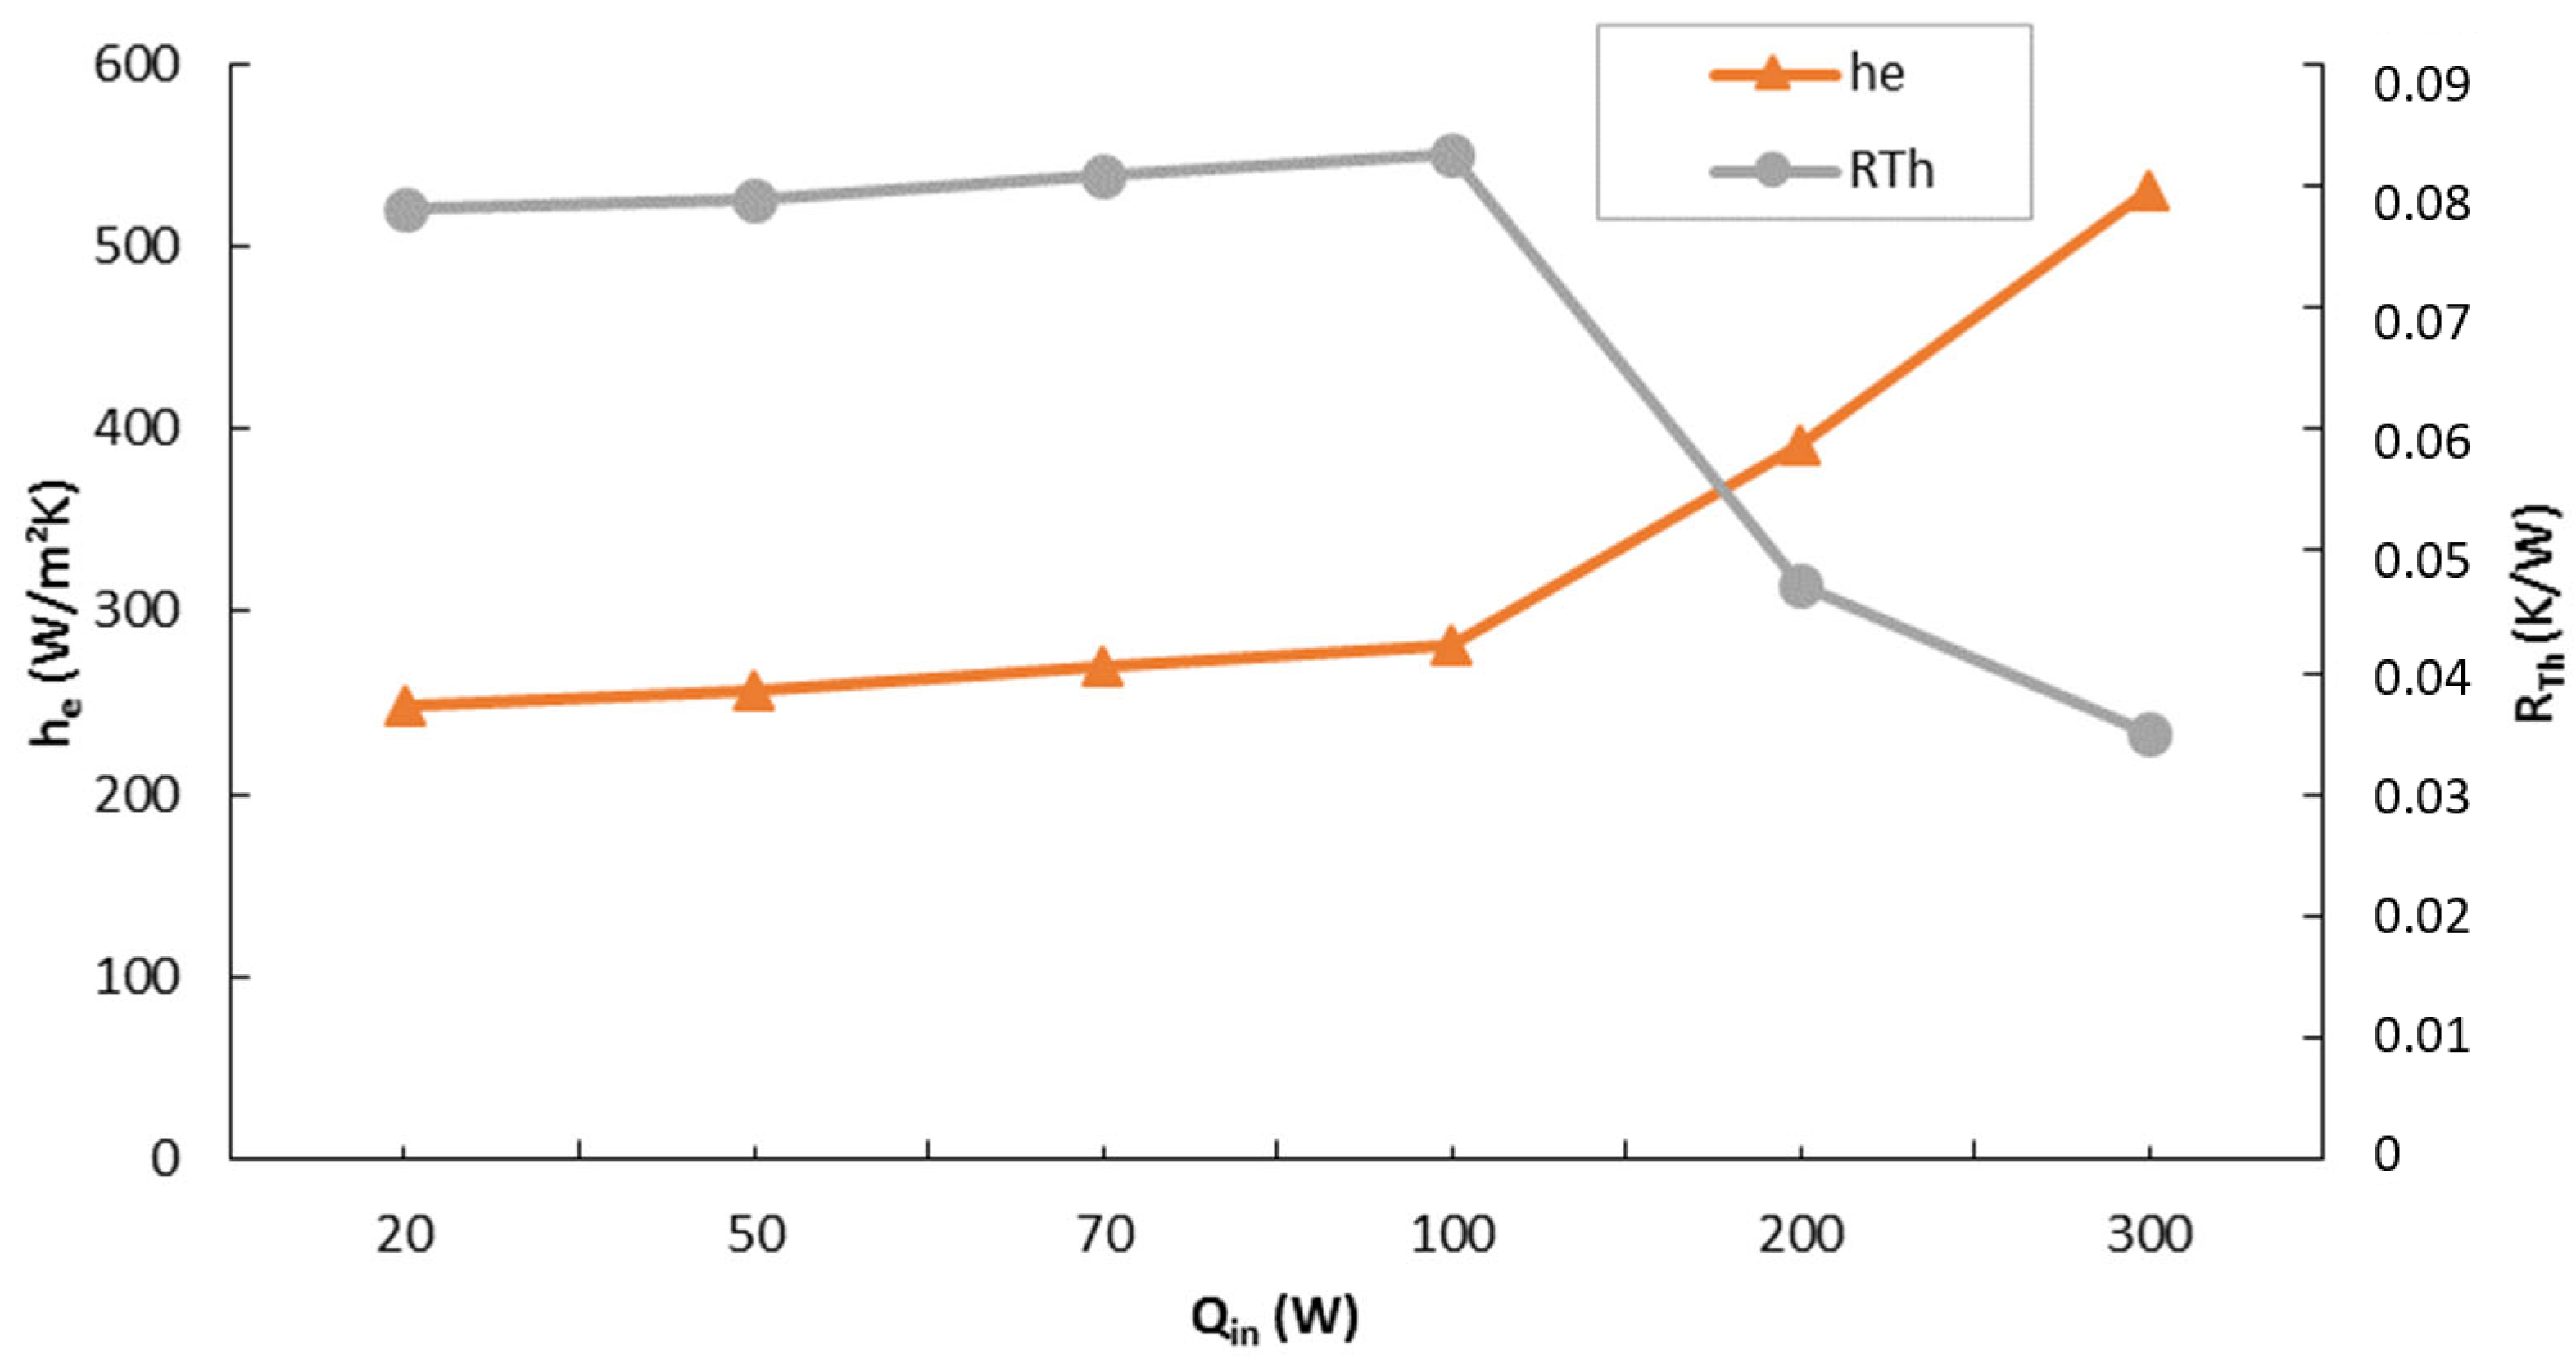
3. Results and Discussion
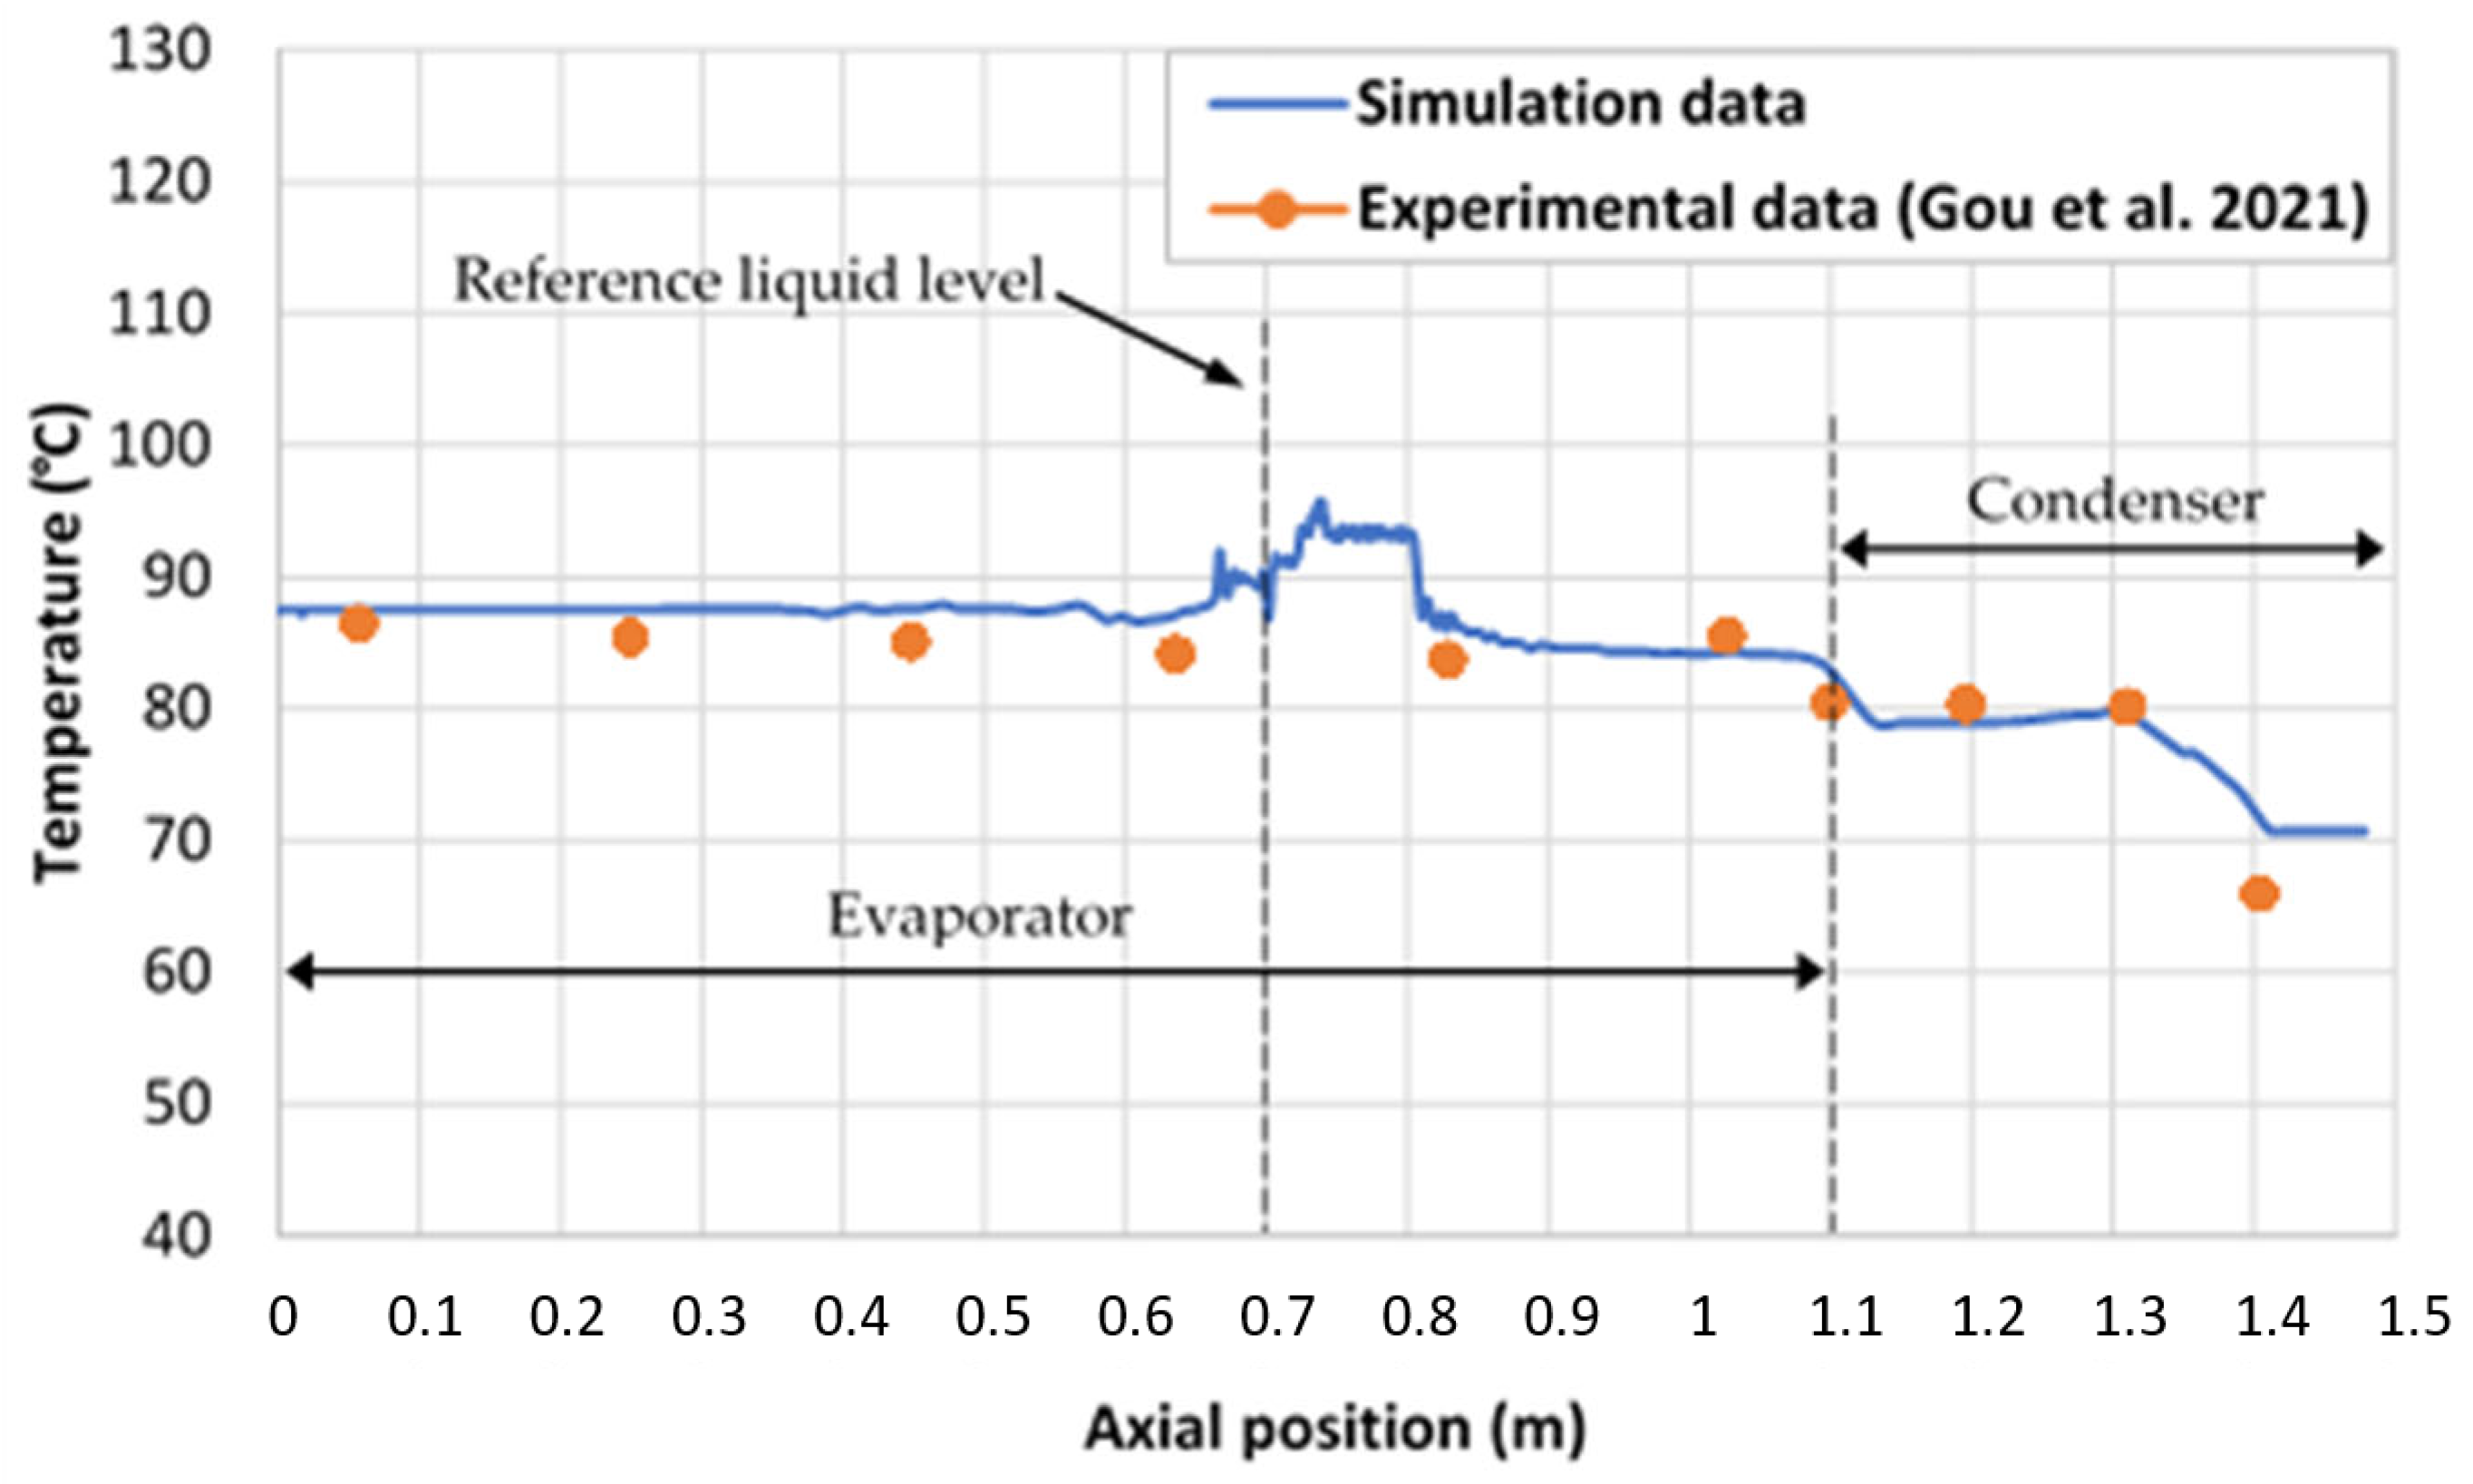
3.1. Model Validation
3.2. Effects of the Heating Power
3.3. Effects of the TPCT Inclination
4. Conclusions
Author Contributions
Funding
Data Availability Statement
Acknowledgments
Conflicts of Interest
Abbreviations
| TPCT | Two-Phase Closed Thermosyphon | |
| VOF | Volume of Fluid | |
| CFD | Computational Fluid Dynamics | |
| Nomenclature | ||
| Specific heat capacity of the liquid phase | J.kg−1.K−1 | |
| Specific heat capacity of the vapor phase | J.kg−1.K−1 | |
| D | Tube diameter | m |
| Continuum capillarity force | N.m−3 | |
| Standard acceleration of gravity | m.s−2 | |
| Equivalent heat transfer coefficient at the evaporator | W.m−2.K−1 | |
| Convective heat transfer coefficient at the condenser | W.m−2.K−1 | |
| Latent heat of vaporization | J.kg−1 | |
| H | Specific enthalpy | J.kg−1 |
| k | Thermal conductivity | W.m−1.K−1 |
| Evaporator length | M | |
| Condenser length | m | |
| M | Molar mass | g.mol−1 |
| Pressure | Pa | |
| Saturation pressure | Pa | |
| Heat flux density at the condenser | W.m−2 | |
| Input heat flux density at the evaporator | W.m−2 | |
| Heat flux at the condenser section | W | |
| Input heating power at the evaporator | W | |
| Specific gas constant | J.mol−1.K−1 | |
| Thermal resistance | K.W−1 | |
| Mass source term | Kg.m−3.s−1 | |
| Energy source term | W.m−3 | |
| Temperature | K | |
| Saturation temperature | K | |
| Mean temperature at the evaporator | K | |
| Mean temperature at the condenser | K | |
| Cooling fluid temperature | K | |
| Velocity | m.s−2 | |
| Liquid volume fraction | ||
| Vapor volume fraction | ||
| Time relaxation coefficient for evaporation | s−1 | |
| Time relaxation coefficient for condensation | s−1 | |
| Liquid–vapor interface curvature | m−1 | |
| Surface tension | N.m−1 | |
| Tilt angle of the TPCT | ° | |
| Fluid dynamic viscosity | Pa.s | |
| Fluid density | Kg.m−3 | |
References
- Fudholi, A.; Sopian, K. A review of solar air flat plate collector for drying application. Renew. Sustain. Energy Rev. 2019, 102, 333–345. [Google Scholar] [CrossRef]
- European Commission. Proposal for a Regulation of the European Parliament and of the Council Establishing the Framework for Achieving Climate Neutrality and Amending Regulation (EU) 2018/1999 (European Climate Law). 2020. Available online: https://eur-lex.europa.eu/legal-content/EN/TXT/?uri=celex%3A52020PC0080 (accessed on 10 June 2025).
- Aggarwal, S.; Kumar, R.; Lee, D.; Kumar, S.; Singh, T. A comprehensive review of techniques for increasing the efficiency of evacuated tube solar collectors. Heliyon 2023, 9, e15185. [Google Scholar] [CrossRef]
- Mantelli, M.B.H. Thermosyphons and Heat Pipes: Theory and Applications, 1st ed.; Springer Nature: Cham, Switzerland, 2021. [Google Scholar]
- Jafari, D.; Franco, A.; Filippeschi, S.; DiMarco, P. Two-Phase closed thermosyphons: A review of studies and solar applications. Renew. Sustain. Energy Rev. 2016, 53, 575–593. [Google Scholar] [CrossRef]
- Arat, H.; Arslan, O.; Ercetin, U.; Akbulut, A. Experimental study on heat transfer charcateristics of closed thermosyphon at different volumes and inclination angles for variabe vacuum pressures. Case Stud. Therm. Eng. 2021, 26, 101–117. [Google Scholar] [CrossRef]
- Lataoui, Z.; Jemni, A. Experimental investigation of a stainless steel two-phase closed thermosyphon. Appl. Therm. Eng. 2017, 121, 721–727. [Google Scholar] [CrossRef]
- Gou, X.; Li, G.; Zhang, R.; Jian, C.; Zhang, Q.; Li, B.; Dong, Q. Critical and optimal inclination angles of two-phase closed thermosyphon under different operating conditions. Int. J. Heat Mass Transf. 2021, 177, 121540. [Google Scholar] [CrossRef]
- Kim, Y.; Shin, D.H.; Kim, J.S.; You, S.M.; Lee, J. Boiling and condensation heat transfer of inclined two-phase closed thermosyphon with various filling ratios. Appl. Therm. Eng. 2018, 145, 328–342. [Google Scholar] [CrossRef]
- Wang, Y.; Wang, X.; Wang, J.; Liu, Y.; Chen, J. Heat transfer performance of a two-phase closed thermosyphon with different inclination angles based on the core-tube monitoring. Case Stud. Therm. Eng. 2023, 42, 102738. [Google Scholar] [CrossRef]
- Li, G.; Zhang, Y.; Zhang, G.; Huang, H.; Ding, H. Transient experimental and numerical study under different heating fluxes and filling ratios. Appl. Therm. Eng. 2024, 243, 122514. [Google Scholar] [CrossRef]
- Shabgard, H.; Xiao, B.; Faghri, A.; Gupta, R.; Weissman, W. Thermal characteristics of a closed thermosyphon under various filling conditions. Int. J. Heat Mass Transf. 2014, 70, 91–102. [Google Scholar] [CrossRef]
- Ahmed, I.S.; Al Jubori, A.M. Assessment of heat transfer and flow characteristics of a two-phase closed thermosiphon. Heat Transf. 2021, 50, 1351–1370. [Google Scholar] [CrossRef]
- Naruka, D.S.; Dwivedi, R.; Singh, P.K. Experimental inquisition of heat pipe: Performance evaluation for different fluids. Exp. Heat Transf. 2020, 33, 668–682. [Google Scholar] [CrossRef]
- Mahdavi, M.; Tiari, S.; Schampheleire, S.D.; Qiu, S. Experimental study of the thermal characteristics of a heat pipe. Exp. Therm. Fluid Sci. 2018, 93, 292–304. [Google Scholar] [CrossRef]
- Sarafraz, M.; Pourmehran, O.; Yang, B.; Arjomandi, M. Assessment of the thermal performance of a thermosyphon heat pipe using zirconia-acetone nanofluids. Renew. Energy 2019, 136, 884–895. [Google Scholar] [CrossRef]
- Khaongam, K.; Chompookham, T.; Parametthanuwat, T. Internal flow pattern of the condenser section that affects the heat transfer characteristics of rectangular two-phase closed thermosyphon. Case Stud. Therm. Eng. 2025, 72, 106246. [Google Scholar] [CrossRef]
- Nobrega, G.; Cardoso, B.; Souza, R.; Pereira, J.; Pontes, P.; Catarino, S.O.; Pinho, D.; Lima, R.; Moita, A. A review of novel heat transfer materials and fluids for aerospace applications. Aerospace 2024, 11, 275. [Google Scholar] [CrossRef]
- Dhairiyasamy, R.; Gabiriel, D.; Varudharajan, G.; Manivannan, J.M.; Arputharaj, B.S.; Arputharaj, B.S.; Awadh, M.A.; Al-Mdallal, Q.M. Impact of coated silver nanoplates on the thermal efficiency of heat pipes under varying operating conditions. Case Stud. Therm. Eng. 2025, 67, 105662. [Google Scholar] [CrossRef]
- Mathry, A.H.; Al-Mousawi, F.N.; Dhaidan, N.S.; Al-Shohani, W.A.M.; Alammar, A.A. Impact of design and operating parameters on the thermal performance of heat pipes: A review. J. Eng. Res. 2024, 13, 985–1000. [Google Scholar] [CrossRef]
- Seo, J.; Lee, J.; Lee, J. Impact force and occurrence condition of geyser boiling in two-phase closed thermosyphon. Int. Commun. Heat Mass Tran. 2024, 159, 108262. [Google Scholar] [CrossRef]
- Bahar, A.; Ghafouri, J.; Zamzamian, K. A numerical investigation into the application of thermosyphons for preventing the freezing of water meters, utilizing pure water and different nanofluids. Int. J. Thermofl. 2025, 26, 101088. [Google Scholar] [CrossRef]
- Kodancha, P.; Tripathi, S.; Hemadri, V. Experimental investigation of thermal performance of cylindrical thermosyphon with novel wettability gradient and self-rewetting fluids. Appl. Therm. Eng. 2025, 278, 127191. [Google Scholar] [CrossRef]
- Rukruang, A.; Kaew-On, J.; Wongwises, S.; Wang, C.-C. Experimental optimization and performance limits of a multiport minichannel thermosyphon for air-cooled applications. Appl. Therm. Eng. 2025, 279, 127540. [Google Scholar] [CrossRef]
- Kang, S.; Kim, D. Boiling and liquid film evaporation in a thermosyphon under horizontal vibrations. Int. Commun. Heat Mass Tran. 2025, 166, 109119. [Google Scholar] [CrossRef]
- The OpenFOAM Foundation. OpenFOAM v6. 2018. Available online: https://openfoam.org/download/6-linux/ (accessed on 15 May 2025).
- Tryggvason, G.; Scardovelli, R.; Zaleski, S. Direct Numerical Simulations of Gas-Liquid Multiphase Flows, 1st ed.; Cambridge University Press: Cambridge, UK, 2011. [Google Scholar]
- Deshpande, S.S.; Anumolu, L.; Trujillo, M.F. Evaluating the performance of the two-phase flow solver interFoam. Comput. Sci. Discov. 2012, 5, 014016. [Google Scholar] [CrossRef]
- Gamet, L.; Scala, M.; Roenby, J.; Scheufler, H.; Pierson, J.L. Validation of volume-of-fluid OpenFOAM® isoAdvector solvers using single bubble benchmarks. Comput. Fluids 2020, 213, 104722. [Google Scholar] [CrossRef]
- Roenby, J.; Bredmose, H.; Jasak, H. A computational method for sharp interface advection. R. Soc. Open Sci. 2016, 3, 160405. [Google Scholar] [CrossRef]
- Deng, X. A new open-source library based on novel high-resolution structure-preserving convection schemes. J. Comput. Sci. 2023, 74, 74–102150. [Google Scholar] [CrossRef]
- Deng, X. A Unified Framework for Non-linear Reconstruction Schemes in a Compact Stencil. Part 1: Beyond Second Order. J. Comput. Phys. 2023, 481, 112052. [Google Scholar] [CrossRef]
- Lataoui, Z.; BenSelama, A.M. Modelling of heat and mass transfer in a two-phase closed thermosyphon. Energy 2024, 313, 133851. [Google Scholar] [CrossRef]
- Brahim, T.; Jemni, A. A two dimensional steady state roll heat pipe analyses for heat exchanger applications. Int. J. Heat Technol. 2012, 30, 115–120. [Google Scholar] [CrossRef]
- Wang, X.; Zhu, Y.; Wang, Y. Development of pressure-based phase change model for CFD modelling of heat pipes. Int. J. Heat Mass Transf. 2019, 145, 118763. [Google Scholar] [CrossRef]
- OpenFOAM v6 User Guide. 2018. Available online: https://doc.cfd.direct/openfoam/user-guide-v6/contents (accessed on 28 July 2025).
- Kharangate, C.R.; Modawar, I. Review of computational studies on boiling and condensation. Int. J. Heat Mass Transf. 2017, 108, 1164–1196. [Google Scholar] [CrossRef]
- Zou, P.; Kim, T.; Bricker, J.D.; Uijttewaal, W.S.J. Assessment of interfacial turbulence treatment models for free surface flows. J. Hydraul. Res. 2023, 61, 651–667. [Google Scholar] [CrossRef]
- Frederix, E.M.A.; Mathur, A.; Dovizio, D.; Geurts, B.J.; Komen, E.M.J. Reynolds-averaged modeling of turbulence damping near a large-scale interface in two-phase flow. Nucl. Eng. Des. 2018, 333, 122–130. [Google Scholar] [CrossRef]
- Jouhara, H.; Reay, D.; McGlen, R.; Kew, P.; McDonough, J. Heat Pipe Types and Developments. In Heat Pipes: Theory, Design and Applications, 7th ed.; Elsevier: Oxford, UK, 2024. [Google Scholar]
- Kumar, P.M.; Mylsamy, K. A comprehensive study on thermal storage characteristics of nano-CeO2 embedded phase change material and its influence on the performance of evacuated tube solar water heater. Renew. Energy 2020, 162, 662–676. [Google Scholar] [CrossRef]


| Parameter | Data |
|---|---|
| Working fluid | Water |
| Wall material | Stainless steel |
| Tube diameter (D) | 28 mm |
| Total length (L) | 1486 mm |
| Evaporator length (Le) | 1106 mm |
| Condenser length (Lc) | 380 mm |
| Filling ratio | 48% (of the evaporator volume) |
| Input heat power Qin | 100, 200, and 300 W |
| Tilt angle | 0, 15, 30, 45, 60, 75, and 90° |
| 120,250 cells | 88.9 | 73 |
| 150,130 cells | 86.1 | 75.2 |
| 180,300 cells | 85.75 | 75.7 |
| Experience [8] | 84.4 | 75.5 |
Disclaimer/Publisher’s Note: The statements, opinions and data contained in all publications are solely those of the individual author(s) and contributor(s) and not of MDPI and/or the editor(s). MDPI and/or the editor(s) disclaim responsibility for any injury to people or property resulting from any ideas, methods, instructions or products referred to in the content. |
© 2025 by the authors. Licensee MDPI, Basel, Switzerland. This article is an open access article distributed under the terms and conditions of the Creative Commons Attribution (CC BY) license (https://creativecommons.org/licenses/by/4.0/).
Share and Cite
Lataoui, Z.; Benselama, A.M.; Jemni, A. Heat Transfer Characteristics of Thermosyphons Used in Vacuum Water Heaters. Fluids 2025, 10, 199. https://doi.org/10.3390/fluids10080199
Lataoui Z, Benselama AM, Jemni A. Heat Transfer Characteristics of Thermosyphons Used in Vacuum Water Heaters. Fluids. 2025; 10(8):199. https://doi.org/10.3390/fluids10080199
Chicago/Turabian StyleLataoui, Zied, Adel M. Benselama, and Abdelmajid Jemni. 2025. "Heat Transfer Characteristics of Thermosyphons Used in Vacuum Water Heaters" Fluids 10, no. 8: 199. https://doi.org/10.3390/fluids10080199
APA StyleLataoui, Z., Benselama, A. M., & Jemni, A. (2025). Heat Transfer Characteristics of Thermosyphons Used in Vacuum Water Heaters. Fluids, 10(8), 199. https://doi.org/10.3390/fluids10080199