Abstract
The aerodynamic loading of four as well as of six tilted flat plates-panels arranged in tandem and in close proximity to the ground is examined through force and pressure measurements. In the four-plate set up, conducted in an open-circuit wind tunnel, a movable floor is used to vary the ground clearance, and a one-component force balance is employed to measure the drag coefficient Cd of each plate for tilt angles 10° to 90° and for two head-on wind directions, 0° and 180°. An increase in the ground clearance from 20% to 60% of the plates’ chord length, results in a Cd increase of over 40% in the downstream plates, and up to 20% in the leading one. For tilt angles below 40°, the drag on the first plate is up to 25% higher under the 180° wind direction compared to the opposite direction. Pressure distributions are also presented on a series of six much larger plates, examined in a closed-circuit wind tunnel at tilt angles ±30°. While the windward surfaces exhibit relatively uniform pressure distributions, regions of low pressure develop on their suction side, near the plates’ tips leading edge, tending to become uniform streamwise.
1. Introduction
Increased global investments on solar energy sector [1] has resulted in worldwide installations of large scale photovoltaic (PV) plants. Since PV panels are normally ground mounted in open terrain, they are exposed to wind loads, which their supports have to be able to withstand. An appropriate design of the panels’ support can reduce the initial investment by optimizing the quantity of the construction material and increase the lifetime of the installation. Therefore, detailed knowledge of the panel’s aerodynamic loading is of paramount importance for PV applications.
PV panels are mounted on metallic structures, tilted with an angle with respect to the horizontal close to the local latitude, for best solar energy harvesting. From an aerodynamic point of view, PV panels can be treated as wings of zero camber and constant thickness at close proximity to the ground, exposed to a free stream of time dependent speed and direction. As such, the prediction of the flow field is not an easy task. The wake interaction between the panel arrays, their finite aspect ratios and the high angles of attack, make the problem even more complex combined with the influence of the ground.
Due to both scientific interest and relevant economic implications, the aerodynamic loading of PV panels has been examined by many researchers, both experimentally and numerically. However, due to the poly-parametric nature of the problem, there are still open questions that need to be answered. Regarding the experimental studies, these are mainly conducted in wind tunnels so that the characteristics of the incoming free stream are controllable, like its direction, the velocity spatial distribution, turbulence level and frequency content. The panels are simulated by sub-scaled models, which according to specific studies [2,3,4], do not influence the time average loading but suppress the peak loads as the model dimensions are reduced. The aerodynamic loads on the panel models are estimated normally by pressure measurements at a number of points on the model surface [5,6,7] or by use of a force balance [8]. In the numerical work [9], unsteady RANS (Reynolds Averaged Navier–Stokes) are employed for the prediction of the flow over a series of five plates at a tilt angle of 25° and at various wind azimuthal angles. In the latter work, it is mentioned that this kind of research is necessary since there are no guidelines in the building standards, regarding the design loads of PV panels, either ground or roof mounted. In [10], large eddy simulations are performed for tilted plates of various aspect ratios. In the same work, a good number of previous studies are mentioned, both experimental and computational. In [11], a commercial CFD (Computational Fluid Dynamics) solver is used for the flow study of ten tilted plates in tandem, and in [12], DNS (Direct Numerical Simulations) are employed in the case of two plates in tandem for various longitudinal distances and ground clearances. In a recent work [13], field pressure measurements on PV panel arrays are presented, at three points along the chord of the panels (leading edge, trailing edge and middle of the chord) and at several stations along the spanwise length of the panel arrays. This work [13], including a number of relevant publications, focuses on the unsteadiness of the panel aerodynamic loading and the influence of the panel wakes interference on vortex shedding frequency as a function of the wind direction.
A common conclusion of all previous studies, regarding the aerodynamic loading of a series of tilted panels, is that the first windward panel is exposed to the highest drag force whereas the oblique wind angles of 45° and 135° maximize the panel overturning moment. However, the effect of the ground clearance (minimum distance of the panel from the ground) on the panel loading is not clear since parameters, like the panel aspect ratio, the longitudinal panel distance and high tilt angles are involved. As a result, the drag, in various publications, is reported to either increase or decrease with the ground clearance [14]. In fact, even for the case of an isolated wing at close proximity to the ground, the research is very limited and devoted to either small angles of attack for rectangular wings (e.g., for a NACA 0015 airfoil [15] and for a NACA 0012 airfoil, [16]) or to higher angles for delta type wings, examining the airplanes takeoff and landing phases [17].
In the present work, new experimental evidence is presented, regarding the influence of both the ground clearance and the tilt angle for head-on winds (0° and 180°) on the aerodynamic loading of four tilted plates in tandem configuration. In contrast to the majority of the published experimental works on panel arrays, here an adjustable ground floor is employed in an open circuit wind tunnel, so that the vertical distance of the lower part of the plates from the ground remains constant, independent of the tilt angle. This detail is normally overlooked, which seems to be an important parameter in order to properly correlate the applied aerodynamic forces with the tilt angle. Moreover, the drag force is measured by a one-component balance, which is advantageous compared to pressure measurements reported in many publications, since the measured force reflects both the pressure and shear stresses (albeit the small values of the latter) applied on the plates. Based on this new evidence, it is verified that increasing the ground clearance from 20% to 60% of the plates’ chord length, the drag increases predominantly on the downstream located plates and in a lesser degree on the first one. Also, changing the wind direction from 0° to 180°, the drag of the first windward plate takes higher values up to a tilt angle beyond which the reverse occurs. The latter is attributed to a discontinuity of the drag curve slope which appears at a tilt angle of about 50° for the 180° wind direction, being quite evident for the smaller ground clearance of 20%. To the best of our knowledge, the above are highlighted for the first time. Moreover, the three-dimensional character of the flow is revealed through pressure measurements conducted on a series of six much larger plates, in a closed-circuit wind tunnel. Thanks to a relatively dense grid of pressure taps, the evolution of the pressure field along the panel series is clearly captured, in contrast to the noisy data often reported in open literature.
The findings of this work, expressed through the non-dimensional drag coefficient, highlight, among other aspects, the strong influence of the ground on the panels drag and its dependence on the sign of the tilt angle as well as the three-dimensional character of the flow field. Furthermore, it becomes evident that, from a fluid mechanics perspective, more research is required to better understand the flow around flat surfaces at high tilt angles, whether isolated or arranged in tandem, when placed in close proximity to the ground.
2. Models and Experimental Procedure
2.1. Four-Plate Set Up
A series of four tilted flat plates, one behind the other, was installed in a subsonic wind tunnel (School of Engineering, Bahrain Polytechnic, Bahrain). Each of these plates was made of Plexiglas, 180 mm long (spanwise length) and 30 mm wide (chord length), namely their aspect ratio AR was 6. The dimensions of the models were selected so that the projected area of the plates constituted a small percentage of the wind tunnel cross-sectional area, and the tunnel’s force balance would be able to record the applied aerodynamic drag with good resolution. Moreover, as mentioned in [18], a typical PV array is about 20 m long and 5 m wide, which, under-scaled 100 times, could be represented by the present model. According to [2], under-scaled models can simulate successfully the mean aerodynamic loading of tilted plates, while failing in reproducing its peak forces.
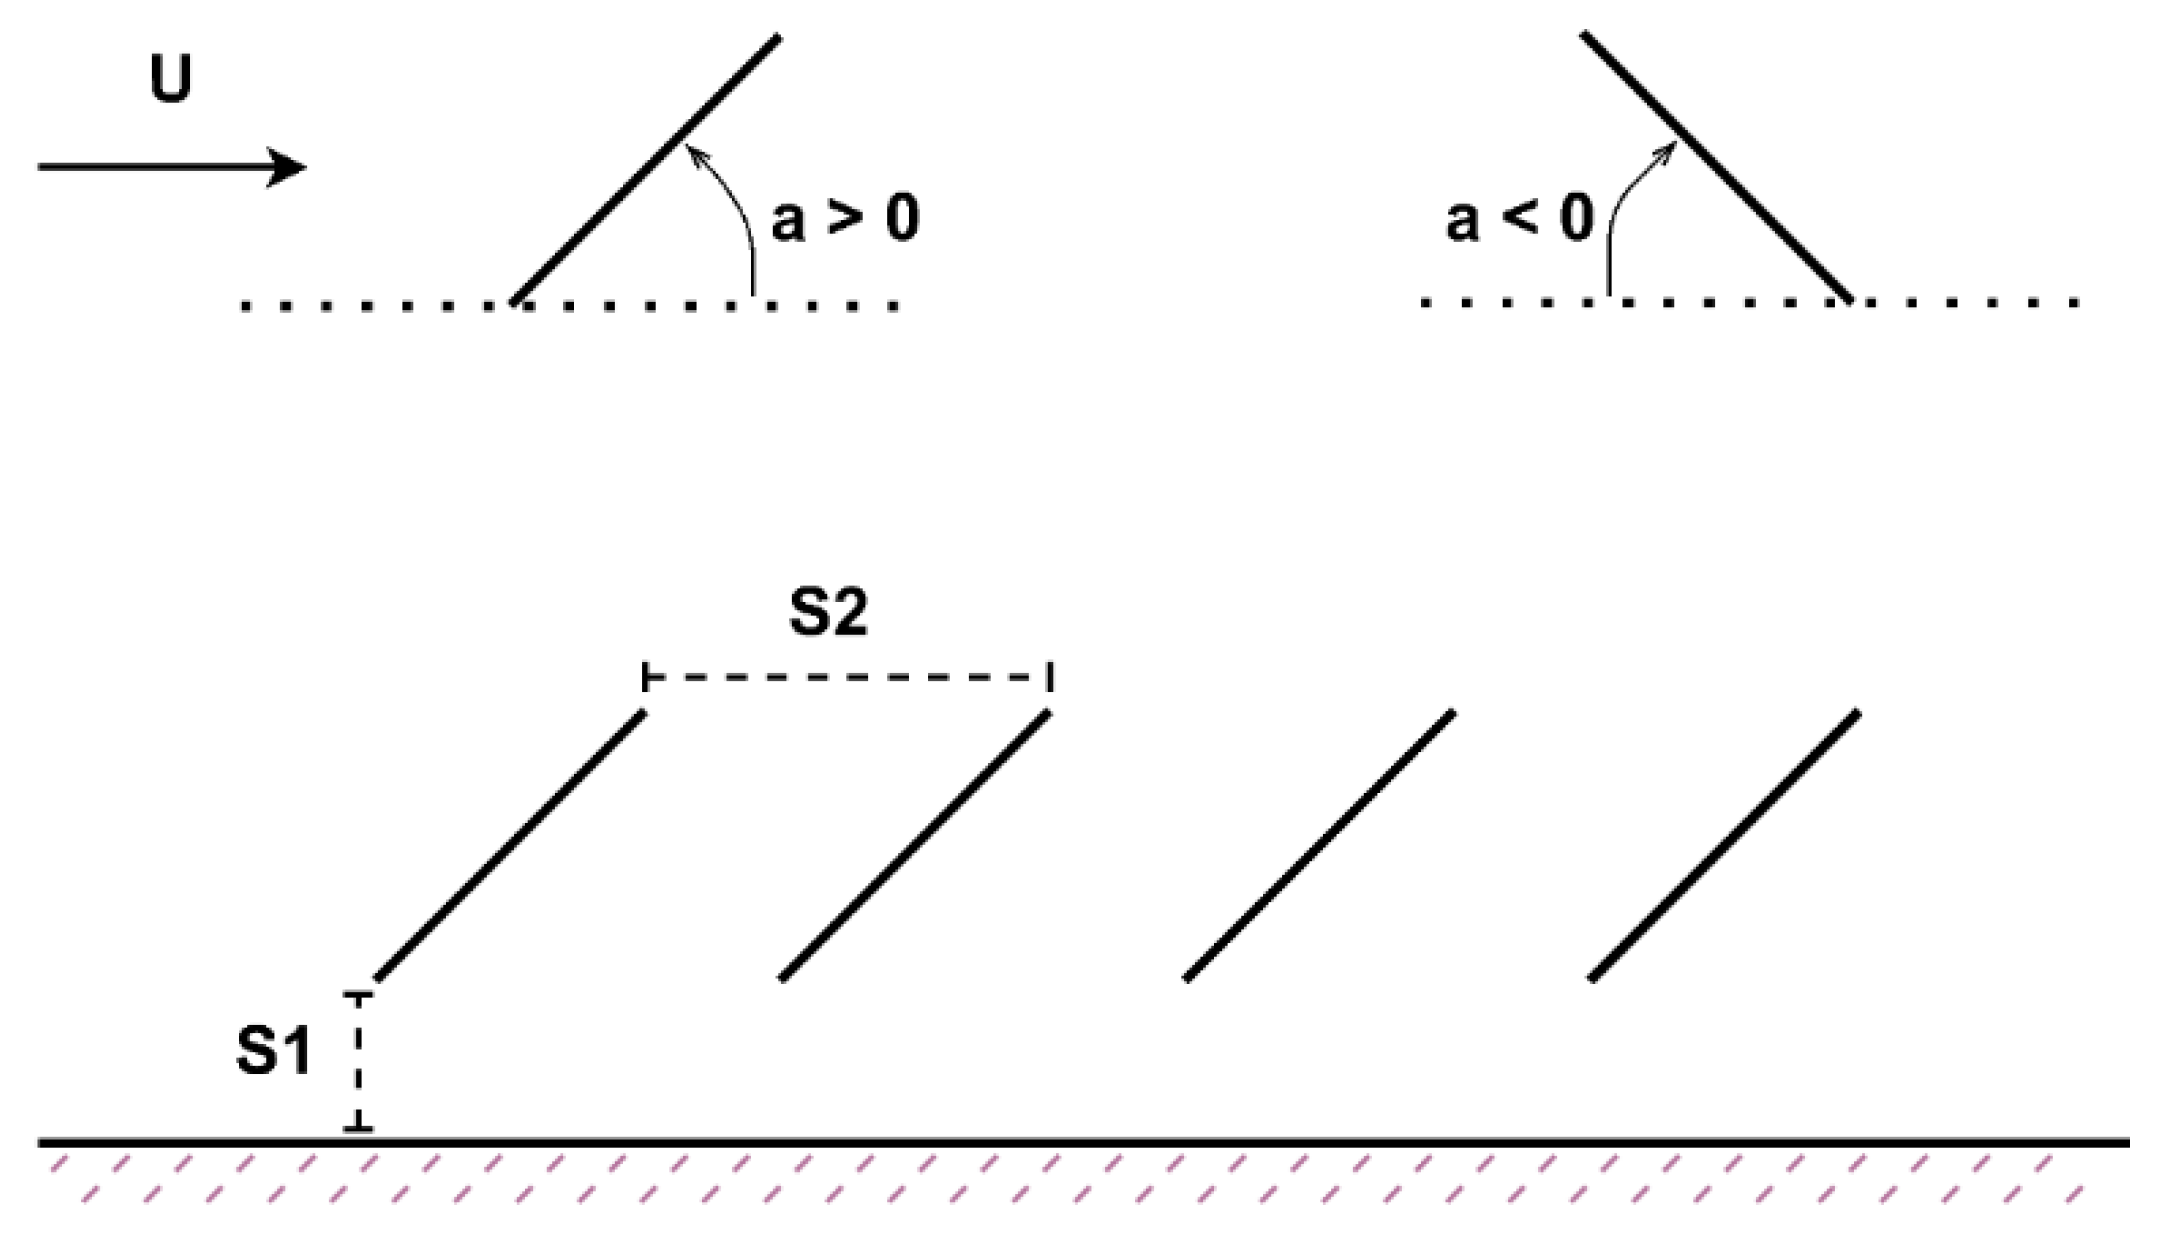
Each plate was supported by two horizontal bolts at a distance of 180 mm apart, allowing the adjustment of the plate tilt angle a, from a = 0° (horizontal) to a = 90° (vertical), taking both positive and negative values. The tilt angle was considered positive, when the angle between the leeward side of the plates and the ground was acute (this refers to 0° head-on wind direction), and negative if its windward side made an acute angle with the ground (this refers to 180° head-on wind direction). Regarding ground clearance, namely the smallest distance of the plates from the ground, it was adjusted by using a movable flat metallic plate (2 mm thick), positioned below the tilted plates and supported by four bolts. The ground clearance was measured with high precision by inserting a flat Plexiglas plate, either 6 mm or 18 mm thick (depending on the ground clearance being tested), between the lower part of the plates and the ground floor. The ground floor was then moved vertically in small increments until the Plexiglas plate made contact with both the lower plate and the ground floor. This contact point allowed for accurate determination of the ground clearance. Figure 1 is a schematic of the plate series, showing the ground clearance, S1, the longitudinal distance between plates, S2 and the definition of the angle of attack, a.
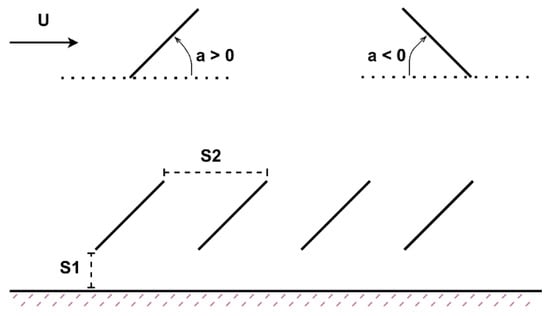
Figure 1.
A schematic of the four-plate series with its basic dimensions (ground clearance–longitudinal distance) and the definition of the angle of attack.
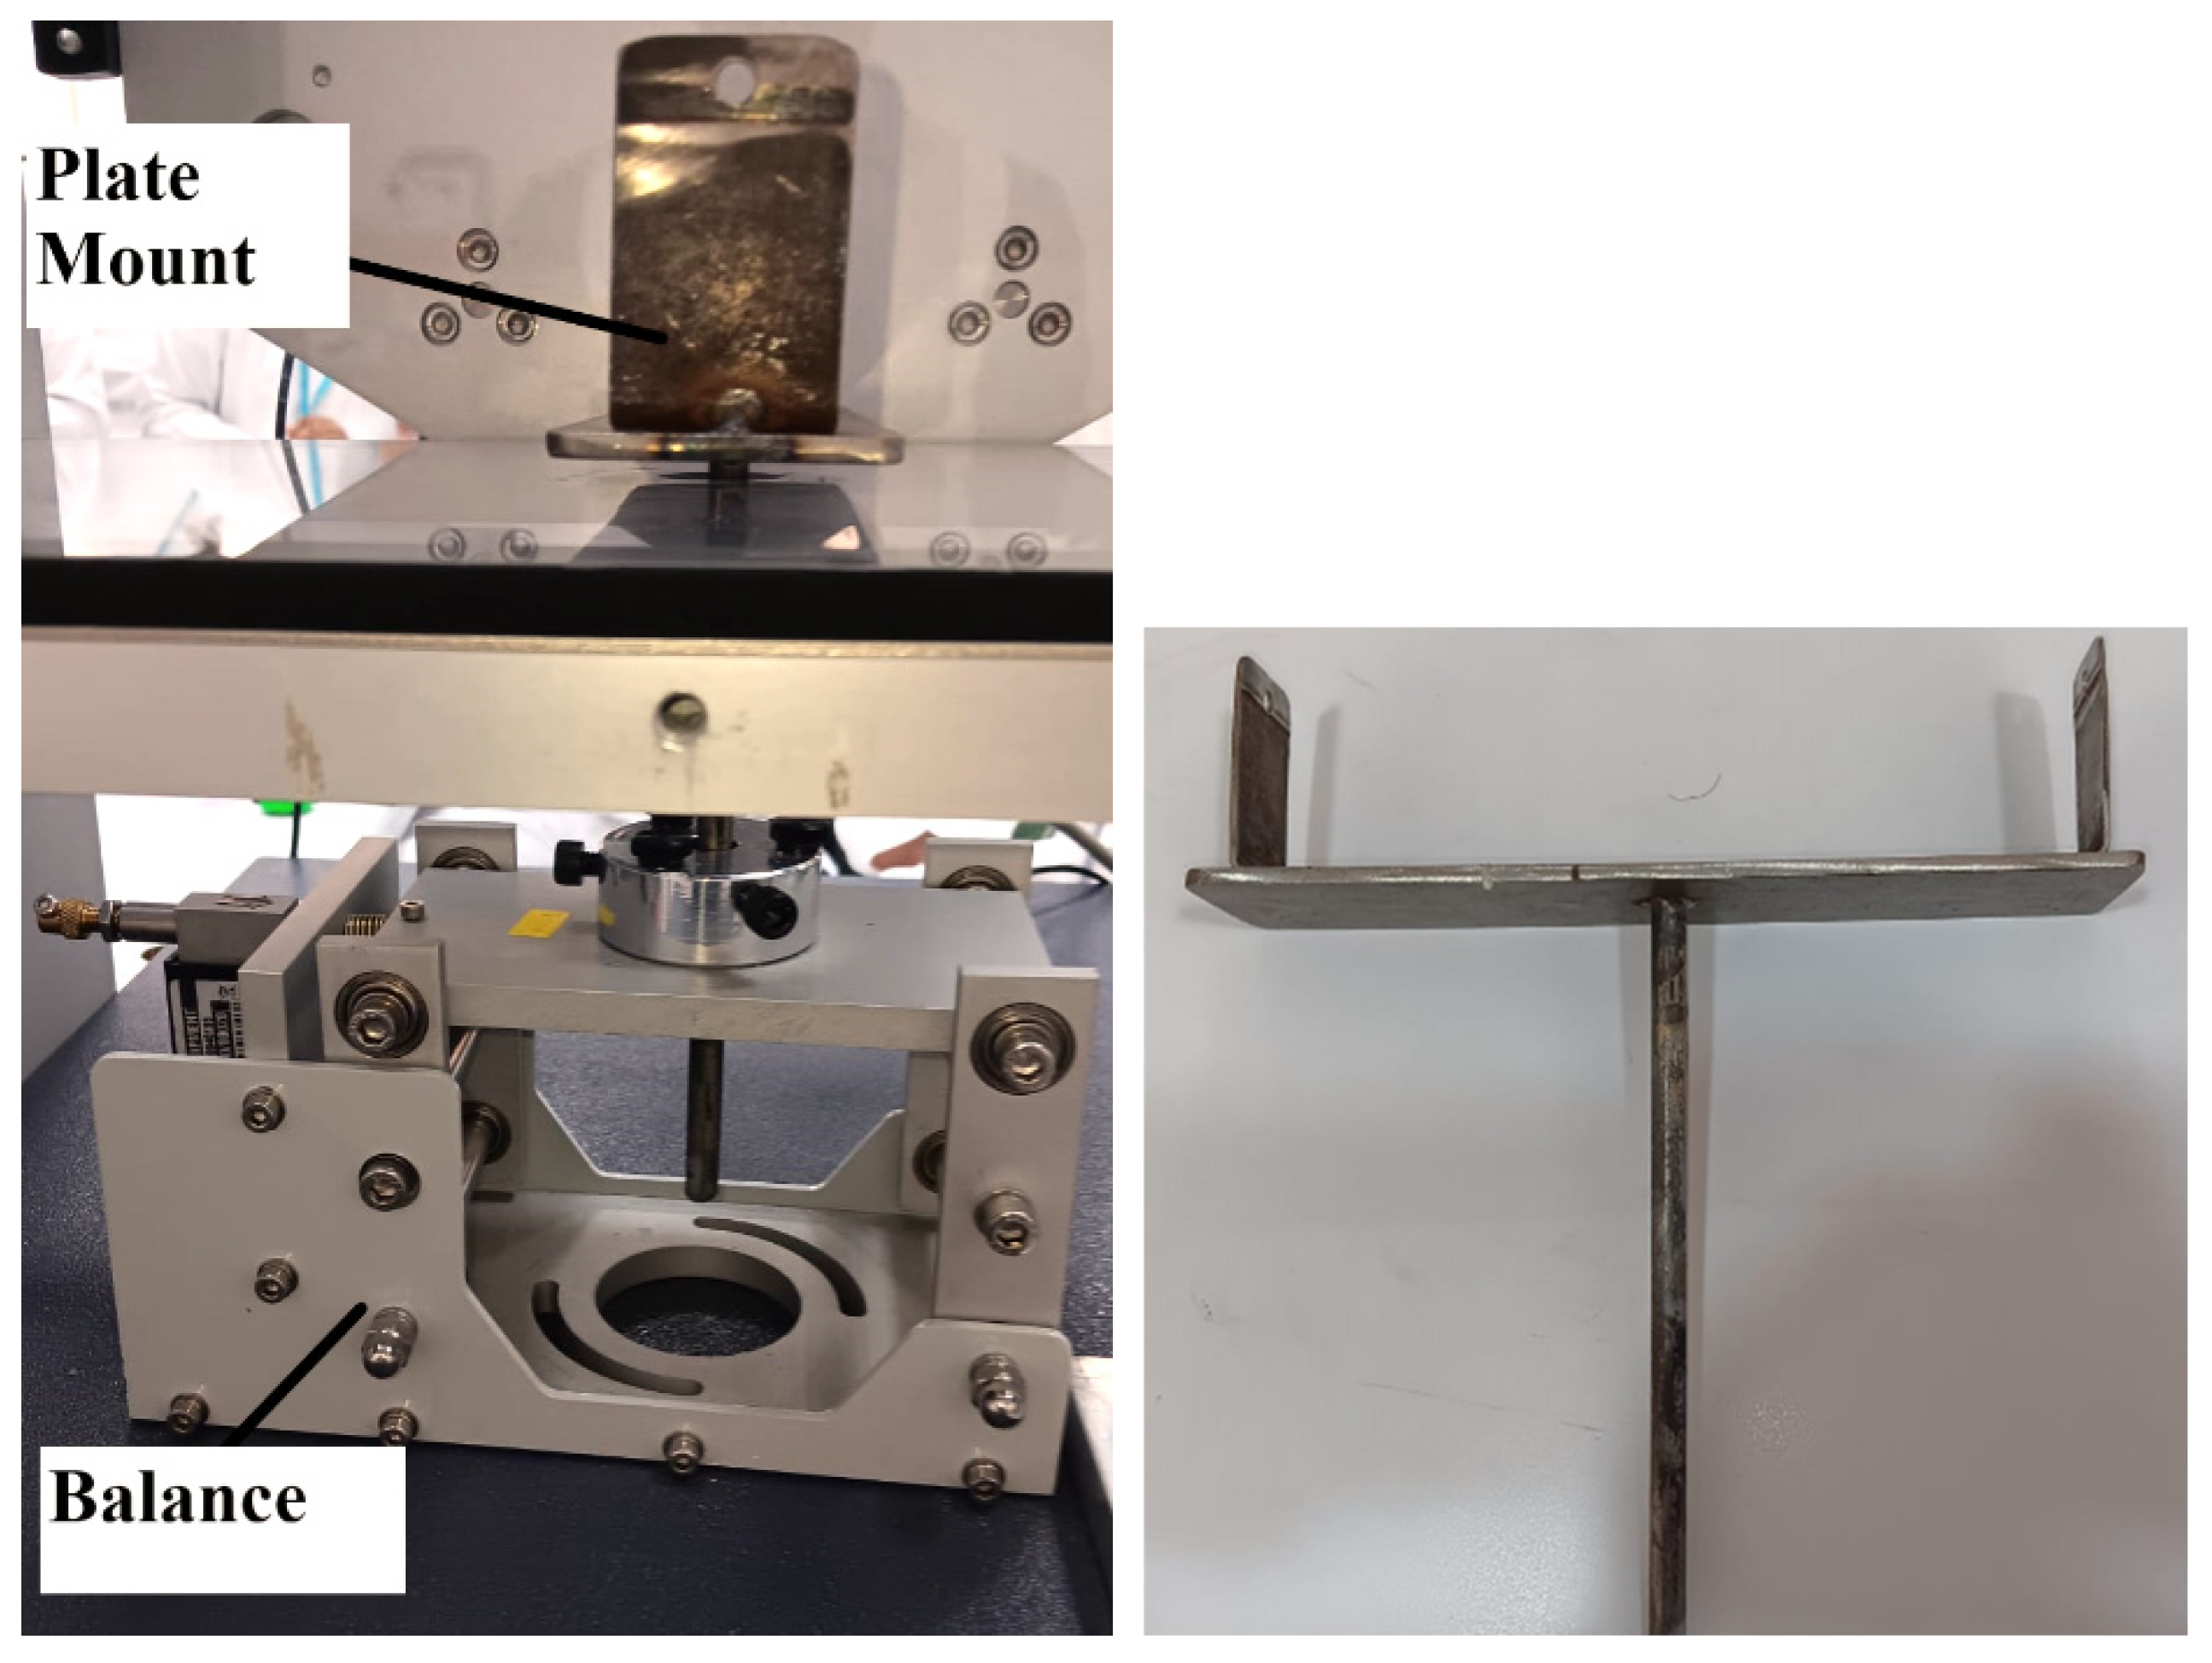
The experiments were conducted for thirteen tilt angles, ±10°, ±20°, ±30°, ±40°, ±50°, ±60°, and 90°, and two ground clearances, namely 6 mm and 18 mm or 20% and 60% of the plates’ chord length. It should also be noted that although the 90° case is not applicable in PV plants, it is examined here as reference, for comparison with isolated plates for which there is ample evidence in the literature at this particular angle. The force exerted on each plate was measured using a one-component force balance positioned just below the wind tunnel test section to minimize the influence of vibrations (Figure 2). A vertical cylindrical metallic rod, 150 mm in length and 10 mm in diameter, was clamped at one end to the balance, while the other end supported one of the four plates (Figure 2). To measure the force on each individual plate, the experiment was repeated four times, with the balance-mounted plate positioned successively as the first, second, third, and fourth plate in the series.

Figure 2.
Force balance with the plate-mount attached to it (left). Plate-mount (right).
The experiments were conducted for four free stream speeds U, namely 12.7 m/s, 18 m/s, 22 m/s and 25.4 m/s. However, it was realized that the drag coefficient was practically invariable for 18 m/s and above. The Reynolds number, Re, for U = 18 m/s, based on the plate chord length, was 3.6 × 10⁴. It is noted that Re was calculated for an air temperature of 19 °C which was kept constant by an air-cooling system, with a deviation of no more than 1 °C. The small influence of Re on the drag coefficient is attributed to the fixed flow separation lines at the sharp edges of the plates and the fact that the contribution of the shear stresses on the drag is small for this application. It is noted that according to [19] a minimum Re of 5 × 10⁴ is suggested for the experimental flow studies of sharp-edged models to secure Reynolds independent results. In [20], more details are given about the sensitivity of the mean and unsteady aerodynamic loading of sharp-edged components on Re. Nevertheless, in the current study, the examined free stream speed of 25.4 m/s corresponds to Re = 5 × 10⁴, as suggested above.
The used wind tunnel, is an open-circuit suction subsonic wind tunnel with a test-section of 305 mm by 305 mm and 600 mm long. A pitot-static tube, with an external diameter of 4 mm, was installed at the entrance of the test-section to record the incoming free stream velocity. The tube was positioned on the tunnel’s symmetry plane, 70 mm from the tunnel ceiling, to reduce the influence of the plates on its readings, especially at high tilt angles. Another pitot-static tube with an external diameter of 2 mm was installed close to the test-section exit, being outside of both the plates’ wake and the wake of the upstream pitot-static tube.
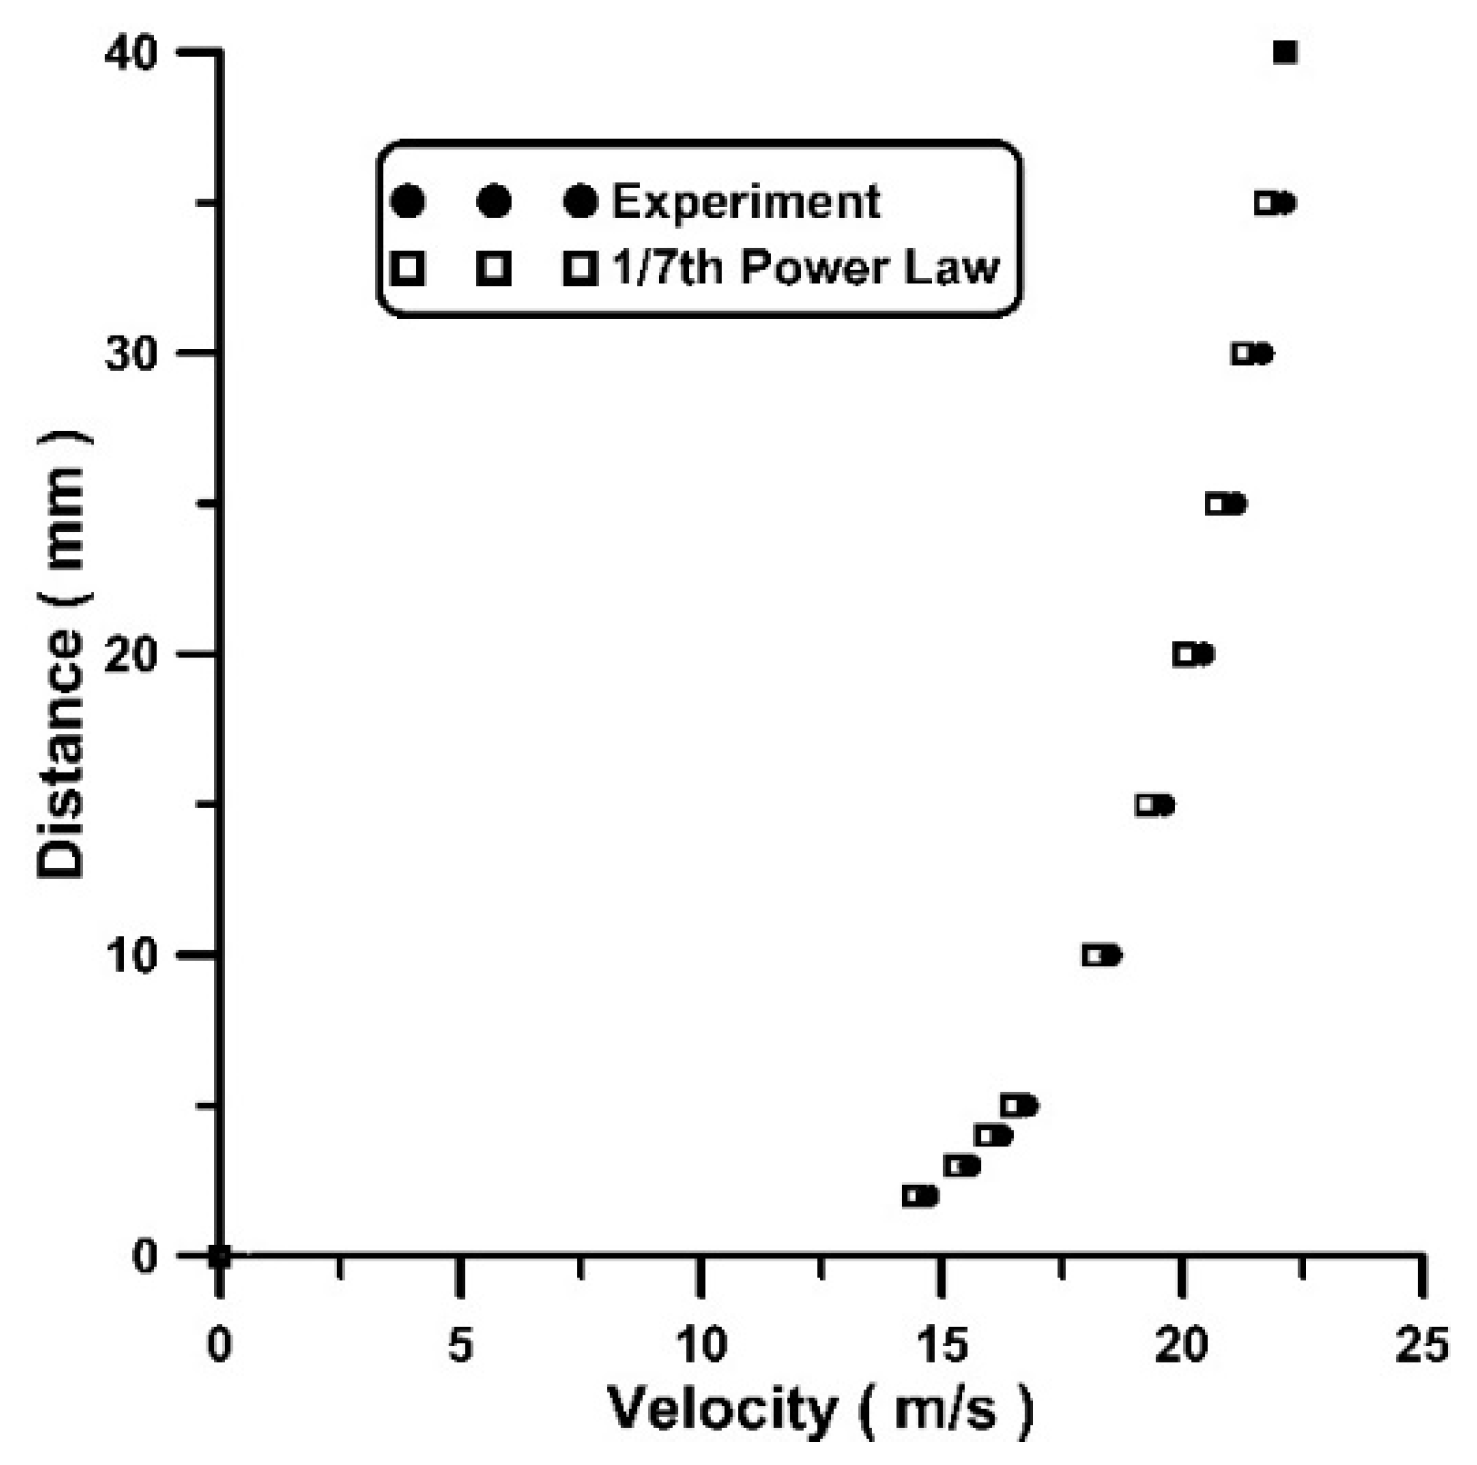
Using the second pitot-static tube, the streamwise velocity distribution over the movable horizontal metallic plate was measured at a distance of 480 mm from the plate’s leading edge, without the presence of the plate models and for a free stream velocity of 22 m/s (see Figure 3). According to [21], the measurement errors due to the presence of the tube is minimal regarding the influence of viscosity, due to the relatively high local Reynolds number (about 2000, based on the 2 mm tube’s external diameter), namely much higher than the threshold of Re = 100 which holds for the pitot tubes. Moreover, the disturbance of the flow by the presence of the tube itself, which causes a curvature of the approaching streamlines, is estimated to result in an upwards displacement of the measuring points by 20% of the tube diameter or 0.4 mm (page 645 in [21]), which was taken into account in the drawn profile of Figure 3.

Figure 3.
Boundary layer velocity profile over the movable ground floor at x = 480 mm. Experimental and 1/7th power law velocity distributions.
According to Figure 3, the air boundary layer thickness is 40 mm (1.33 chord lengths) at the examined location and the velocity distribution practically follows the 1/7th power law of turbulent flows. It is noted that the maximum distance of the highest point of the tilted plates from the horizontal metallic ground floor was 48 mm (for maximum ground clearance and a = 90°), and the smallest distance 17.5 mm (for minimum ground clearance and a = 10°). More particularly, when the drag of the first panel in the row was measured, this was located 240 mm downstream from the leading edge of the plate, where the boundary layer thickness, δ, is estimated (by employing the 1/7th power law) to be (240/480)0.8 = 57.43% of 40 mm, or δ = 22.97 mm (0.76 chord lengths), as the boundary layer thickness varies along the plate with a rate x0.8 [22]. Therefore, for U = 22 m/s, the lowest point of the first panel was located inside the local boundary layer, between 0.26δ and 0.78δ, and the highest point from 0.76δ to 2.08δ, for various ground clearances and tilt angles. The corresponding air speed at the lowest point of the panel was 0.82 U, according to the above power law. This information is crucial for interpreting the results and can be utilized as an appropriate boundary inlet condition in numerical simulations.
2.1.1. Blockage Effect
The experimental findings from sub-scaled models, like in the present work, can be applicable in full-scale applications through relevant non-dimensional numbers, like drag, lift and moment coefficients, which are based on a representative free stream velocity. Due to the limited space between the wind tunnel walls, the free stream velocity U measured at the entrance of the wind tunnel test section, does not correspond to the unlimited space of real applications, and it needs to be corrected. More particularly, the presence of the model (solid blockage) and its wake (wake blockage) cause an acceleration of the undisturbed flow around the model, as a consequence of the conservation of mass in the smaller available cross-sectional area. Applying Bernoulli’s equation, the increased speed causes a reduction in the static pressure both outside and inside the wake due to the minimal transverse pressure gradient across the wake shear layers. The latter was verified by taking measurements of the static pressure along a vertical line, which showed no significant change between the inside and outside of the wake.
For the case of the tilted flat plates, the pressure distribution in their wake is practically uniform, especially at elevated tilt angles, so that a pressure reduction (due to blockage effect) downstream of the plates is associated with an increase in drag. A remedy to this problem is the replacement of U by an appropriate higher free stream velocity, say (U corrected), considering that is responsible for the pressure distribution on the model’s surface.
A simple correction formula was suggested by (page 374, equation 10.22 in [23]):
where S is the projected area of the model on the tunnel cross-section and C is its cross-sectional area, namely C = 930.25 cm2. The blockage ratio S/C, varied in the present work from 4.6% to 8% for the isolated plate case, and from 6.1% to 9.8% for the four-plate series. Therefore, for the maximum blockage ratio 9.8%, the corrected free stream would be equal to 1.025 U, according to (1). However, the latter speed increase was proved to be quite moderate, according to the readings of the downstream pitot-static tube which recorded speeds of the order of 1.1 U outside the wake. Furthermore, drag coefficient data from the literature for isolated flat plates suggested that the corrected free-stream speed needed to be higher than that of Equation (1).
In the sixties, Maskell [24], proposed a correction formula, including the measured drag coefficient, as follows:
where is the measured drag coefficient and is its corrected value. The above (2) formula proposed by Maskell was based on an analysis of the flow field of flat plates at a tilt angle of 90°, by employing continuity and momentum equations as well as experimental data from wind tunnels of various cross-sectional areas. The factor 2.5 in (2) was suggested by Maskell for three-dimensional bodies and was adopted here. Based on (2), if the blockage ratio, for example, is 10% and the uncorrected drag coefficient is 1, the corrected free stream value is 11.8% higher that the inlet speed U. Similar increases in speed were recorded at high tilt angles by the downstream pitot-static tube as well.
2.1.2. Measurement Procedure
The drag coefficient was calculated, using as reference area, the area of the plate model A = 30 mm × 180 mm, the inlet dynamic pressure , controlled by the tunnel’s variable speed fan, and the applied drag force F, measured by a one-component force balance, as follows:
The dynamic pressure was measured by the pitot-static tube at the inlet of the test section and a differential pressure manometer, showing fluctuations within ±1.7% of the mean, based on data collected in 20 s intervals (time duration of each force measurement) and 100 Hz sampling rate. The turbulence intensity of the free stream was also recorded by using a single hot wire sensor and it was found to be 1.32%. The sampling period of 20 s was decided following a trial-and-error procedure so that the measured time-averaged force was stable. The maximum uncertainty in the drag coefficient is estimated to be ±0.05 based on repeated drag force measurements for several indicative cases. It is reminded that the drag applied on the plate support alone was measured for each case and it was subtracted from the total force (of the plate and its support). Regarding the error in the tilt angle, it is estimated to be no more than ±1.5°.
2.2. Six-Plate Set Up
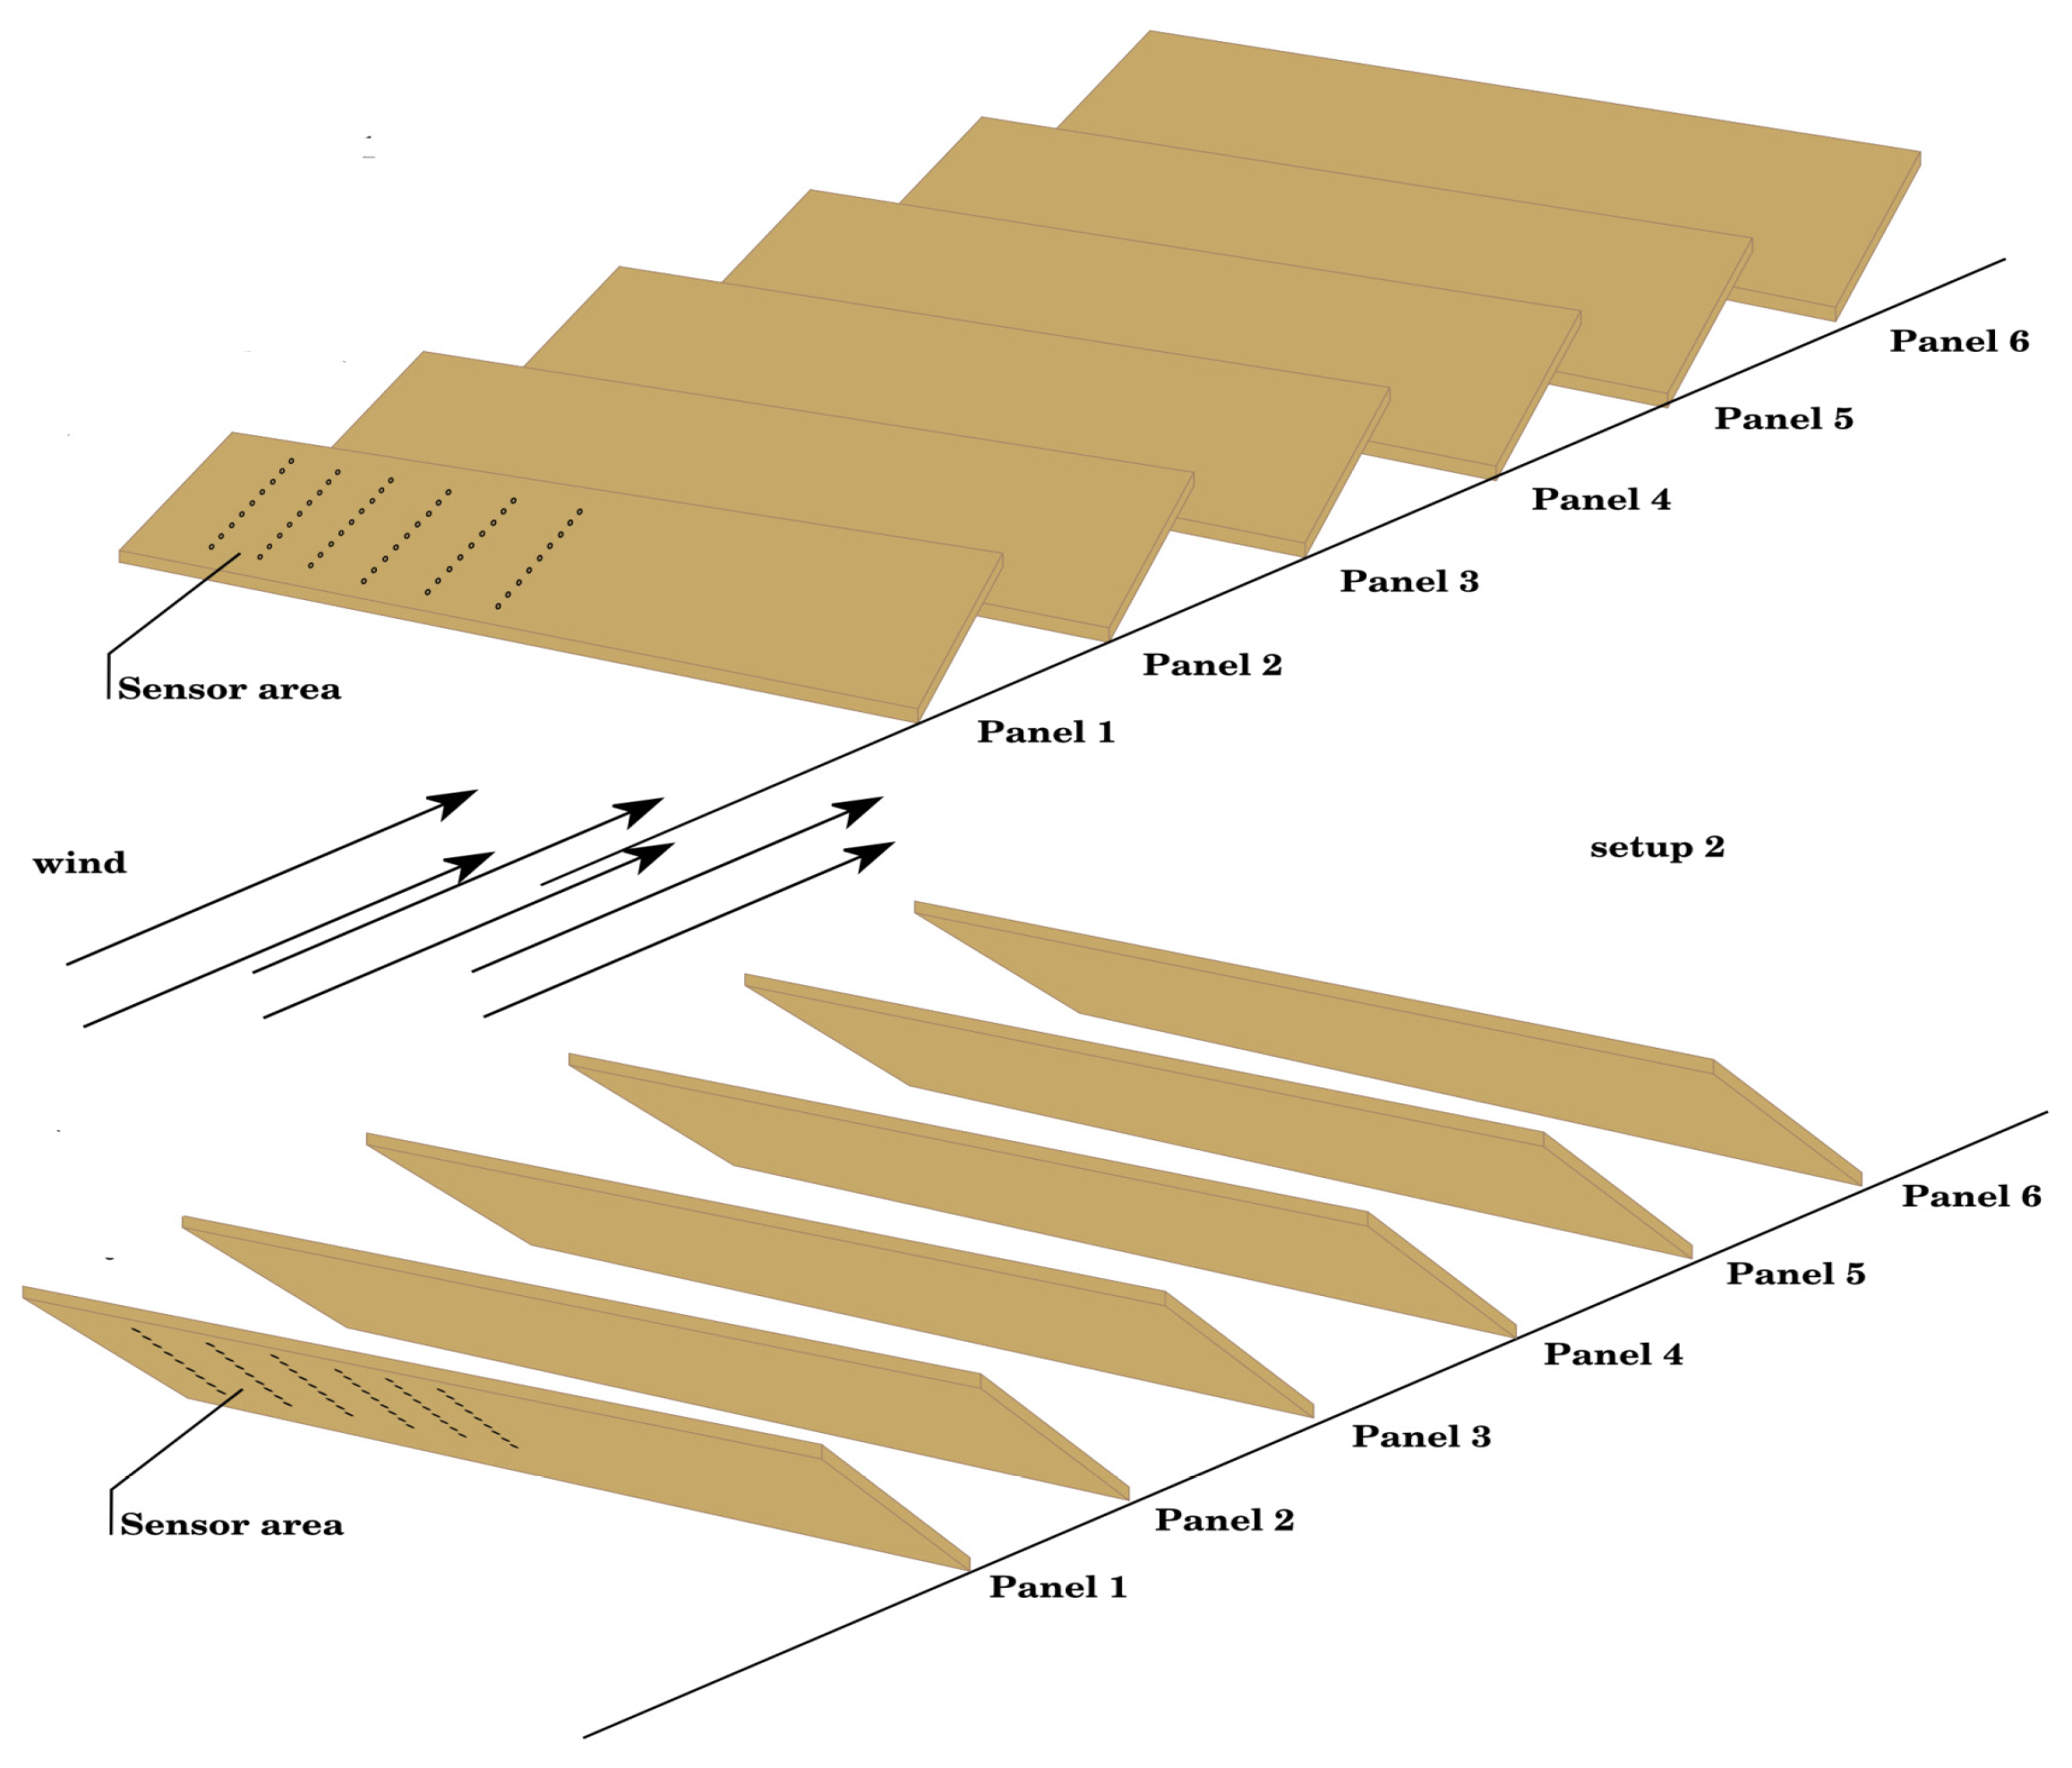
Another study was undertaken in an attempt to reveal the three-dimensional character of the flow field. In this case, the experiments were conducted in a much larger closed-circuit subsonic wind tunnel (National Technical University of Athens, Greece) of a cross-section 1800 mm (horizontal) by 1400 mm (vertical), focusing on the surface pressure distribution of six plates tilted at ±30°. The plates were made of wood, 1100 mm long, with a chord length of 200 mm (AR = 5.5). Fifty-four pressure taps were drilled on each side of a panel (108 in total), covering its half surface. Nine taps were drilled along the chord with a distance of 20 mm (10% of the chord length) at six spanwise locations, being 90 mm apart (8.18% of the spanwise panel length), starting from the midspan section. The closest distance of the taps from the panels’ edges in the spanwise direction (panel tips) were 8.18% of the span length, and from the leading and trailing edge, 10% of the chord length, respectively. The locations of the taps are shown in the schematic of Figure 4.

Figure 4.
Six-plate set up. Pressure tap locations shown with black dots. Upper part, a = +30°, lower part, a = −30°.
Each pressure tap was connected to a pressure scanner (Furness Controls, model FCS421) and the pressure p was subtracted from the free stream static pressure to determine the local pressure coefficient Cp . The six panels were installed in the test section with a distance of two chord lengths apart and a ground clearance of 20% of the chord. The free stream velocity was 25 m/s and Re = 2.5 × 10⁵. For each tilt angle (+30° and −30°) the experiment was run six times, so that the instrumented panel (with the pressure taps) was positioned at the locations of all six panels. The pressure signal was digitized with a frequency of 100 Hz and the sampling period was 15 s. It is reminded that the inlet free stream was uniform (within 2% of the mean) with a turbulence level of 0.2%, measured by a single hot-wire anemometer, and the wall boundary layers had a thickness of less than 20 mm.
3. Results
Drag force and pressure measurements on flat tilted plates were conducted in two wind tunnels for two head-on wind directions (0° and 180°). Drag measurements on a series of four plates as well as on an isolated plate were taken place in the 305 mm × 305 mm wind tunnel, varying the tilt angle from 10° to 90°. Thus, it was possible (a) to make comparisons of the present findings on a tilted isolated plate with relevant data from literature, and (b) to quantify the influence of the downstream located plates on the first wind ward plate for the case of the plate series. The drag coefficients presented below are the corrected ones, following Equation (2).
Regarding the pressure measurements, these were conducted in a larger (1800 mm × 1400 mm) wind tunnel, for ±30° tilt angles, on six plates in tandem, in order to reveal the three-dimensional character of the flow field. Due to the small blockage (4.4%) of this case, no corrections were made for the pressure coefficients.
3.1. Isolated Tilted Panel
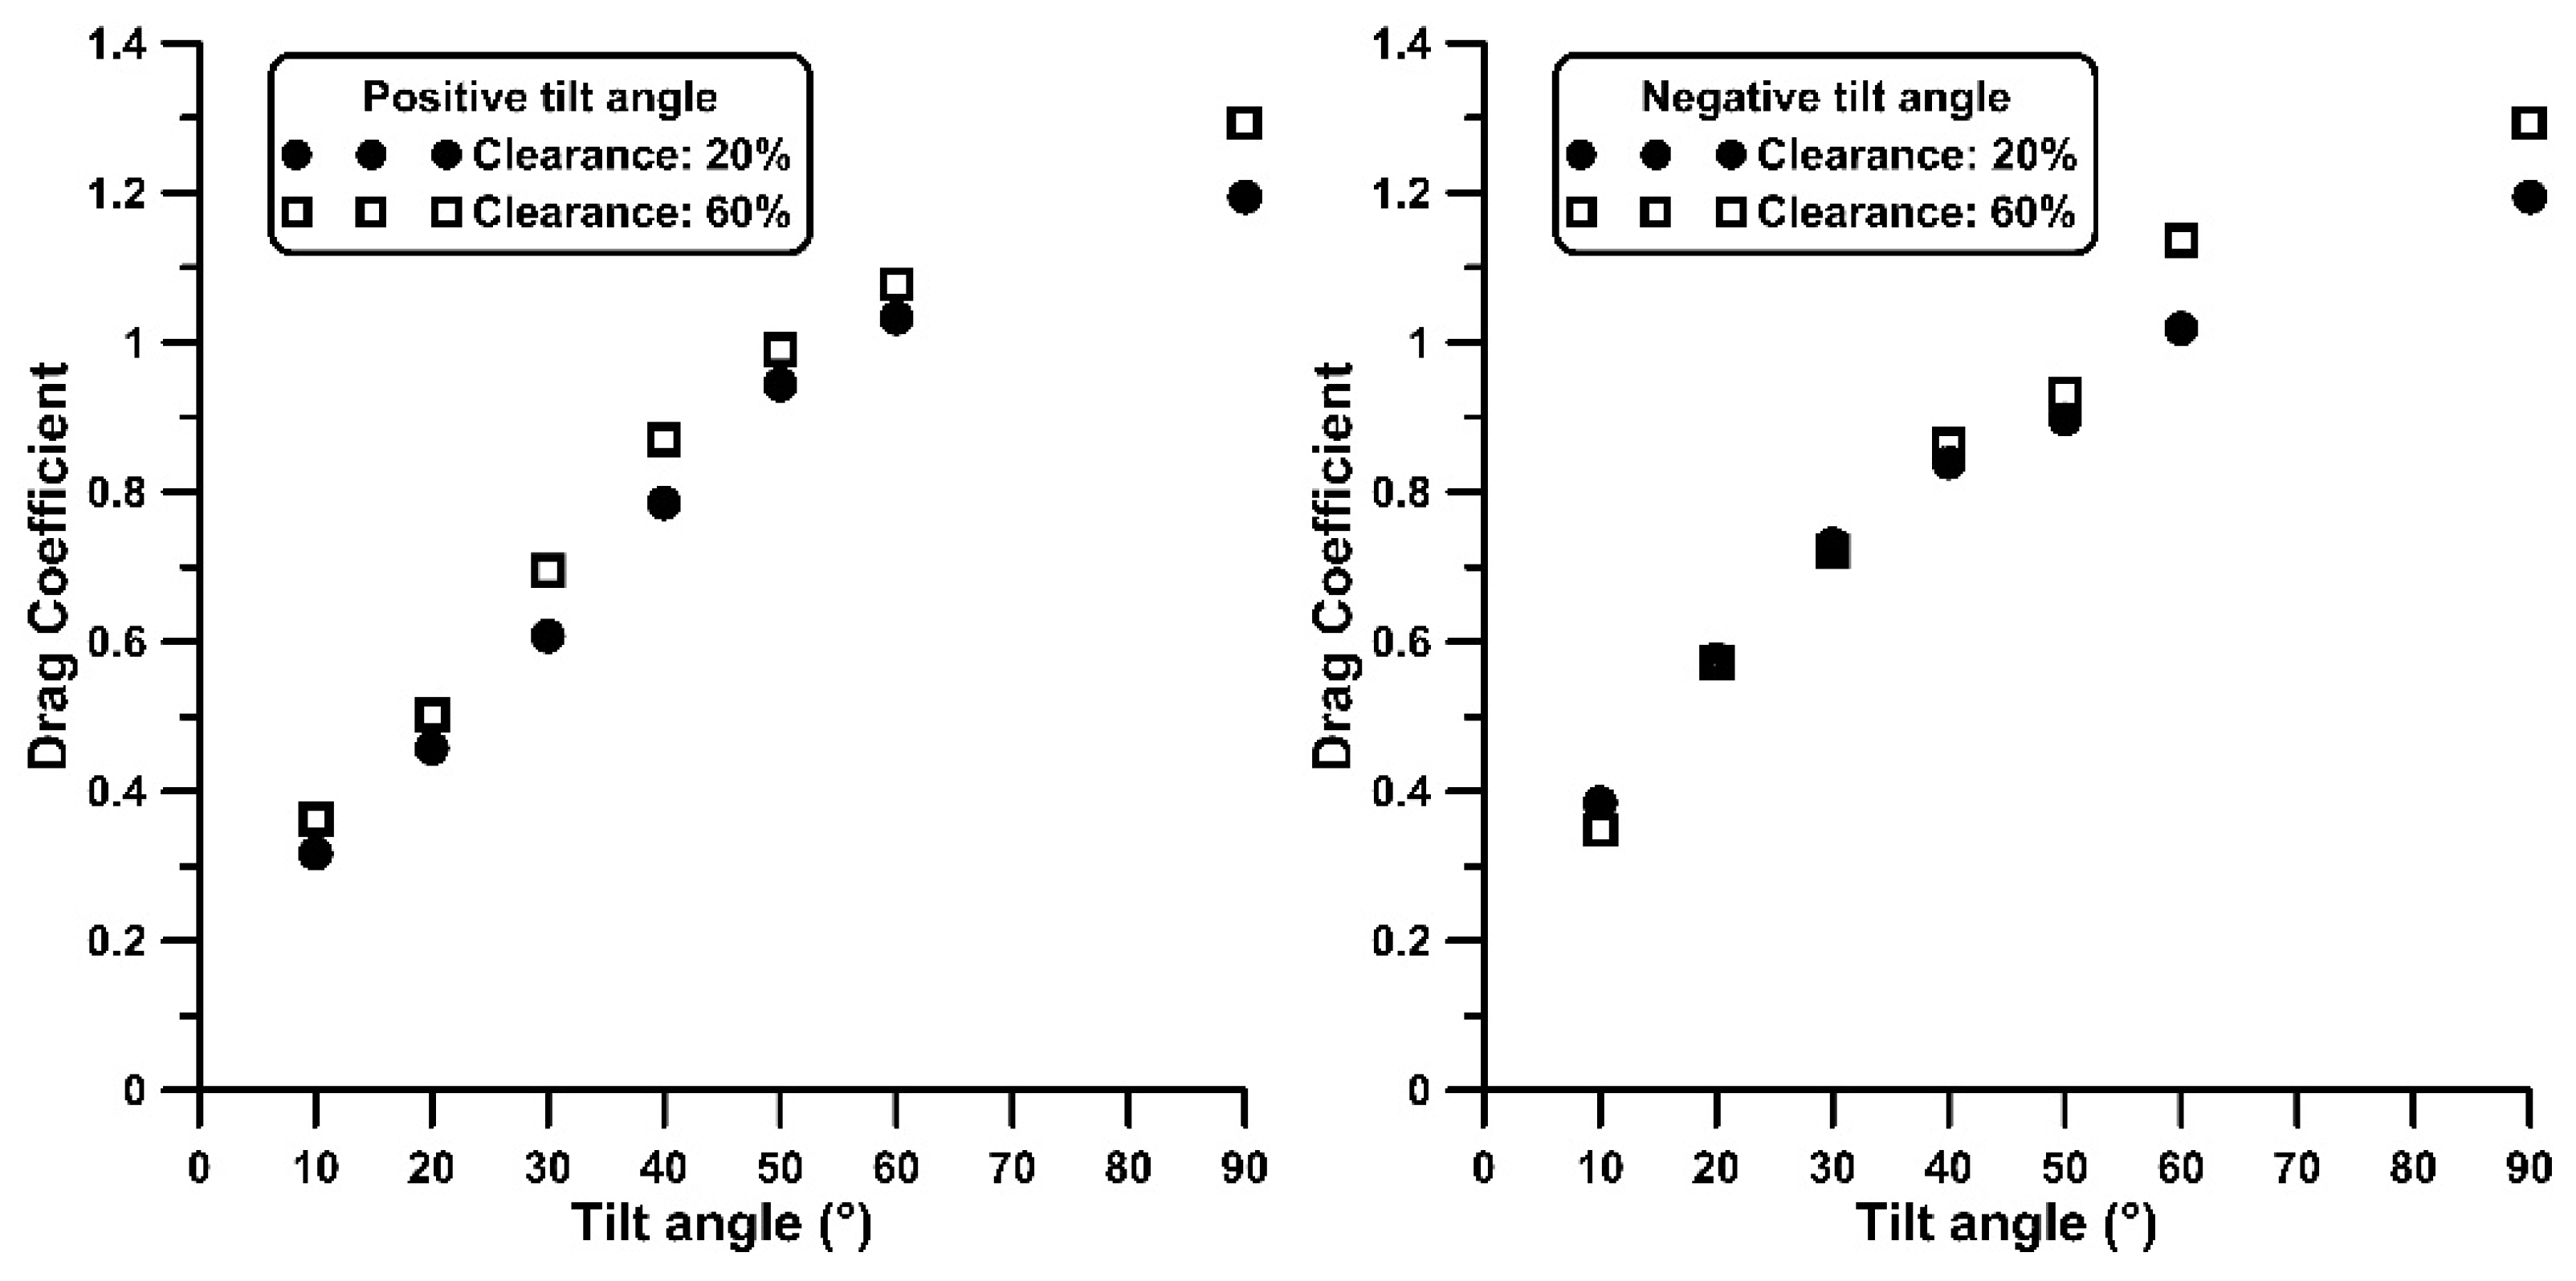
Figure 5 shows the drag coefficient of an isolated plate, for positive and negative tilt angles, in the interval 10° to 90° and two ground clearances, 20% and 60% of the plate chord length, respectively.

Figure 5.
Isolated plate drag coefficient. Ground influence at positive and negative tilt angles.
As expected, the drag increases with the tilt angle, as it happens with all types of airfoils, and maximizes at 90°, with its rate being reduced beyond 60°. In the same figure, the influence of the ground clearance on is shown to be systematic for the positive tilt angles, exhibiting higher values, up to 15%, at increased clearance.
It should be noted that values are also dependent on the panel aspect ratio, increasing monotonically with it. This parameter, often overlooked in many studies on PV panels, is crucial in determining the aerodynamic loading of tilted plates. The drag coefficient nearly doubles as the aspect ratio increases from 1 to infinity, highlighting its significant impact on aerodynamic behaviour. In the numerical work [10], the static pressures at the lee side of the plate are shown to be reduced with increasing AR, causing an increase in drag, while the length of the recirculation zone is extended downstream, covering a distance of several chord lengths. According to Fig. 3 of [8] which includes flat-plate data from various references at a tilt angle a = 90°, the drag coefficient for an aspect ratio of 6 (the same AR as in the current work) is shown to be between 1.15 and 1.25. For the same angle (a = 90°), the following formula is proposed in [8]:
which for AR = 6, = 1.199 like that measured here ( = 1.195) for the 20% clearance case, and 7.9% lower for the 60% clearance ( = 1.294). Nevertheless, as it is explained in [8], the authors express their concern whether the data of some references, which they used to end up with the above formula, were corrected or not due to the blockage effect. In another experimental work [25], for AR = 6 and a = 90°, = 1.22, for Re = 1.14 × 10⁴ (Table 1, [25]). In the latter work, the influence of the tip vortices is shown to be significant for tilt angles between 30° and 60°, causing an increase in drag for these angles, especially for small aspect ratio plates, namely for AR < 4. In [14], it is mentioned that the tip vortices at the panel edges are reduced in strength for AR above 2, causing a reduction in the stall angle and an increase in drag.
In contrast to the positive tilt angles for which increases systematically with the ground clearance, its influence is weaker when the angles are negative up to a = −30°, as shown in Figure 5. However, for a = −60°, is about 10% higher compared to the 20% clearance. It is also interesting to note that the curve exhibits a discontinuity of its slope between −40° and −60°, showing a local minimum. A consequence of the latter slope change is that the curves for the positive and negative angles cross each other (Figure 6).
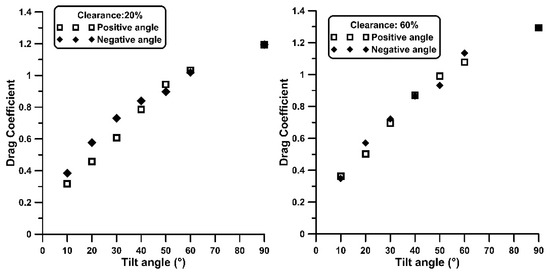
Figure 6.
Isolated plate drag coefficient. Comparisons between positive and negative tilt angles for two ground clearances.
Therefore, when the clearance is 20%, the values for the negative angles are higher (up to 25%) compared to the positive, up to a certain tilt angle. However, a further increase in the tilt angle, the reverse appears. This asymmetry of the drag variation, between the positive and negative angles, has been predicted in (Miller and Zimmerman, 1979) [26] employing a panel method for the simulation of the plate’s separated shear layers, and doublets to satisfy the no penetration condition on the ground plane. More particularly, in Fig. A-26 of [26], where the variation is presented versus the tilt angle in the interval 0° to 180°, it is shown that when the plate approaches the ground, its value becomes smaller for the positive angles compared to the negative angles.
The higher values of the negative tilt angles were also measured in [7] for an isolated tilted plate, with a 50% clearance (Table 2, [7]). Similarly, in Fig. 4.4 of [14] for a flat plate of AR = 2 and 20% clearance, the value is shown to be 0.45 for a = 30°, and 0.60 for a = −30°, namely 33% higher. For a = 30° in the present work, similar differences were recorded for , namely 0.60 and 0.73 (or 21.6% increase), despite the higher values which are probably attributed to the panel larger aspect ratio. However, for the larger ground clearance of 60%, the difference between the positive and negative angles is reduced, as shown in Figure 6 and verified in [14].
3.2. Four Plates in Tandem–Drag Measurements
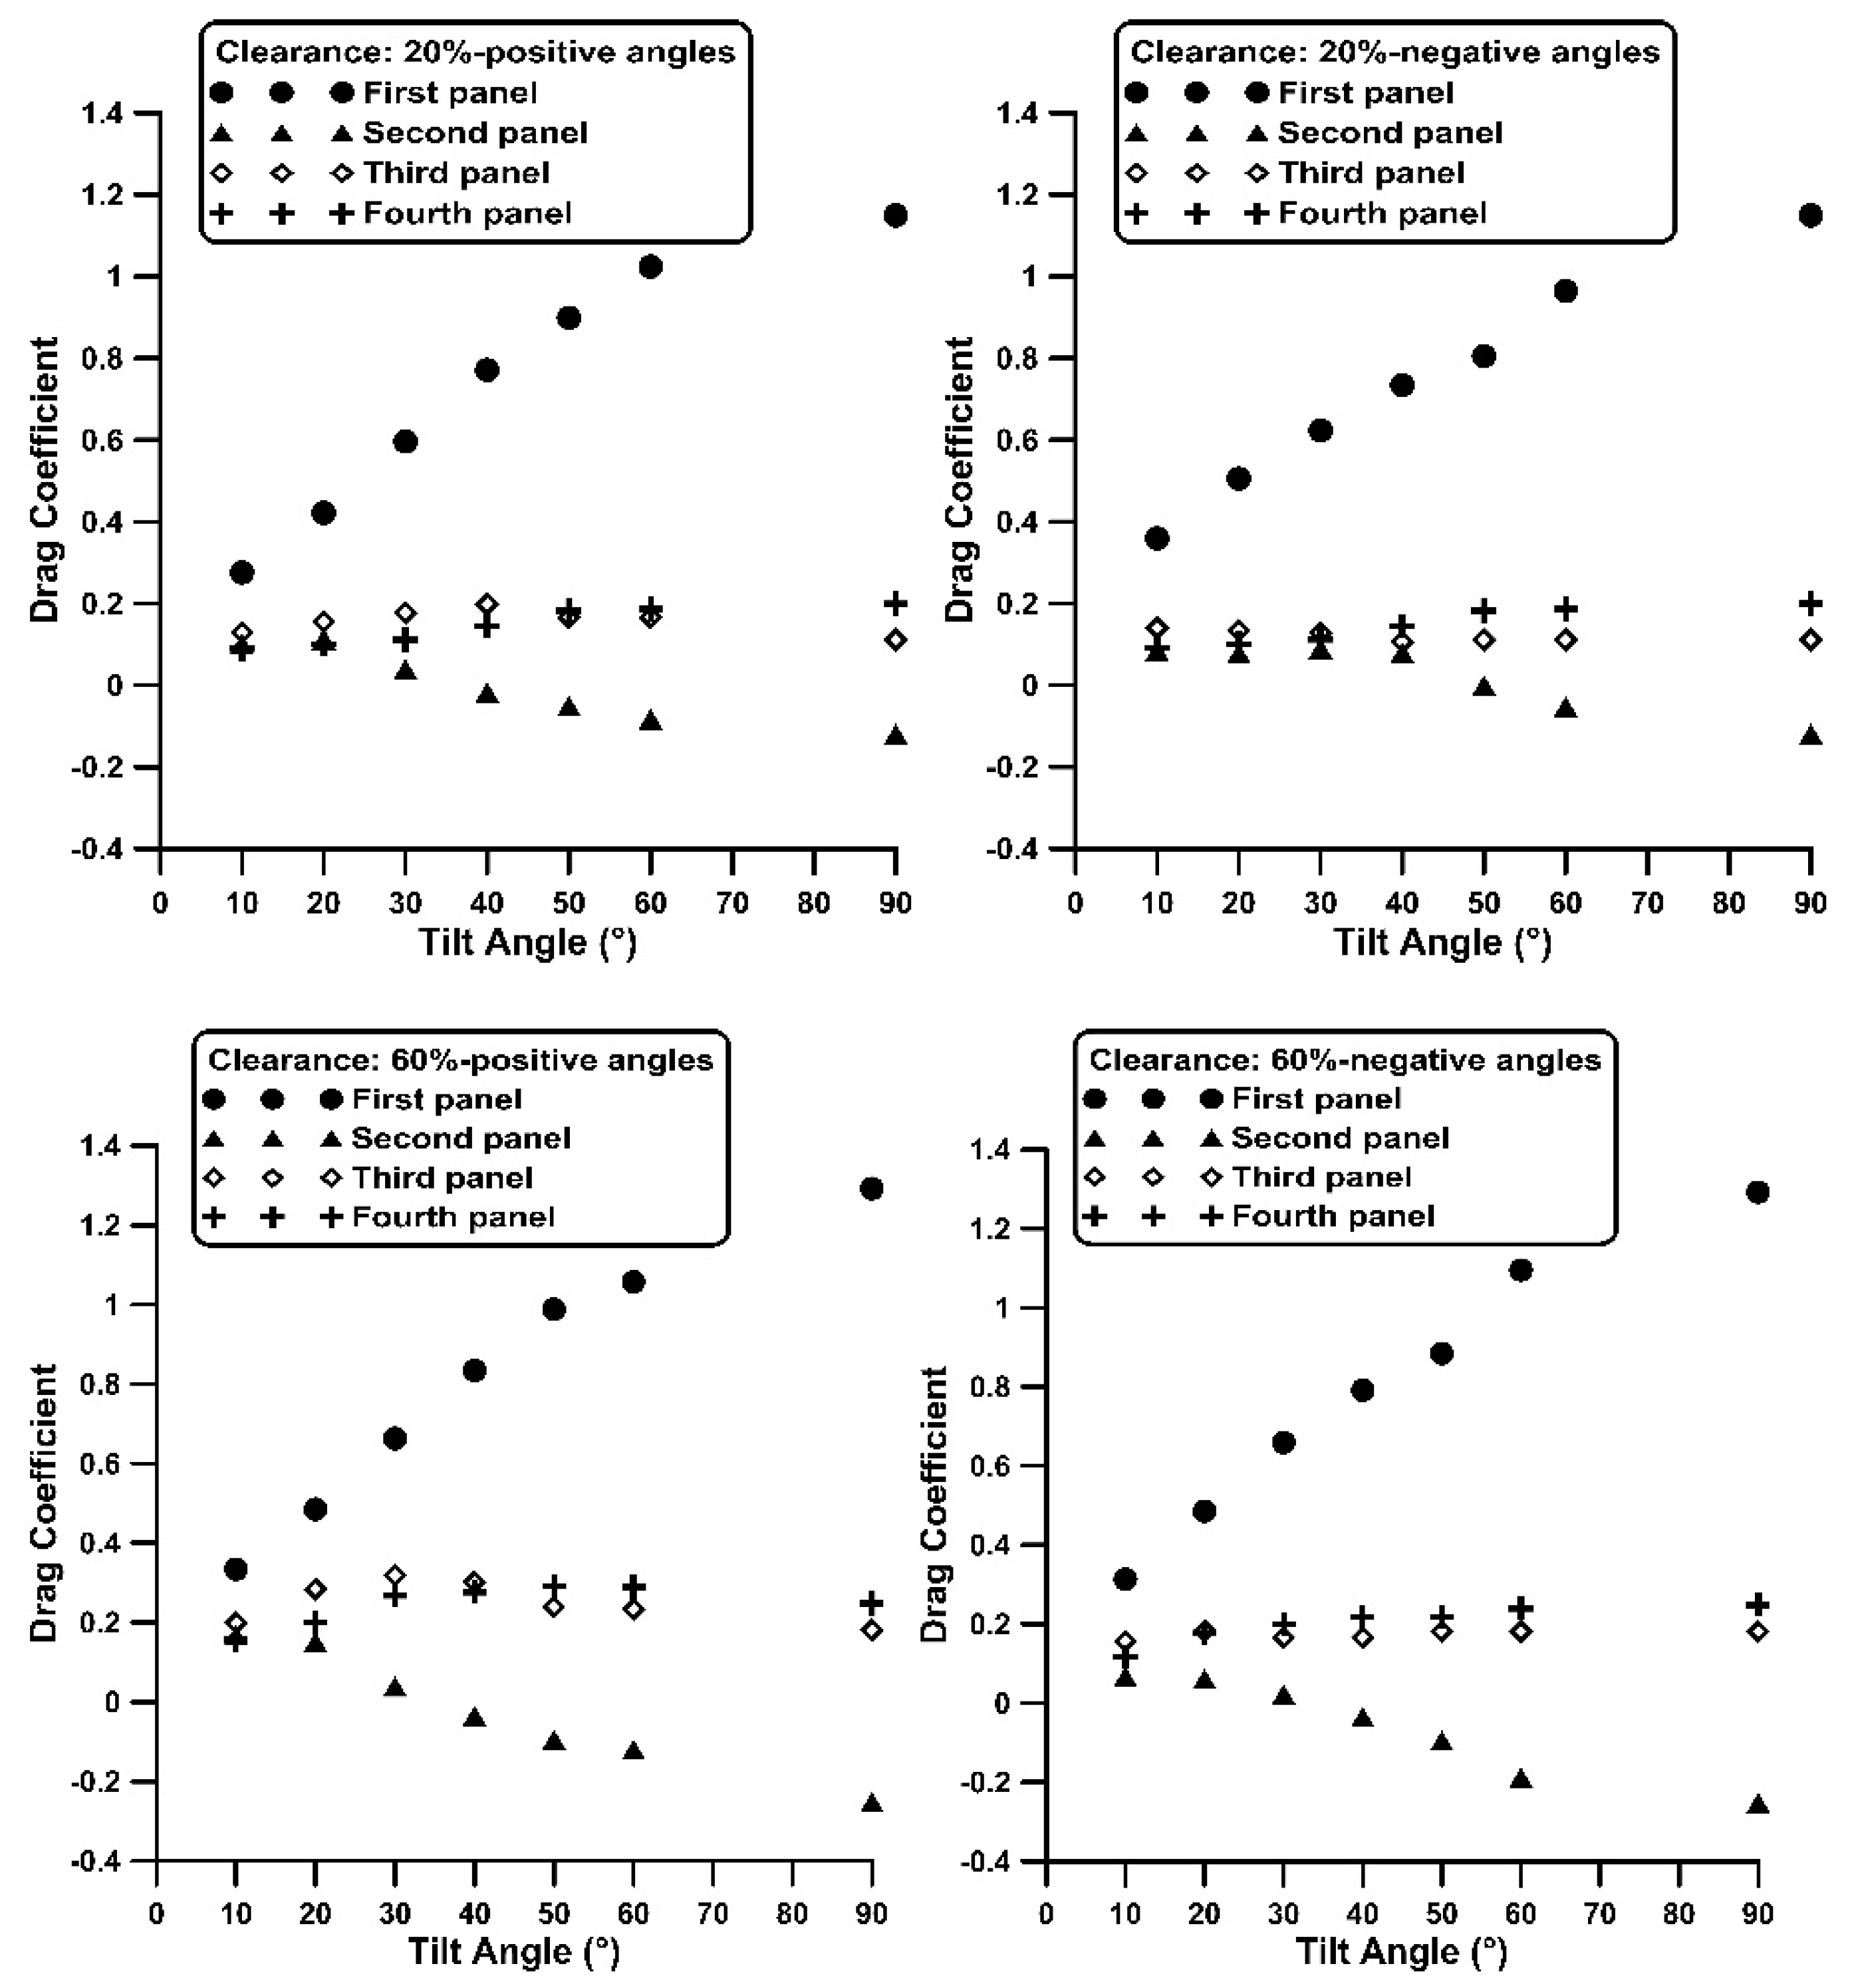
In the case of four plates–panels in tandem configuration, with a longitudinal distance of two chord lengths between adjacent plates (leading edge to leading edge distance), the drag coefficient of the first windward plate is maximum, while in the second it takes the smallest values, as depicted in Figure 7. The of the first plate increases with the tilt angle, like in the isolated plate (apart from lower values), in the second there is a tendency to be reduced with the plate inclination, taking even negative values, whereas in the third and fourth plate, the , variation is small, with its values being between that of the first and the second panel. In the first panel, varies approximately from 0.30 to 1.25 for all the examined tilt angles and clearances. For photovoltaic applications where the maximum tilt angle is 60° (corresponding to a latitude of 60°), the for the first plate takes a value of about 1 for the 20% clearance, and 1.1 for the 60% clearance.

Figure 7.
Four panels. Drag coefficient of each plate versus tilt angle and ground clearance.
The drag coefficient of the second plate varies in the interval −0.25 to +0.20 for the examined tilt angles, whereas of the third and fourth plate, from 0.10 to 0.35. Therefore, the variation interval of the first plate is twice that of the second and four times of the third and fourth for angles 10° to 90°.
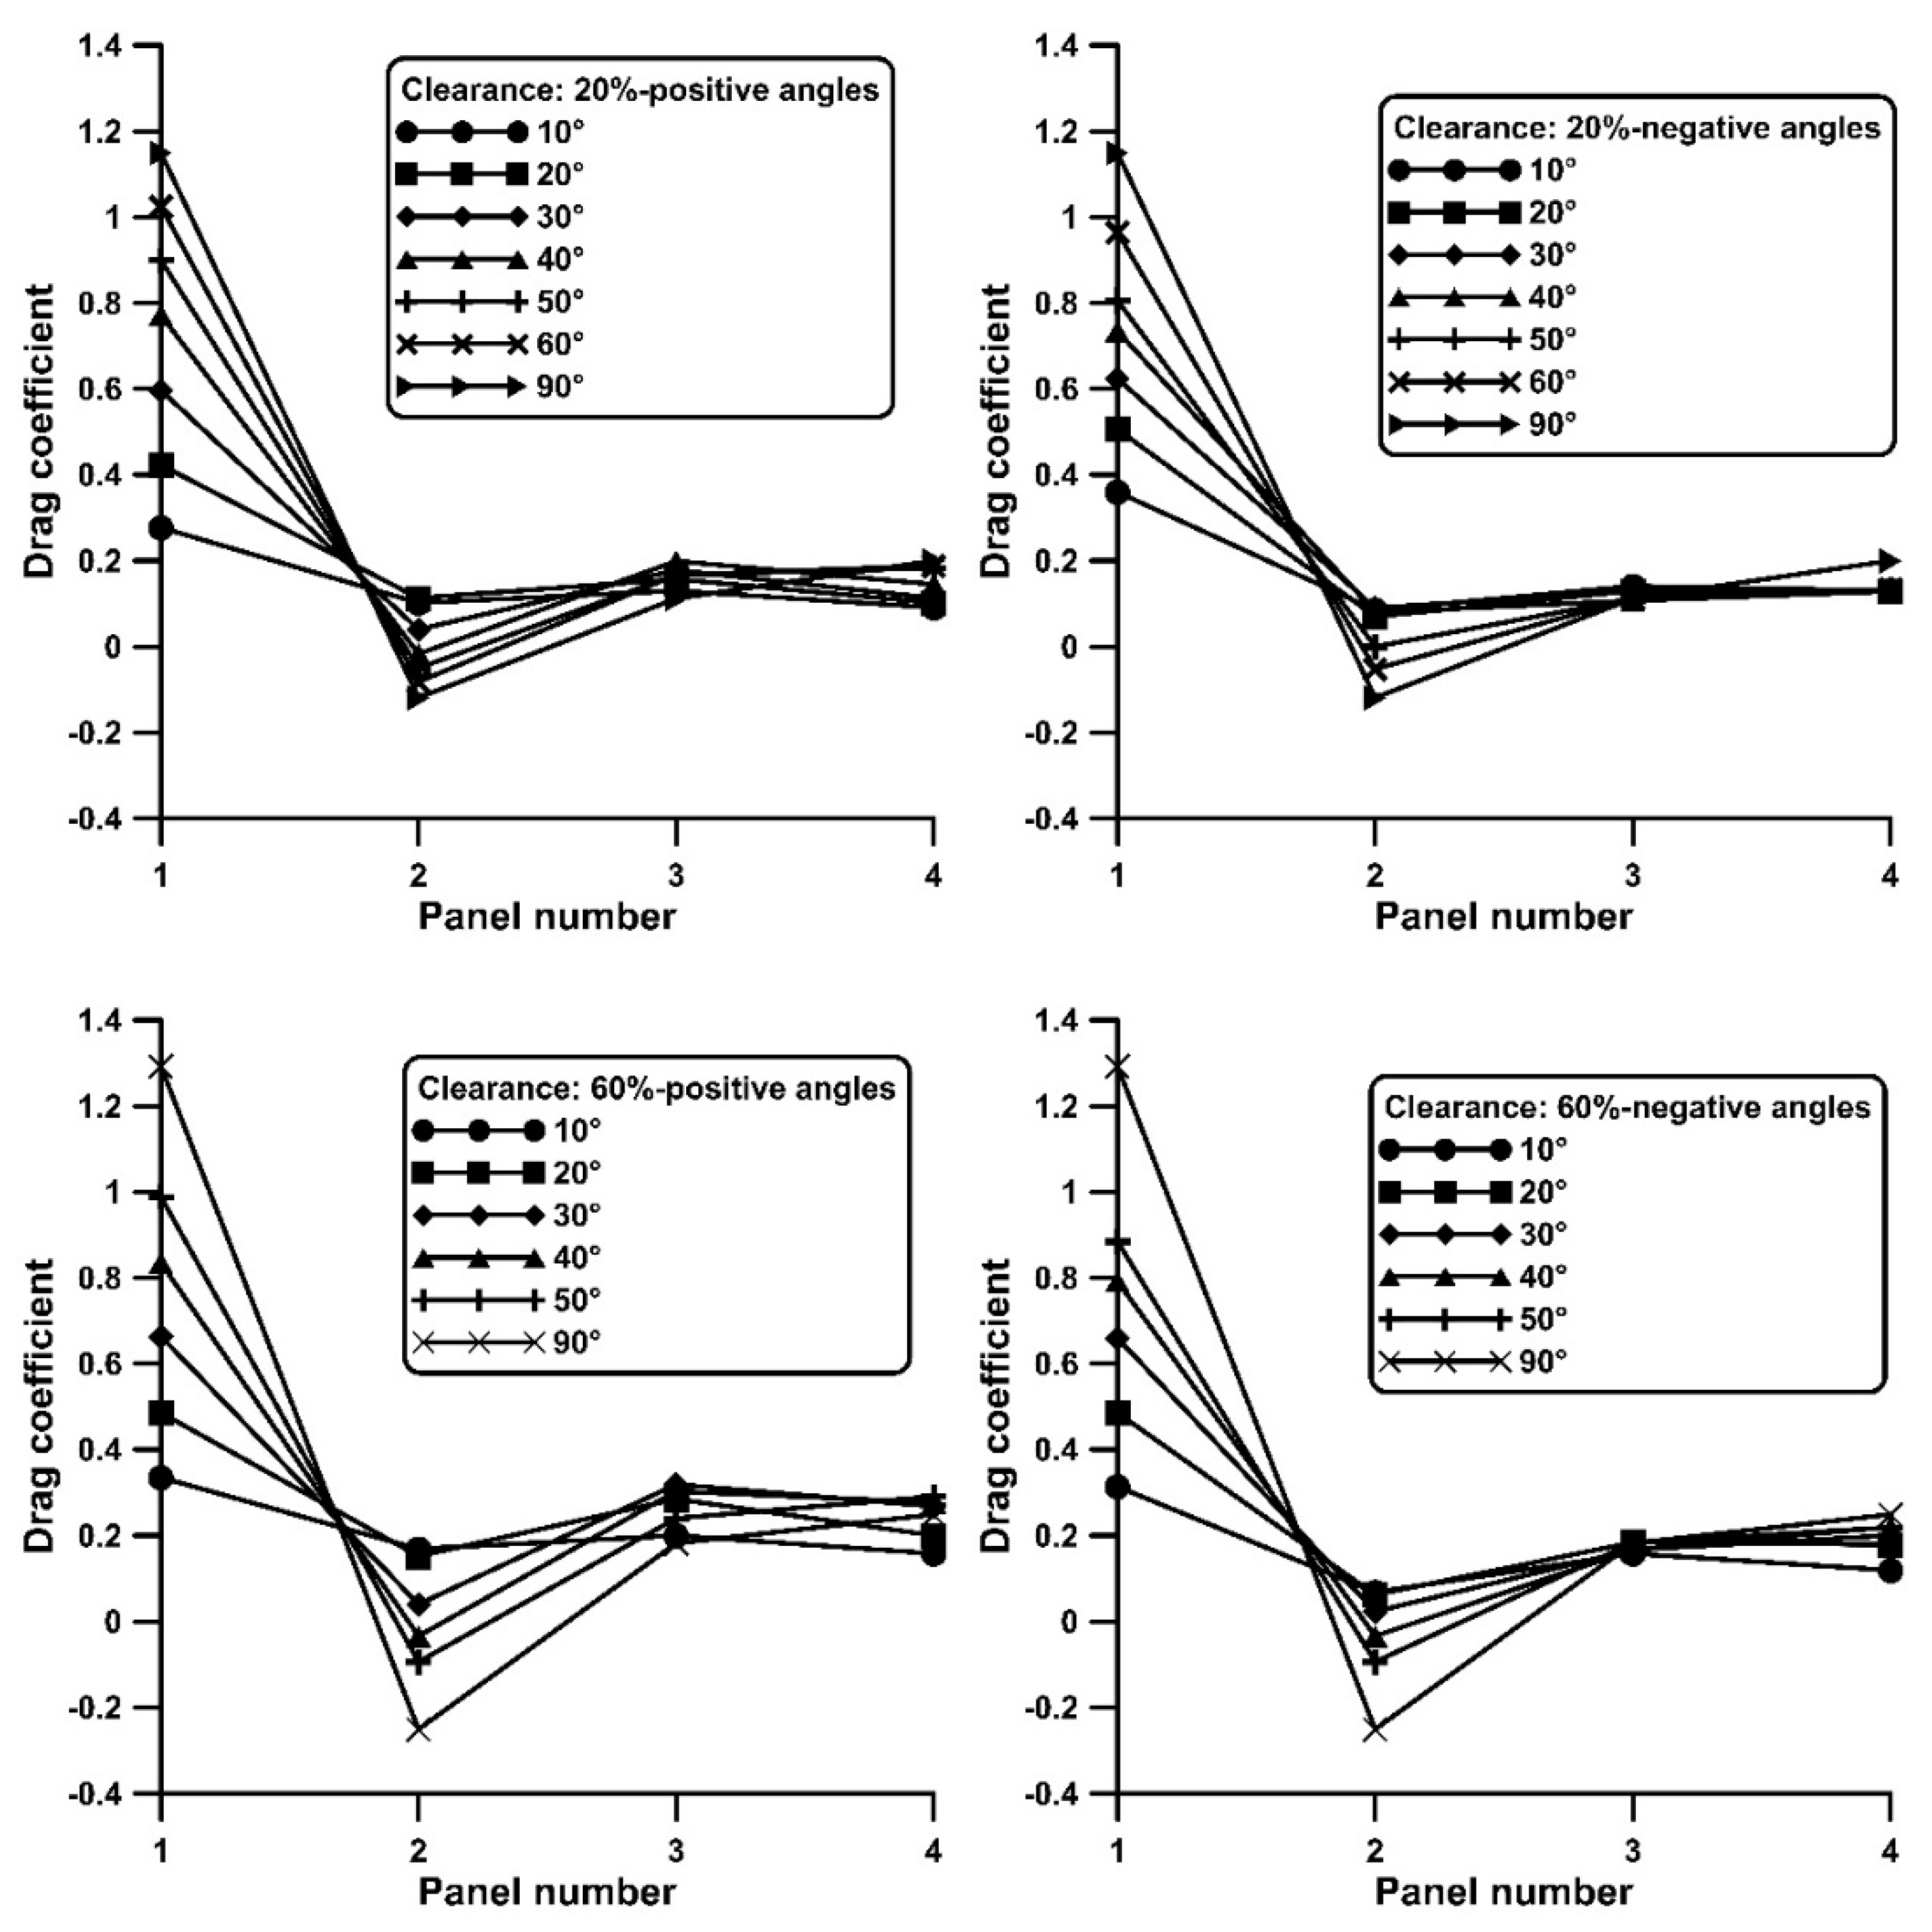
The small values of the second plate are due to the sheltering effect of the wake of the first plate as the fluid is retarded. Moreover, the small static pressures in the lee side of the first plate, influences the drag of the second, changing its sign at high tilt angles. Similar variation in the has been reported by several experimental and computational studies. For example, in the experimental work of [5], where the drag was measured (based on pressure measurements) in a number of tilted panels, the drag force dropped largely in the second panel, and after its small recovery in the 3rd and 4th, it remained practically invariant up to the 10th panel. An increase in the longitudinal distance of the panels was also reported to be associated with an elevation of the values for all downstream panels. This behaviour is explained in the numerical work [27] in which the pressure distribution between four panels in a row is presented for various values of their longitudinal spacing. Namely, for the smallest distance, low static pressures appear in the passage between the first and the second panel, whereas increasing this distance, low static pressures appear only at the lee side of the first plate, thus elevating the values. Figure 8 shows the variation in the Cd values per panel for the examined tilt angles.

Figure 8.
Four panels. Drag coefficient along the plate series versus tilt angle and ground clearance.
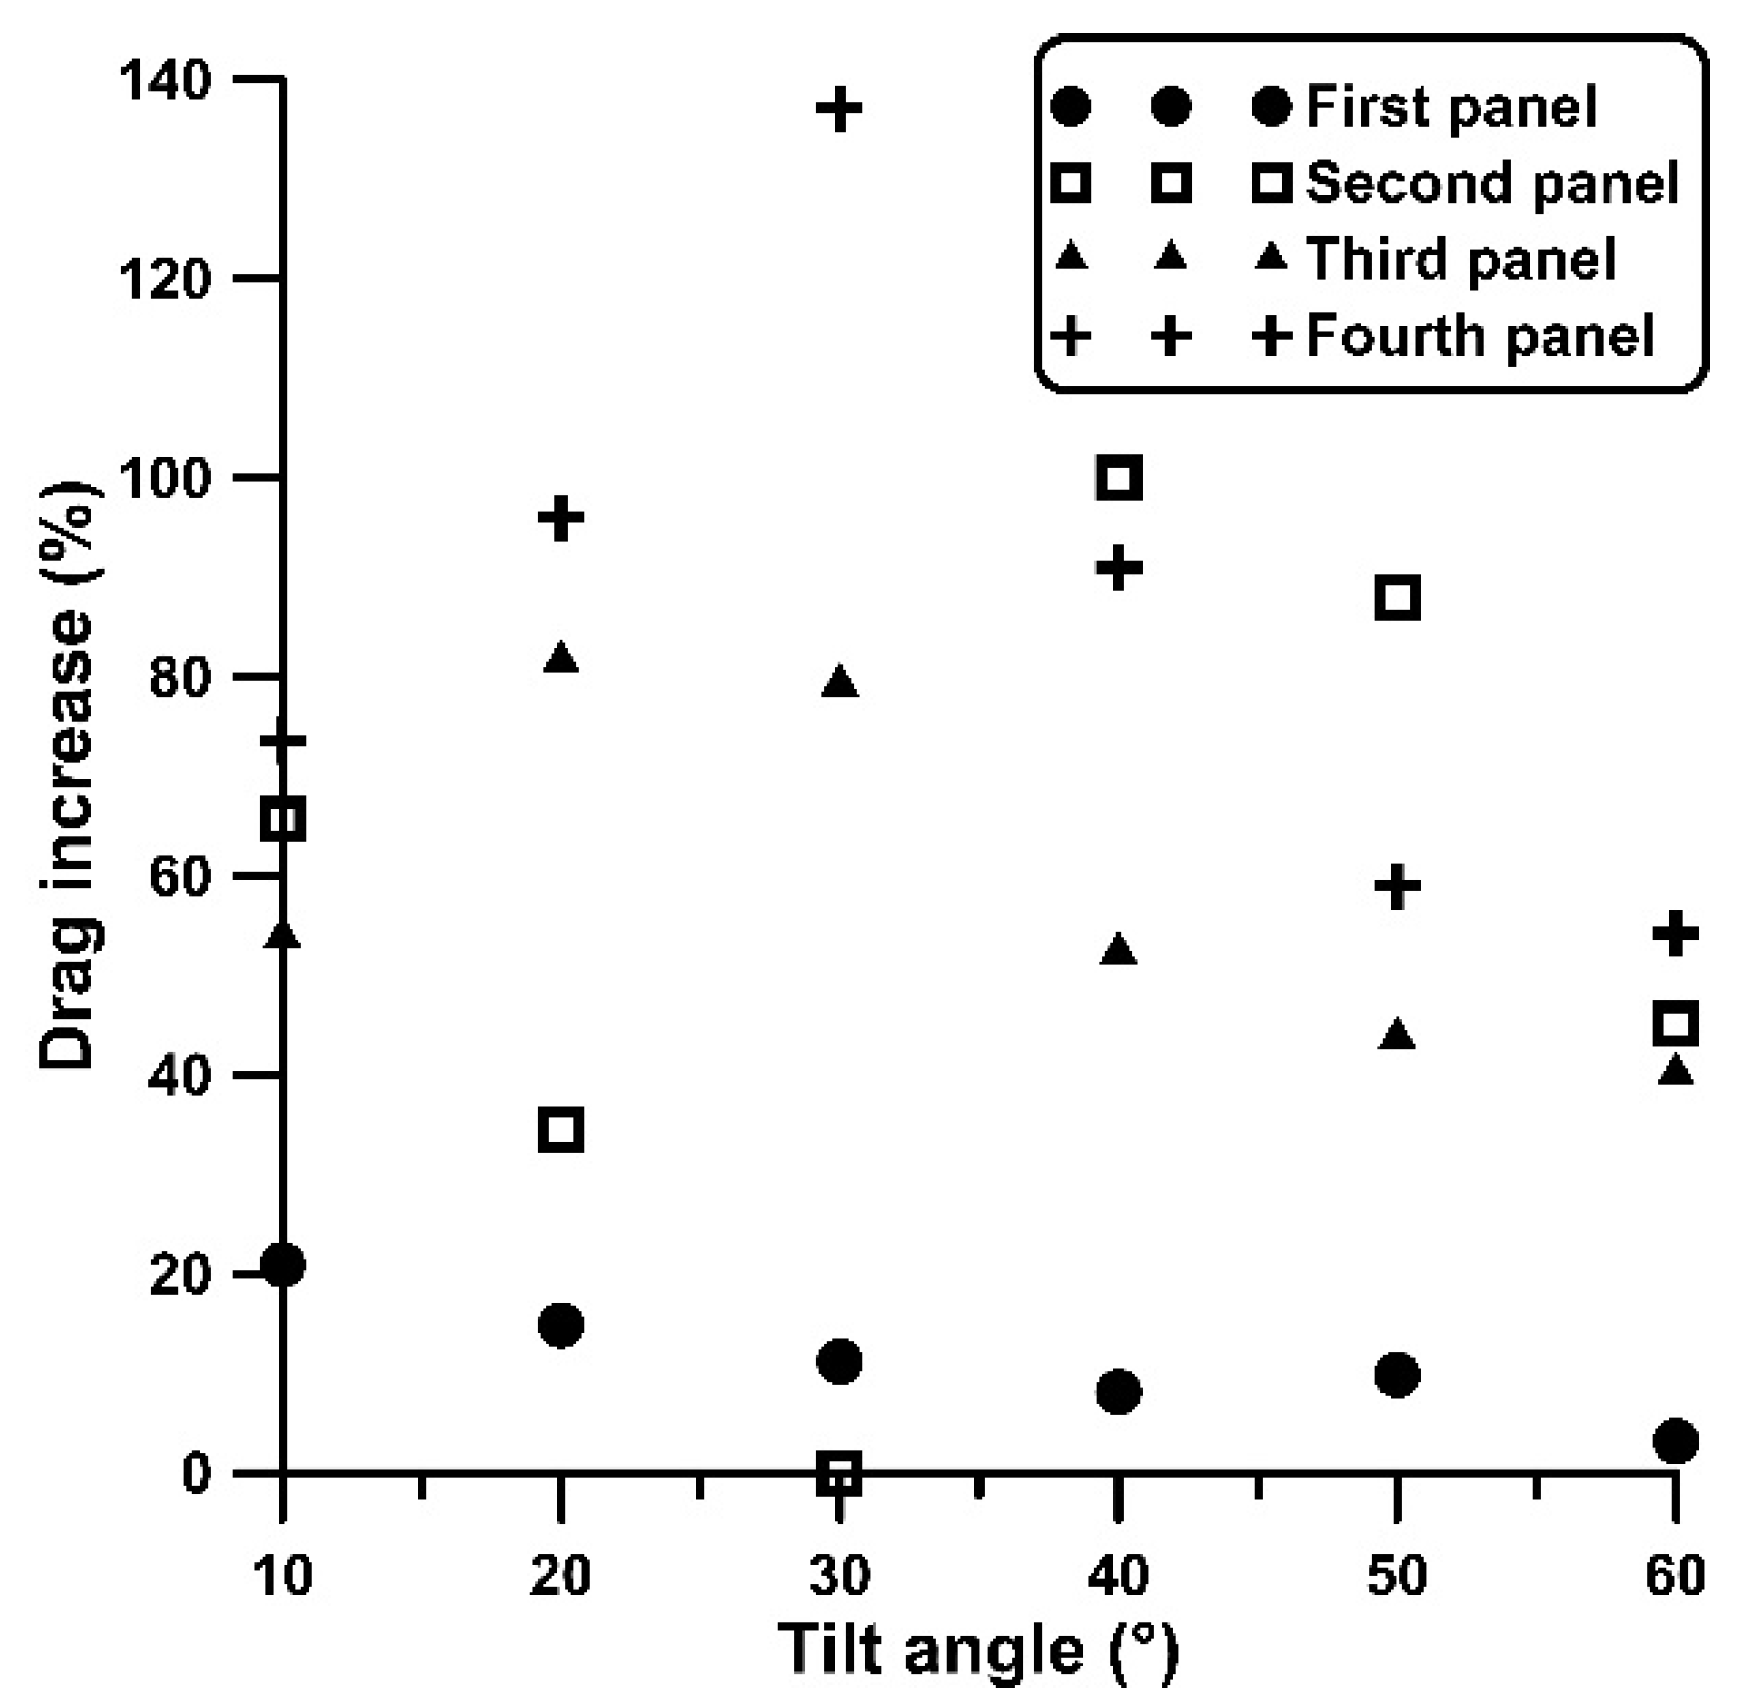
It is interesting to note in Figure 8 that the ground clearance influences predominantly the loading of the downstream plates rather than the first. Especially, when the tilt angle is positive (0° wind direction), the drag is elevated more than 40% in the latter plates with increased clearance, while in the first plate, the increases no more than 20% (see Figure 9).

Figure 9.
Drag increase (%) due to increased ground clearance (from 20% to 60%) for 0° wind direction.
The drag on the first plate is at least twice of the rest and especially, compared to the second, its drag becomes, in some cases, even twenty times larger (e.g., at a = ±30° and ±40°). By increasing the tilt angle, the drag difference in the first plate from the rest becomes larger due to the fact that the of the first plate increases, the of the second decreases, while that of the third and fourth plate changes slightly.
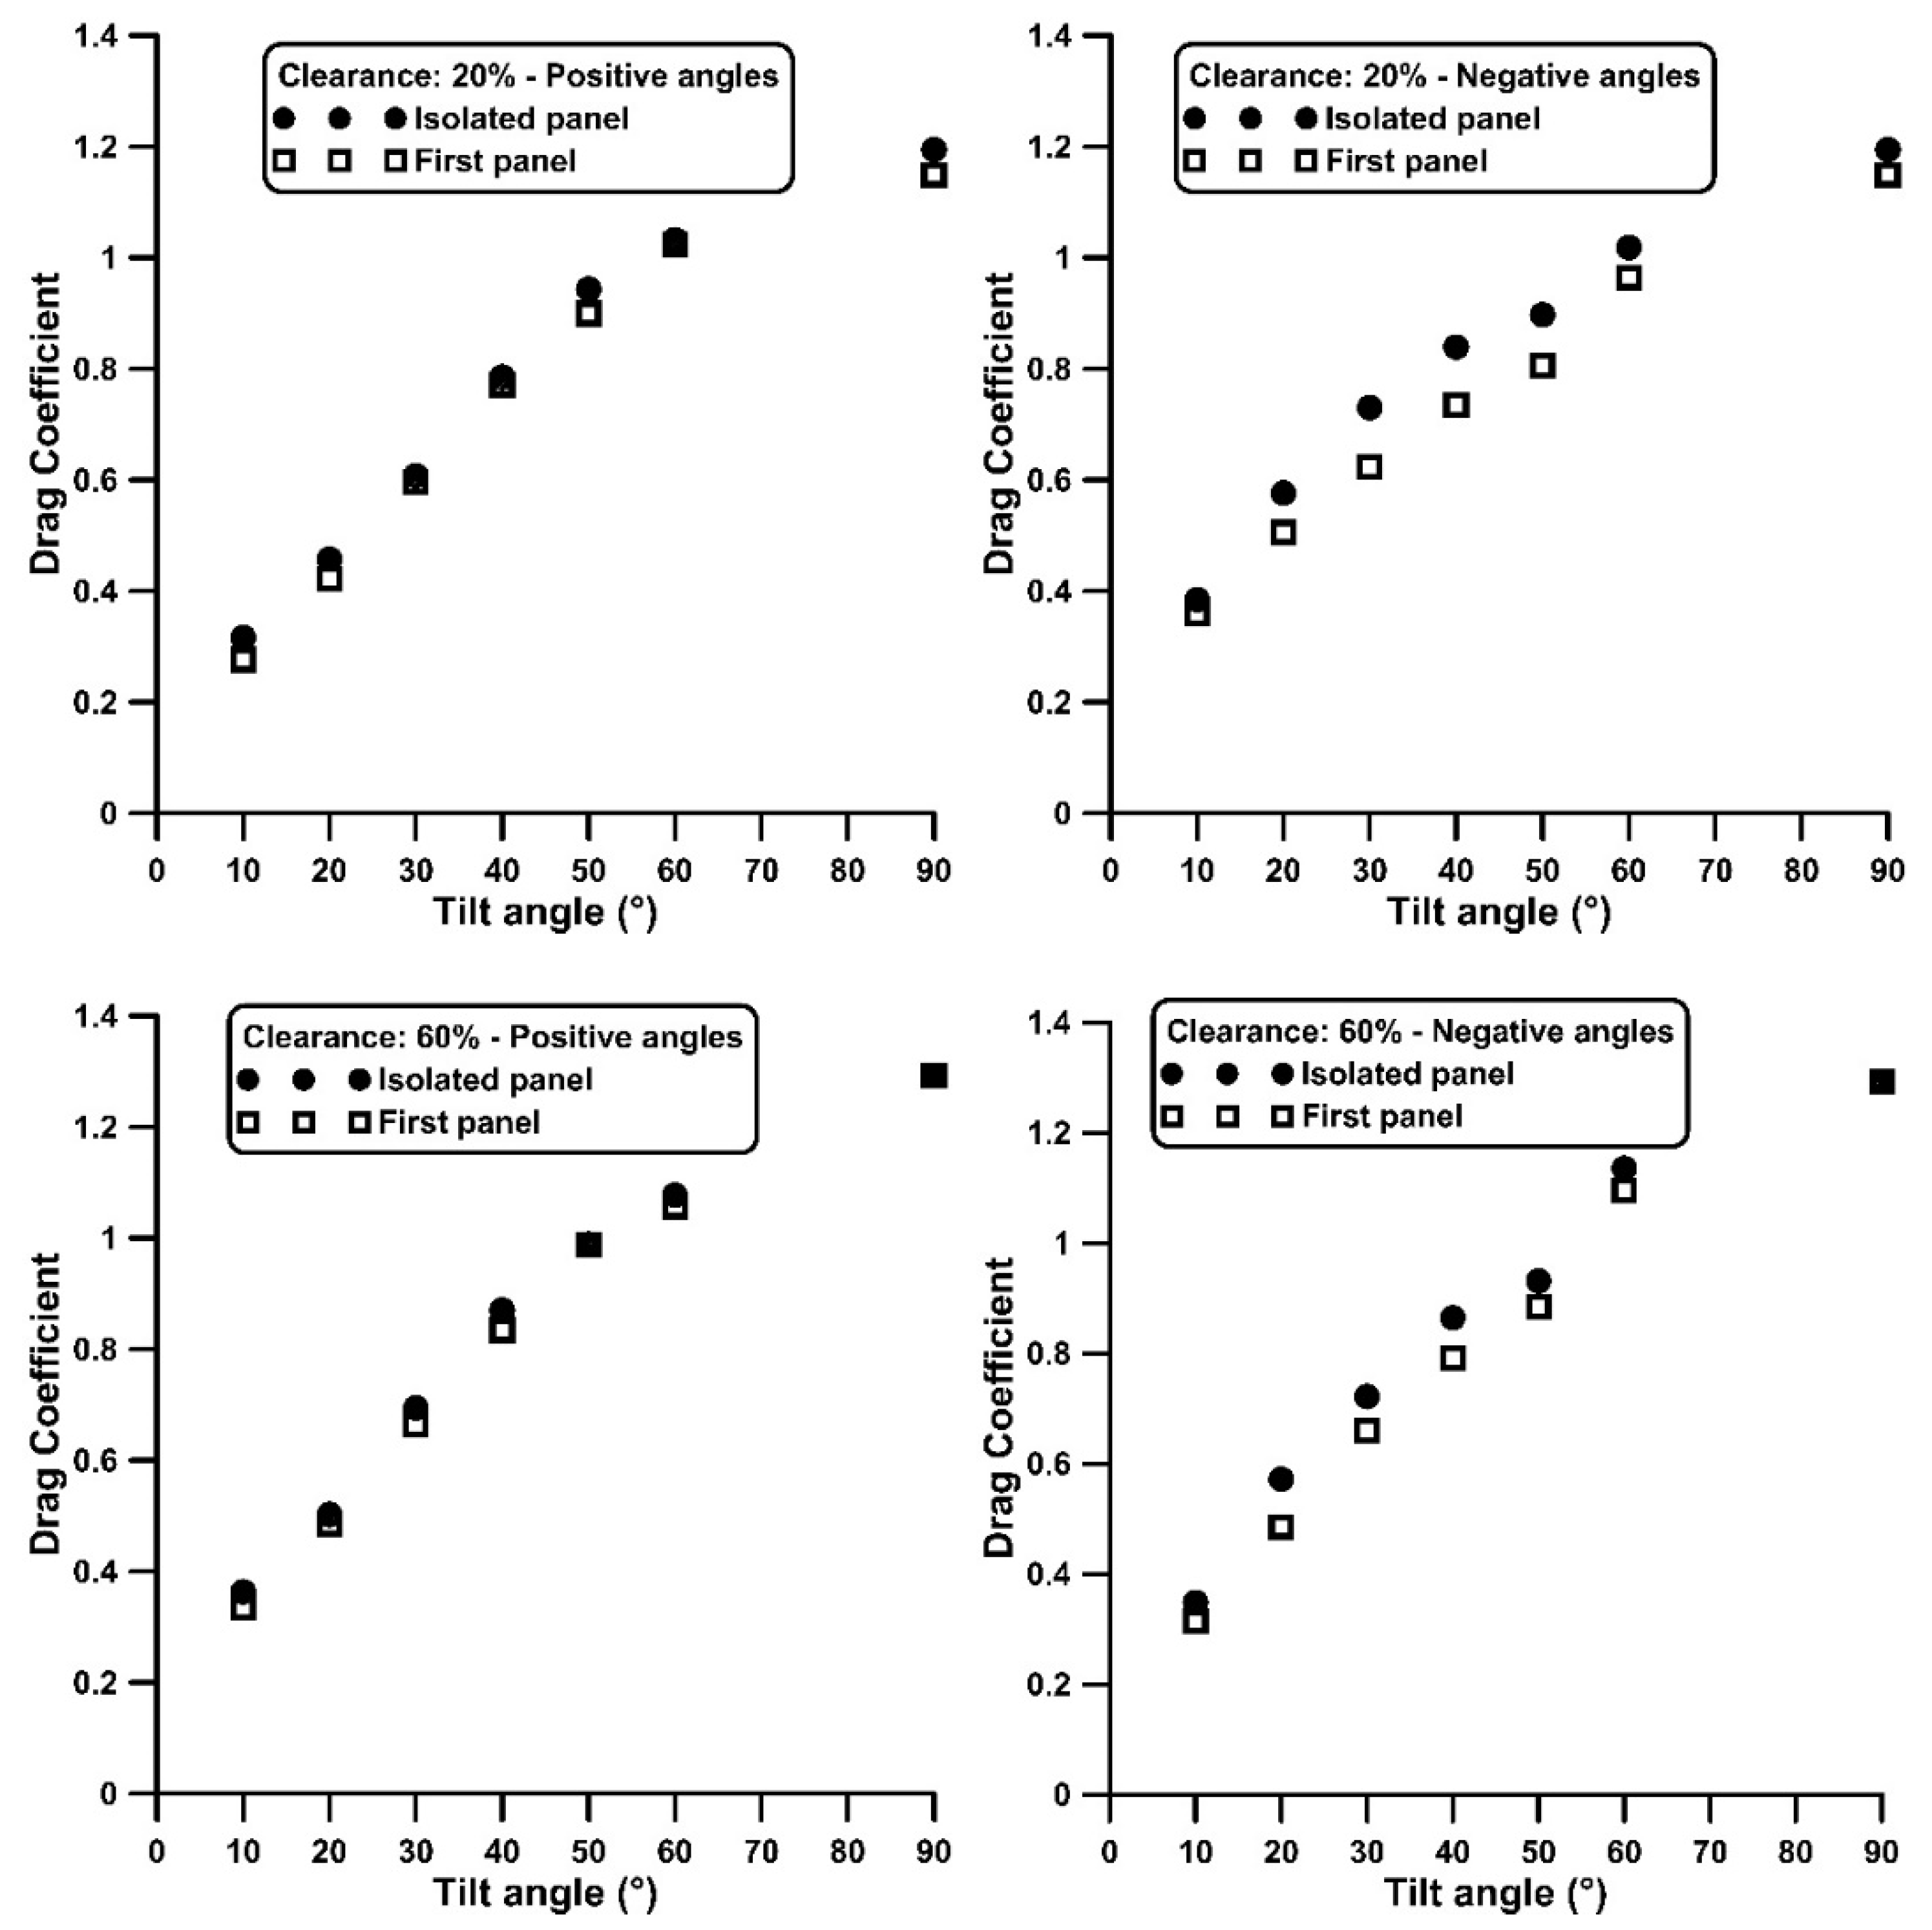
The drag applied on an isolated plate and that of the first, versus inclination angle and clearance is shown in Figure 10. The general trend is that the drag on the first plate is smaller than that of the isolated, especially when the tilt angle is negative and the clearance is 20%, for which a maximum difference of 15% is observed.

Figure 10.
Drag coefficient of first plate and of an isolated plate versus tilt angle and ground clearance.
3.3. Six Plates in Tandem–Pressure Measurements
Figure 11 presents the distribution of time-averaged pressure coefficients for the six-plate configuration, displaying both the front side (pressure side) and the back side (suction side) of each plate. Each plate is represented as a rectangle in the figure, with dimensions of 20 cm in width (vertical side) and 110 cm in length (horizontal side). The vertical axis is labelled from 0 at the top edge (farthest from the ground) to 20 at the bottom edge (closest to the ground). The colour bar refers to Cp values and its range has been adjusted for each case so that the details of the pressure distribution are better illustrated. The presentation of the data was based on the linear interpolation routine of MATLAB R2017b ‘interp2’ using a grid of a 10 mm step along both directions (spanwise and chordwise) and assuming symmetric pressure values with respect to the mid span chord.
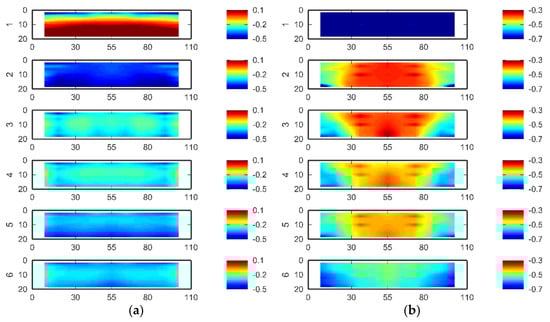
Figure 11.
Measured pressure coefficient distributions at both sides of the plates for a tilt angle of 30° and two wind directions (0° and 180°). Dimensions are in cm. (a) a = +30°, windward side, (b) a = +30°, suction side, (c) a = −30°, windward side, (d) a = −30°, suction side.
As expected, the pressure at the front side of the first windward plate is maximum for both wind directions (0° and 180°), due to the stagnation point region, taking higher values at a = −30°, compared to +30° due to the ram pressure effect, as a result of the ground influence. For a = −30°, the pressure takes higher values at the upper edge of the plate (where the stagnation point is located), whereas for a = +30°, higher pressures appear at the lower side, for the same reason. Nevertheless, in both angles, the pressure drops from the leading to the trailing edge on the pressure side due to the flow speed acceleration. Especially for a = +30°, negative pressures appear on the pressure side close to the trailing edge. As it is shown in the numerical work [28] which examines the stall and post-stall behaviour of various airfoils, negative pressure coefficients do appear on the pressure side near the trailing edge at high angles of attack, associated with a local recirculation region.
Regarding the backside of the first windward plate, the pressure drops sharply due to flow massive separation at its sharp edges and the local fluid high speed, with Cp taking negative values around −0.70 for both wind directions. According to [24] the back pressure in the wake of flat square plates at a = 90° was reported to be −0.59 for a solid blockage ratio of 4.5% (here the blockage ratio is 4.4% and a = ±30°), and in (page 3–16, [29]) a value of −0.42 is mentioned as a representative figure from various publications. It should be noted that, due to the absence of pressure taps near the panel edges, no information could be obtained for these specific regions where, as is well known, low-pressure values typically appear.
The evolution of the flow in the downstream panels is characterized by: (a) relatively uniform pressure distributions on the pressure side, and (b) areas of local pressure minima at the suction side near the leading edge, extending towards the panel tips. As a result, these regions appear at the lower edges of the panels for a = +30°, and at the upper edges for a = −30°, expanding both chordwise and spanwise. Therefore, PV modules located at the edges of a panel array suffer by higher aerodynamic loading as it has been reported in literature, e.g., in [5], (c) the Cp values are negative at both sides of the plates, with the higher absolute values at the suction (back) side, which tend to increase in absolute values, in contrast to the front side where the pressures are practically constant; (d) major streamwise pressure variations occur between the first and second plates, while in the rest, there is a tendency for the pressure spatial variations to be smoothed out.
Based on the pressure data, and assuming negligible wall shear stresses, the drag coefficients are presented in Figure 12 along with those of the smaller plates for the same ground clearance of 20%. It has to be noted that the absence of pressure data close to the tip edges as well as close to the leading and trailing edge, may affect the calculated drag coefficients. However, the trends are the same, with the second plate presenting the minimum drag coefficient. An explanation of the force variation along the plates is as follows: while the suction (negative gauge pressure) at the panels’ rear increases along the series for both the positive and negative tilt angle, the front-side pressure remains relatively unchanged and less negative. This growing pressure differential leads to an increase in drag from the third to the sixth plate. However, the low drag on the second plate can be attributed to the nearly equal pressures on its both sides as shown above.
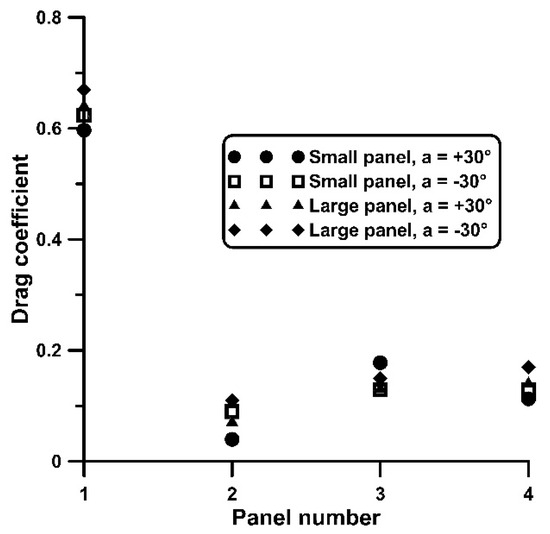
Figure 12.
Drag coefficient of small and large panels. Tilt angle = ±30°, ground clearance of 20%.
4. Discussion
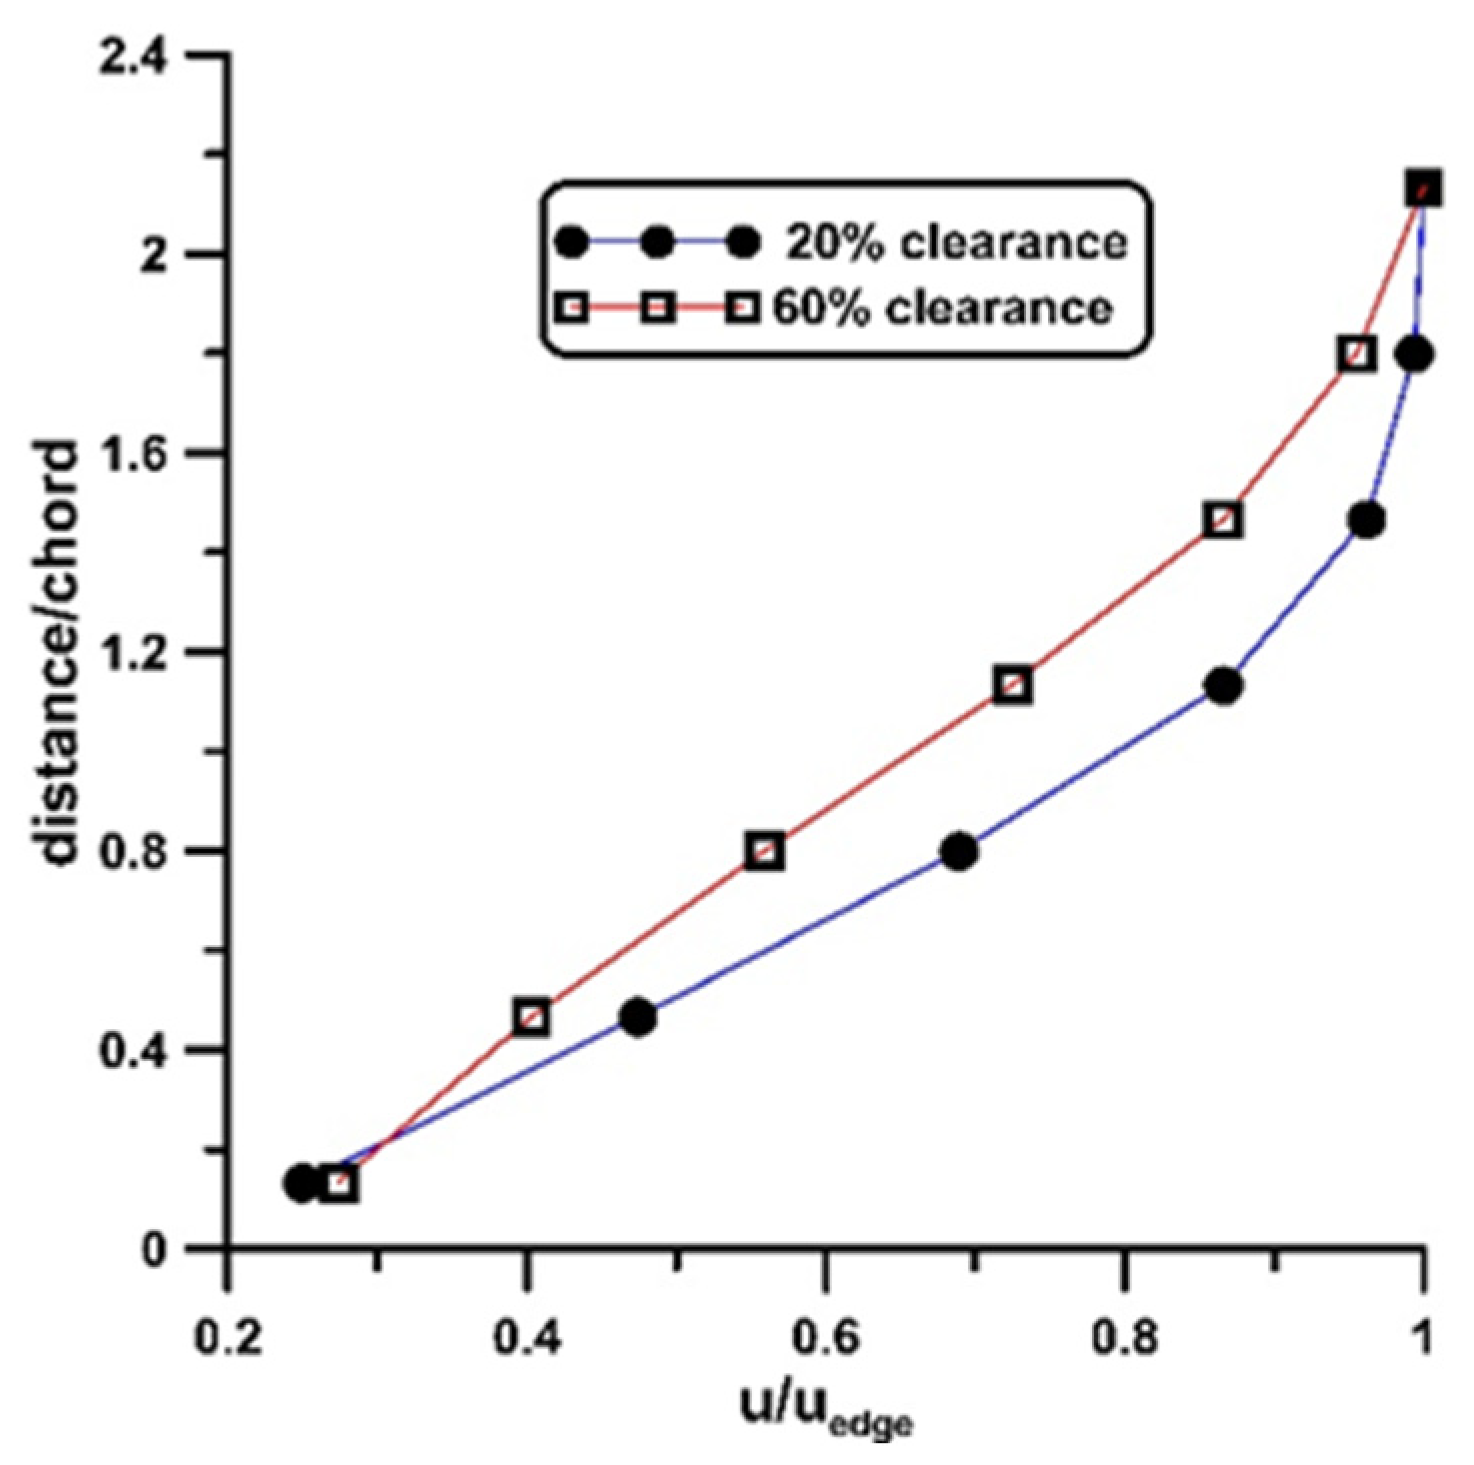
Despite the substantial body of literature on the aerodynamic loading of PV panels in tandem configuration, it seems that there are still open questions, regarding, e.g., the influence of the ground and the flow direction, in case of head-on winds (0° versus 180°). The finite aspect ratio of the plates causes the generation of tip vortices whereas the adverse pressure gradient due to the high tilt angles leads to flow separation and vortex shedding. The vortical structures interacting with the ground, influence the wake and, consequently, the forces applied on the plates in a way that is not clear enough. A characteristic example is the case of an isolated tilted flat plate, the drag curve of which exhibits a discontinuity at tilt angles between 25° and 50° for small aspect ratios (AR ≤ 2.5) [8]. Furthermore, in the present work, it is shown that the drag coefficient is a function of the tilt angle sign, taking higher values for negative compared to positive tilt angles (namely for the 180° compared to 0° wind direction) up to 40°, above which this is reversed. The latter two wind directions seem to influence the wake of the plates, as it is shown in the numerical work [9] for a tilt angle of 25°, in which the plates’ wake in the case of the 180° wind direction is shown to be wider (in a horizontal plane) compared to the 0° wind direction. In the numerical work [15], the drag coefficient of a symmetric airfoil (NACA 0015) is shown to vary asymmetrically about the zero angle of attack for a ground clearance of 10% and for angles between ±13°, whereas for a NACA 0012 wing, details about the tip vortices at close proximity to the ground are found in [16] but only for a tilt angle of 10°. Interesting findings with regard to the ground influence on the loading of tilted flat plates of AR = 1 and 2 are presented in [14]. However, measurements in the wake of a series of plates at high tilt angles at close proximity to the ground are missing from the open literature. In fact, measuring the velocity distribution in the symmetry plane in the wake of the present four-panel set up did not reveal the cause of the drag behaviour. A typical example is illustrated in Figure 12, showing the vertical distribution of the streamwise velocity component, three chord lengths downstream of the plate series for a = −50° and for two ground clearances, 20% and 60%, with values of the first plate being 0.806 and 0.885, respectively. The vertical axis in Figure 13 is the vertical distance from the upper edge of the panels, and uedge (in the horizontal axis) is the fluid speed at the edge of the wake. In both cases, the edge of the wake is located about two chord lengths, above the upper edge of the plates, and the flow speeds of the smaller drag case are higher, as expected.
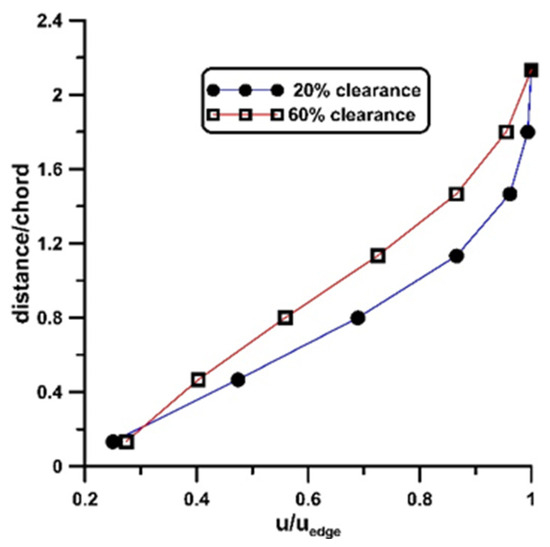
Figure 13.
Wake streamwise velocity profiles, for a = −50° and two ground clearances.
Figure 14 presents comparisons of the present study with the data from two previous publications: [9,11]. The first study is a numerical analysis of the flow field over an array of ten PV panels set at 14° angle of attack, with an aspect ratio of 2.015, a longitudinal spacing of 2.38 chord lengths, and a ground clearance of 53.4%. Three inlet turbulence intensities ranging from 10% to 30% were considered, with the lowest value of 10% used for comparison in the present work. The second study [9] also investigates the flow field, but over five panels, arranged at a 25° angle of attack, with an aspect ratio of 8.9, a longitudinal spacing of 1.6 chord lengths, and a ground clearance of 24.5%. For comparison with [11], the data of the present study for 60% ground clearance are used, which are closer to the 53.4% of [11]. Conversely, for comparison with [9], the data from the 20% clearance case are used, as they more closely match the 24.5% clearance reported in [9]. Linear interpolation was applied to the drag data from the present study to estimate the values corresponding to angles of attack of 14° and 25°, respectively. Among the two references, the results of the present work align more closely with those of [9], likely due to the more comparable aspect ratio between the panel configurations.
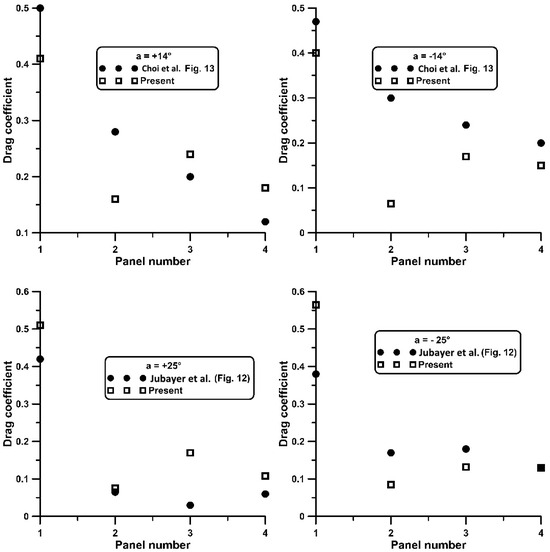
Figure 14.
Drag coefficient comparisons with the literature, Jubayer et al. [9], Choi et al. [11].
5. Limitations of Present Work
It has to be stressed that the main objective of this work was to present new evidence regarding the ground influence on the aerodynamic loading of tilted flat plates and also to highlight the lack of data about the wake structure of tilted plates in tandem in close proximity to the ground. Published relevant works are normally numerical simulations showing details of the flow field only at the midspan plane, not giving details on the 3D flow behaviour. On the other hand, in a recent PhD dissertation [14], very interesting information is included about the influence of the ground on the aerodynamics of isolated plates of small aspect ratio. Therefore, there is a need to further explore the ground effect on tilted plates in tandem.
Although only the drag force was measured in the present work, a good estimate of the lift could be obtained by assuming that the wall shear stresses are minimal, or equivalently, that the aerodynamic force is perpendicular to the panels. In this case, the drag to lift ratio is equal to the tangent of the tilt angle from which the lift can be extracted. In fact, the same assumption is made in majority of the publications in which the pressure distribution is used for the estimate of the panel loading.
No attempt was made to simulate the wind characteristics of a real PV plant, regarding the incoming free stream spatial variation and frequency content. In this respect, the free stream speed, in the current work, followed the 1/7th power law in the four-panel configuration, whereas in the six-panel case, the inlet free stream was uniform. Therefore, the present findings can be used as a data source for comparisons with numerical simulations which are quite demanding mainly due to the panel wake interactions.
6. Conclusions
Drag coefficients were measured on an isolated tilted flat plate as well as on a series of four plates in tandem, of aspect ratio 6, with a longitudinal separation of two chord lengths and for two ground clearances, 20% and 60% of the chord length. The tilt angles varied from 10° to 90°, being positive and negative, referring to 0° and 180° head-on wind directions, respectively. Pressure measurements were also conducted on a series of six larger plates, revealing the three-dimensional character of the flow.
Basic conclusions with regard to the four-plate series are as follows:
- -
- A local minimum of the curve slope appears for the 180° wind direction, between 40° and 60° tilt angles, for both the first plate as well as an isolated plate. As a result, the for the 180° wind direction is higher (up to 25%) compared to the 0° wind direction for tilt angles smaller than 40°.
- -
- Ground clearance increase is associated with an increase in , especially in the downstream located plates (from 2nd to 4th) by more than 40%, and up to 20% for the first plate, being more evident at positive tilt angles (0° wind direction).
- -
- The Cd distribution along the plate series starts with a maximum value on the first plate, at least twice as high as that of the subsequent plates, it drops on the second and it recovers in the rest of the plates.
Regarding the pressure measurements on the six-plate series, the following were revealed:
- -
- Pressure distributions are relatively uniform on the pressure side, in contrast to the suction side, where pressure minima (high negative values) occur at the leading edge region, far from the mid-span. A practical implication of this, is the increased loading of the PV modules located at the edges (in the spanwise direction) of a PV array, either at the lower part (in case of a 0° wind direction) or its upper part (in case of a 180° direction).
- -
- With the exception of the pressure side of the first windward plate, the pressure coefficients are negative on all plates, exhibiting higher absolute values on their suction sides. Consequently, there is pressure recovery in the passage between neighbouring plates, being more pronounced between the first and the second. In the remaining plates, there is a tendency for the pressure spatial variations to be smoothed out streamwise.
Author Contributions
Conceptualization, D.M.; data curation, D.M., N.V. and P.K.; investigation, D.M., N.V. and C.G.; methodology, D.M.; software, D.M., P.K.; validation, D.M., N.V. and P.K.; visualization, D.M. and P.K.; writing—original draft, D.M. and C.G.; writing—review and editing, D.M. and C.G. All authors have read and agreed to the published version of the manuscript.
Funding
This research received no external funding.
Data Availability Statement
Data will be available at reasonable request.
Acknowledgments
We acknowledge the technical support of Taleb Mohammad from Bahrain Polytechnic and the solutions that he provided during the experiments.
Conflicts of Interest
The authors declare no conflicts of interest.
References
- World Solar Investment Report 2023. Available online: https://isolaralliance.org/uploads/docs/1885d3247cb1a2c5c86d9bf1599a66.pdf (accessed on 10 April 2025).
- Aly, A.M.; Bitsuamlak, G. Aerodynamics of ground-mounted solar panels: Test model scale effects. J. Wind Eng. Ind. Aerodyn. 2013, 123, 250–260. [Google Scholar] [CrossRef]
- Aly, A.M. On the evaluation of wind loads on solar panels: The scale issue. Sol. Energy 2016, 135, 423–434. [Google Scholar] [CrossRef]
- Khaled, M.F.; Aly, A.M. Assessing aerodynamic loads on low rise buildings considering Reynolds number and turbulence effects: A review. Adv. Aerodyn. 2022, 4, 24. [Google Scholar] [CrossRef]
- Warsido, W.P.; Bitsuamlak, G.T.; Barata, J.; Chowdhury, A.G. Influence of spacing parameters on the wind loading of solar array. J. Fluids Struct. 2014, 48, 295–315. [Google Scholar] [CrossRef]
- Ginger, J.D.; Bodhinayake, G.G.; Ingham, S. Wind Loads on Ground Mounted Solar Panels; Technical Report; James Cook University: North Queensland, Australia, 2019; ISBN 978-0-9954471-9-6. [Google Scholar]
- Wittwer, A.R.; Podestá, J.M.; Castro, H.G.; Mroginski, J.L.; Marighetti, J.O.; De Bortoli, M.E.; Paz, R.R.; Mateo, F. Wind loading and its effects on photovoltaic modules: An experimental–Computational study to assess the stress on structures. Sol. Energy 2022, 240, 315–328. [Google Scholar] [CrossRef]
- Ortiz, X.; Rival, D.; Wood, D. Forces and moments on flat plates of small aspect ratio with application to PV wind loads and small wind turbine blades. Energies 2015, 8, 2438–2453. [Google Scholar] [CrossRef]
- Jubayer, C.M.; Hangan, H. A numerical approach to the investigation of wind loading on an array of ground mounted solar photovoltaic (PV) panels. J. Wind Eng. Ind. Aerodyn. 2016, 153, 60–70. [Google Scholar] [CrossRef]
- Shademan, M.; Naghib-Lahouti, A. Effects of aspect ratio and inclination angle on aerodynamic loads of a flat plate. Adv. Aerodyn. 2020, 2, 14. [Google Scholar] [CrossRef]
- Choi, S.M.; Lee, G.R.; Park, C.D.; Cho, S.H.; Lim, B.J. Wind load on the solar panel array of a floating photovoltaic system under extreme hurricane conditions. Sustain. Energy Technol. Assess. 2021, 48, 101616. [Google Scholar] [CrossRef]
- Ai, Y.; Zhou, L.; Tse, K.T.; Zhang, H. Interference and ground effects on flow past two inclined flat plates in tandem arrangement. Ocean. Eng. 2023, 270, 113653. [Google Scholar] [CrossRef]
- Bao, T.; Li, Z.; Pu, O.; Yang, Y.; Huang, B.; Wu, H. Field measurement-based research on wind pressure interference effects of tracking photovoltaic arrays. J. Wind Eng. Ind. Aerodyn. 2025, 257, 105971. [Google Scholar] [CrossRef]
- Pieris, S. Aerodynamics of Finite-Span Inclined Flat Plates in Ground Proximity. Ph.D. Thesis, University of Waterloo, Waterloo, ON, Canada, 2023. Available online: https://hdl.handle.net/10012/19853 (accessed on 8 March 2025).
- Rojewski, A.; Bartoszewicz, J. Numerical analysis of influence of the wing in ground effect on aircraft lift coefficient and on car downforce coefficient. J. Mech. Transp. Eng. 2017, 69, 47–54. [Google Scholar] [CrossRef]
- Lee, T.; Lu, A.; Tremblay-Dionne, V. Experimental study of aerodynamics and wingtip vortex of a rectangular wing in flat ground effect. ASME J. Fluids Eng. 2019, 14, 111108. [Google Scholar] [CrossRef]
- Taleghani, A.S.; Ghajar, A. Aerodynamic characteristics of a delta wing aircraft under ground effect. Front. Mech. Eng. 2024, 10, 1355711. [Google Scholar] [CrossRef]
- Lappalainen, K.; Valkealahti, S. Output power variation of different PV array configurations during irradiance transitions caused by moving clouds. Appl. Energy 2017, 190, 902–910. [Google Scholar] [CrossRef]
- Tieleman, H.W. Wind tunnel simulation of wind loading on low-rise structures: A review. J. Wind Eng. Ind. Aerodyn. 2003, 91, 1627–1649. [Google Scholar] [CrossRef]
- Larose, G.L.; D’Auteuil, A. On the Reynolds number sensitivity of the aerodynamics of bluff bodies with sharp edges. J. Wind Eng. Ind. Aerodyn. 2006, 94, 365–376. [Google Scholar] [CrossRef]
- Bailey, S.C.C.; Hultmark, M.; Monty, J.P.; Alfredsson, P.H.; Chong, M.S.; Duncan, R.D.; Vinuesa, R. Obtaining accurate mean velocity measurements in high Reynolds number turbulent boundary layers using Pitot tubes. J. Fluid Mech. 2013, 715, 642–670. [Google Scholar] [CrossRef]
- White, F.M. Fluid Mechanics. In Textbook, 4th ed.; McGraw-Hill: New York, NY, USA, 1999; ISBN 0071168486. [Google Scholar]
- Barlow, J.B.; Rae, W.H.; Pope, A. Low Speed Wind Tunnel Testing., 3rd ed.; John Wiley & Sons, Inc: New York, NY, USA, 1999; ISBN 978-0-471-55774-6. [Google Scholar]
- Maskell, E.C. A Theory of the Blockage Effects on Bluff Bodies and Stalled Wings; Reports and Memoranda No. 3400; Aeronautical Research Council: Ottawa, ON, Canada, 1963. [Google Scholar]
- Okamoto, M.; Azuma, A. Aerodynamic characteristics at low Reynolds numbers for wings of various planforms. AIAA J. 2011, 49, 1135–1150. [Google Scholar] [CrossRef]
- Miller, R.; Zimmerman, D. Wind Loads on Flat Plate Photovoltaic Array Fields. Phase II Final Report; U.S. Department of Energy: Seattle, WA, USA, 1979. [Google Scholar]
- Shademan, M.; Barron, R.M.; Balachandar, R.; Hangan, H. Numerical simulation of wind loading on ground-mounted solar panels at different flow configurations. Can. J. Civ. Eng. 2014, 41, 728–738. [Google Scholar] [CrossRef]
- Petrilli, J.; Paul, R.; Gopalarathnam, S.; Frin, N.T. A CFD Database for Airfoils and Wings at Post-Stall Angles of Attack. Presented at AIAA 2013–2916, Fluid Dynamics and Co-Located Conferences, San Diego, CA, USA, 24–27 June 2013. 31st AIAA Applied Aerodynamics Conference. [Google Scholar]
- Hoerner, S.F. Fluid Dynamic Drag; Catalog Card Number 64-19666; USA Library on Congress: Washington, DC, USA, 1965. [Google Scholar]


Disclaimer/Publisher’s Note: The statements, opinions and data contained in all publications are solely those of the individual author(s) and contributor(s) and not of MDPI and/or the editor(s). MDPI and/or the editor(s) disclaim responsibility for any injury to people or property resulting from any ideas, methods, instructions or products referred to in the content. |
© 2025 by the authors. Licensee MDPI, Basel, Switzerland. This article is an open access article distributed under the terms and conditions of the Creative Commons Attribution (CC BY) license (https://creativecommons.org/licenses/by/4.0/).