Abstract
(1) Background: the aim of this study is to assess the effectiveness of two protection systems for aerosol cloud reduction while playing different wind instruments. (2) Methods: The protection systems used were a cotton molton construction combined with a bell filter attached at the bell of the instruments, as well as a household paper towel. For visualization of the emitted aerosol particles, e-cigarettes were used. With three full HD cameras, cloud dispersion was captured in the forward, sideways, and upwards directions. The effectiveness of aerosol spread reduction was statistically evaluated. (3) Results: Without protection, aerosol clouds dispersed, on average, up to 1.23 m in the forward direction, 0.46 m sideways, and 0.86 m upwards. The cotton molton mask reduced forward spread by 42%, while the paper towel achieved a 15% reduction, although both systems increased lateral and vertical dispersion. Specifically, the cotton molton mask yielded a 9% increase to the side and 7% in the upward direction, while the paper towel resulted in a 66% increase to the sides and a 10% increase in the upward direction. The cotton molton mask’s effectiveness was attributed to its additional coverage of the tone holes, which contribute to aerosol emission in woodwind instruments. A statistical analysis via the Friedman test confirmed significant reductions in forward dispersion with the cotton molton system. (4) Conclusions: Protective systems can partially reduce aerosol emissions. However, these alone are not sufficient, and further measures to reduce the spread of particles are necessary.
1. Introduction
SARS-CoV-2, like many other pathogens, is transmitted via droplet infection [1,2,3]. These particles vary in size, with ballistic droplets measuring 5–10 µm in diameter, aerosol particles being <5 µm, and submicron aerosol particles being <1 µm [4]. It is now understood that even the smallest particles are capable of carrying a significant viral load [5]. Particles < 10 µm primarily originate from the deep parts of the respiratory tract [6,7], and studies have shown that these particles carry particularly high viral loads [3]. Additionally, those small particles have a higher probability to be inhaled deeper, increasing their infectious potential [5]. Most of the expelled aerosol particles consist of these highly contagious submicron particles [8].
Released aerosol particles mix with ambient air particles and are distributed by the air flow present in the environment [9]. This distribution depends on various factors, including temperature, movement of people, room size in an indoor environment, and obstacles such as furniture and individuals [10,11]. Particles also settle on objects or body parts, allowing for transmission through contaminated surfaces [7,12]. The longer the virus-laden particles remain airborne, the higher the risk of infection [10]. A 1 µm aerosol particle was found to remain in a room for up to 12.4 h [4]. Theoretically, even a small amount of virus particles can be sufficient to cause infection [13], thus highlighting that higher aerosol concentrations correlate with increased infection risk [14].
Aerosol particles of different sizes are emitted during breathing, speaking, singing, and playing wind instruments. While playing wind instruments, particle sizes ranging from 0.3 µm to 20 µm have been measured [7,8]. In comparison, speaking and singing can expel particles larger than 20 µm [6,15]. The visualization of micron particles is mostly achieved by illumination experiments with white light [16,17] or (mostly green) laser light similar to flow visualization techniques such as, e.g., Particle Image Velicimetry [18,19,20]. However, visualizing submicron particles is challenging due to the limitations of current optical measurement methods.
Although aerosol particles expelled from wind instruments are smaller in diameter, He et al. [21] demonstrated that playing wind instruments produces a greater variability of particle diameter. This can be attributed to the increased lip vibration, tongue movement, and salivation compared to speaking or singing [6,10]. The total number and concentration of particles expelled into the environment are, however, lower for instruments [7,15,22,23].
Aerosol emission varies depending on the playing technique. Lip pressure, lung volume, and pitch influence the concentration and quantity of particles [8,21,24,25,26,27,28,29]. Additionally, the design of each instrument affects aerosol emission. Starting with the mouthpiece, the number of expelled aerosol particles is influenced by the blowing technique [10,30]. The curvature, length, and diameter of the instrument, as well as the size of the bell, also determine the emission [10,14,21,27,31]. Instruments with more tone holes provide additional paths for air escape [8,27]. The material of the instrument affects how much the breath condensates. Greater condensation within the instrument, e.g., made of metal, results in fewer aerosol particles being emitted, as larger particles tend to adhere to the walls through condensation [9,10], although the exact mechanisms behind this reduction remain unclear and may involve factors such as bore geometry or thermal conductivity.
Given the spatial distribution of particles, protection against aerosol particles is necessary [8,10]. Properly worn conventional face masks offer good protection [7,32,33,34]. However, since playing wind instruments also produces a significant number of particles that escape through the instrument, it is crucial to find appropriate protection to enable playing wind instruments during pandemics. The various designs of wind instruments make it challenging to find a suitable protection system. Potential exit points (mouthpiece, tone holes, bell) must be adequately covered, and aerosol emission must be minimized, while ensuring minimal impact on acoustics and playability.
Only a few studies have attempted to attach a protection system to the bell and measure its impact on aerosol emissions. These studies observed a reduction in aerosol concentration and emission speed [7,9,23]. Complementing these experimental efforts, Soubrié et al. conducted a comprehensive computational fluid dynamics (CFD) study simulating aerosol propagation within various wind instruments. Their results demonstrated that instrument geometry strongly influences particle deposition and exit pathways, with cylindrical shapes and straight bores favoring aerosol escape through tone holes and steep bends promoting internal deposition [35].
To our knowledge, the impact of a protection system on the maximum spread distance of aerosol particles after playing different wind instruments has not been thoroughly investigated. The objective of this study is to test the efficacy of two protection systems in containing aerosol spread.
2. Materials and Methods
This study includes seven professional (2 female, 5 male, age distribution 48+/−4 years) wind instrument musicians from the Bavarian Radio Symphony Orchestra. At the time of the recordings, all musicians were free from respiratory symptoms and tested negative for COVID-19. Their medical histories revealed no significant chronic pulmonary diseases, and all reported being non-smokers. Lung function was assessed prior to the study using Forced Expiratory Volume lasting 1 Second (FEV1) and the Tiffeneau–Pinelli index (FEV1/VC), measured with a ZAN 100 spirometer (Oberthulba, Germany). Informed consent for participation in this study, including the use of images, was obtained from all participants.
2.1. Aerosol Mitigation and Instrumentation
In this study, a total of 7 instruments were considered: clarinet, saxophone, oboe, bassoon, horn, trombone, and trumpet. To reduce aerosol dispersion, two different mask types were used in this study:
- Household paper towel made of cellulose in the form of a hexagon attached to the bell of the instruments [36];
- Cotton molton mask: a specially designed mask made of 200 g/m2 cotton molton covering the player’s mouth, nose, and the entire instrument, completed with the bell-filter (©Bonner Textilmanufaktur, Bonn, Germany) [37].
The cotton molton mask covers the nose and mouth area of the instrument player, as well as almost the entire instrument, and is secured behind the ears. The bell filter covers only the instrument’s bell end. An exemplary installation of the cotton mask and bell hole cover is shown for a recorder from a previous study by Köberlein et al. [38]. The protection systems applied for all instruments are shown in Figure 1.
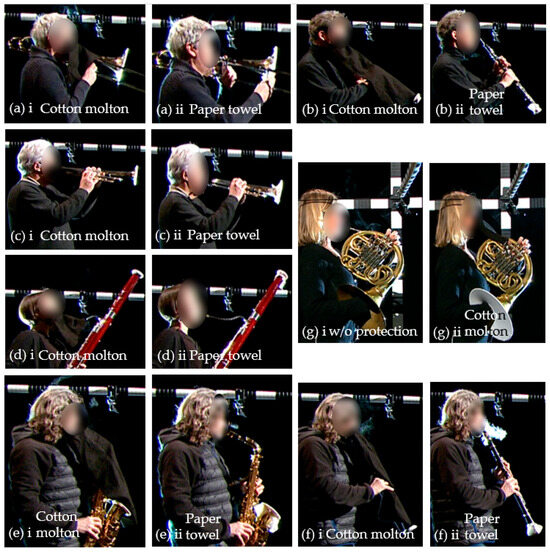
Figure 1.
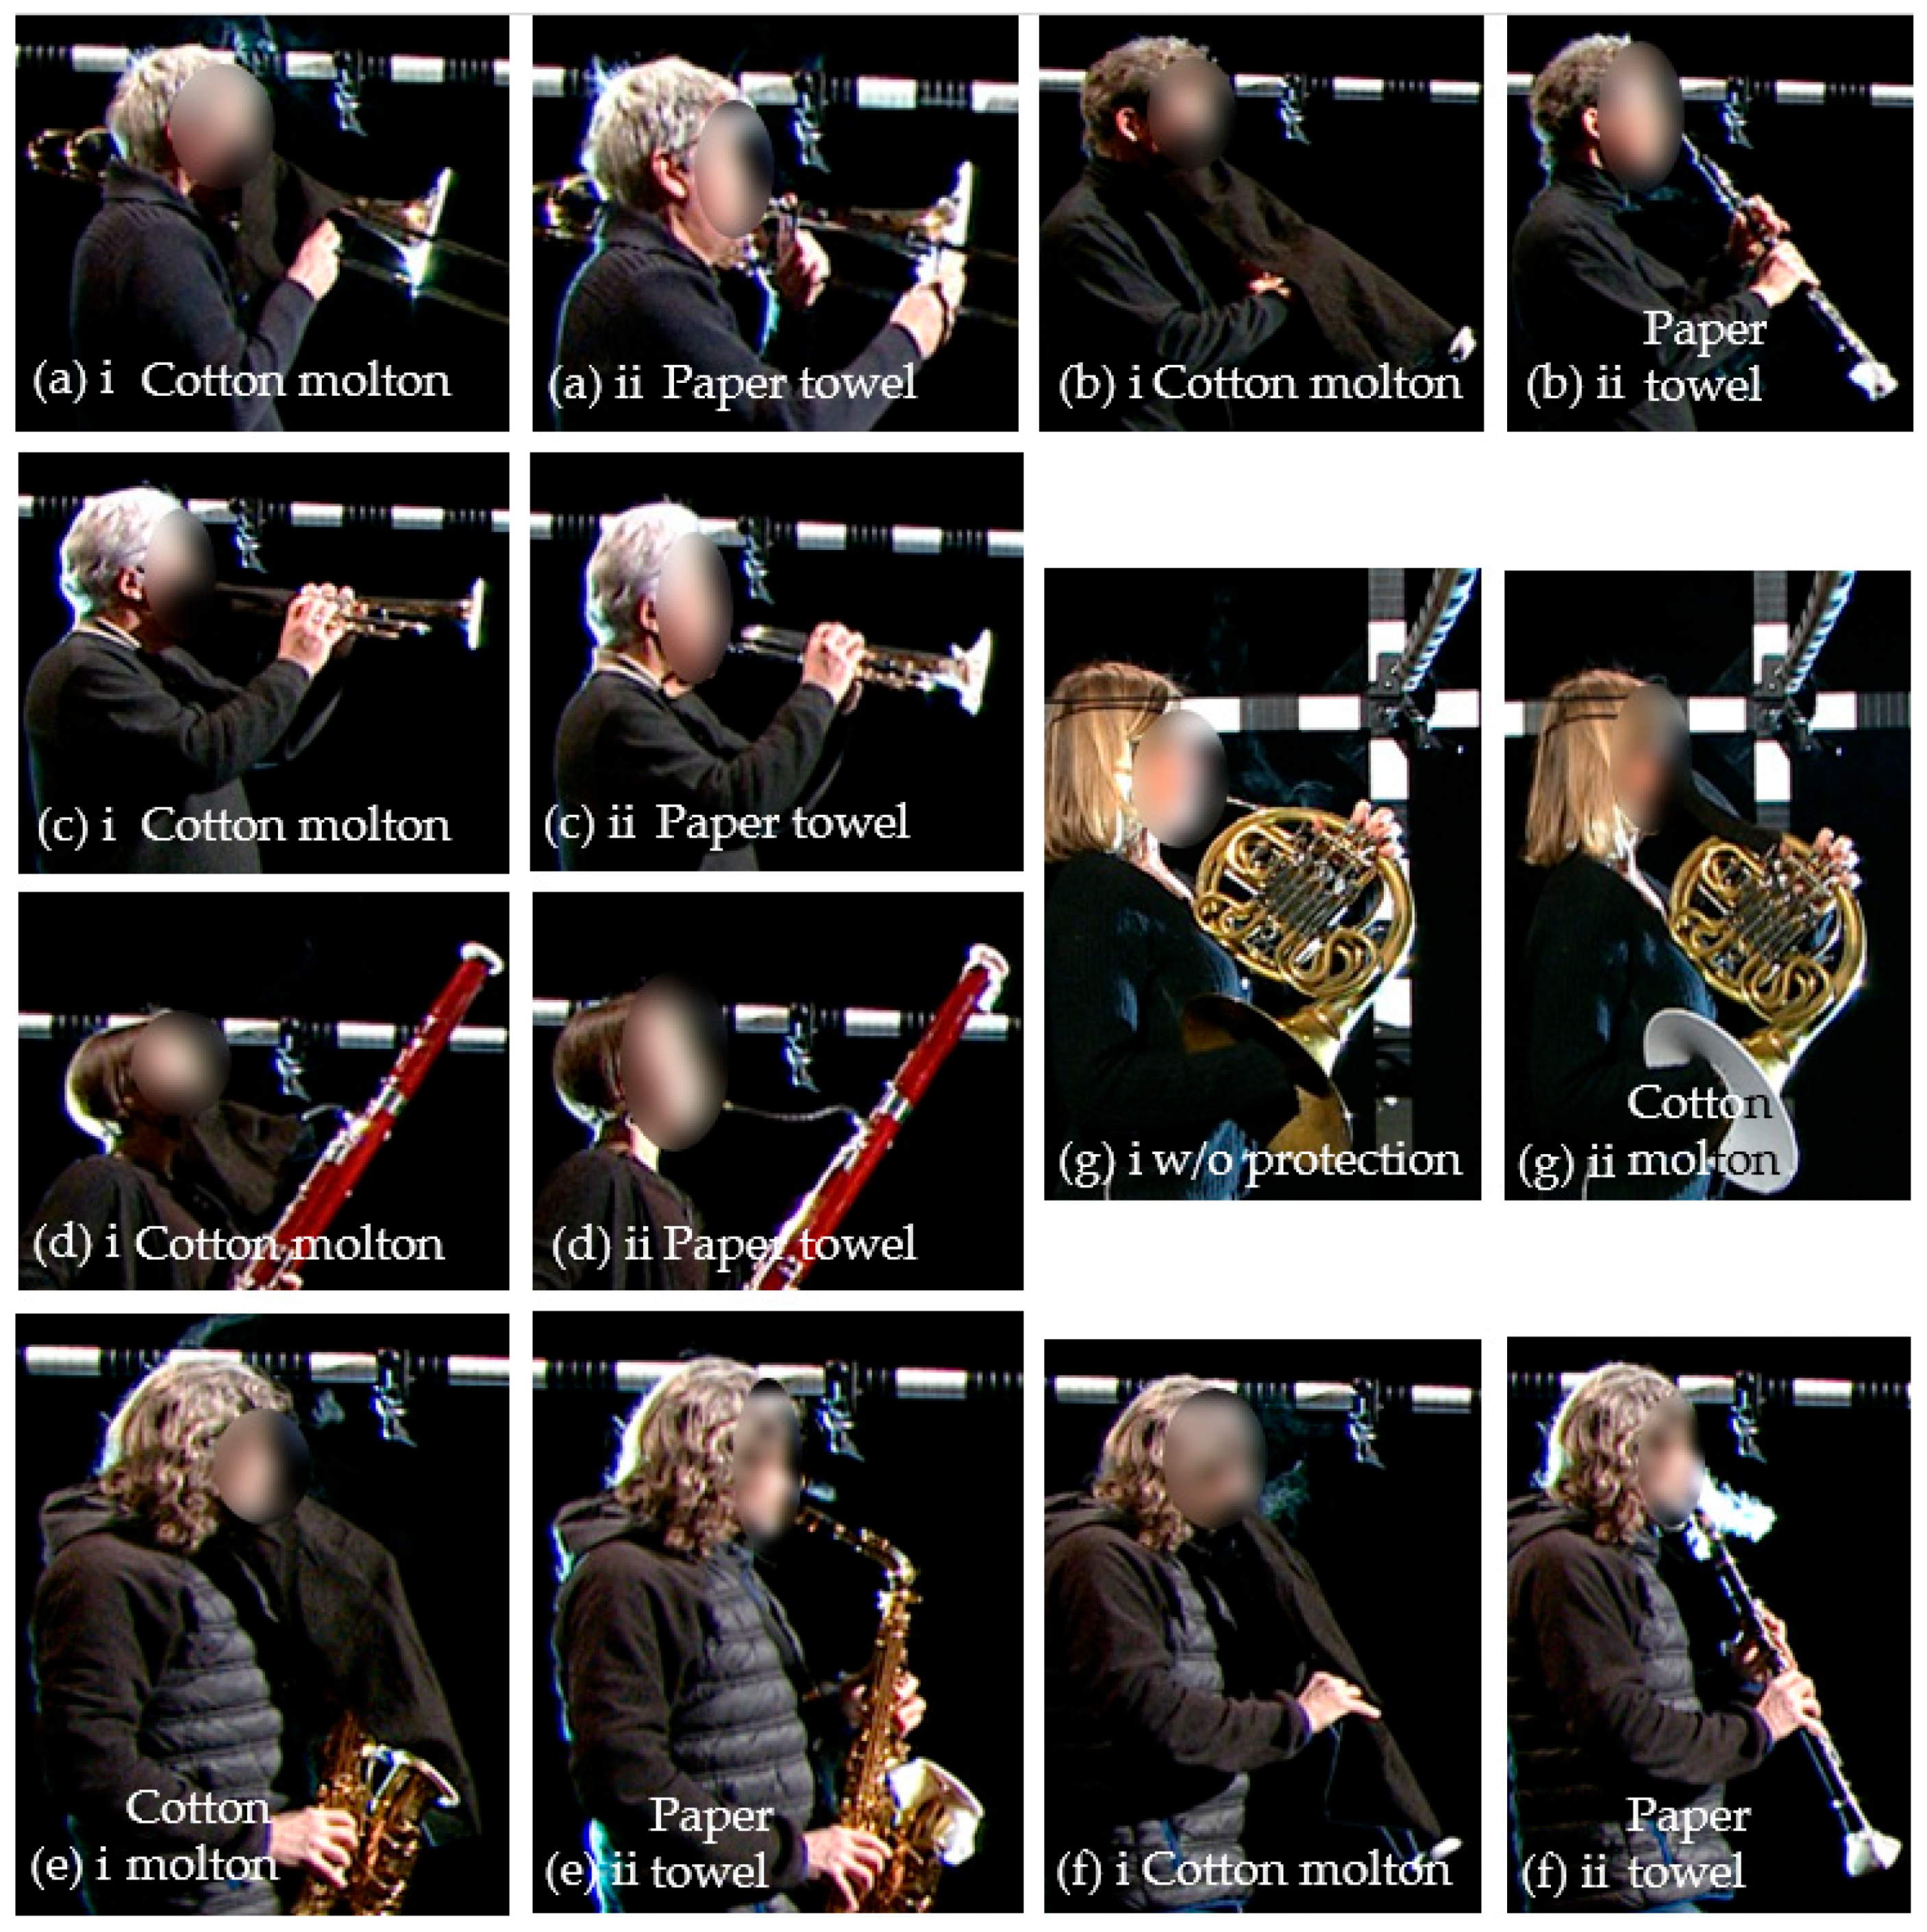
Images of musicians playing instruments with protection systems: (a) trombone, (b) trumpet, (c) bassoon, (d) saxophone, (e) oboe, (f) horn, (g) clarinet. (i) With cotton molton protection system; (ii) with paper towel protection system.
2.2. Procedure
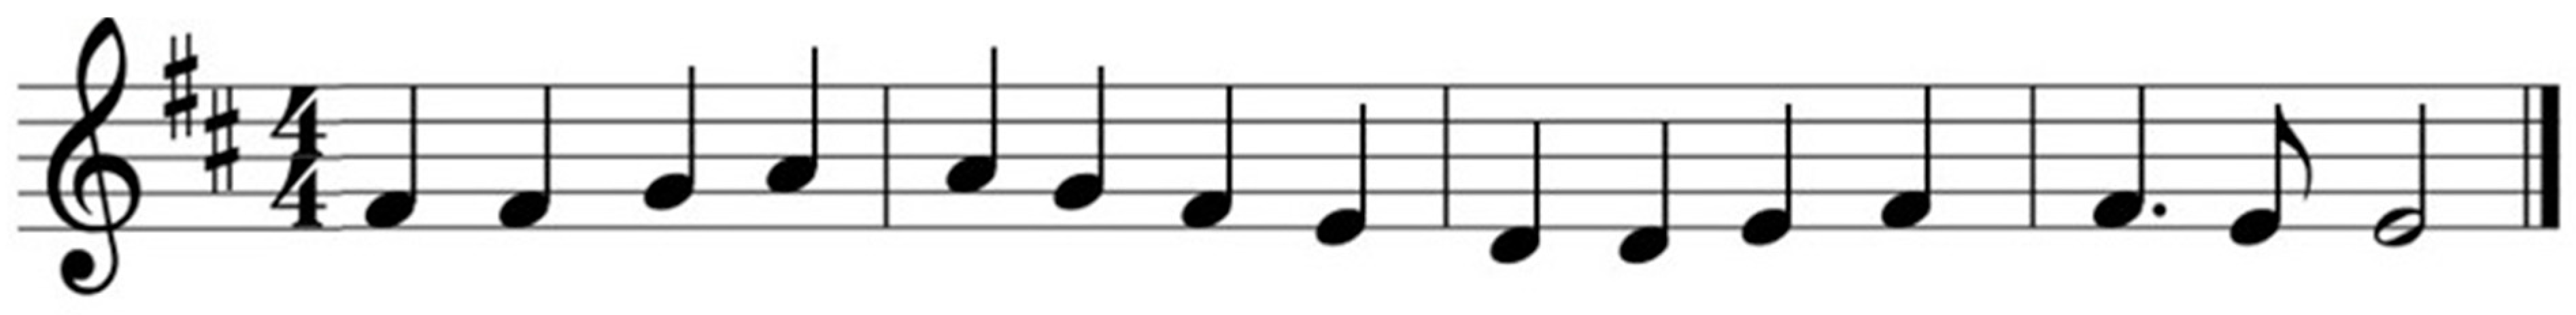
The tasks performed in this study were introduced in a previous study by Gantner et al. [38]. Participants were instructed to perform a segment from the fourth movement of Ludwig van Beethoven’s 9th Symphony in D major, loudly and at a high pitch, wearing the cotton molton mask and the paper towel (Figure 2). To assess the effectiveness of aerosol dispersion while playing, the wind instrument musicians performed the same segment again without the mask and paper towel to obtain a reference value for aerosol spread.
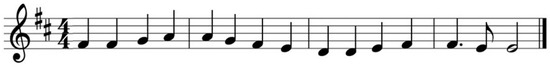
Figure 2.
The image shows the played melody.
To generate visible aerosol particles in video recordings, a Lynden Vox e-cigarette (Lynden GmbH, Berlin, Germany) was used, employing a liquid composed of 50% glycerin and 50% propylene glycol, without nicotine or other supplements such as, e.g., flavors. E-cigarette aerosol particles have diameters between 250 and 450 nm, being in the same range as particles expelled during speaking or breathing [38,39]. The usage of the e-cigarettes was previously approved by the local ethical committee (Ethikkommission der Medizinischen Fakultät der LMU München: 20–395). Each musician inhaled the e-cigarette vapor before they started to perform the respective task. The inhaled volume was measured by a spirometer connected to the e-cigarette mouthpiece, ensuring a consistent inhalation volume of approximately 0.76 L per participant.
2.3. Experimental Setup
The experiments took place in a studio of the Bavarian Broadcasting Corporation, measuring 27 m × 22 m × 9 m (width × length × height), with an average temperature of 23 °C and 46% relative humidity. The studio was equipped with black drapes, and participants wore black clothing to maximize the contrast of the aerosol cloud, which was illuminated by three spotlights. The participants stood on an adjustable platform to maintain uniform height during performances. The platform’s location within the studio was carefully measured to ensure accurate spatial orientation. If coughing occurred during a performance, the task was repeated until completed without interruption.
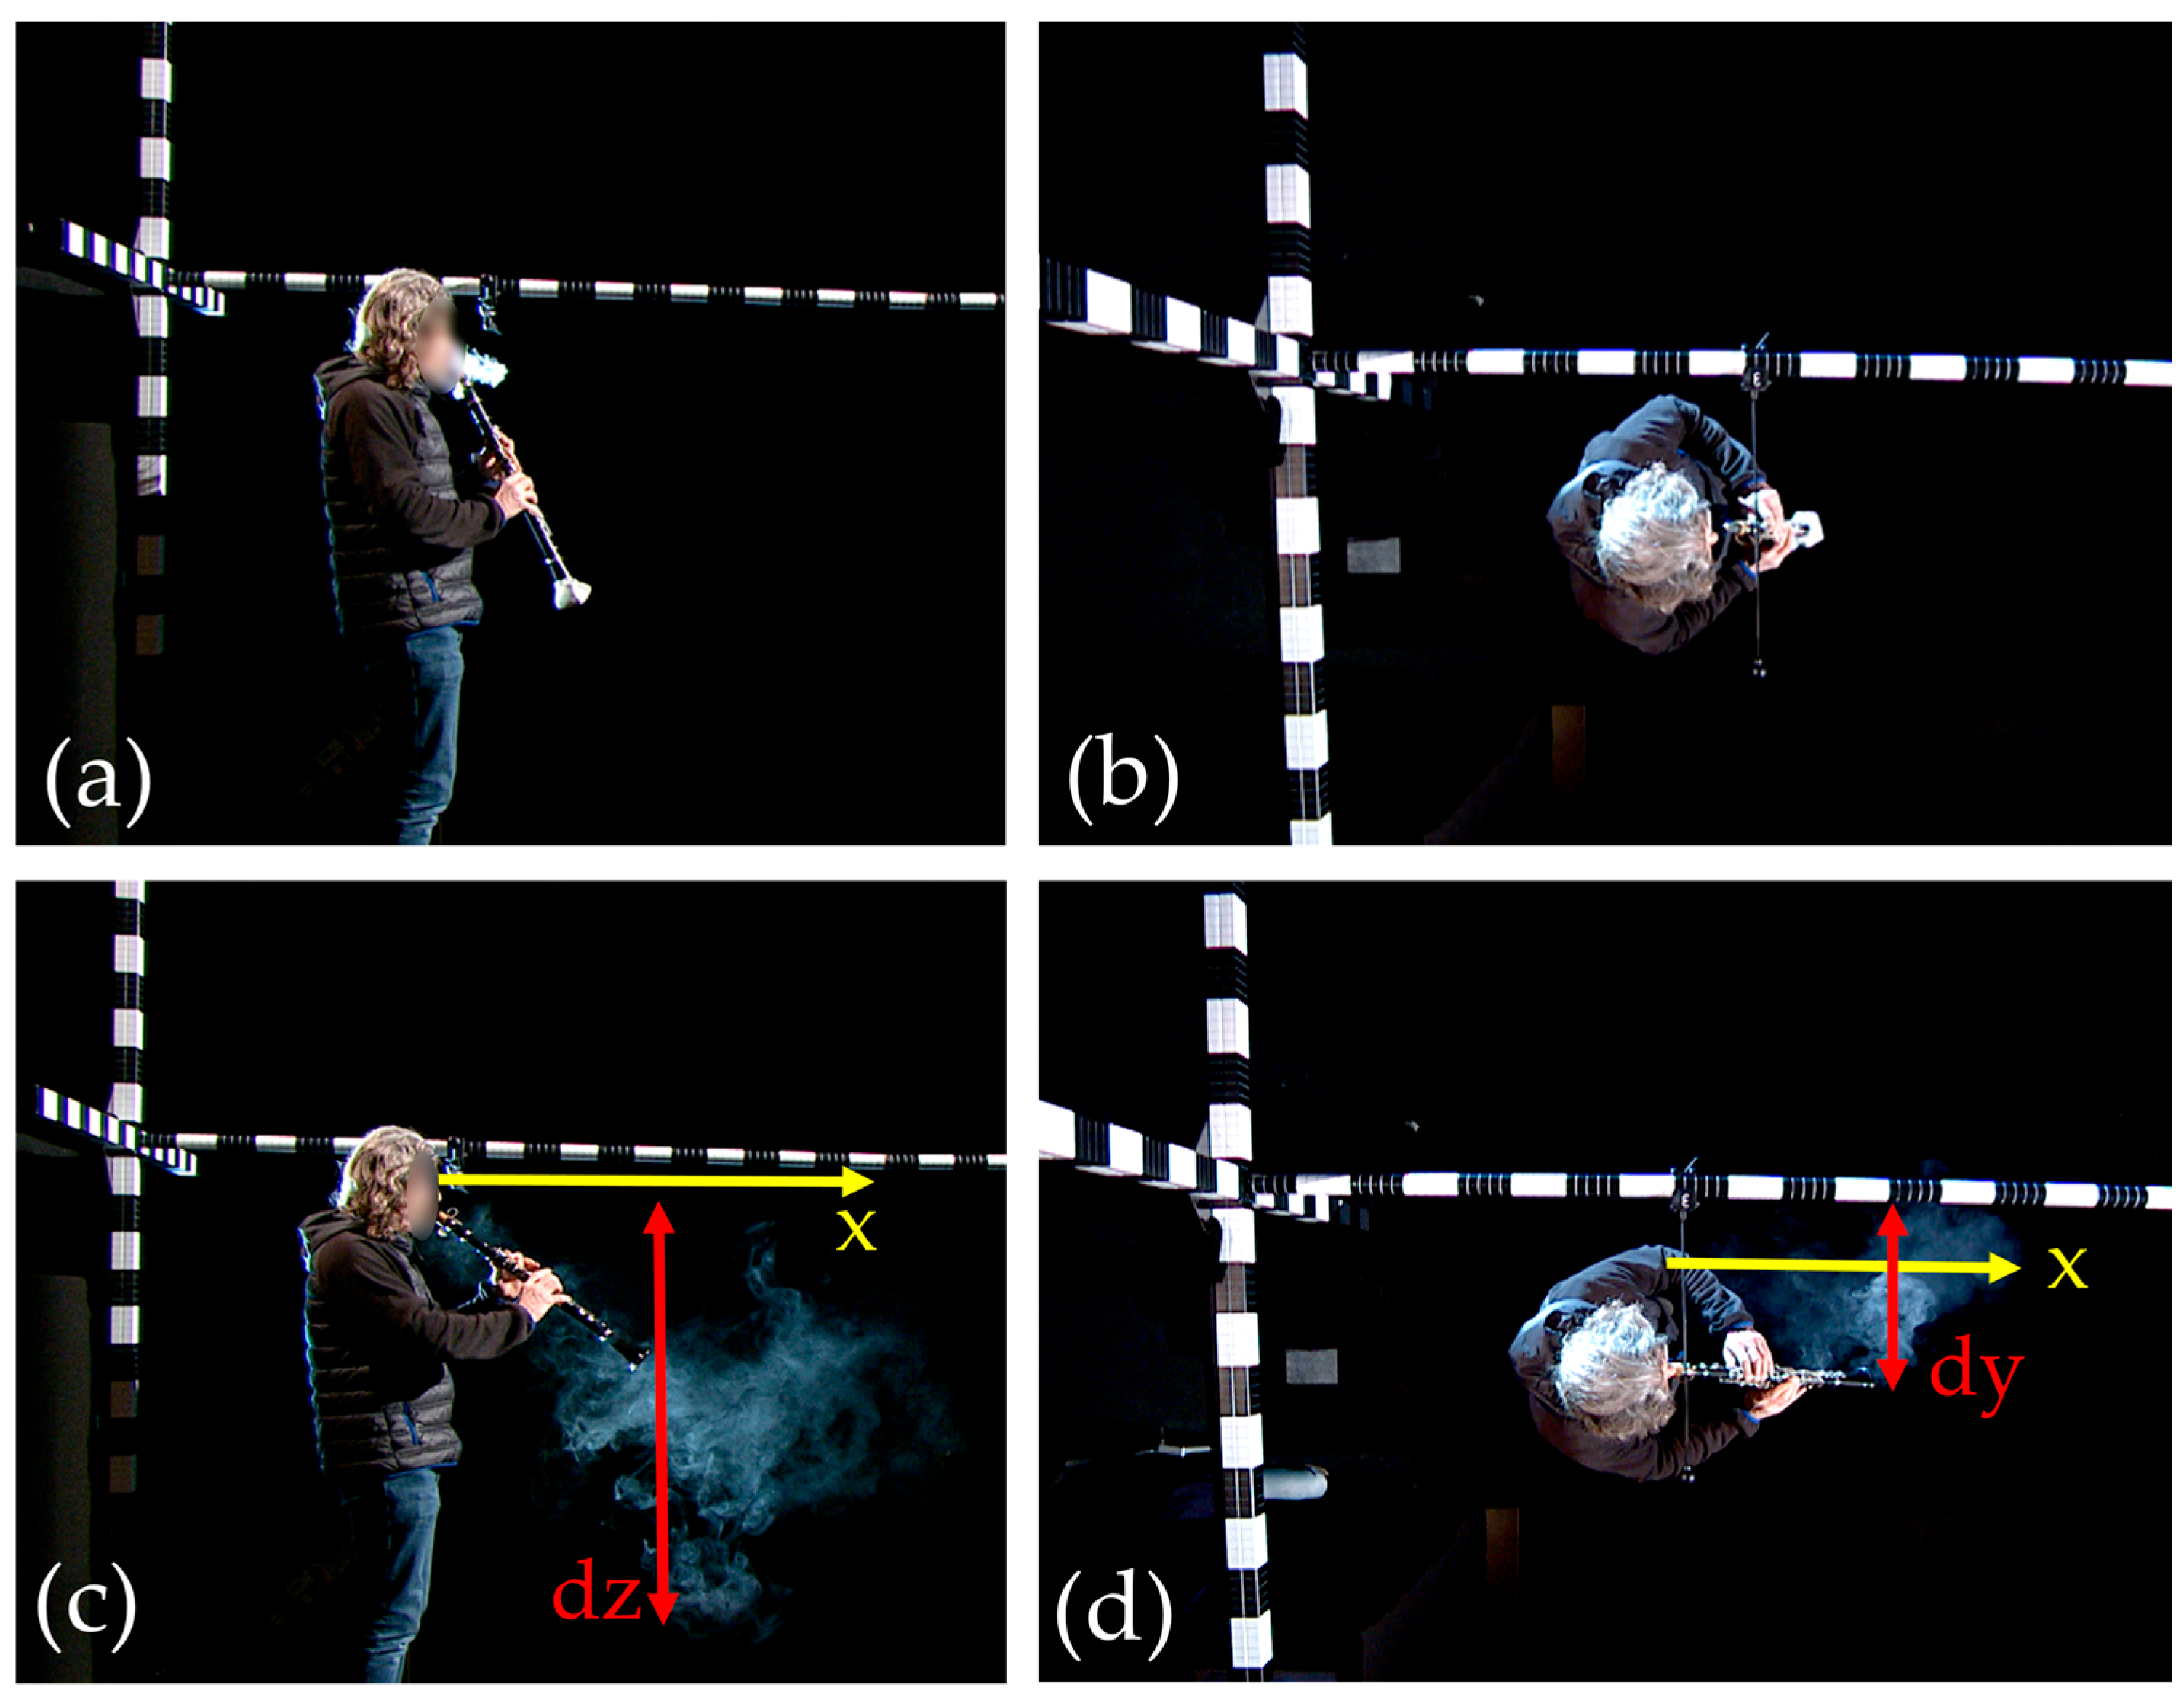
Video recordings were captured with three full HD Sony HDC 1700R cameras (Sony, Tokyo, Japan) equipped with Canon DIGI Super 25 XS (Canon, Tokyo, Japan) and Fujinon HA 14 × 4.5BERM/BERD lenses (Fujifilm, Tokyo, Japan), positioned to capture the aerosol dispersion in x, y, and z directions, as shown in Figure 3. Because of the room’s air drift, the diameter for the y and z dimensions (in the following labeled as dy and dz) was calculated in a later evaluation. The resolution was 1920 × 1080 pixels. The sampling rate was 25 frames per second, and the time of exposure was set to maximum, i.e., approx. 0.039 s. The aerosol particle cloud was illuminated by three white light television spotlights. Those were arranged on the left-hand side of the stage in a height of approx. 3 m above the platform outside of the cameras’ view. With regard to the x direction, one spotlight was behind the subjext, one immediately in front, and one at the platform’s end.
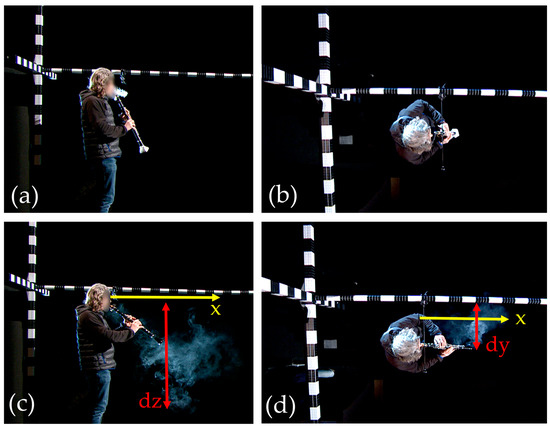
Figure 3.
Exemplary images of a clarinetist from (a) a side view at the beginning of playing and (c) with smoke dispersion, recording the x and dz dimensions, and (b) a top–down perspective at the beginning of playing and (d) with smoke dispersion, recording the x and dy dimensions. The coordinate system’s origin was set at the mouthpiece opening of the player.
Acoustic signals were sampled using Sennheiser KMR 81 and ME62 microphones (Sennheiser SE & Co. KG, Wedemark-Wennebostel, Germany), calibrated with the Sopran software for accurate sound pressure level measurements. The studio was ventilated before each new performance to ensure the clearance of the aerosol particle cloud of the previous task.
2.4. Data Analysis
Video recordings were pre-processed with the Sensarea software 1.12.1 (Grenoble Institute of Technology, France) for masking non relevant portions of the video pictures. The in-house software Glottis Analysis Tools 2020 (GAT, University Erlangen-Nürnberg, Erlangen, Germany) [33,34] was then used for the segmentation the area captured by the aerosol cloud in each frame of the video based on a threshold-based algorithm. After the segmentation, the dimension of the cloud was measured in all three spatial directions using MATLAB R2021b (The Mathworks Inc., Natick, MA, USA), and the temporal waveform of its spatial spreading was calculated.
2.5. Statistical Analysis
To assess the effectiveness of two safety devices for the spreading reduction in the aerosol cloud, statistical tests were employed to reveal significant differences between tasks with and without the devices. The analysis was performed using a Friedman test with a significance level of p = 0.05 applied to the three groups (without mask, cotton molton, paper towel), followed by post hoc group comparison (Bonferroni correction; p = 0.0167) testing to evaluate differences between specific tasks with and without protection systems. The non-parametric nature of the tests was due to the non-normal distribution of the data, considering seven instruments and two time points: t0 being the time point when the musician stopped playing and tmax when the cloud had the largest extension in the x, dy, and dz dimensions. All statistical tests were made in SPSS version 24 (IBM, Armonk, NY, USA).
3. Results
Table 1 shows the average dispersion dimensions of the aerosol cloud for all instruments in the x, dy, and dz dimensions at time t0 when the musicians stopped playing. For the dy and dz dimensions, the diameter was calculated because of the room’s air draft. It was observed that, on average, the dispersion in the x dimension exhibited the highest distance, reaching approx. 0.9 m wearing no safety device. The cotton molton system appears to contain the spread in the x and dy dimensions, where it seems most effective in x dimension. A slightly greater cloud dispersion was noted with the paper towel protection system, especially in the dy and dz dimensions.

Table 1.
Average cloud dispersion at time t0 (end of playing instruments) in the x direction and dy and dz dimensions in m.
Table 2 shows the emission dimension at maximal distance over the hole task, indicating the maximum cloud dispersion achieved in the respective spatial dimensions, x, dy, and dz, which is independent from time. In the x dimension, the largest cloud dispersion was observed at 1.23 m, while the smallest increase was in the dy dimension at 0.46 m. The observation from Table 1, that the paper towel achieved longer cloud diameters especially in the dy and dz dimensions, was also confirmed at the maximal cloud diameter. The cotton molton protection system again appeared to cause lesser cloud spread in the x and dz directions.
Table 2.
Average maximum cloud dispersion of smoke expansion in the x direction and dy and dz dimensions in m.
Comparing the individual instruments without a protection system, the clarinet shows the highest cloud dispersion in the x dimension, reaching 2.28 m. The shortest forward dispersion was measured for the oboe at 0.72 m in the x dimension. Laterally in the dy dimension, the cloud spread was the greatest for the trombone at 0.96 m and the least for the bassoon at 0.11 m. In terms of upward dispersion in the dz dimension, the bassoon exhibited the greatest cloud spread at 1.36 m, while the least upward cloud emission in the dz dimension was measured for the oboe at 0.92 m.
For the cotton molton system, the greatest forward cloud emission in the x dimension was observed for the saxophone at 1.57 m, and the least for the oboe at 0.17 m. Laterally in the dy dimension, the trombone had the greatest cloud dispersion at 0.78 m, and the trumpet had the least at 0.25 m. Upwards in the dz dimension, the saxophone again had the greatest cloud emission at 2.02 m, with the oboe having the least at 0.24 m.
With the paper towel, the greatest forward cloud spreading in the x dimension was 1.48 m for the trombone and 0.74 m for the bassoon. Laterally in the dy dimension, the trombone had the greatest cloud dispersion at 1.48 m and the saxophone had the least at 0.30 m. Upwards in the dz dimension, the trombone reached 1.79 m, and the trumpet reached 0.80 m.
Table 3 shows the cloud spreading distances reached at t0 and tmax in the x, dy, and dz dimensions for all instruments with and without protection systems.
Table 3.
Dispersion of aerosol cloud at t0 and tmax for each instrument, (a) without protection, (b) with cotton molton, (c) and with paper towel in the x, dy, and dz dimensions.
3.1. Clarinet
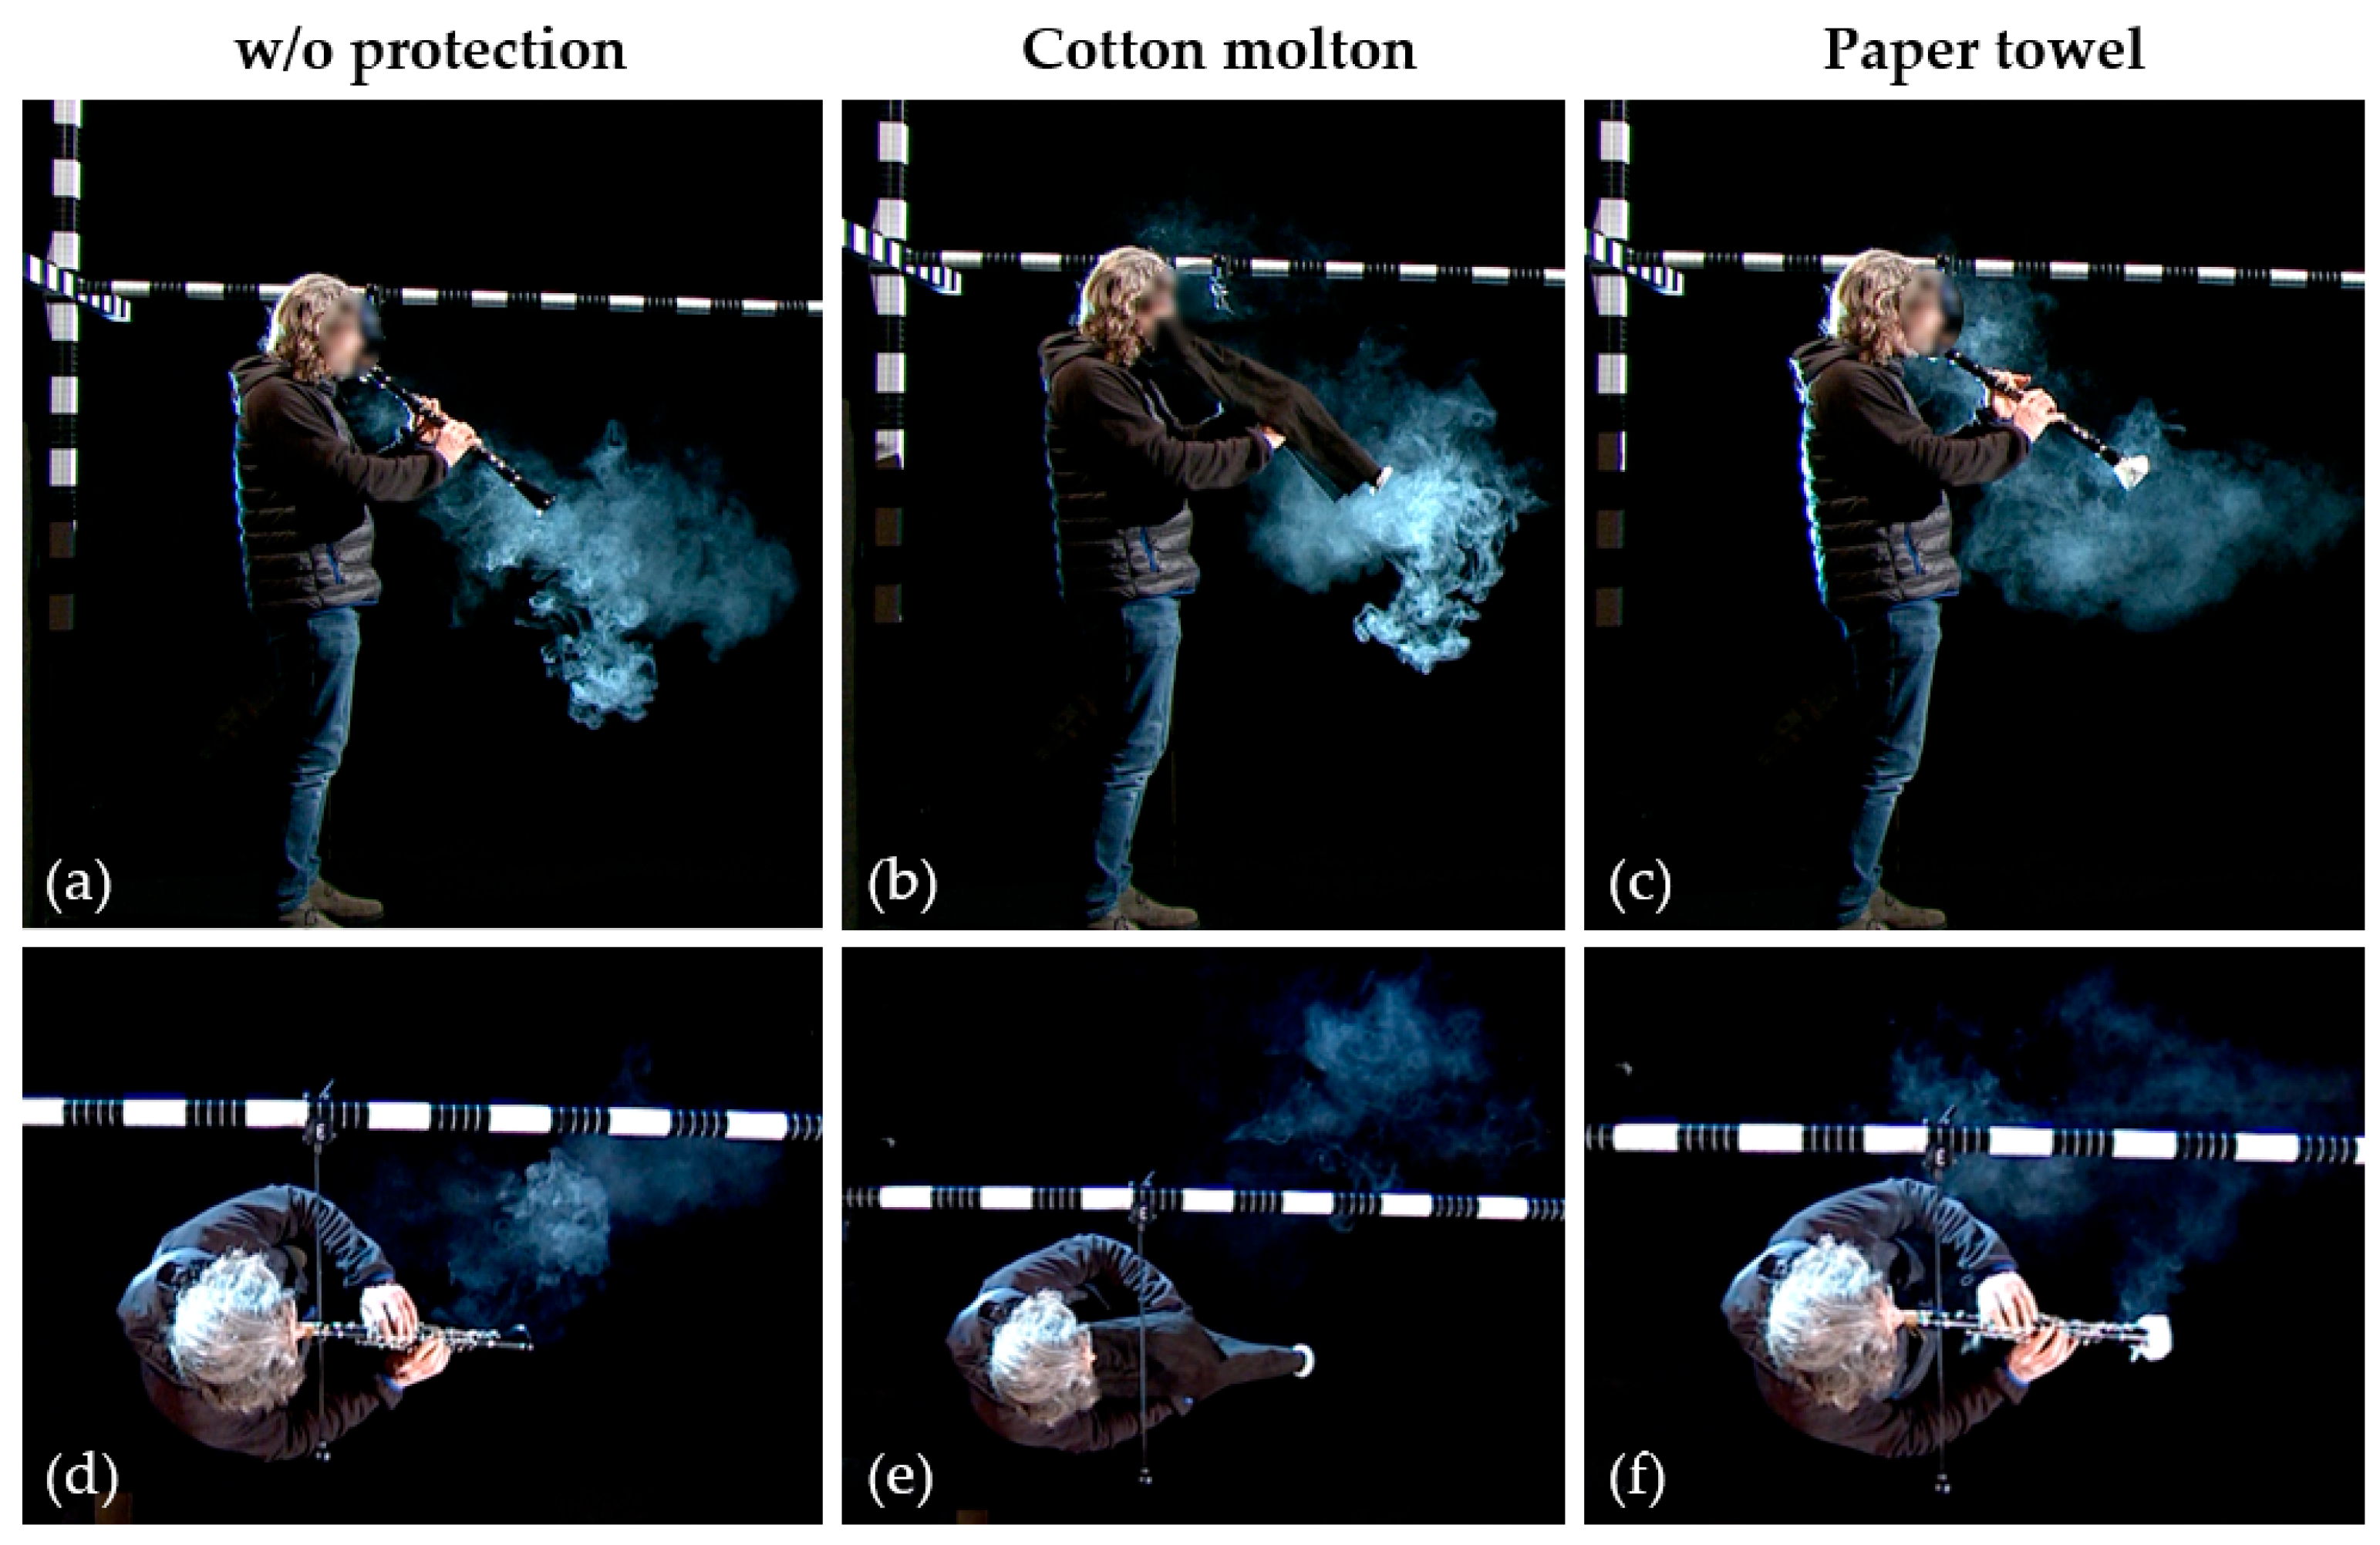
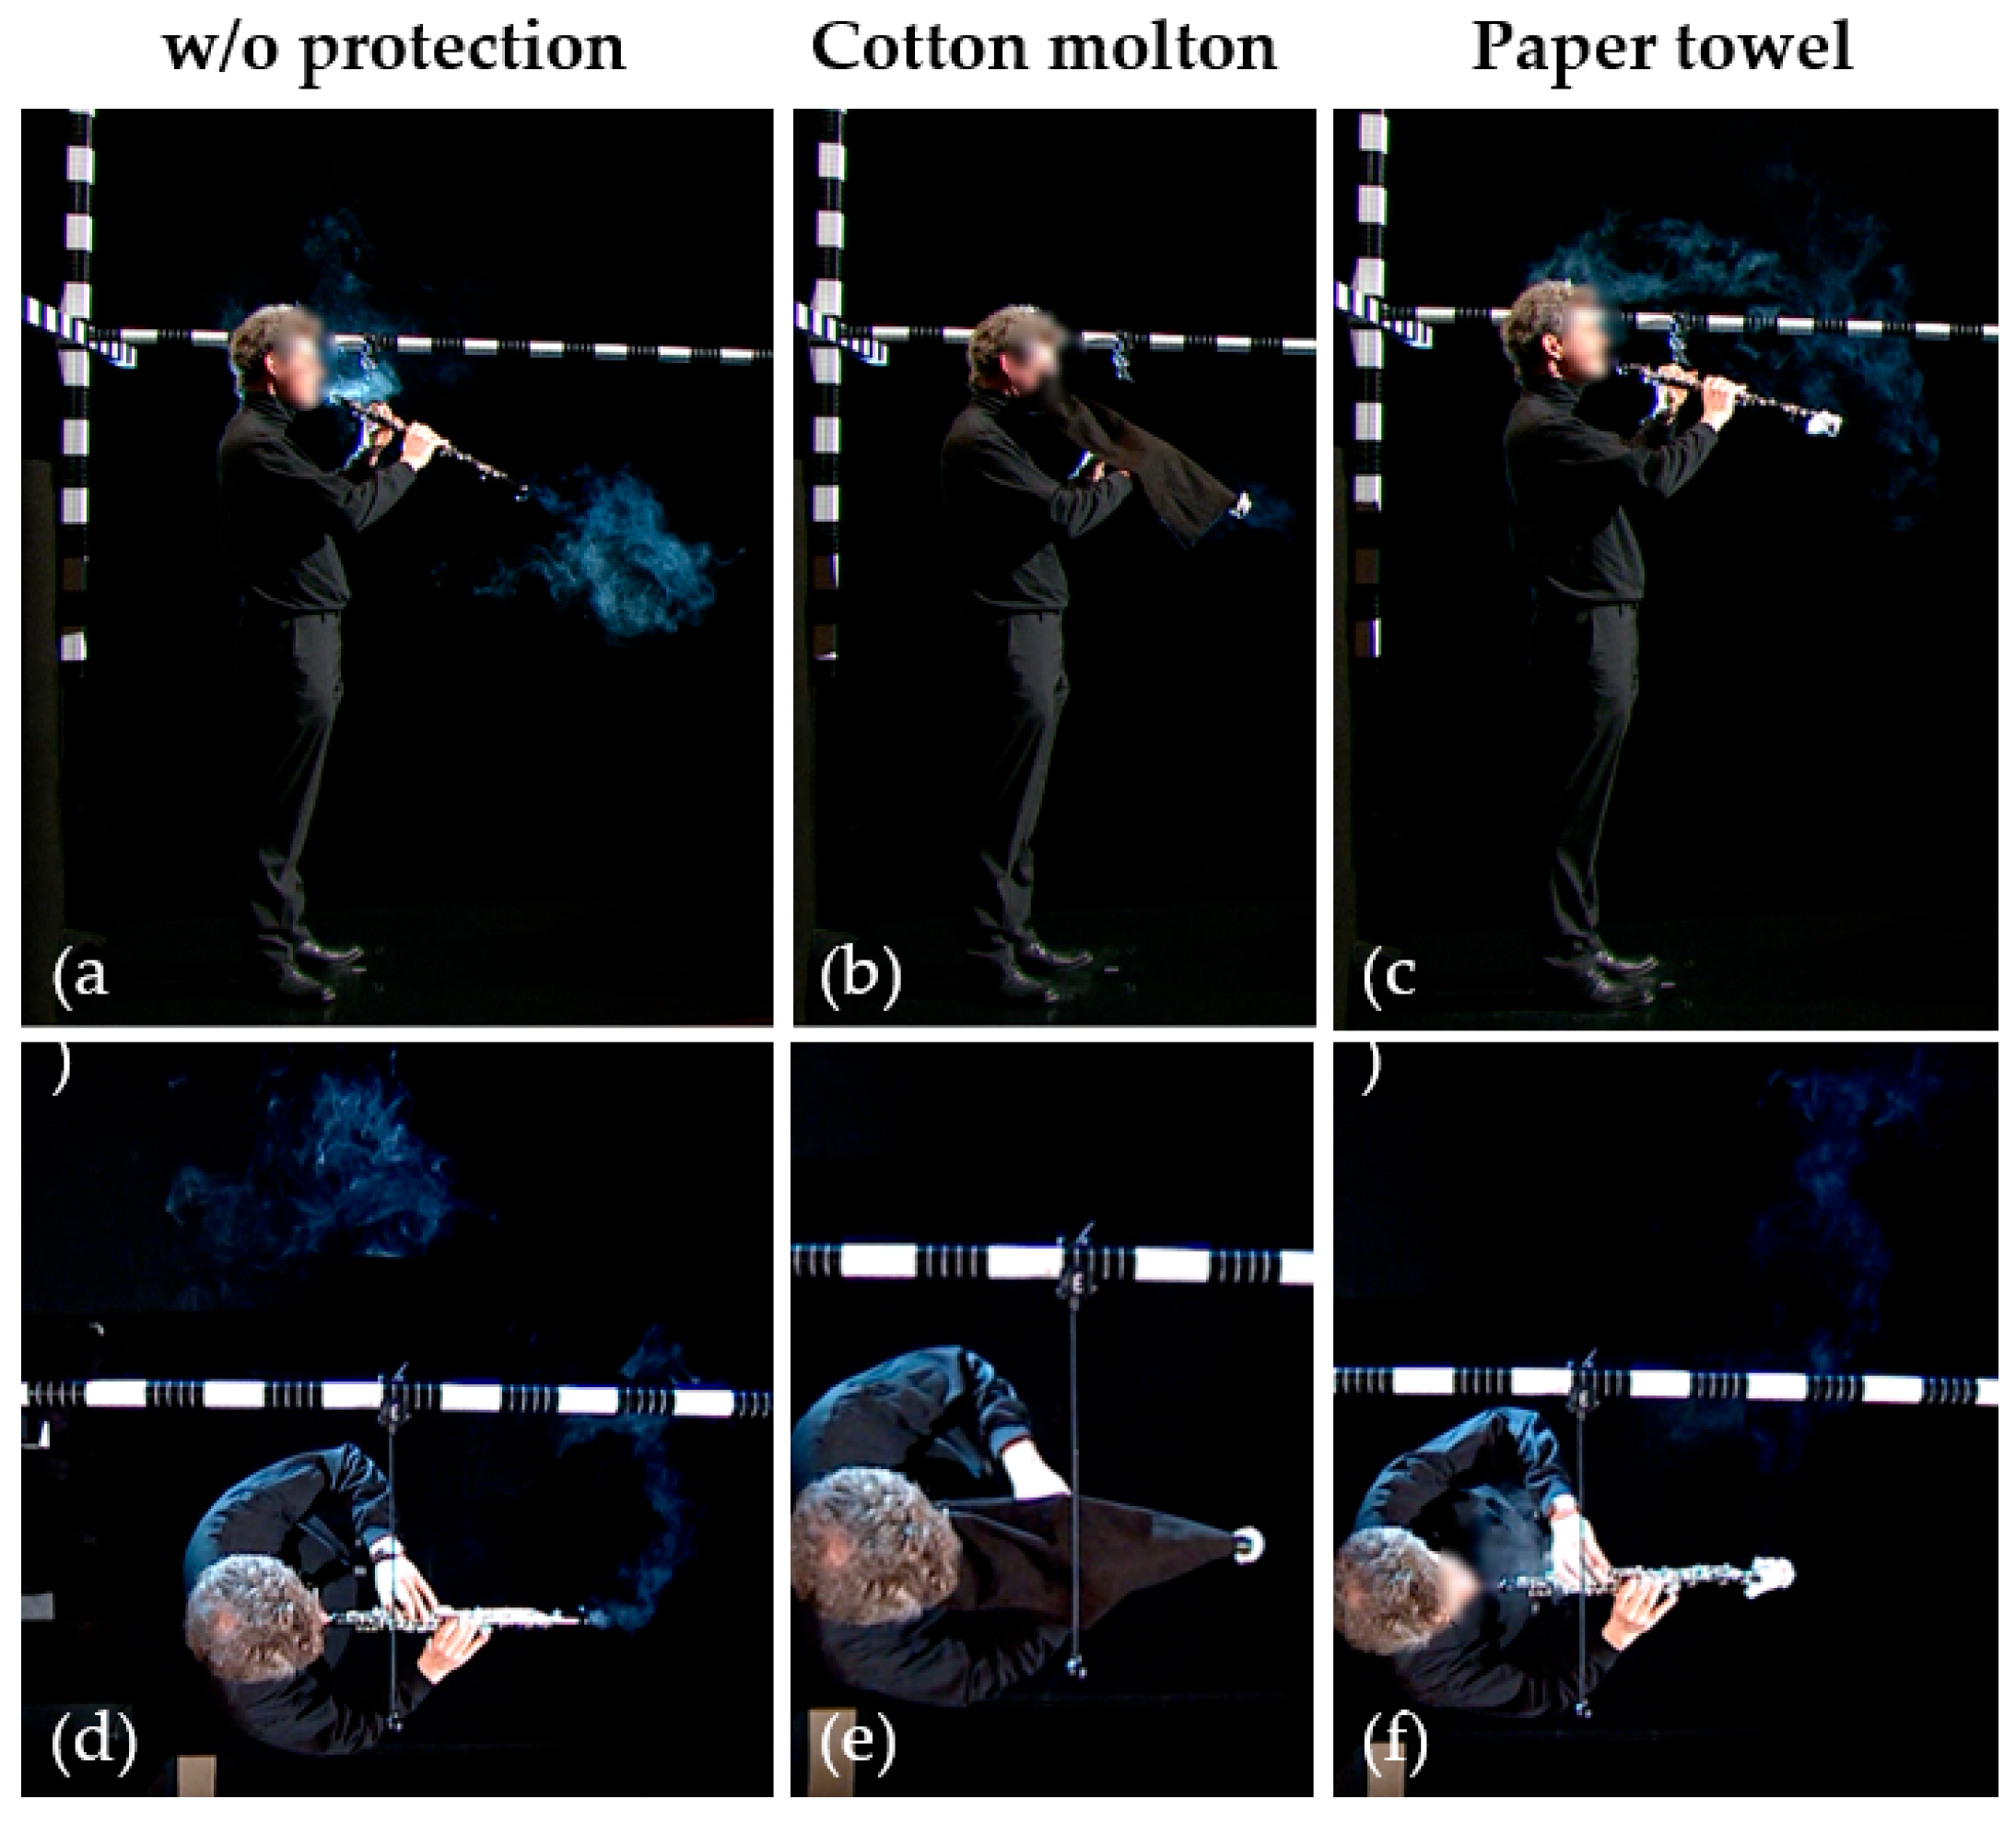
Figure 4 shows the cloud spreading of aerosols during clarinet playing for the two protection systems and without a protection system.

Figure 4.
Illustrated maximum cloud dispersion while playing the clarinet from the (a–c) side view for the x and dz dimensions and (d–f) top view for the dy dimension for the different protection systems and without protection.
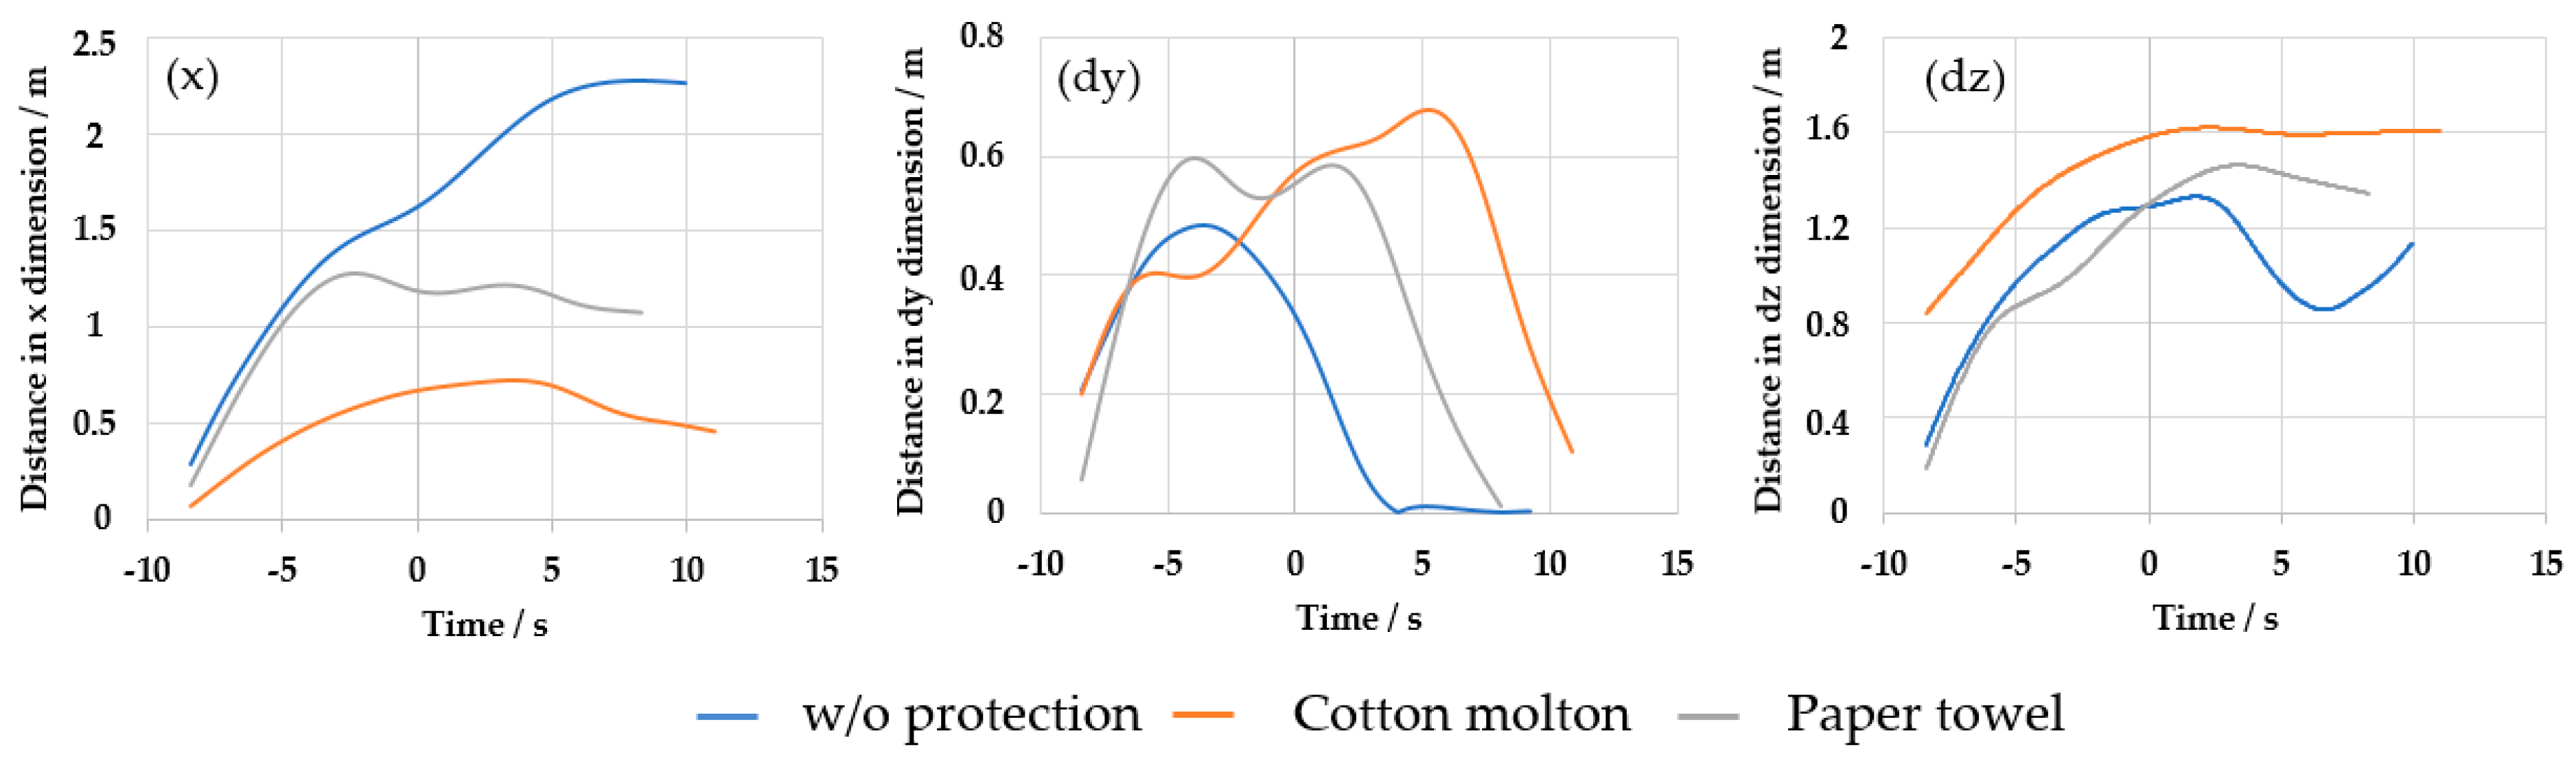
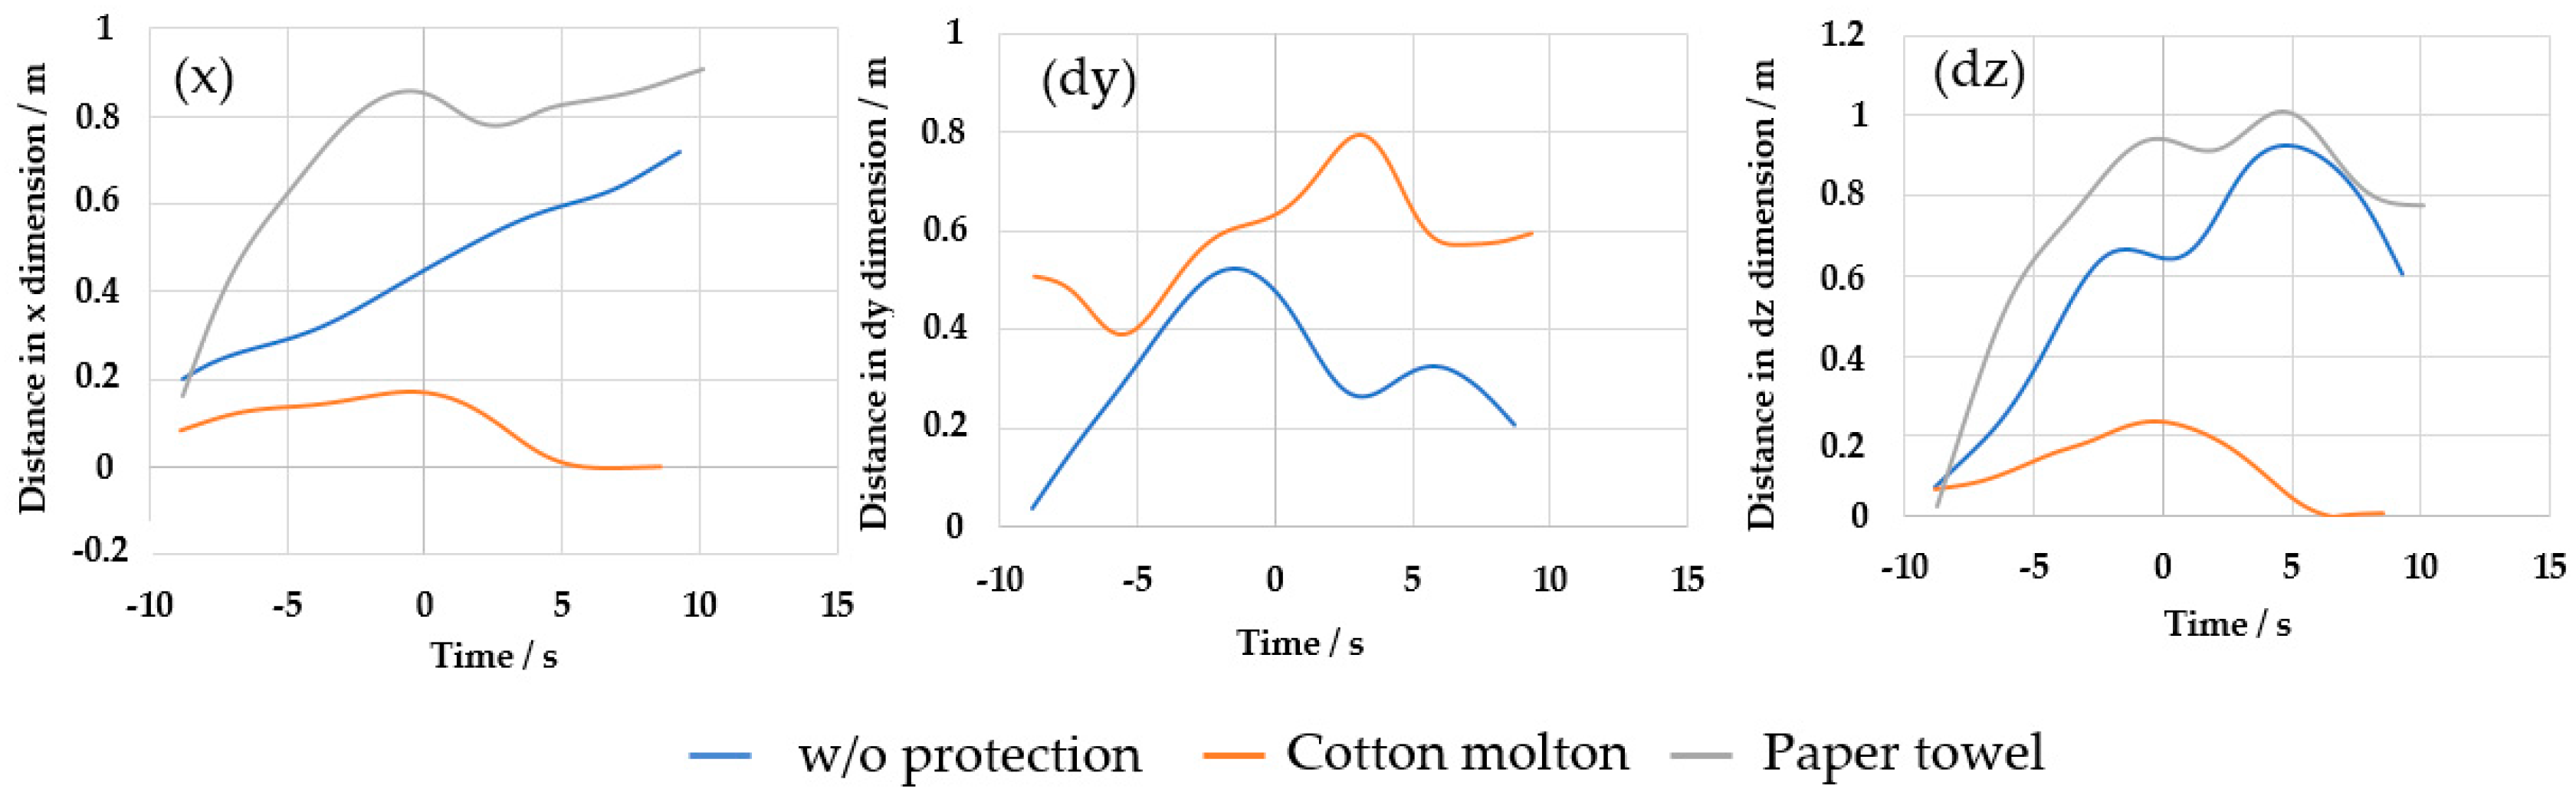
The results for the aerosol dispersion dimensions with and without the protection system for the clarinet are shown in Figure 5. The highest forward cloud dispersion in the x dimension was observed when playing the clarinet without any protection system, reaching a maximum spread of 2.29 m. In comparison, the cotton molton system showed the least maximum cloud emissions at 0.72 m. With the paper towel protection, a lesser forward cloud emission dimension of 1.27 m was achieved. The maximum cloud spreading was reached at different times for each system.
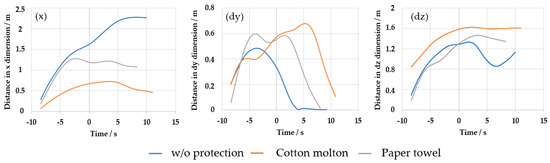
Figure 5.
The figure illustrates the cloud dispersion ranges for the clarinet without a protection system (blue curve), with the cotton molton protection system (orange curve), and with the paper towel protection system (gray curve) in the x dimension, dy dimension, and dz dimension, plotted over time in seconds.
Comparing the protection systems in the dy dimension, the greatest cloud spreading was observed with the cotton molton system at 0.68 m, whereas the task without any protection system showed the least cloud spreading with 0.49 m. Each of the curves exhibited a steep decline in cloud spreading distance at different times. The curve for the cotton molton system even showed an increase up to 5 s after the end of playing.
In terms of upward cloud spreading (z direction), it was noted that shortly after the end of playing, the curve without any protection system decreased, reducing the cloud spreading, whereas both protection systems continued to disperse further. In particular, the paper towel protection showed a steep rise. Therefore, playing without protection reached a maximum dz cloud diameter of 1.33 m. The cotton molton system achieved a maximum cloud spreading of 1.62 m, and with the paper towel, it was 1.46 m.
Overall, the cotton molton protection system seems to provide good protection in the x dimension when playing the clarinet but causes the widest cloud dispersion laterally (dy dimension) and upwards (dz dimension).
3.2. Saxophone
As shown in Figure 6, the spread of aerosols during saxophone playing was analyzed for the two protection systems and without any protection. The side view [Figure 6a–c] displays the cloud dimensions in the x and dz axes, whereas the top view [Figure 6d–f] highlights the cloud spreading in the dy axis.
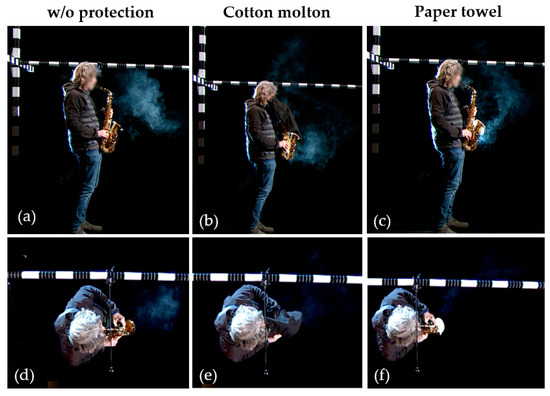
Figure 6.
Illustrated maximum cloud dispersion while playing the saxophone from the (a–c) side view of the x and dz cloud dispersion and (d–f) top view of the dy cloud dispersion for the different protection systems and without protection.
The evaluation showed an initially greater cloud spread in x when playing the saxophone without any protection system, which can be seen in Figure 7—(x). However, towards the end of playing, a flattening of the curve without a mask and a short continued increase with the cotton molton system was observed. The maximum x cloud emission without protection was 1.56 m, with the cotton molton system it was 1.57 m, and with the paper towel the least cloud spreading of 1.31 m was reached.
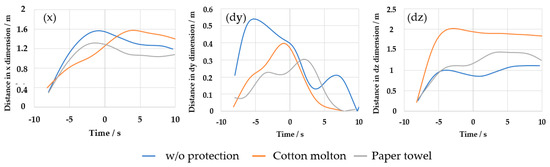
Figure 7.
The figure illustrates the cloud spreading ranges for the saxophone without a protection system (blue curve), with the cotton molton protection system (orange curve), and with the paper towel protection system (gray curve) in the x dimension, dy dimension, and dz dimension, plotted over time in seconds.
In the dy dimension [see Figure 7—(dy)], i.e., laterally, the maximum cloud dispersion without protection was observed right at the beginning of playing at 0.54 m, and then it dropped sharply. Overall, the greatest was observed without any protection system. The cotton molton protection reached its maximum just before the end of playing at 0.39 m and then continuously decreased. With the paper towel, the maximum of 0.30 m was only reached after the end of playing.
Regarding the upward emission [dz dimension, Figure 7—(dz)], the cotton molton system reached the greatest cloud emission before the end of playing at 1.62 m. Indeed, playing without protection seemed to result in the least upward emission.
3.3. Trombone
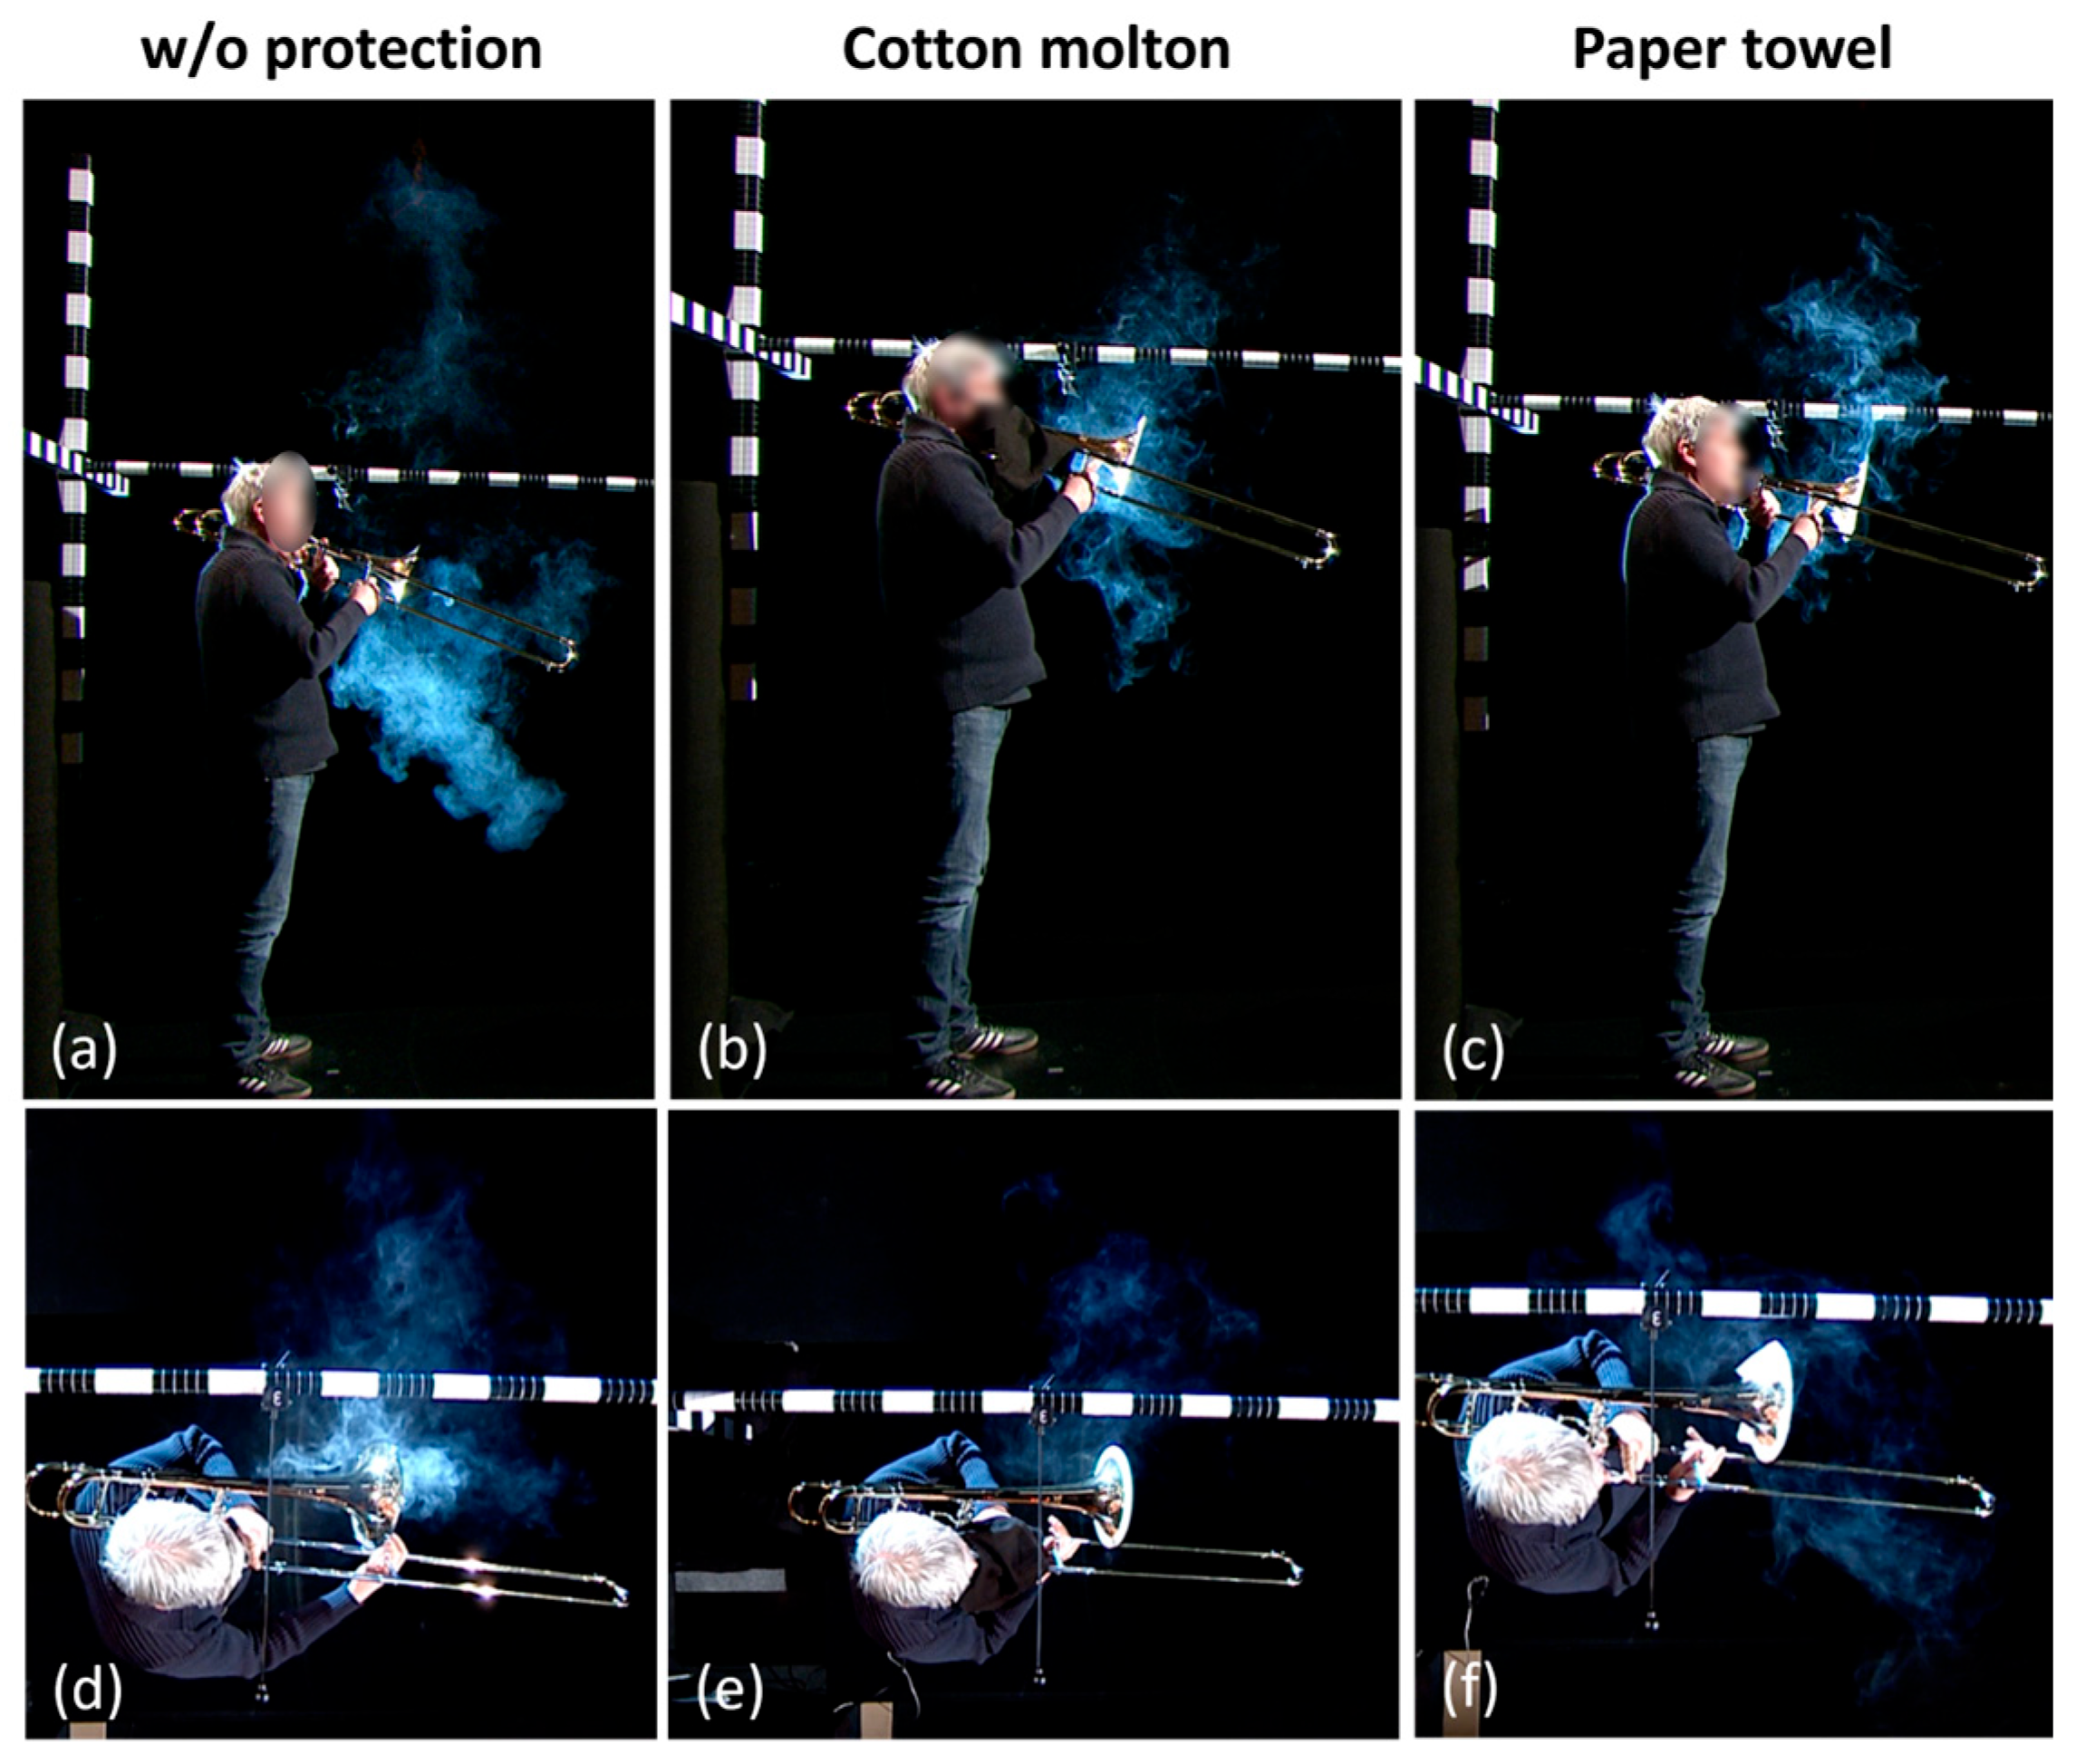
Figure 8 presents the aerosol spread during trombone playing under three conditions: with two different protection systems and without protection. The side view images [Figure 8a–c] capture the cloud spreading in the x and dz dimensions, while the top view images [Figure 8d–f] capture it in the dy dimension.

Figure 8.
Illustrated maximum cloud dispersion while playing the trombone from the (a–c) side view of the x and dz cloud dispersion and (d–f) top view of the dy cloud dispersion for the different protection systems and without protection.
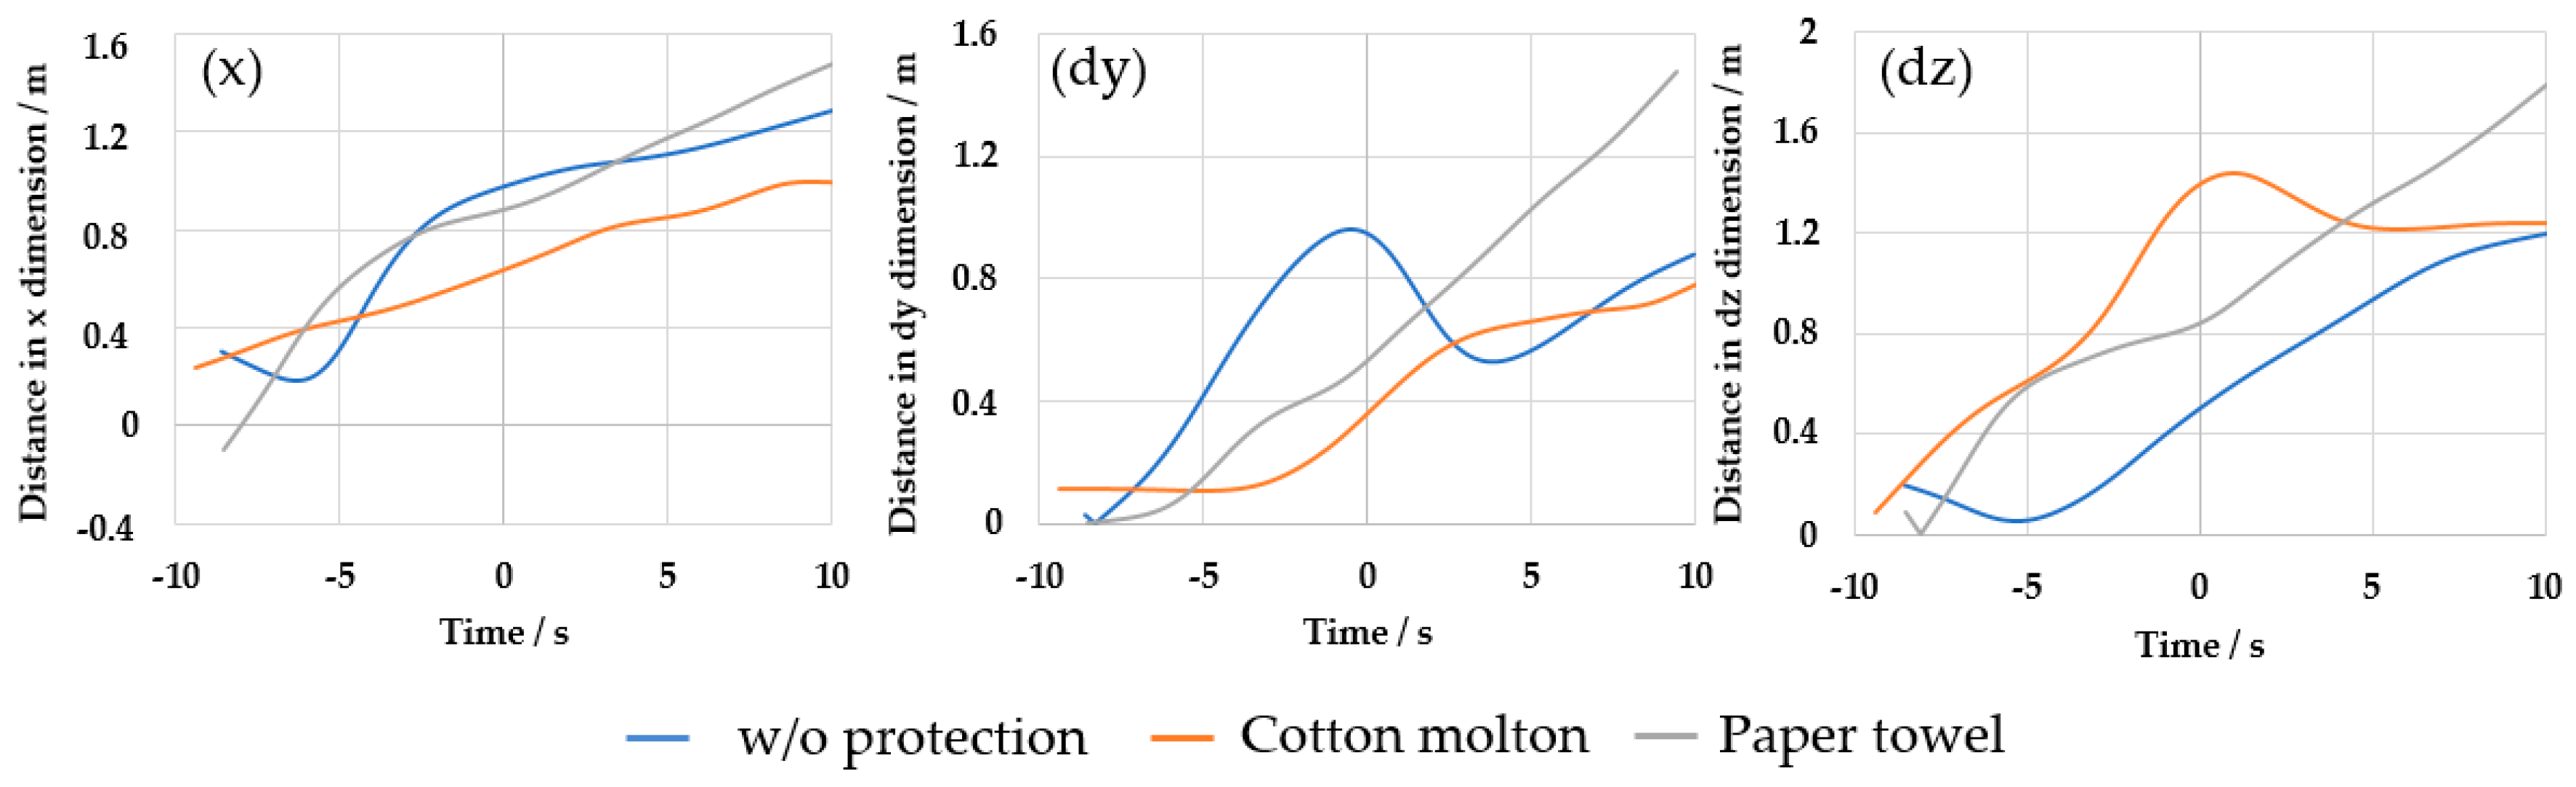
The evaluation of the trombone showed that the maximum cloud spread in the x dimension for the trombone occurred after the playing time, which can be seen in Figure 9—(x). Compared to the previously described instruments, all curves continued to rise steadily and did not decrease even after the recording ended. The cotton molton protection system showed the least cloud emissions, both at time t0 = 0.97 m and tmax = 1.28 m.
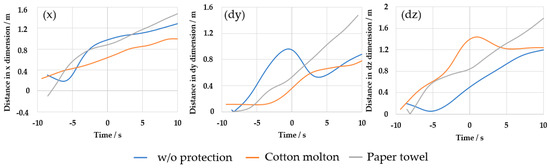
Figure 9.
The figure illustrates the cloud dispersion ranges for the trombone without a protection system (blue curve), with the cotton molton protection system (orange curve), and with the paper towel protection system (gray curve) in the x dimension, dy dimension, and dz dimension, plotted over time in seconds.
In the dy dimension [Figure 9—(dy)], the greatest cloud dispersion without a protection system was initially observed at 0.96 m, reached before the end of playing. However, after the end of playing, the curve with the paper towel continued to rise sharply, while the curve without protection slowly decreased. Eventually, the paper towel reached a maximum dispersion of 1.47 m. The cotton molton system initially offered the least cloud emissions, then rose again after the end of playing, reaching a maximum cloud dimension of 0.78 m, still less than the others.
Regarding the upward cloud spread [dz dimension, see Figure 9—(dz)], the trombone showed the widest cloud dispersion with cotton molton protection at 1.44 m until the end of playing, after which the curve decreased. However, the cloud spread without protection and with the paper towel continued to rise to 1.19 m and 1.78 m, respectively.
3.4. Basoon
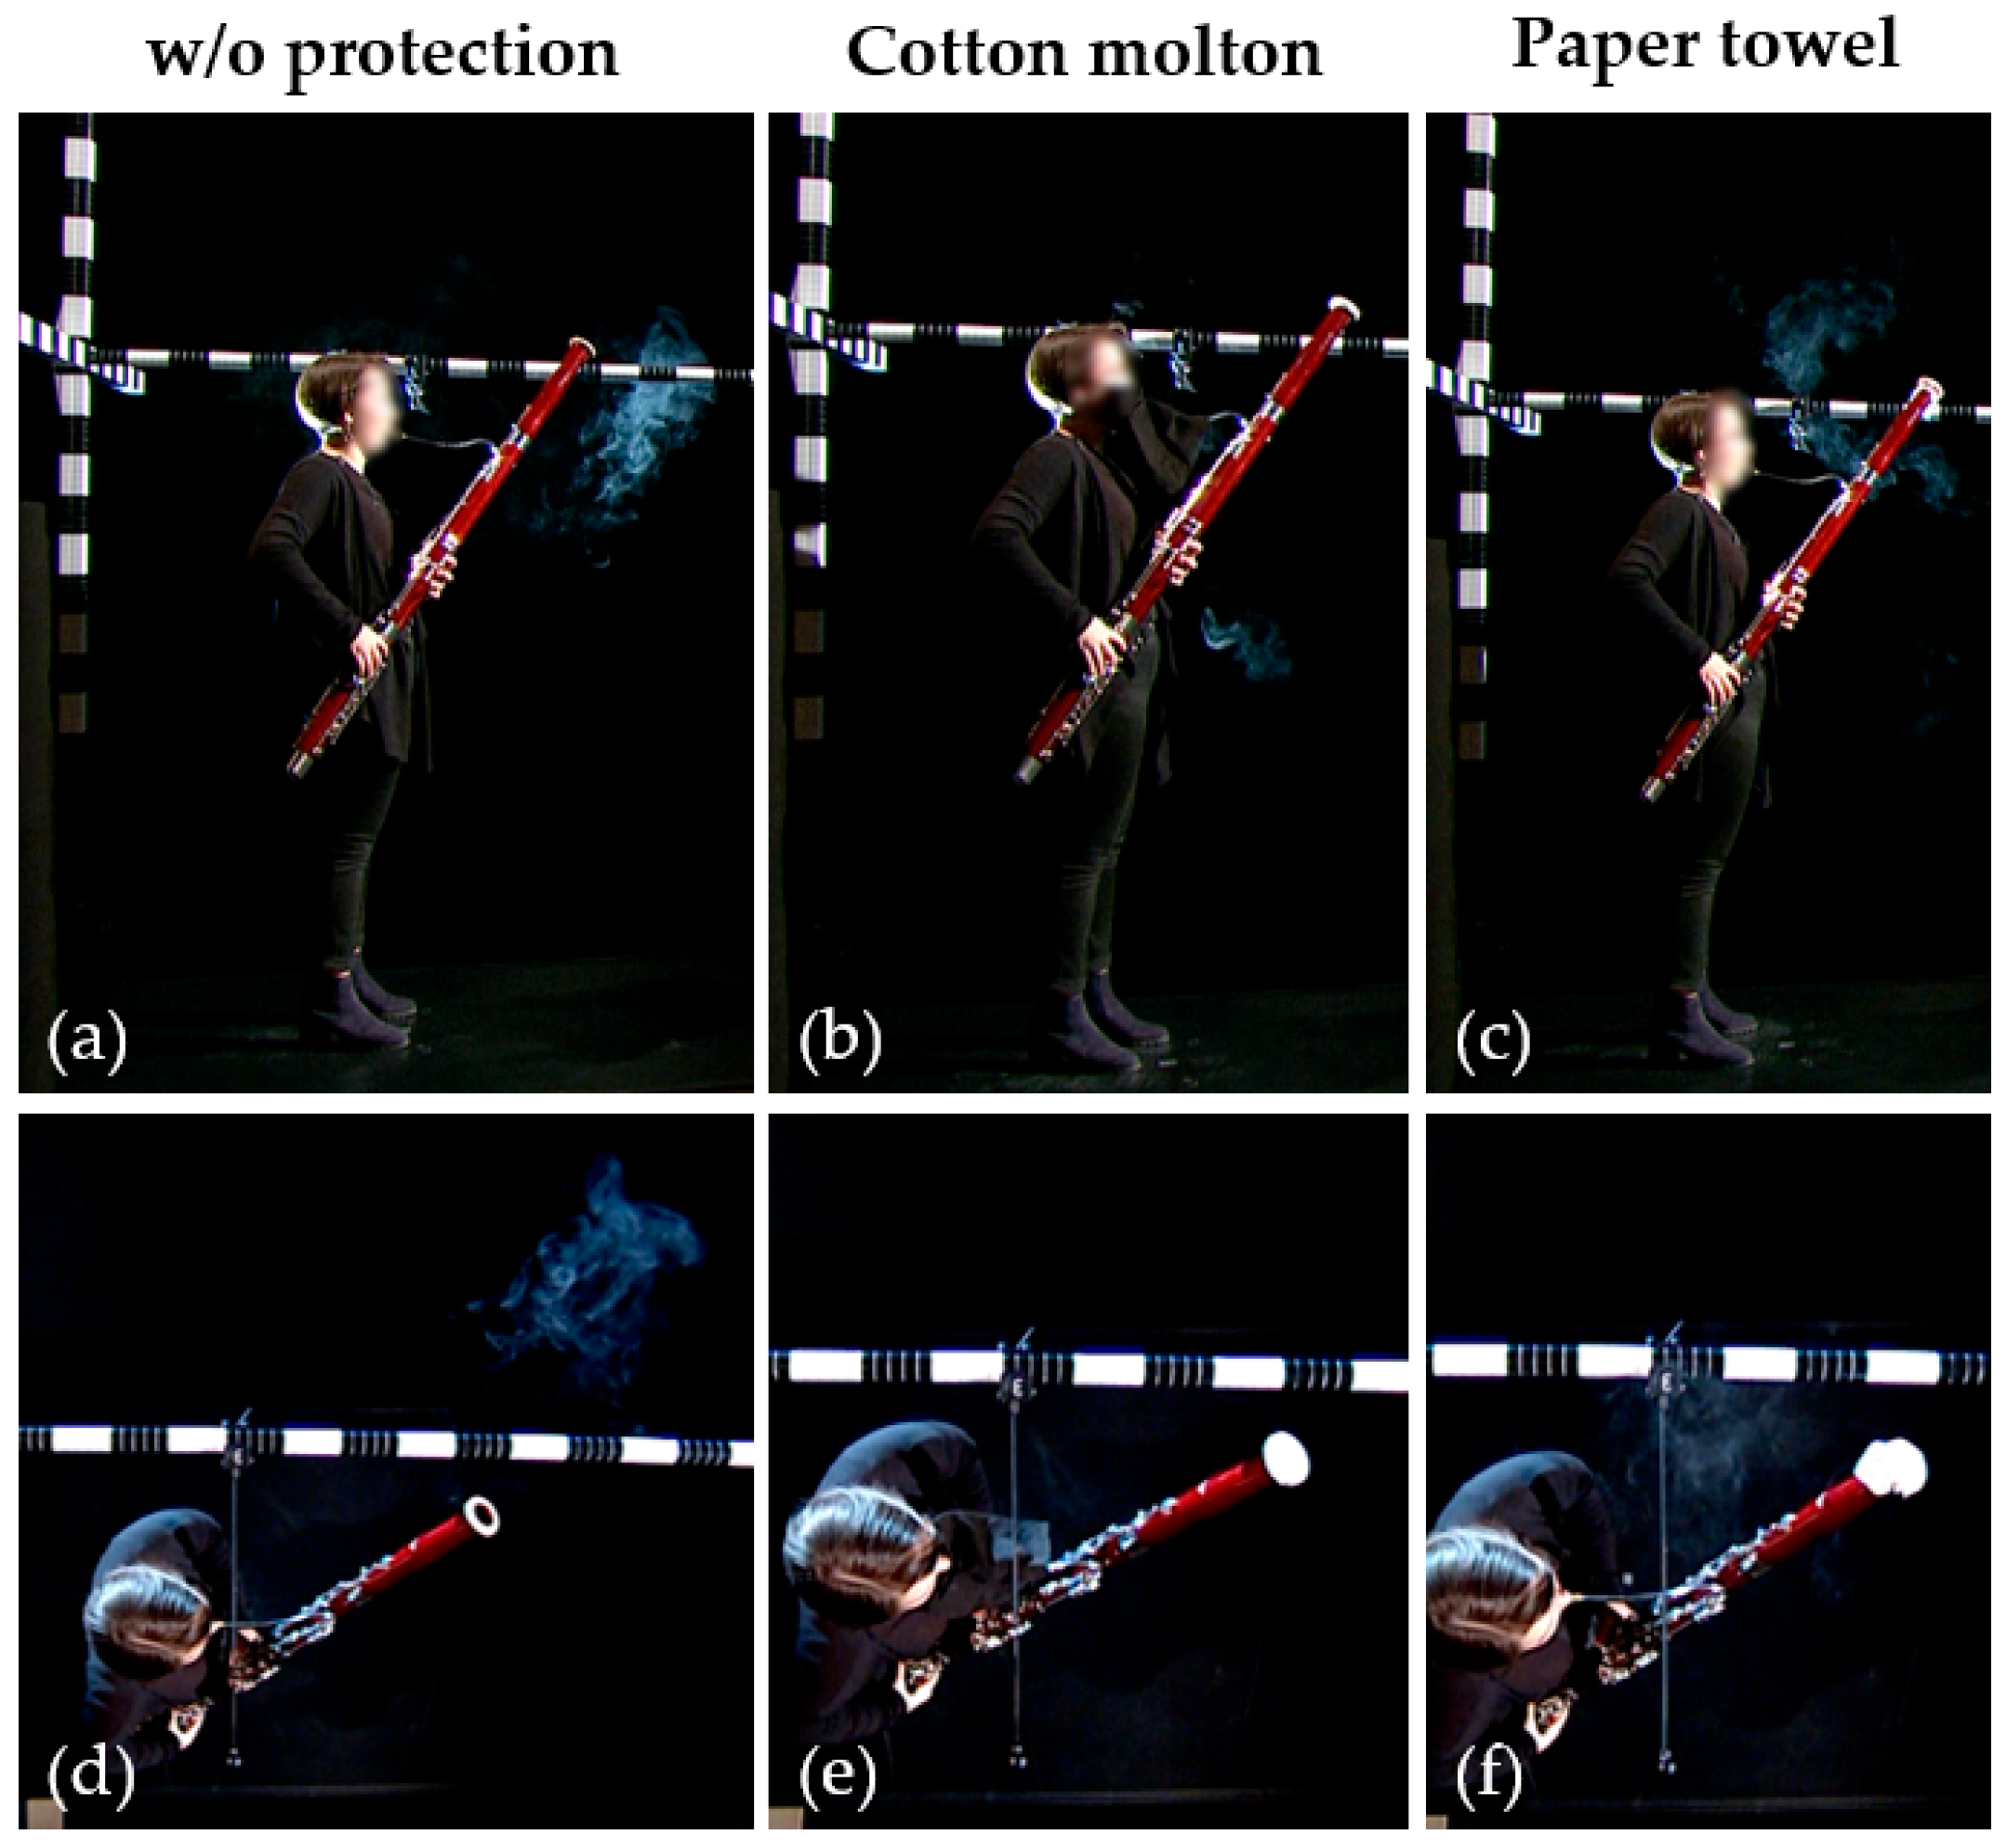
The cloud spreading of aerosols during bassoon playing is depicted in Figure 10 for both protection systems and the unprotected scenario. The side view [Figure 10a–c] shows the x and dz directional cloud emissions, and the top view [Figure 10d–f] illustrates the dy directional cloud emissions.
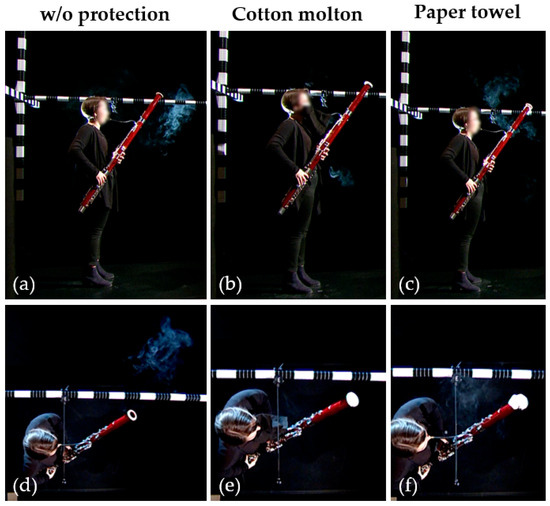
Figure 10.
Illustrated maximum cloud dispersion while playing the bassoon from the (a–c) side view of the x and z distances and (d–f) top view of the y distance for the different protection systems and without protection.
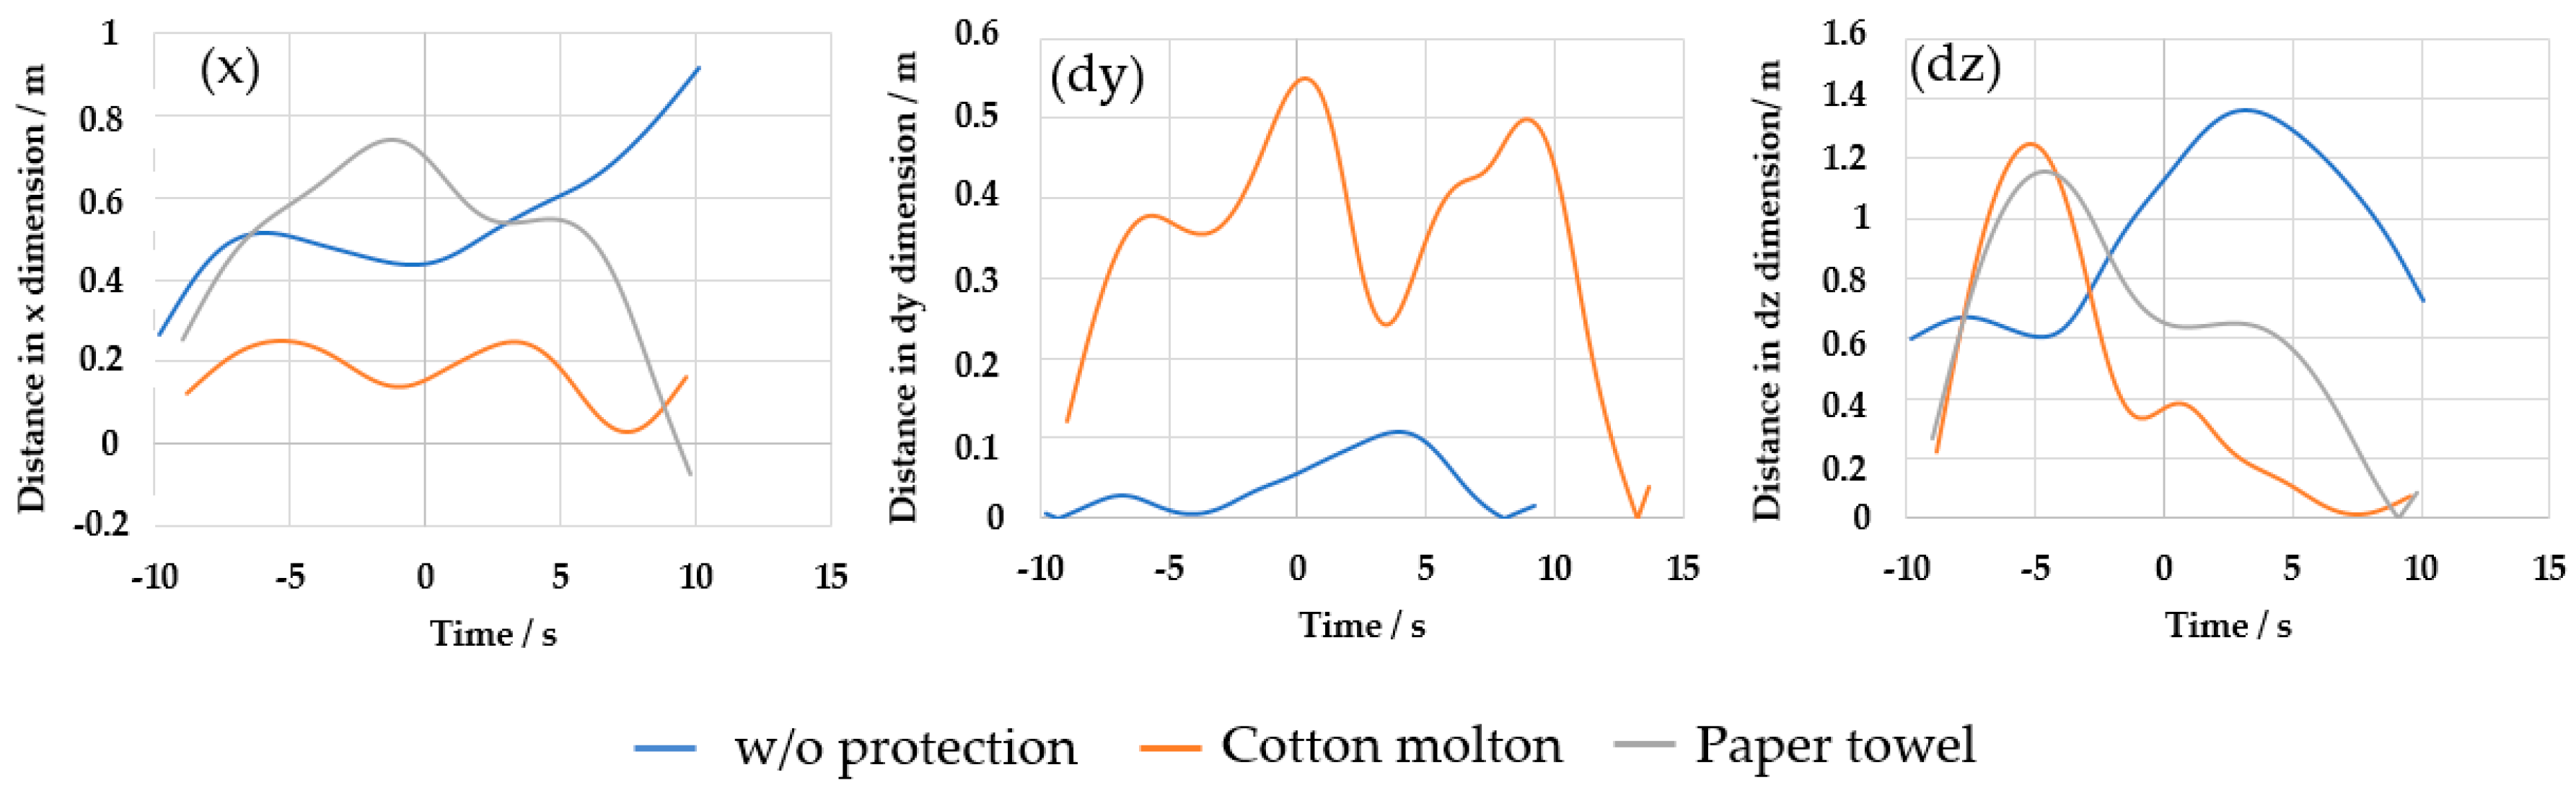
The greatest cloud emissions for the bassoon were initially observed with the paper towel, reaching a maximum cloud spread of 0.73 m in the x dimension before the end of playing [see Figure 11—(x)]. However, after the end of playing, this curve continuously decreased, while the cloud spread without a protection system continued to expand to a maximum of 0.91 m. The cotton molton protection showed the least cloud spread in the x dimension, with a maximum of 0.25 m.
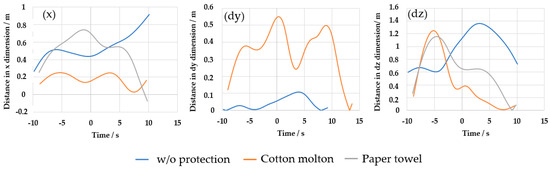
Figure 11.
The figure illustrates the cloud dispersion ranges for the bassoon without a protection system (blue curve), with the cotton molton protection system (orange curve), and with the paper towel protection system (gray curve) in the x dimension, dy dimension, and dz dimension, plotted over time in seconds.
In the segmentation of the bassoon’s cloud dispersion in the dy dimension, the cloud was not correctly represented by the program, and, therefore, the cloud could not be tracked and accordingly calculated, which can be seen in Figure 11—(dy). Thus, only the comparison between cloud dispersion without protection and with the paper towel is available. It was observed that with the paper towel, a significantly higher maximum cloud emission distance was achieved (0.55 m) than without protection (0.10 m).
For the bassoon, the widest cloud spread upward [dz dimension, Figure 11—(dz)] without a protection system was observed at 1.36 m after the end of playing, while the paper towel measured the least maximum cloud emission at 1.15 m. The cotton molton system peaked especially while playing at 1.24 m and then steadily decreased.
3.5. Oboe
Figure 12 shows the aerosol dispersion during oboe playing with two protection systems and without any protection. Side views [Figure 12a–c] demonstrate the cloud spread in the x and dz dimensions, while top views [Figure 12d–f] show the cloud spread in the dy dimension.
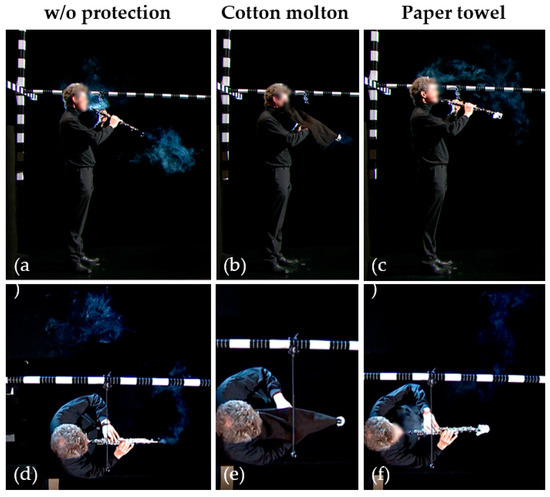
Figure 12.
Illustrated maximum cloud dispersion while playing the oboe from the (a–c) side view of the x and dz dimensions and (d–f) top view of the dy dimension for the different protection systems and without protection.
In the x dimension, when playing the oboe without any protective system, the maximum cloud dimension observed was 0.72 m, which was less than that achieved with the paper towel. The corresponding curve showed [see Figure 13—(x)] a steady increase. The curve with the paper towel initially showed a steady rise, reaching a maximum at 0.9 m, followed by a brief decline. Subsequently, a secondary increase was observed. The shortest cloud dispersion was observed with cotton, at 0.17 m. The curve in this case was comparatively flatter and continuously declined after the end of the play.
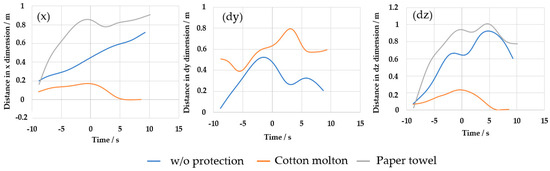
Figure 13.
The figure illustrates the cloud dispersion ranges for the oboe without a protection system (blue curve), with the cotton molton protection system (orange curve), and with the paper towel protection system (gray curve) in the x dimension, dy dimension, and dz dimension, plotted over time in seconds.
Similarly, in the dy dimension [Figure 13—(dy)], no visible cloud could be analyzed using GAT segmentation for the oboe. Therefore, only the plots for no protection and with paper towel were determined. Here, a shorter cloud emission distance was observed when playing without a protective system (0.52 m). The curve showed a steep rise until just before the end of play; then, it declined. With the paper towel, a maximum cloud emission distance of 0.79 m was reached in the dy dimension. The maximum occurred after the end of the play.
In the dz dimension, which is shown in Figure 13—(dz), the longest cloud emission was again observed with the paper towel (1.01 m). The shortest cloud emission was with cotton molton at 0.24 m. Without a protective system, a maximum cloud emission distance of 0.92 m was reached. The respective maxima were all achieved after the end of the play.
3.6. Horn
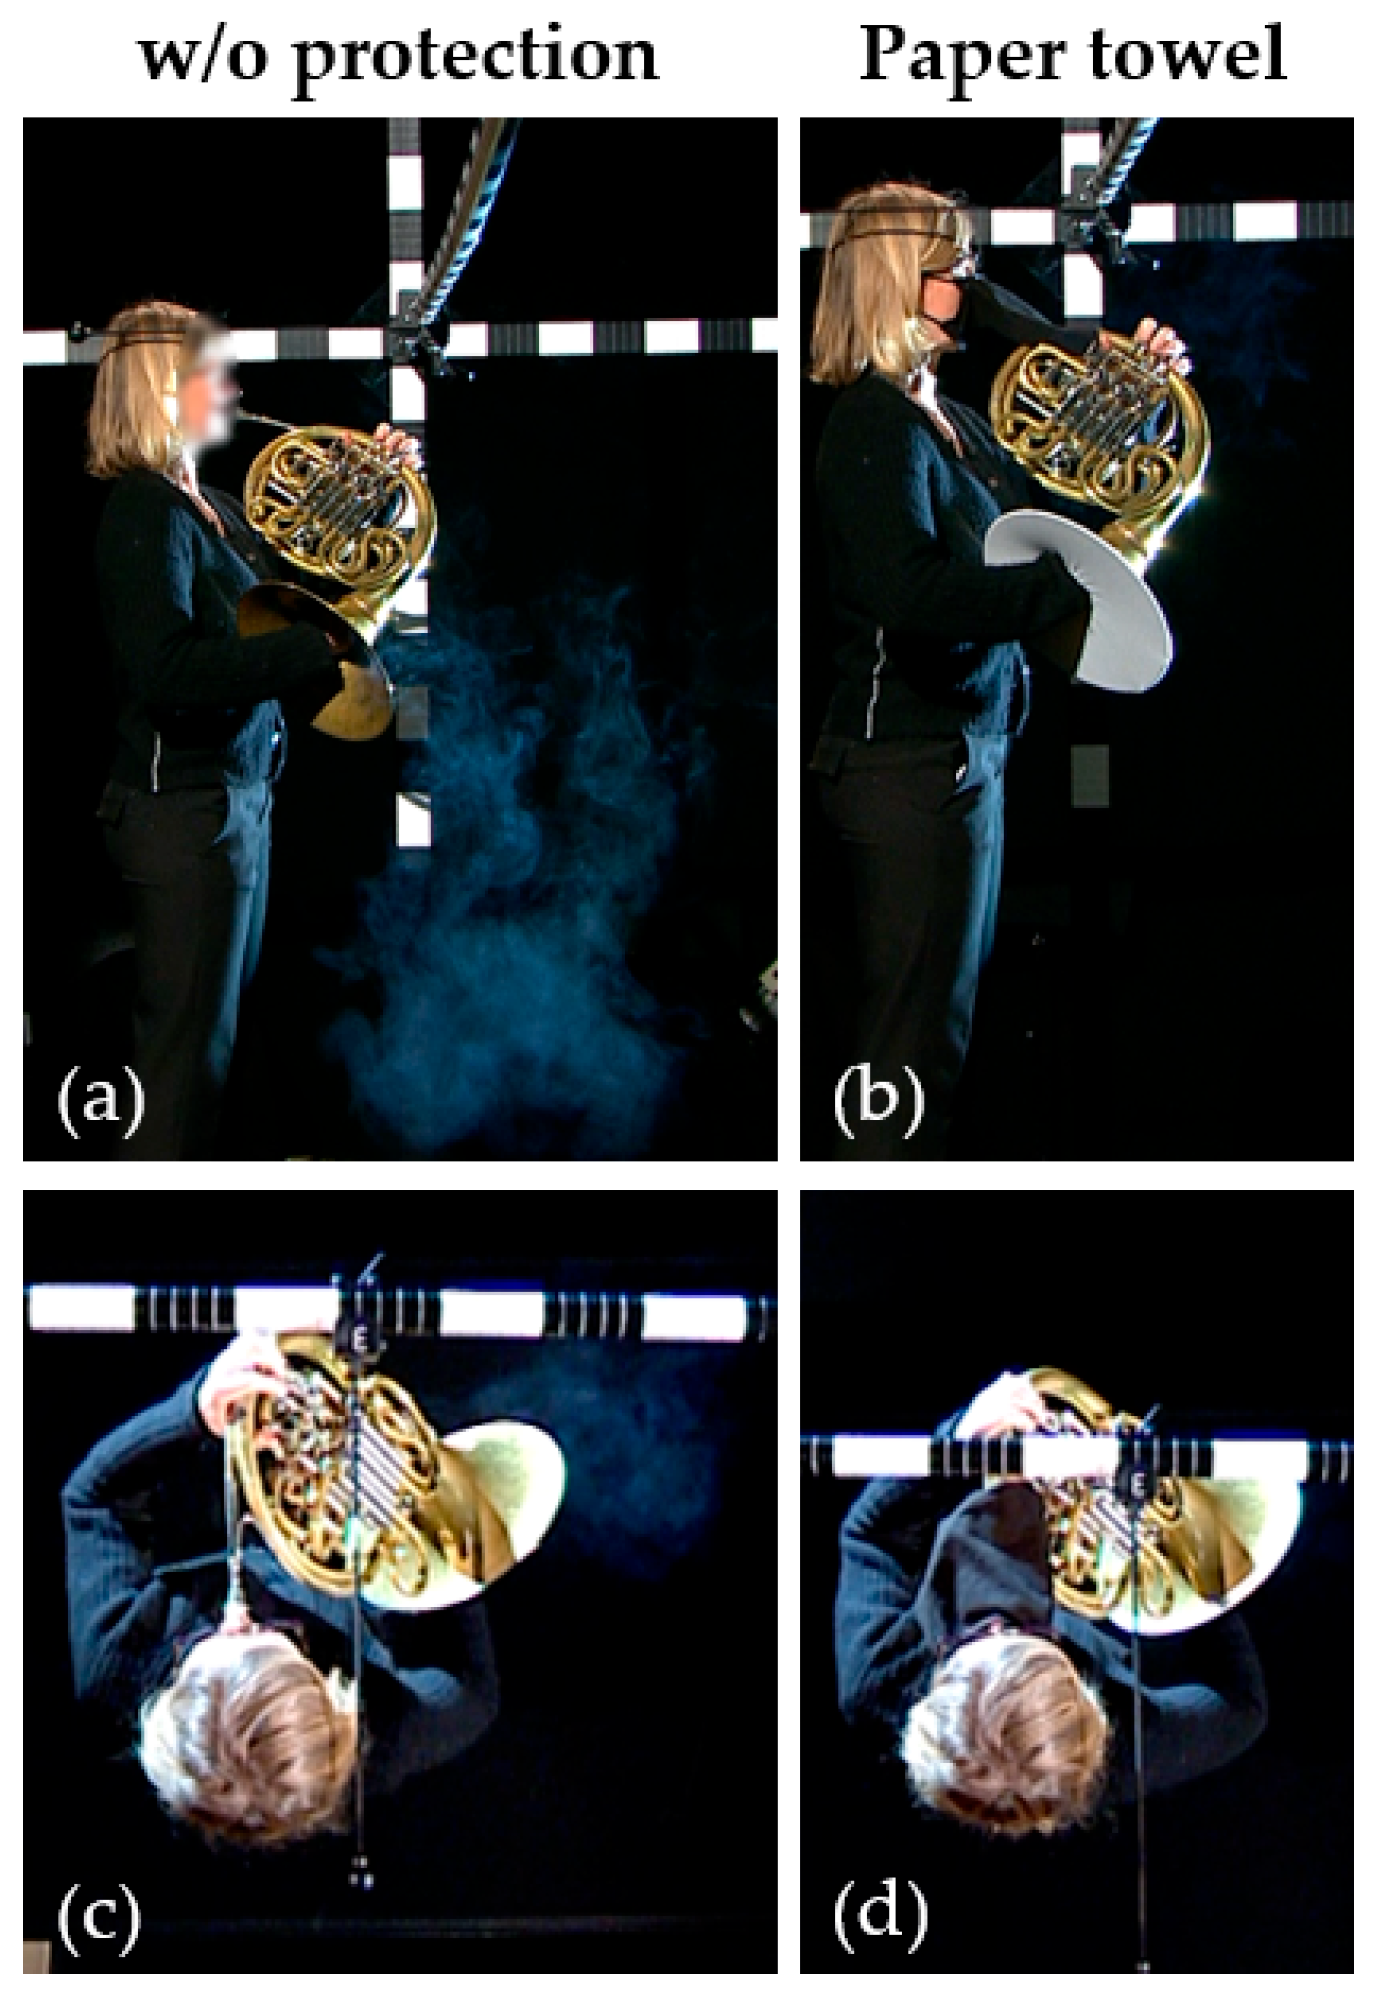
In Figure 14, the aerosol spread during clarinet playing is shown for the two protection methods and without protection. In this case, side view images [Figure 14a,b] detail the cloud dispersion in the dy and dz dimensions, while top view images [Figure 14c,d] capture the cloud dispersion in the x and dz dimensions.
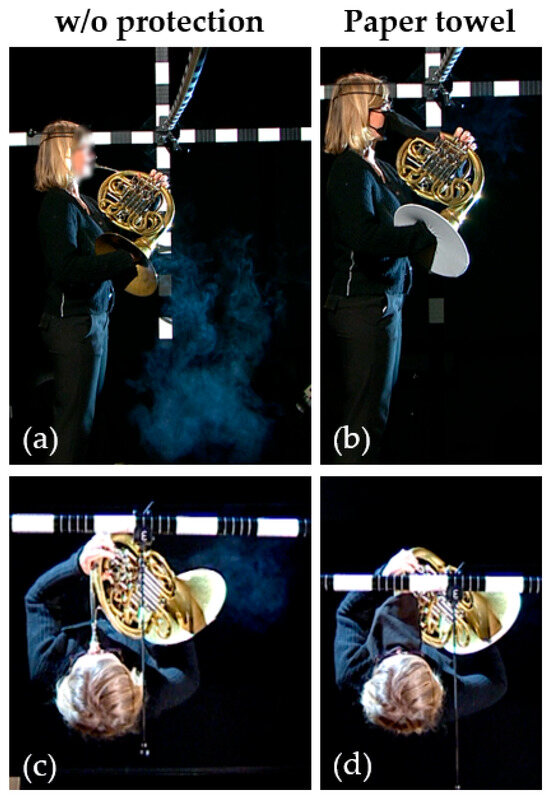
Figure 14.
Illustrated maximum cloud dispersion while playing the horn from the (a,b) side view of the dy and dz dimensions and (c,d) top view of the x and dz dimensions for the different protection systems and without protection.
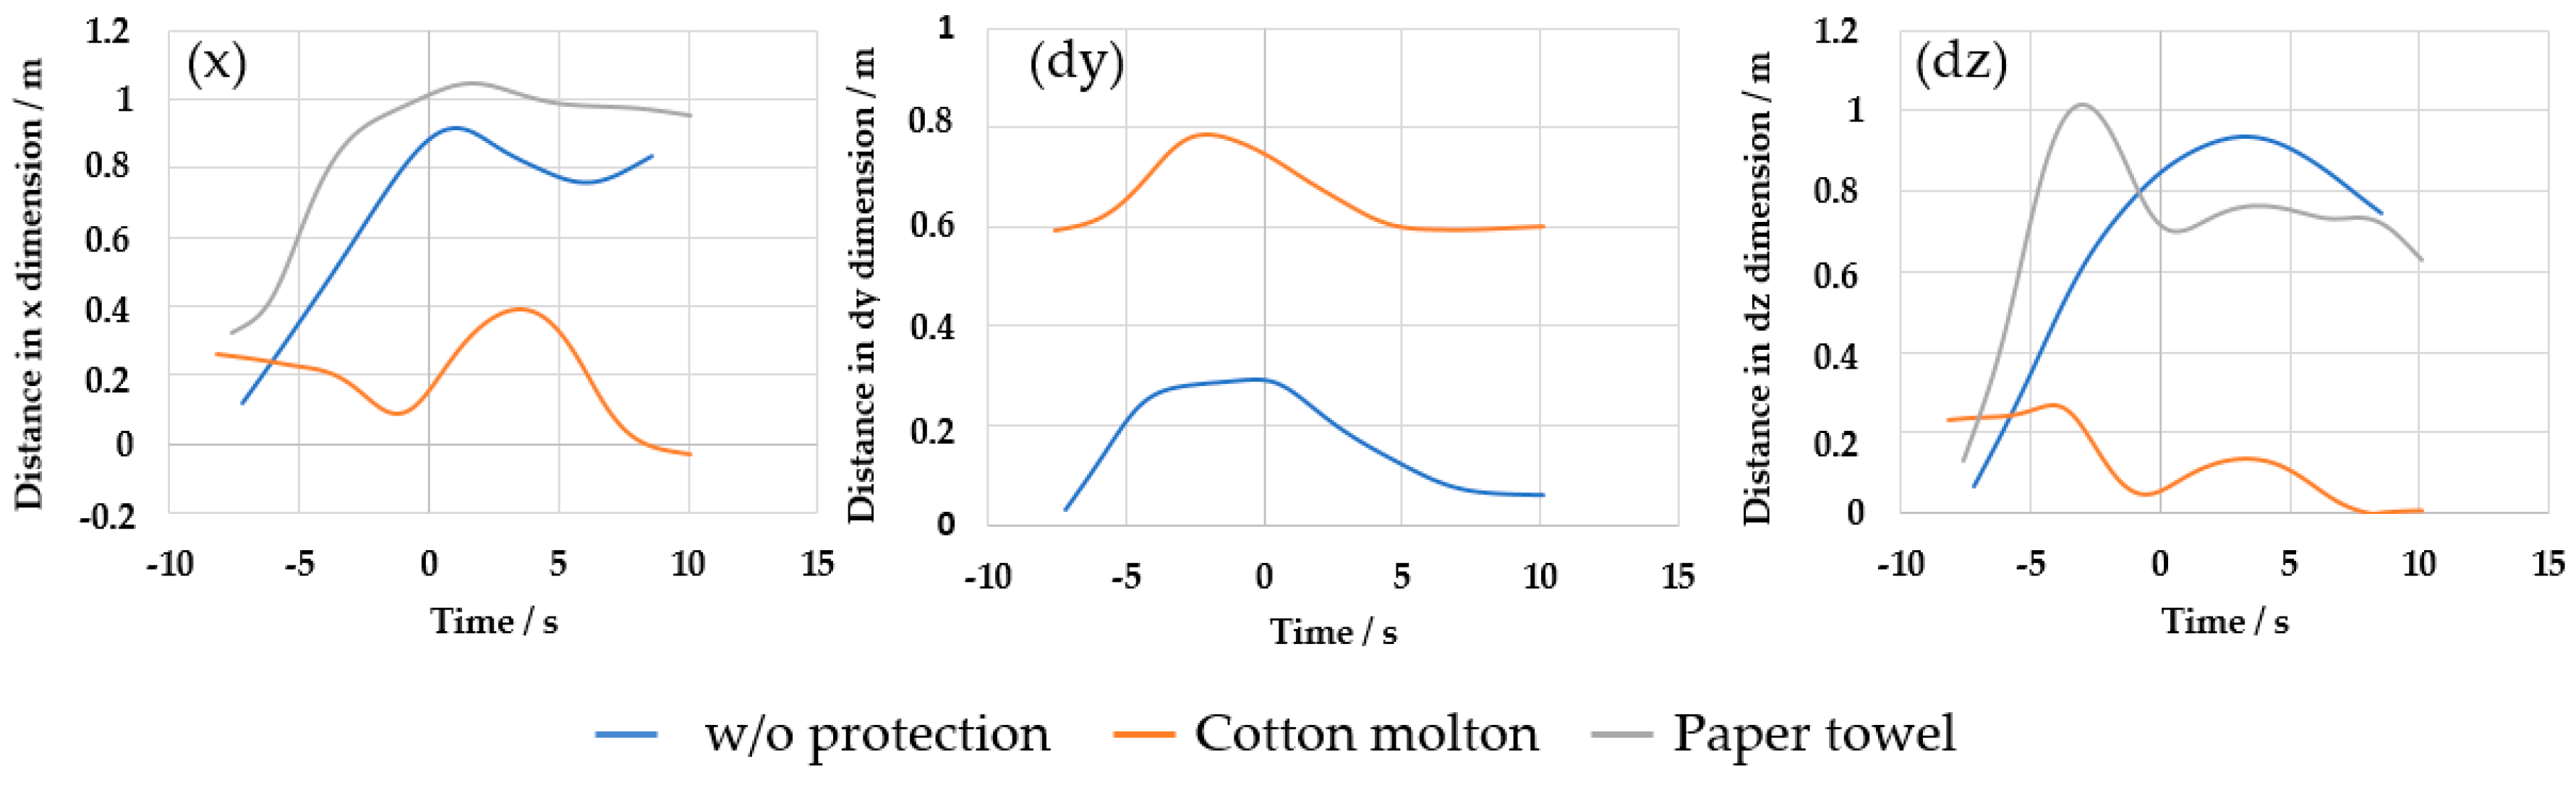
In the x dimension, the greatest cloud spread when playing the horn was measured with the paper towel at 1.05 m, with the maximum reached after the end of the play; see Figure 15—(x). The subsequent decline appeared flat. Without a protective system, the curve initially showed a steep rise to a maximum of 0.92 m, which also occurred after the end of the play. The shortest cloud emission distance was observed with cotton molton, with the corresponding curve reaching its maximum after the end of the play at 0.39 m and then steeply declining.
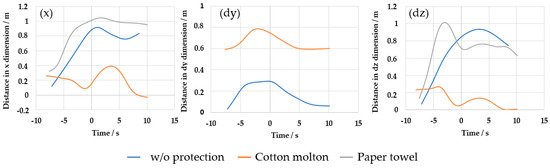
Figure 15.
The figure illustrates the cloud dispersion ranges for the horn without a protection system (blue curve), with the cotton molton protection system (orange curve), and with the paper towel protection system (gray curve) in the x dimension, dy dimension, and dz dimension, plotted over time in seconds.
In the dy dimension [Figure 15—(dy)], no adequate representation of the cloud and resulting curve could be determined using GAT for the horn. Therefore, only the cloud spread in the dy dimension without protection and with the paper towel was considered. The curves showed a similar progression. With the paper towel, the maximum cloud emission was 0.79 m, which was further than that measured without a protective system (0.29 m). Both plots reached their maximum before the end of the play.
In the dz dimension, see Figure 15—(dz), the greatest cloud dispersion was also reached with the paper towel. The curve rose steeply until just before the end of the play, reaching a maximum of 1.02 m; then, it briefly declined before plateauing and finally descending. With cotton molton, the curve only rose slightly to a maximum of 0.27 m before the end of the play and then declined. Only the curve when playing with the paper towel reached its maximum after the end of the play at 0.93 m.
3.7. Trumpet
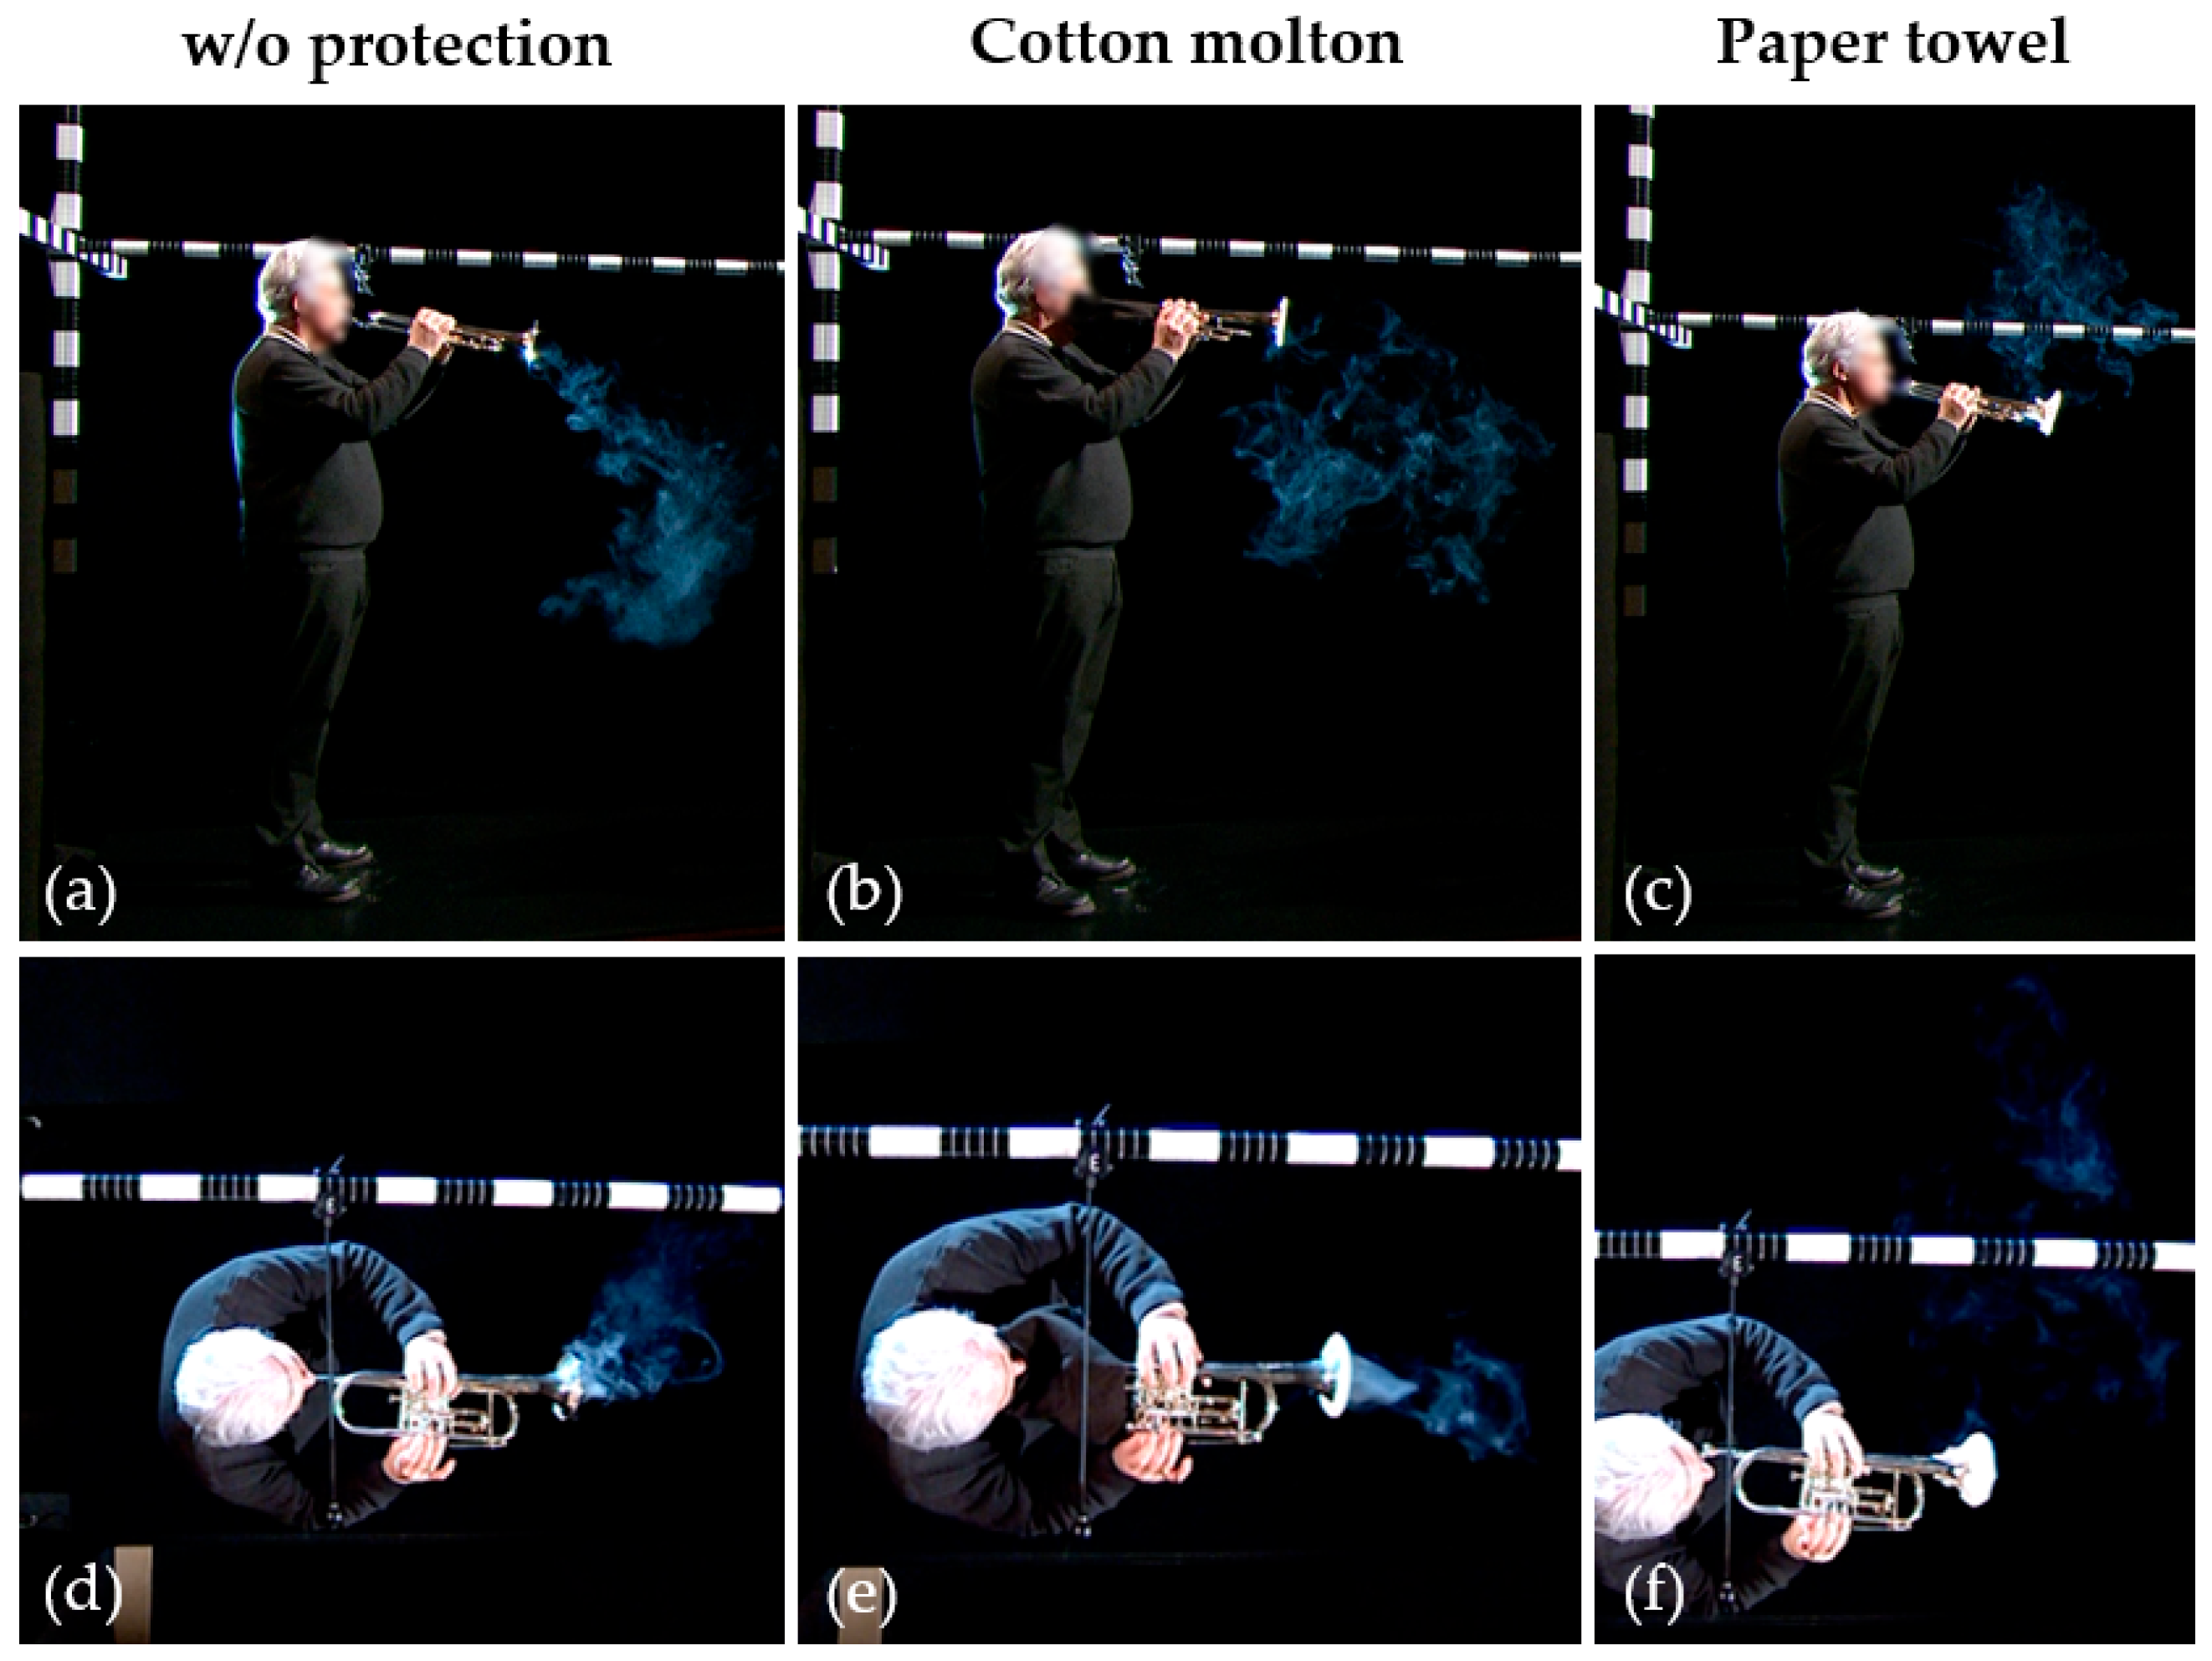
Figure 16 depicts the spread of aerosols during trumpet playing with two different protection systems and without any protection. The side view [Figure 16a–c] captures the cloud spreading in the x and dz dimensions, while the top view [Figure 16d–f] captures the cloud spreading in the dy dimension.
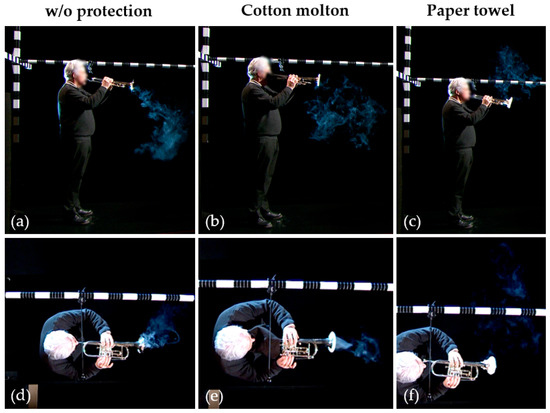
Figure 16.
Illustrated maximum cloud dispersion while playing the trumpet from the (a–c) side view of the x and dz dimensions and (d–f) top view of the dy dimension for the different protection systems and without protection.
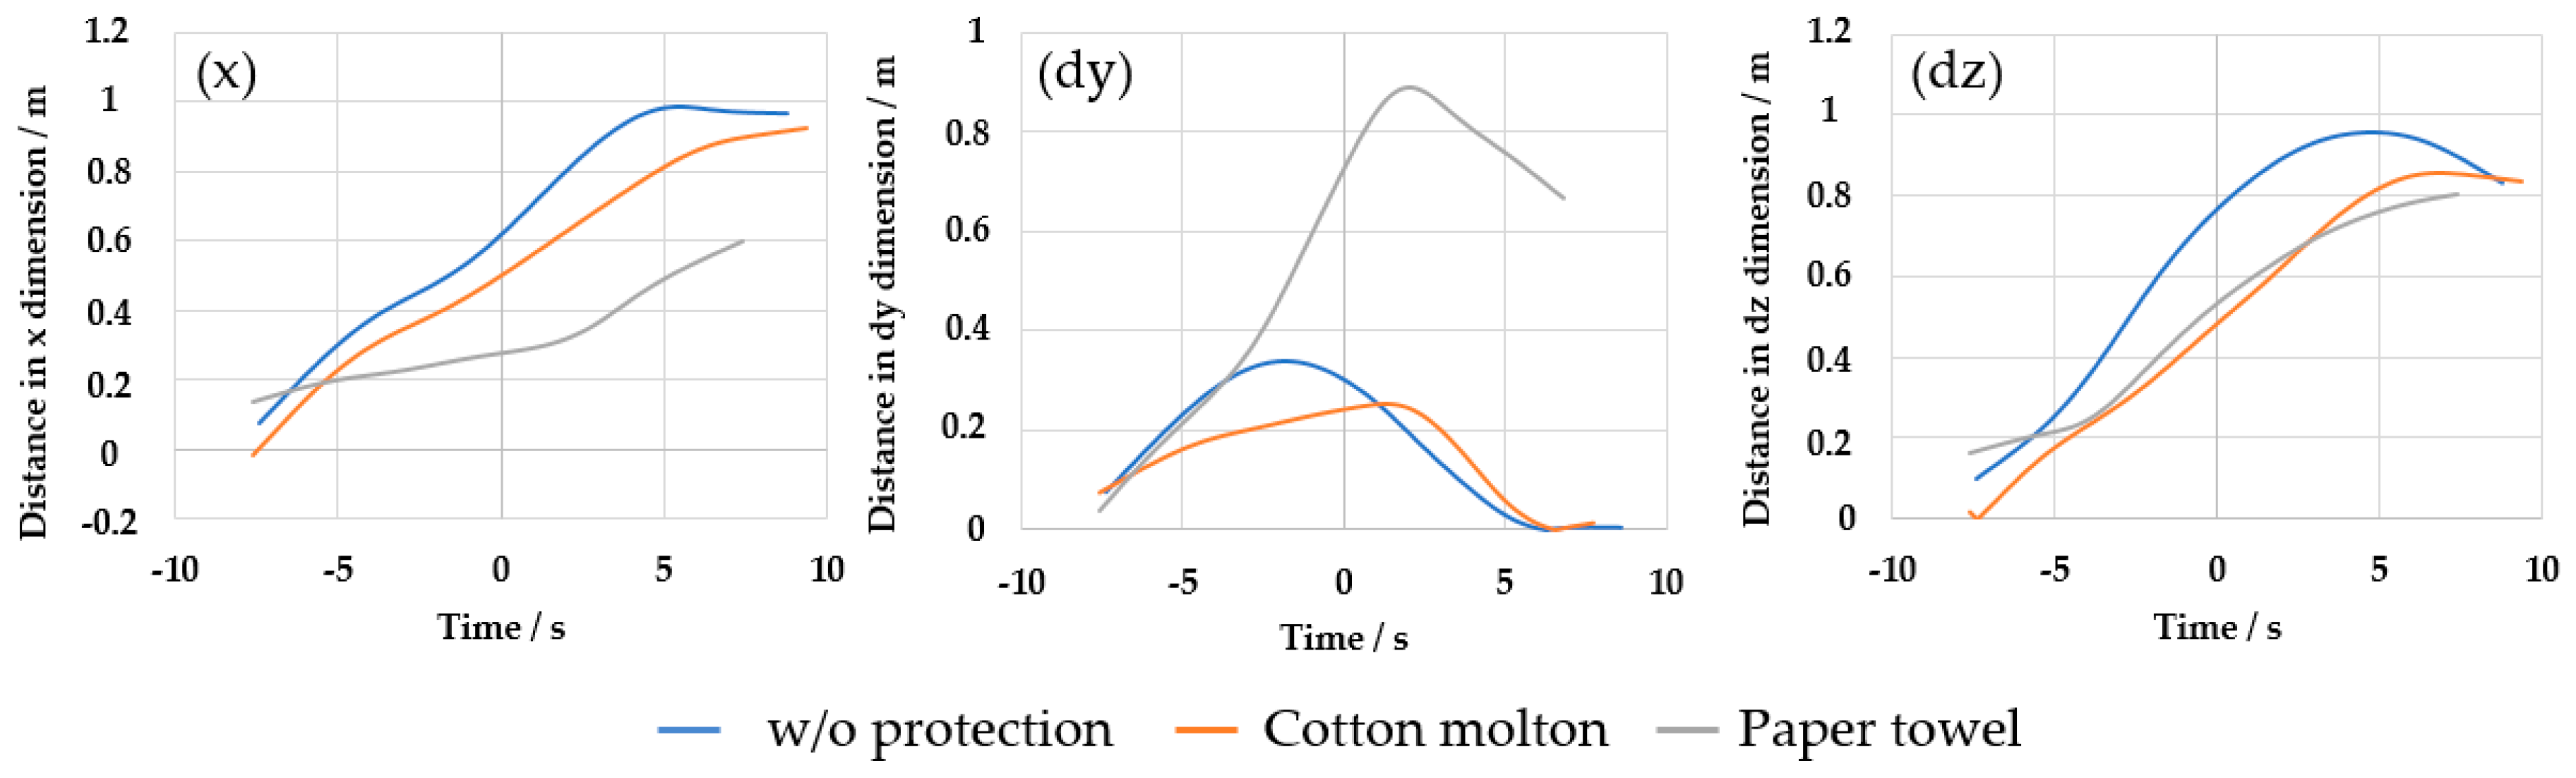
In the x dimension [Figure 17—(x)], the protective system with the paper towel showed the shortest cloud emission distance of 0.6 m. The actual maximum could not be determined accurately from the displayed figure, as the curve seemed to continue rising after the evaluation period. A similar trend was observed with the cotton molton system, where the curve rose steadily to a maximum of 0.92 m but did not reach a plateau within the measured period. Without a protective system, the maximum was reached at 0.98 m. The plots for no protection and with cotton showed a similar progression.
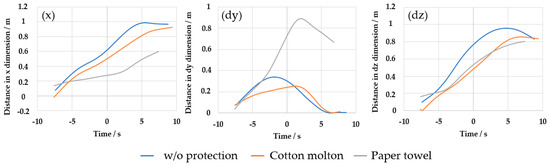
Figure 17.
The figure illustrates the cloud dispersion ranges for the trumpet without a protection system (blue curve), with the cotton molton protection system (orange curve), and with the paper towel protection system (gray curve) in the x dimension, dy dimension, and dz dimension, plotted over time in seconds.
In the dy dimension [Figure 17—(dy)], the greatest cloud emissions were observed with the paper towel at 0.89 m. The curve initially rose steeply before continuously declining after reaching the maximum. The shortest cloud emissions were reached with the cotton molton system (0.25 m). The rise in this curve was significantly flatter. Without a protective system, the maximum cloud dispersion of 0.34 m was less than that with the paper towel but greater than that with cotton molton.
In the dz dimension, see Figure 17—(dz), the curves were close together and showed a similar progression. With the paper towel, only a maximum cloud spread of 0.8 m could be determined. Considering this, the cloud emissions in the dz dimension were the lowest with the paper towel. With the cotton molton system, a maximum cloud dimension of 0.86 m was reached, followed by a flattening. Without a protective system, the cloud dimension was the greatest (0.96 m). The maxima of the curves were each reached after the end of the play.
3.8. Statistical Comparison of Protection Systems
The described aerosol dispersion during wind instrument playing suggests that the cotton molton protection system has the greatest impact on cloud dispersion in the x dimension. With the cotton molton protection system, an average forward spread of 0.72 m is observed, achieving a reduction in cloud emission distance by 42%, in comparison to measurements without a protection system. Laterally in the dy dimension, a maximum cloud dispersion of 0.53 m is measured, representing an approx. 13% increase compared to playing without protection. Vertically in the dz dimension, the aerosol cloud spreads to 1.1 m with the cotton molton system, which is about 2% less than without protection.
Using the paper towel protection system, average maximum cloud emissions measuring forward at 1.05 m, laterally at 0.77 m, and upwards at 1.24 m is obtained. Thus, the paper towel system achieves a reduction in forward cloud emissions by approx. 15% compared to measurements without protection. Laterally (dy dimension), the maximum cloud dispersion is 66% higher, and vertically (dz dimension), there is a 10% higher cloud dispersion compared to playing without protection. Compared to the cotton molton system, the paper towel system demonstrates less effectiveness in containing aerosol spread.
To determine the significance of these findings, a Friedman test was initially conducted to compare the median cloud dimensions of all instruments with the various systems at times t0 (end of playing) and tmax (highest distance during playing and after the task). Subsequently, a comparison of the systems among themselves was performed with appropriately adjusted significance levels.
As shown in Table 4, there is a significant difference in x0 compared to all other dimensions, but not in the other dimensions and also not at tmax. In the group comparison (post hoc), the significance level drops to p < 0.016, so, as shown in the table above, the effects are no longer strong enough to discern a significant difference between the individual group comparison during the post hoc test.
Table 4.
The table presents statistical significances between the protection systems in the x dimension, dy dimension, and dz dimension for the time points t0 (task completed) and tmax (maximum discharge range over the entire measurement). Statistically significant values in the Friedman test are highlighted in bold (p < 0.05). After applying the post hoc group comparison, a significance level of p < 0.0167 is obtained.
4. Discussion
Previous studies have primarily focused on the maximum aerosol concentration and the emission speed during wind instrument playing [8,9,10,21,24,30]. This study aimed to investigate the impact of two protection systems on the maximum cloud dispersion of the aerosol clouds produced while playing wind instruments.
Conventional face masks efficiently reduce aerosol emissions during speaking or breathing [8,9,30]. However, finding a suitable protection system for wind instruments poses challenges, as air is expelled not only from the instrument’s end but also from the mouthpiece and tone holes [8,21,27,28,29,31]. Besides the instrument’s construction, other factors influence the emission and distribution of particles. Several studies have explored the impact of volume and pitch on aerosol emissions, finding that higher pitches and volumes increase particle emissions [22,24,36,37]. However, since this study focuses solely on the potential effect of protection systems on the maximum spread of aerosol particles, we did not compare different pitches and volumes.
We observed a discontinuous and complex cloud development and dispersion, similar to findings by Stockman et al. [24] and Wang et al. [40]. The expelled aerosol particles and resulting cloud were visualized using e-cigarette liquid, with visibility dependent on lighting and camera sensitivity. Aerosol particles that are diluted or evaporated cannot be adequately captured by cameras, meaning submicron particles are not represented [9]. The cloud contours were calculated using a threshold-based segmentation algorithm, which only accounts for particles made visible through imaging. This is crucial to consider when calculating the maximum spread of an aerosol cloud. Nonetheless, despite excluding the smallest particles, the results of this study are deemed significant.
As a reference, we first examined aerosol cloud development without any protection system. On average, the maximum emission distances were 1.23 m forward (x direction), 0.46 m sideways (y direction), and 0.86 m upward (z direction). Other studies have reported maximum horizontal (x direction) spread distances between 0.5 m and 1 m [9,10,21,31,39]. Additionally, previous research observed a larger aerosol concentration for woodwind instruments compared to brass instruments [31,39]. This matches the observations in our study, as we found that the maximum emission dispersion for the brass instruments horn and trumpet were indeed lower compared to the tested woodwind instruments, although this was not the case for the trombone. The reason is assumed to be due to more pronounced condensation effects in brass instruments, whereby aerosols are collected in the condensate [9]. Furthermore, the aerosol particles are not only released through the bell of the instrument but through the tone holes of instruments such as clarinets and saxophones.
With the cotton molton protection system, we observed an average forward (x dimension) spread of 0.72 m, reducing the emission distance by 42%. The maximum sideways (dy dimension) distance was 0.53 m, a 13% increase compared to playing without protection. Vertically (dz dimension), the aerosol cloud spread to 1.1 m, approximately 2% less than without a mask. With the paper towel protection system, the average maximum emission distances were 1.05 m forward (x dimension), 0.77 m sideways (dy dimension), and 1.24 m upward (dz dimension). This system achieved a 15% reduction in forward (x dimension) spread. However, the sideways (dy dimension) maximum distance increased by 66%, and the vertical spread (dz dimension) was 10% higher. Compared to the cotton molton system, the paper towel system was less effective in containing aerosol dispersion. This can probably be explained by the fact that only the bell was covered with the paper towel, but it is known that aerosols are also emitted via the tone holes [8,21,27]. With the cotton molton protection, these holes were covered.
Our experiments indicated that the protection systems primarily decreased the emission distance in the forward direction by simultaneously increasing the dimensions of the aerosol cloud in the dy and dz dimensions. Both systems covered the bell at the instrument’s end, where most aerosols are emitted [8]. Therefore, the most effective reduction could be achieved by the cotton molton mask as it additionally covered the holes in the instrument body. As a consequence, the momentum of the particles in the forward direction was majorly reduced and partly shifted to the sideways and up–down directions, as similarly reported in [27]. The protection systems could thus restrict the area of the highly dense aerosol cloud to the immediate volume around the instrument player.
These findings could be partly statistically supported by the Friedman test, which revealed a significant reduction in the aerosol spreading distance (p < 0.05) in horizontal (x dimension) emissions only for the cotton molton protection system. However, in the post hoc group comparisons (p < 0.0167), no significance could be shown.
It is known that increasing the number of layers can reduce particle emissions by up to 90% [8,30]. Therefore, the influence of such protection systems has to be evaluated with regard to playing and acoustic characteristics. Corey et al. [41] found that mask thickness can negatively affect acoustics. A single protection system may not be sufficient for effectively reducing aerosol spread. Additional measures, such as properly positioned ventilation, can reduce particle concentration in a room [7,30]. Lowering the room temperature can also decrease the number of spreading particles. At lower temperatures, particle movement is slower and air density is higher, which in turn reduces the diffusion rate of the aerosol particles, and the turbulent distribution of the particles in the air is reduced [25].
Please note that this study focused on the macroscopic visualization of aerosol cloud dispersion. A detailed understanding of the underlying flow dynamics, including turbulence and velocity fields, would require advanced fluid dynamic analysis such as PIV in combination with CFD simulations. Such approaches could further elucidate particle transport mechanisms and inform targeted protection strategies.
Limitations
Our test group only covered professional players and, therefore, does not represent layman musicians. It is known that professionals are able to play with less air leakage compared to amateur players [8,38]. So, there might be a further contribution of aerosol particles emitted through leakages at the mouth of layman players of wind instruments.
Our methodology did not allow for quantitative estimation of particle concentration or density within the observed aerosol cloud. Future studies should incorporate particle counting or laser-based methods (e.g., particle image velocimetry) to determine aerosol concentrations. This would allow for more precise assessments of infectious risk and the effectiveness of mitigation strategies. Additionally, the segmentation applied in this study was based on a fixed visual threshold, used to extract the outer boundary of the aerosol cloud from video data, which strongly depended on the illumination conditions of the cloud and sensitivity of the camera sensors. Our used method did not provide absolute particle concentrations, physical density values, or the determination of measurement accuracy. Future work could aim to define quantitative boundary values through calibration or supplemental instrumentation.
The experiments were conducted under laboratory conditions. Extensive ventilation was performed after each task. Recordings were made indoors in a studio that was nearly empty. Participants were instructed to remain still after playing to minimize the influence of movement on the aerosols. Without these precautions, aerosols would remain in the room longer or adhere to objects, and they would be distributed by air currents present in any room [4,7,9,10,12]. In real-world conditions, stronger air flow is generated by people moving in a room and the normally increased movement of players during a concert. Furthermore, there are more objects on which aerosols can potentially settle. The more people present in a room, the higher the humidity, which affects aerosol behavior and concentration [9,10,12]. During all measurements, the room maintained a stable temperature of 23 °C and a relative humidity of 50%. These values were monitored and controlled to ensure consistency across all tasks. This environmental setting reflects a generalizable average for indoor spaces, as rooms are typically heated in winter and cooled in summer or warmer climates [42]. Although the behavior of virus-laden aerosols, such as those containing SARS-CoV-2, may depend on temperature and humidity, this relationship is not yet fully understood [43]. Testing a range of climatic scenarios was not considered meaningful in this context, as practical music-making environments, such as orchestra rehearsals or concerts, do not allow for the creation of extreme conditions like tropical or arctic climates. Therefore, the focus was placed on a typical, moderate indoor environment to ensure ecological validity and reproducibility.
In our investigation, we primarily focused on the maximum spread and dimensions of the expelled aerosol cloud during instrument playing. However, spread alone covers only a portion of potential virus transmission. It has been found that the temporal and spatial distribution of particles must also be considered. The total number of particles of all sizes, as well as the concentration in the respective room, must be taken into account [8]. Additionally, the source strength of the aerosol cloud and the velocity at which it is emitted must be considered [9]. The coupling between acoustic pressure fluctuations within the instrument bore and aerosol transport was not directly assessed in this study. However, this interaction—especially with opened tone holes—could significantly affect emission pathways and cloud development. Future investigations may combine pressure measurements with flow modeling to better understand this complex relationship.
5. Conclusions
The significant pathogenicity of droplet infections has been made clear not least by the SARS-CoV2 pandemic. It is clear that aerosol particles are not only emitted during vocalizing and breathing but also when playing wind instruments. In order to make playing music possible during a pandemic, the focus should contain the development of sufficient protective masks. In this study, two protective systems were tested and compared against unprotected playing of wind instruments. The materials used were a pure paper towel and a cotton molton construction. The emitted particles were visualized using e-cigarette liquid. Three full HD cameras, which captured the aerosol spread forwards, sideways, and upwards, served as a recording tool. The resulting contours were then processed and calculated using an algorithm.
The forward cloud dispersion was the greatest on average without the protection system (1.23 m), compared to cotton molton (0.72 m) and the paper towel (1.05 m). In concrete terms, this means a reduction in cloud emissions of 45% with cotton molton and 10% with the paper towel. Sideways, aerosol particles without protection spread on average to 0.46 m, with cotton to 0.53 m, and with the paper towel to 0.77 m. We therefore observed an increase of 9% and 66%, respectively. Compared to playing without a protection system, there was also 7% (cotton molton) or 10% (paper towel) higher cloud emissions. Despite this reduction, the experiments unveiled that, beside the bell of wind instruments, tone holes play a major role in releasing aerosol particles in instruments such as the clarinet or the saxophone.
Since aerosol dispersion is influenced by various variables, a single protection system may not be sufficient for effectively reducing aerosol spread. Additional measures, such as properly positioned ventilation or lowering the room temperature, can reduce particle concentration in a room.
Author Contributions
Conceptualization, M.E. and S.K.; methodology, S.K. and M.E.; software, M.B. and B.T.; validation, M.B., B.T., M.K. and S.K.; formal analysis, M.B. and B.T.; investigation, M.B., M.K., L.A.H., S.G. and S.K.; resources, S.K. and M.E.; data curation, M.B., B.T., M.K., L.A.H. and S.G.; writing—original draft preparation, M.B.; writing—review and editing, B.T., L.A.H., S.G., M.K., M.E. and S.K.; visualization, M.B.; supervision, S.K.; project administration, S.K. and M.E.; funding acquisition, S.K. and M.E. All authors have read and agreed to the published version of the manuscript.
Funding
This research was funded by Ministry of Science and Art of the State of Bavaria (Germany).
Institutional Review Board Statement
The study was conducted in accordance with the Declaration of Helsinki, and approved by the Ethikkommission der Medizinischen Fakultät der LMU München (20–395, date of approval).
Informed Consent Statement
Informed consent was obtained from all subjects involved in the study.
Data Availability Statement
The raw dataset presented in this article is not available due to privacy and ethical restrictions. Requests to processed, anonymized data should be directed to the corresponding author.
Acknowledgments
The present work was performed in (partial) fulfillment of the requirements for obtaining the degree “Dr. med.” from the Faculty of Medicine of the Friedrich-Alexander-Universität Erlangen-Nürnberg (FAU).
Conflicts of Interest
The authors declare no conflicts of interest.
References
- Moser, M.R.; Bender, T.R.; Margolis, H.S.; Noble, G.R.; Kendal, A.P.; Ritter, D.G. An Outbreak of Influenza Aboard a Commercial Airliner. Am. J. Epidemiol. 1979, 110, 1–6. [Google Scholar] [CrossRef] [PubMed]
- Yezli, S.; Otter, J.A. Minimum Infective Dose of the Major. Human. Respiratory and Enteric Viruses Transmitted Through Food and the Environment. Food Environ. Virol. 2011, 3, 1–30. [Google Scholar] [CrossRef]
- Santarpia, J.L.; Herrera, V.L.; Rivera, D.N.; Ratnesar-Shumate, S.; Reid, S.P.; Denton, P.W.; Martens, J.W.S.; Fang, Y.; Conoan, N.; Callahan, M.V.; et al. The Infectious Nature of Patient-Generated SARS-CoV-2 Aerosol; preprint; Infectious Diseases (except HIV/AIDS). medRxiv 2020. [Google Scholar] [CrossRef]
- Prather, K.A.; Wang, C.C.; Schooley, R.T. Reducing Transmission of SARS-CoV-2. Science 2020, 368, 1422–1424. [Google Scholar] [CrossRef] [PubMed]
- Heyder, J.; Gebhart, J.; Rudolf, G.; Schiller, C.F.; Stahlhofen, W. Deposition of Particles in the Human Respiratory Tract in the Size Range 0.005–15 Μm. J. Aerosol Sci. 1986, 17, 811–825. [Google Scholar] [CrossRef]
- Tanner, K.; Good, K.M.; Goble, D.; Good, N.; Keisling, A.; Keller, K.P.; L’Orange, C.; Morton, E.; Phillips, R.; Volckens, J. Large Particle Emissions from Human Vocalization and Playing of Wind Instruments. Environ. Sci. Technol. 2023, 57, 15392–15400. [Google Scholar] [CrossRef]
- Narayanan, S.R.; Yang, S. Airborne Transmission of Virus-Laden Aerosols inside a Music Classroom: Effects of Portable Purifiers and Aerosol Injection Rates. Phys. Fluids 2021, 33, 033307. [Google Scholar] [CrossRef] [PubMed]
- Viala, R.; Creton, M.; Jousserand, M.; Soubrié, T.; Néchab, J.; Crenn, V.; Léglise, J. Experimental and Numerical Investigation on Aerosols Emission in Musical Practice and Efficiency of Reduction Means. J. Aerosol Sci. 2022, 166, 106051. [Google Scholar] [CrossRef]
- Wang, L.; Lin, T.; Da Costa, H.; Zhu, S.; Stockman, T.; Kumar, A.; Weaver, J.; Spede, M.; Milton, D.K.; Hertzberg, J.; et al. Characterization of Aerosol Plumes from Singing and Playing Wind Instruments Associated with the Risk of Airborne Virus Transmission. Indoor Air 2022, 32, e13064. [Google Scholar] [CrossRef]
- Gantner, S.; Echternach, M.; Veltrup, R.; Westphalen, C.; Köberlein, M.C.; Kuranova, L.; Peters, G.; Jakubaß, B.; Benthaus, T.; Döllinger, M.; et al. Impulse Dispersion of Aerosols during Playing Wind Instruments. PLoS ONE 2022, 17, e0262994. [Google Scholar] [CrossRef]
- Zou, L.; Ruan, F.; Huang, M.; Liang, L.; Huang, H.; Hong, Z.; Yu, J.; Kang, M.; Song, Y.; Xia, J.; et al. SARS-CoV-2 Viral Load in Upper Respiratory Specimens of Infected Patients. N. Engl. J. Med. 2020, 382, 1177–1179. [Google Scholar] [CrossRef] [PubMed]
- Asadi, S.; Bouvier, N.; Wexler, A.S.; Ristenpart, W.D. The Coronavirus Pandemic and Aerosols: Does COVID-19 Transmit via Expiratory Particles? Aerosol Sci. Technol. 2020, 54, 635–638. [Google Scholar] [CrossRef]
- Nicas, M.; Nazaroff, W.W.; Hubbard, A. Toward Understanding the Risk of Secondary Airborne Infection: Emission of Respirable Pathogens. J. Occup. Environ. Hyg. 2005, 2, 143–154. [Google Scholar] [CrossRef]
- Fennelly, K.P. Particle Sizes of Infectious Aerosols: Implications for Infection Control. Lancet Respir. Med. 2020, 8, 914–924. [Google Scholar] [CrossRef] [PubMed]
- McCarthy, L.P.; Orton, C.M.; Watson, N.A.; Gregson, F.K.A.; Haddrell, A.E.; Browne, W.J.; Calder, J.D.; Costello, D.; Reid, J.P.; Shah, P.L.; et al. Aerosol and Droplet Generation from Performing with Woodwind and Brass Instruments. Aerosol Sci. Technol. 2021, 55, 1277–1287. [Google Scholar] [CrossRef]
- Echternach, M.; Gantner, S.; Peters, G.; Westphalen, C.; Benthaus, T.; Jakubaß, B.; Kuranova, L.; Döllinger, M.; Kniesburges, S. Impulse Dispersion of Aerosols during Singing and Speaking: A Potential COVID-19 Transmission Pathway. Am. J. Respir. Crit. Care Med. 2020, 202, 1584–1587. [Google Scholar] [CrossRef]
- Mueller, S.K.; Veltrup, R.; Jakubaß, B.; Kniesburges, S.; Huebner, M.J.; Kempfle, J.S.; Dittrich, S.; Iro, H.; Döllinger, M. Clinical Characterization of Respiratory Large Droplet Production during Common Airway Procedures Using High-Speed Imaging. Sci. Rep. 2021, 11, 10627. [Google Scholar] [CrossRef] [PubMed]
- Kniesburges, S.; Hesselmann, C.; Becker, S.; Schlücker, E.; Döllinger, M. Influence of Vortical Flow Structures on the Glottal Jet Location in the Supraglottal Region. J. Voice 2013, 27, 531–544. [Google Scholar] [CrossRef]
- Heinemann, T.; Springer, M.; Lienhart, H.; Kniesburges, S.; Othmer, C.; Becker, S. Active Flow Control on a 1:4 Car Model. Exp. Fluids 2014, 55, 1738. [Google Scholar] [CrossRef]
- Lodermeyer, A.; Bagheri, E.; Kniesburges, S.; Näger, C.; Probst, J.; Döllinger, M.; Becker, S. The Mechanisms of Harmonic Sound Generation during Phonation: A Multi-Modal Measurement-Based Approach. J. Acoust. Soc. Am. 2021, 150, 3485–3499. [Google Scholar] [CrossRef]
- He, R.; Gao, L.; Trifonov, M.; Hong, J. Aerosol Generation from Different Wind Instruments. J. Aerosol Sci. 2021, 151, 105669. [Google Scholar] [CrossRef] [PubMed]
- Alsved, M.; Matamis, A.; Bohlin, R.; Richter, M.; Bengtsson, P.-E.; Fraenkel, C.-J.; Medstrand, P.; Löndahl, J. Exhaled Respiratory Particles during Singing and Talking. Aerosol Sci. Technol. 2020, 54, 1245–1248. [Google Scholar] [CrossRef]
- Schlenczek, O.; Thiede, B.; Turco, L.; Stieger, K.; Kosub, J.M.; Müller, R.; Scheithauer, S.; Bodenschatz, E.; Bagheri, G. Experimental Measurement of Respiratory Particles Dispersed by Wind Instruments and Analysis of the Associated Risk of Infection Transmission. J. Aerosol Sci. 2023, 167, 106070. [Google Scholar] [CrossRef]
- Stockman, T.; Zhu, S.; Kumar, A.; Wang, L.; Patel, S.; Weaver, J.; Spede, M.; Milton, D.K.; Hertzberg, J.; Toohey, D.; et al. Measurements and Simulations of Aerosol Released While Singing and Playing Wind Instruments. ACS Environ. Au 2021, 1, 71–84. [Google Scholar] [CrossRef]
- Volckens, J.; Good, K.M.; Goble, D.; Good, N.; Keller, J.P.; Keisling, A.; L’Orange, C.; Morton, E.; Phillips, R.; Tanner, K. Aerosol Emissions from Wind Instruments: Effects of Performer Age, Sex, Sound Pressure Level, and Bell Covers. Sci. Rep. 2022, 12, 11303. [Google Scholar] [CrossRef] [PubMed]
- Archer, J.; McCarthy, L.P.; Symons, H.E.; Watson, N.A.; Orton, C.M.; Browne, W.J.; Harrison, J.; Moseley, B.; Philip, K.E.J.; Calder, J.D.; et al. Comparing Aerosol Number and Mass Exhalation Rates from Children and Adults during Breathing, Speaking and Singing. Interface Focus 2022, 12, 20210078. [Google Scholar] [CrossRef] [PubMed]
- Becher, L.; Gena, A.W.; Voelker, C.; Richter, B.; Spahn, C. Risk assessment of the spread of breathing air from wind instruments and singers during the COVID-19 pandemic. Weimar Bauhaus-Univ. Weimar Chair Build. Phys. 2020. [Google Scholar] [CrossRef]
- Abkarian, M.; Mendez, S.; Xue, N.; Yang, F.; Stone, H.A. Speech Can Produce Jet-like Transport Relevant to Asymptomatic Spreading of Virus. Proc. Natl. Acad. Sci. USA 2020, 117, 25237–25245. [Google Scholar] [CrossRef]
- Asadi, S.; Wexler, A.S.; Cappa, C.D.; Barreda, S.; Bouvier, N.M.; Ristenpart, W.D. Effect of Voicing and Articulation Manner on Aerosol Particle Emission during Human Speech. PLoS ONE 2020, 15, e0227699. [Google Scholar] [CrossRef]
- Abraham, A.; He, R.; Shao, S.; Kumar, S.S.; Wang, C.; Guo, B.; Trifonov, M.; Placucci, R.G.; Willis, M.; Hong, J. Risk Assessment and Mitigation of Airborne Disease Transmission in Orchestral Wind Instrument Performance. J. Aerosol Sci. 2021, 157, 105797. [Google Scholar] [CrossRef]
- Kähler, C.J.; Hain, R. Singing in Choirs and Making Music with Wind Instruments—Is That Safe During the SARS-CoV-2 Pandemic? Univ. Bundeswehr Munich Ger. 2020. [Google Scholar] [CrossRef]
- Bartoszko, J.J.; Farooqi, M.A.M.; Alhazzani, W.; Loeb, M. Medical Masks vs N95 Respirators for Preventing COVID-19 in Healthcare Workers: A Systematic Review and Meta-analysis of Randomized Trials. Influenza Resp. Viruses 2020, 14, 365–373. [Google Scholar] [CrossRef] [PubMed]
- Cheng, V.C.-C.; Wong, S.-C.; Chuang, V.W.-M.; So, S.Y.-C.; Chen, J.H.-K.; Sridhar, S.; To, K.K.-W.; Chan, J.F.-W.; Hung, I.F.-N.; Ho, P.-L.; et al. The Role of Community-Wide Wearing of Face Mask for Control of Coronavirus Disease 2019 (COVID-19) Epidemic Due to SARS-CoV-2. J. Infect. 2020, 81, 107–114. [Google Scholar] [CrossRef]
- Sommerstein, R.; Fux, C.A.; Vuichard-Gysin, D.; Abbas, M.; Marschall, J.; Balmelli, C.; Troillet, N.; Harbarth, S.; Schlegel, M.; Widmer, A.; et al. Risk of SARS-CoV-2 Transmission by Aerosols, the Rational Use of Masks, and Protection of Healthcare Workers from COVID-19. Antimicrob. Resist. Infect. Control 2020, 9, 100. [Google Scholar] [CrossRef] [PubMed]
- Soubrié, T.; Néchab, J.; Viala, R.; Creton, M.; Jousserand, M. Numerical Evaluation of Aerosol Propagation in Wind Instruments Using Computational Fluid Dynamics. Air 2024, 2, 292–310. [Google Scholar] [CrossRef]
- Mürbe, D.; Kriegel, M.; Lange, J.; Schumann, L.; Hartmann, A.; Fleischer, M. Aerosol Emission of Adolescents Voices during Speaking, Singing and Shouting. PLoS ONE 2021, 16, e0246819. [Google Scholar] [CrossRef] [PubMed]
- Gregson, F.-A.; Watson, N.A.; Orton, C.M.; Haddrell, A.E.; McCarthy, L.P.; Finnie, T.-R.; Gent, N.; Donaldson, G.C.; Shah, P.L.; Calder, J.D.; et al. Comparing Aerosol Concentrations and Particle Size Distributions Generated by Singing, Speaking and Breathing. Aerosol Sci. Technol. 2021, 55, 681–691. [Google Scholar] [CrossRef]
- Köberlein, M.; Hermann, L.; Gantner, S.; Tur, B.; Peters, G.; Westphalen, C.; Benthaus, T.; Döllinger, M.; Kniesburges, S.; Echternach, M. Impulse Dispersion of Aerosols during Playing the Recorder and Evaluation of Safety Measures. PLoS ONE 2022, 17, e0266991. [Google Scholar] [CrossRef]
- Spahn, C.; Hipp, A.M.; Schubert, B.; Axt, M.R.; Stratmann, M.; Schmölder, C.; Richter, B. Airflow and Air Velocity Measurements While Playing Wind Instruments, with Respect to Risk Assessment of a SARS-CoV-2 Infection. Int. J. Environ. Res. Public Health 2021, 18, 5413. [Google Scholar] [CrossRef]
- Wang, C.C.; Prather, K.A.; Sznitman, J.; Jimenez, J.L.; Lakdawala, S.S.; Tufekci, Z.; Marr, L.C. Airborne Transmission of Respiratory Viruses. Science 2021, 373, eabd9149. [Google Scholar] [CrossRef]
- Corey, R.M.; Jones, U.; Singer, A.C. Acoustic Effects of Medical, Cloth, and Transparent Face Masks on Speech Signals. J. Acoust. Soc. Am. 2020, 148, 2371–2375. [Google Scholar] [CrossRef] [PubMed]
- Hu, J.; He, Y.; Hao, X.; Li, N.; Su, Y.; Qu, H. Optimal Temperature Ranges Considering Gender Differences in Thermal Comfort, Work Performance, and Sick Building Syndrome: A Winter Field Study in University Classrooms. Energy Build. 2022, 254, 111554. [Google Scholar] [CrossRef]
- Wei, Y.; Dong, Z.; Fan, W.; Xu, K.; Tang, S.; Wang, Y.; Wu, F. A Narrative Review on the Role of Temperature and Humidity in COVID-19: Transmission, Persistence, and Epidemiological Evidence. Eco-Environ. Health 2022, 1, 73–85. [Google Scholar] [CrossRef] [PubMed]


Disclaimer/Publisher’s Note: The statements, opinions and data contained in all publications are solely those of the individual author(s) and contributor(s) and not of MDPI and/or the editor(s). MDPI and/or the editor(s) disclaim responsibility for any injury to people or property resulting from any ideas, methods, instructions or products referred to in the content. |
© 2025 by the authors. Licensee MDPI, Basel, Switzerland. This article is an open access article distributed under the terms and conditions of the Creative Commons Attribution (CC BY) license (https://creativecommons.org/licenses/by/4.0/).