Article

Research on Dual-Mode Self-Calibration Tensioning System

1
School of Mechanical and Electronic Engineering, Zhengzhou University of Light Industry, Zhengzhou 450002, China
2
Henan College of Transportation, Zhengzhou 451450, China
3
Department of Fluid Control and Automation, Harbin Institute of Technology, Harbin 150001, China
*
Author to whom correspondence should be addressed.
Fluids 2025, 10(5), 115; https://doi.org/10.3390/fluids10050115
Submission received: 19 March 2025 / Revised: 19 April 2025 / Accepted: 23 April 2025 / Published: 30 April 2025
(This article belongs to the Topic Applied Heat Transfer)

Abstract

:
In this paper, a double-mode self-calibration tension system is proposed, which adopts the conversion of hydraulic meter tension and the monitoring of standard force sensors. According to the material characteristics of the jack and the viscosity and temperature characteristics of the hydraulic oil, the differential model of heat conduction in the hydraulic cylinder and the mathematical model of oil film friction heat generation are established, and the internal thermodynamic characteristics of the jack are theoretically analyzed, which provides theoretical support for the temperature compensation of the hydraulic oil pressure gauge of the jack. A simulation analysis was conducted on the thermodynamic characteristics of the hydraulic jack, and the distribution patterns of the temperature field, thermal stress field, and thermal strain field inside the hydraulic cylinder during normal operation were determined by measuring the temperature changes in five different parts of the jack at different times (t = 200 s, 2600 s, 5000 s, 7400 s, and 10,000 s). For the issue of heat generation due to oil film friction in the hydraulic jack, a simulation calculation model is developed by integrating Computational Fluid Dynamics (CFD) techniques with dynamic grid and slip grid methods. By simulating and analyzing frictional heating under conditions where the inlet pressures are 0.1 MPa, 0.3 MPa, 0.5 MPa, 0.7 MPa, and 0.9 MPa, respectively, we can obtain the temperature distribution on the jack, determine the frictional resistance, and subsequently conduct a theoretical analysis of the simulation results. Using the high-precision standard force sensor after data processing and the hydraulic oil gauge after temperature compensation, the online self-calibration of the tensioning system is carried out, and the regression equation of the tensioning system under different oil temperatures is obtained. The double-mode self-calibration tensioning system with temperature compensation is used to verify the compensation accuracy of the proposed double-mode self-calibration tensioning system.

1. Introduction

Under the background of continuous economic growth, the road traffic network is improving day by day and the traffic flow is increasing dramatically. The accuracy and quality of the tensioning system is a problem throughout the whole life cycle of the bridge construction project, and any problem in any link will affect the quality of the project, and even lead to serious engineering accidents. A digital tensioning equipment and control system are proposed and developed in this paper, which is of great significance to improve the construction quality and efficiency and realize the construction informatization to guarantee the safety and durability of bridges [1,2,3].
As an important engineering equipment of tension system, the jack involves complex heat transfer and conversion mechanisms in its working process. Especially in the application of hydraulic jacks, the temperature change in hydraulic oil is a key factor that cannot be ignored. Because hydraulic oil is in the process of transferring pressure and power, its temperature will fluctuate with the change in working load and working environment, and the temperature change will directly affect the viscosity and flow performance of hydraulic oil. The viscosity of hydraulic oil, as the core parameter that affects its working efficiency and transmission accuracy, is very sensitive to temperature changes. Therefore, the in-depth study of the jack from the perspective of thermodynamics is of great significance for understanding its heat transfer and conversion process and optimizing its working performance [4,5,6].
To reduce the impact of this problem, researchers and engineers have carried out theoretical analysis and experimental research from different angles. Azzedine et al. have made remarkable progress in the theoretical and experimental research of fixed-plane thrust bearings. Through accurate test measurements and theoretical calculations, they found that key parameters such as bearing temperature, energy loss, and minimum oil film thickness showed good agreement between theory and test [7]. The findings not only verify the accuracy of the theoretical model but also provide an important theoretical basis for the subsequent optimization of bearing performance. Zheng et al. showed that the increase in the internal friction resistance of the jack results in increases in the internal pressure of the jack, while the tension of the prestressed tendon is insufficient and there is a large error between the force value of the hydraulic pressure gauge and the corresponding actual tension value [8]. Chen et al. researched and designed a new calibration device to calibrate the hydraulic tensioner and hydraulic jack. By comparing the calibration data of other measuring institutions or the data of the factory comparison table and analyzing the experimental results, it was shown that the calibration device had good accuracy and reliability and could be used to calibrate the hydraulic tensioner and hydraulic jack [9]. Jiao et al. introduced the basic principle of the temperature regulation method and the analysis flow and finite element method in the unloading process simulation. The unloading process of nonlinear support was reproduced by taking the cantilever beam as a single-point unloading example, and then the unloading process of the multi-point supporting beam was simulated by taking the unloading of the multi-point supporting beam as an example, and the influence of the unloading process of the multi-point supporting beam on the internal force of temporary support was pointed out [10]. Xing et al. proposed a new calibration method for the force value of the jack system, adding a large-deformation pad and a video surveillance recording reading system, which can effectively reflect the influence of sliding friction resistance on the force value calibration and significantly reduce the manual reading deviation [11]. The research above only described the phenomenon of low-tension accuracy caused by a temperature rise and the calibration method of the jack force value, both of which lack the influence of the temperature rise caused by internal friction heat generation of the jack on hydraulic oil viscosity, as well as the temperature field distribution in the hydraulic jack caused by repeated tension friction heat generation.
Regional temperature differences and seasonal temperature differences are also the main reasons for the large changes in the viscosity of hydraulic oil of construction machinery. To overcome this problem, hydraulic oil will be replaced during seasonal exchange and construction site changes in practical engineering applications, such as 46 anti-wear hydraulic oil with low viscosity in winter and 68 anti-wear hydraulic oil with high viscosity in summer [3,12]. Replacing hydraulic oil that can be used normally due to non-oil problems causes a double waste of resources and manpower, which is contrary to the construction purpose of “green environmental protection”, and the residue causes chemical changes in the process of mixing two hydraulic oils and deteriorates, affecting the normal work of the hydraulic system.
For the tension system error caused by temperature change, temperature compensation of the hydraulic pressure gauge is the main solution at present. Chen et al. designed the digital pressure gauge by comprehensively studying the comprehensive error of the combination of software nonlinear compensation and hardware compensation. The sensor of the hydraulic pressure gauge can effectively correct the nonlinear influence caused by temperature change and itself, and the measurement sensitivity is higher than 0.01% FS [13]. Chen et al. carried out full-temperature-zone compensation for pressure data to improve the accuracy of the pressure gauge by collecting data from the piezoresistive pressure sensor and temperature sensor and designed serial port output function and panel zero calibration according to the requirements of the pressure gauge [14]. Fang et al. developed a fiber-grating support manometer that can be used to monitor the working resistance of hydraulic support by using the fiber-grating sensing principle and the “diaphragm + connecting rod” structure and tested its temperature-compensating performance to eliminate temperature interference [15]. Su designed a pressure gauge circuit that can collect pressure data in real time, and increase the temperature compensation coefficient to correct the signal processing, which is conducive to improving the pressure gauge for pressure detection. The test results show that the accuracy of pressure measurement can reach 0.2%, and it has a good linearity [16]. The research results above and the temperature compensation method of hydraulic pressure gauge provide theoretical and technical support for the tensioning system to improve the tensioning accuracy.
Previous studies, both experiments and algorithms about the method of pulsation reduction in the microchannel, have focused on only giving the phenomenon of low tension accuracy caused by temperature rise and the calibration method of jack force value, all of which lack the influence of temperature rise caused by internal friction heat generation and thermal transmission of a jack on hydraulic oil viscosity, as well as the temperature field distribution in a hydraulic jack caused by repeated tension friction heat generation. To solve the heat conduction problem in the hydraulic jack, the method of heat–fluid–solid multi-field coupling to establish heat conduction and turbulence models for the solid and fluid components of the hydraulic jack is employed in this paper. The simulation analysis on the thermodynamic characteristics of the jack to determine the distribution patterns of the temperature field, thermal stress field, and thermal strain field in the hydraulic cylinder during normal operation is conducted. The model aimed to analyze the generation of heat from oil film friction during the reciprocating motion of the jack piston and heat transmission from the external environment. The temperature test bench of each key point of the jack is set up, and the heat conduction and friction heat generation characteristics in the jack are tested and studied, respectively. The temperature compensation method of the hydraulic pressure gauge and the data-processing model of the standard force sensor are given, the tension system is self-calibrated online by using the high-precision standard force sensor after data processing and the hydraulic oil meter after temperature compensation, and the regression equation of tension system under different oil temperatures is obtained.

2. System Description and Its Thermodynamic Property

2.1. Structure and Working Principle

The front hydraulic jack is mainly composed of the front, inside the steel outer cylinder body, piston rod, pipe jacking, clip locked plates, clamping shell cover, inside the handle, the cylinder lock block, the clamping piece back tube, clip casing, the bottom of the cylinder locking cap, the bottom of the cylinder, spring sheath, inner hexagonal cylindrical screw, cross recessed countersunk head screw and sealing ring (pad); its two-dimensional schematic diagram is shown in Figure 1a, and its three-dimensional outline diagram is shown in Figure 1b.
The front jack is mainly used for single-hole tension and can be used for porous pre-tightening, tension and barrier removal. The front tension jack needs to be used with the tension oil pump. The power of tension and jacking is provided by the high-pressure oil of the tension oil pump. When the front hydraulic jack is tensioned, it is against the working anchor; the working anchor is installed in the front end of the piston, and through the installation of the work and tool clamp, through the tension oil pump to the oil nozzle, and under the action of the high-pressure oil, the piston moves forward under the movement of the tool anchor, which drives the steel bundle to move forward, achieving the tension of the steel bundle.
The axisymmetric model is a special model simplification, it is suitable for those objects with axisymmetric properties. Because the structure of the front hydraulic jack has the characteristics of axial symmetry, this model can further reduce the calculation amount and improve the solving efficiency. At the same time, the axisymmetric model can maintain sufficient accuracy to ensure the reliability of the analysis results. Through the use of the finite element method for thermodynamic analysis, reasonable simplification of the jack structure, and the establishment of a 3D axisymmetric model, the calculation accuracy can be guaranteed and the solving efficiency can be significantly improved. This will provide strong support for the subsequent optimization simulation and experimental analysis in the following research. The three-dimensional cross-section schematic diagram of the front hydraulic jack is shown in Figure 1c.

2.2. Theoretical Basis of Heat Conduction

There are two main methods of heat transfer in thermodynamics: thermal conductivity and convection. The thermal radiation effect of the jack surface on the external environment is ignored. The internal solids and their contact interfaces, such as the housing of the jack, the cylinder, and the heat at the contact point between the cylinder and the piston are transferred using heat conduction. When the hydraulic oil flows along the solid surface inside the jack, heat is exchanged through thermal convection. The hydraulic oil flows into the jack under the push of external pressure; so, the heat exchange between it and the inner wall of the jack belongs to the type of forced convection.
In this paper, the jack and its internal modules need to carry out heat transfer and heat conduction; these two ways are analyzed through Formula (1), which is based on the differential equation of heat flux and temperature relationship:
λ 2 T 2 x + 2 T 2 y + 2 T 2 z + Q = 0
where T is temperature, λ is thermal conductivity, and Q is the heat produced per unit volume by the reservoir.
Steady-state heat conduction is a heat conduction process in which the temperature of an object does not change with time. In this process, the incoming and outgoing heat are equal; so, it is called thermal equilibrium. In the mathematical description of the steady-state heat conduction problem, the governing equation of the two-dimensional, constant physical, no internal heat source, steady-state heat conduction problem in the region n with boundary r can be expressed in a specific form in the polar coordinate system. In addition, there are no initial conditions in the definite solution of the steady-state heat conduction problem, only the boundary conditions. The thermodynamics of the jack belong to this phenomenon; so, when conducting thermodynamic research on it, it is necessary to consider many aspects, such as the differential equation of thermal conductivity and boundary conditions. Formula (1) is the differential equation of heat conduction of a jack, and the basic law expressed in it represents the basic law of internal thermodynamics of a jack, and Formula (2) is the formula for the boundary conditions of a jack [5].
λ T n = h c T 1 T 2
Formula (3), which describes the quantitative relationship between the temperature difference and the heat transfer rate in the convective heat transfer process, provides a powerful tool for in-depth discussion of the temperature field distribution inside the jack.
q = h c T 1 T 2
where h c is the convective heat transfer coefficient, T 1 is the wall temperature of a solid, T 2 is the wall temperature of the fluid, and q is the heat flux density of convection heat transfer.
In practical engineering applications, to analyze various convective heat transfer problems, approximate convective heat transfer coefficients are usually obtained according to empirical formulas, as shown in Formula (4):
h c = λ d N u
where d is the equivalent diameter of the fluid tube, and N u is the Nusselt number. As can be seen from Equation (4), to obtain the convective heat transfer coefficient, it is also necessary to calculate the dimensionless heat transfer directive-Nusselt number of the fluid. This coefficient is associated with the Prandt number and the Reynolds number, and the three coefficients above are closely related to the flow state of the liquid.
The correlation between the rate of change in the thermal strain of an object with time and its rate of temperature change can be revealed by the instantaneous coefficient of thermal expansion, as shown in Equation (5):
ε t t = α T T t
where ε t t is the ratio of thermal strain alteration, T t is the temperature alteration ratio, and α T is the instantaneous thermal expansion coefficient with temperature.
Without considering the anisotropy of the coefficient of thermal expansion, it is considered that the coefficient is consistent in different directions of the object [17]. Both sides of Equation (5) are integrated at the same time to obtain the thermal strain expression:
ε = α T T T 0
where T is the actual temperature, ε is the thermal strain, and T 0 is the reference temperature.
When the shell of No. 45 steel jack is subjected to the internal flow of high-temperature fuel, its temperature will continue to rise. In this heating process, the increase in the temperature of the shell and the increase in the coefficient of thermal expansion of the material will interact with each other, resulting in an increase in the thermal strain of the shell, and once the thermal equilibrium state is reached, the thermal strain of the shell will reach its peak. The load on the jack unit body can be expressed as follows:
v B T D T B Δ u d V = Δ P + v B T H Δ T d v
where B T is the transition matrix, D T is the elastoplastic coefficient matrix dependent on temperature, Δ u is the change in node displacement, Δ P is the equivalent pressure, and Δ T is the temperature difference.
It can be seen from Equation (7) that all the loads subjected to the element include the load generated by the equivalent external force and the equivalent thermal load generated by the thermal strain. In the stress–strain analysis of the body, if the external force is ignored, the thermal strain inside the body will dominate and become the main contributor to the total strain.

2.3. Theoretical Basis of Oil Film Friction Thermodynamics

When the front hydraulic jack is working, the hydraulic oil will be rubbed and squeezed by the jack piston, and the energy conversion will cause the temperature of the hydraulic oil to rise. The friction power consumption of oil film can be calculated by Newton’s friction theorem:
N f = μ A f v 2 h 0
where N f is the friction power consumption of oil film, μ is the scale factor, A f is the oil film area, v is the oil film motion linear velocity, and h 0 is the oil film thickness. It can be seen from Formula (8) that the temperature rise of the hydraulic oil is related to the shape parameters of the jack cylinder, the thickness of the oil film, the temperature rise, and the linear velocity.

2.4. Viscosity–Temperature Characteristics of Hydraulic Oil

At present, the commonly used viscosity–temperature relationship is the Roelands formula, which is a relatively accurate relation between dynamic viscosity and pressure and temperature, which can be expressed as in Equation (9) [8]:
η = η 0 e x p ( l n η 0 + 9.67 ) × 1 + 5.1 × 10 9 P z × T 138 T 0 138 s 0 1
where η is the dynamic viscosity at pressure P and temperature T , η 0 represents the dynamic viscosity at temperature T 0 , and z and s 0 are constants.
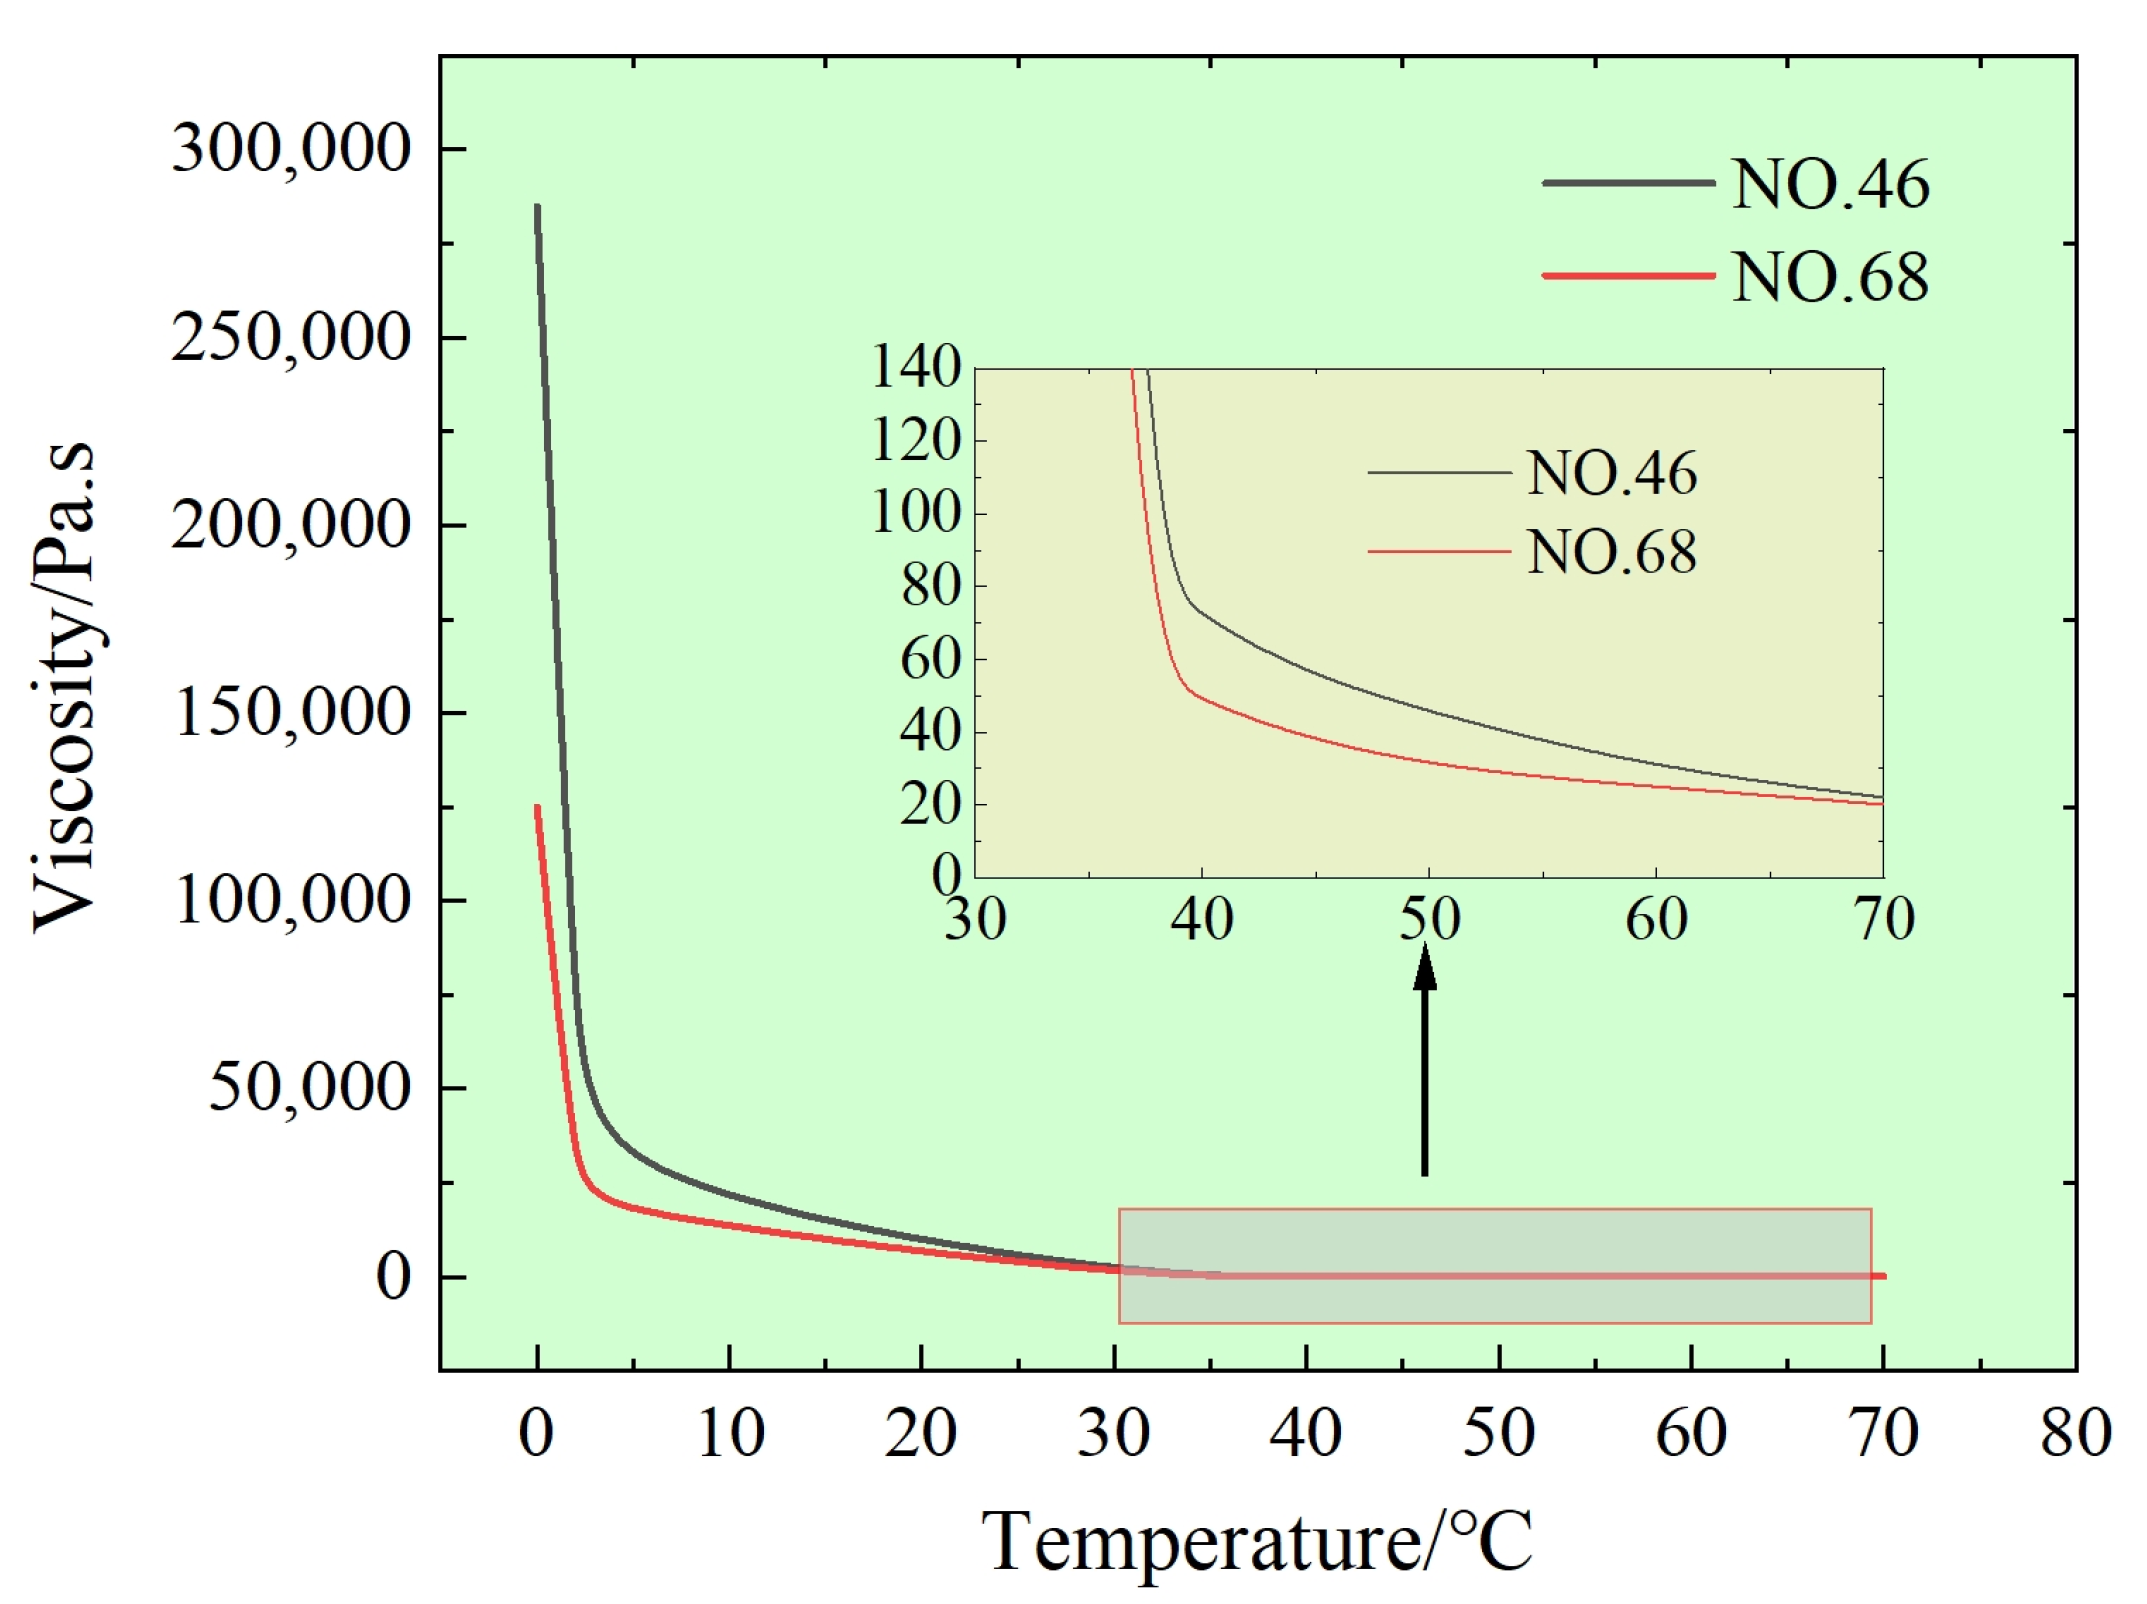
The front jack generally uses No. 46 or No. 68 anti-wear hydraulic oil as the working medium. In this paper, the No. 46 anti-wear hydraulic oil is used in both the simulation and the experiment, and the pressure magnitude is 106; so, the influence of pressure on the oil viscosity is ignored [18]. The change in oil density with temperature is small and can be ignored. Equation (10) is simplified to obtain:
η = 0.000153 e x p 6.58 × T 138 T 0 138 1.16 1
where T is the absolute temperature of oil, and T 0 is 300 K. The numerical change in oil viscosity at different temperatures is shown in Figure 2. As can be seen from the figure, the viscosity of oil varies greatly between 0 °C and 40 °C, gradually stabilizes after 40 °C, and is very sensitive to temperature change.

2.5. Regression Equation of Tensioning System

A regression equation is a mathematical expression that reflects the regression relationship between one variable (dependent variable) and another or a group of variables (independent variable) through regression analysis based on sample data. This expression describes the relationship between the dependent variable and the independent variable and can be used to predict the value of the dependent variable. In the factory calibration of tensioning systems, regression equations are often used to describe the relationship between the input force (hydraulic pressure) and the output force (tension), and to make predictions and interpretations based on this relationship.
According to JJG 621-2012 [19] “hydraulic jack” verification regulations, generally according to the least square method, set the fitting equation, and then the linear regression equation can be obtained:
a = y i b x i n
b = x i y i n x i y i x i 2 n x i 2
r = x i x y i y x i x ¯ 2 × y i y ¯ 2
where y is the dependent variable (tension), x is the independent variable (hydraulic pressure), b is the slope, a is the intercept, and r is the correlation coefficient. The most commonly used form of the regression equation is the linear regression equation, which describes a linear relationship that can be expressed as y = b x + a . The establishment of a regression equation usually needs to go through a series of data analysis processes, including data collection, data cleaning, model selection, parameter estimation, and model validation. In factory calibration, these data usually come from the input and output values of the actual measurement, and the parameters of the regression equation are obtained through statistical analysis to establish the relationship model between the input and output.

3. Model of Front Hydraulic Jack

3.1. Simulation Model

The parameters of the front jack QYC270 are shown in Table 1, which are used for subsequent simulation and test.
A quadratic tetrahedral mesh was used to divide the model, as shown in Figure 3.

3.2. Model Material Properties

The material of the jack is one of the factors that affect its temperature. The jack used in this study is No. 45 steel, with the yield strength of 355 Mpa and tensile strength of 600 Mpa, which is perfectly suited to the working needs of the jack.
No. 46 hydraulic oil is used in the following experiment and simulation, and the material of the front jack elements is No. 27 silicon manganese alloy steel. Some of their properties at different temperatures are shown in Table 2.
In the in-depth analysis of the core structure of the front hydraulic jack, the inner sealing ring has to be mentioned as a crucial component. This is not only a solid barrier to strictly guard the flow of the internal pressure working medium of the hydraulic cylinder to ensure that it does not leak under a high-pressure environment, but also a protective door to resolutely block potential threats in the external environment, such as dust, dirt and the invasion of various small foreign bodies. The inner sealing ring is the first solid line of defense to protect the oil seal, and its existence ensures the purity and stability of the internal environment of the hydraulic jack.
Different sealing rings correspond to different material selections, process treatments, and application scenarios. From high-temperature and wear-resistant special rubber to high-strength and high-elasticity metal materials, each seal is carefully designed and manufactured to meet the needs of different operating conditions. When selecting and replacing the sealing ring, it is necessary to fully consider the material properties, working environment, working medium, working intensity, and other factors to ensure that the front hydraulic jack can continue working stably and efficiently.
The dimensions and materials of the sealing ring in the front hydraulic jack for subsequent simulation and test are shown in Table 3.

3.3. Boundary Conditions

In this study, to accurately simulate the heat conduction and fluid dynamics behavior of the front hydraulic jack in the working process, appropriate boundary conditions were selected to construct the heat conduction model and turbulence model. The setting of these boundary conditions is based on the experimental conditions, the geometric characteristics of the model, and the understanding of physical phenomena.
For the heat transfer model, the following points are considered in this manuscript: (1) Constant temperature boundary condition at the jack entrance: Due to the limitation of test conditions, the temperature at the jack entrance during the test can only reach 60 °C. For comparison with the test results, the temperature was set at 60 °C. The boundary conditions ensure that the initial temperature values in the simulation process are consistent with the test conditions. (2) According to the geometry of the front hydraulic jack, its bottom shows axial symmetry. Therefore, axisymmetric boundary conditions are applied at the bottom of the model, which helps simplify the calculation and improve the simulation efficiency. (3) To calculate the heat passing through the contact surface of fluid and solid, the temperature wall function boundary conditions are used in this study. This boundary condition allows the temperature on both sides of the contact surface to change dramatically, which is more in line with the actual situation. (4) For the other boundaries of the model, it is assumed that the heat flux through these boundaries is small and negligible. Therefore, these boundaries are set as adiabatic boundary conditions.
For the turbulence model, the following points are considered in this study: (1) In the simulation process, it is necessary to set the inlet velocity boundary condition of the jack inlet pipe. The flow rate is determined according to the actual test conditions or the requirements of engineering applications. (2) The jack outlet pipe no-outflow outlet is set to the boundary condition of no outflow, that is, the fluid will not flow out of the model at the outlet. In addition, normal flow pressure boundary conditions are applied here to ensure that the pressure at the outlet corresponds to the actual situation. (3) The log-wall function boundary condition is used to describe the “fluid-solid” momentum transition relationship when a fluid flows through a solid. The condition assumes that the turbulent flow has a large tangential velocity at the laminar flow at the solid–liquid boundary, which helps to simplify the calculation and improve the calculation speed.
In the simulation process, some constraints are set to ensure the accuracy and reliability of the simulation. These constraints include: (1) It is assumed that the movement of the fluid in the jack is a laminar flow, which helps simplify the calculation and reduce the amount of calculation. (2) Newton’s law of viscosity is one of the basic laws of fluid dynamics to describe the viscous properties of fluids. (3) The inertia force on the fluid is ignored, which helps simplify the calculation and improve the efficiency of the calculation. (4) It is assumed that the volume force on the fluid is small and negligible, which helps to reduce the computation and improve the simulation speed. (5) It is assumed that the contact surface of the oil film in the hydraulic cylinder is flat, which helps to simplify the model and improve the calculation accuracy. (6) The inner wall of the hydraulic cylinder is set as a fixed wall, and the oil on the wall does not slip.

4. Results and Discussions of Simulation

The reciprocating motion equation of piston and the viscosity relation of oil are established, and these equations and relationships are imported into simulation software through UDF programming.

4.1. Thermodynamic Characteristics

Flow field analysis is a very important factor for the working state of the jack. During the flow field analysis, various parameters of the jack are set: when the hydraulic oil enters the inside of the jack, the flow rate is set to 0.013 m/s, and the entire working time of the jack is 15 s; the turbulence intensity and oil viscosity were selected for the analysis of the flow field, which was set at 5% and 10, respectively. The distribution diagram of the fluid velocity field during the oil inlet of the jack is shown in Figure 4a,b, and the fluid flow line field of the oil inlet of the jack cylinder is shown in Figure 4c,d.
Through the analysis of the fluid velocity at the oil inlet and the flow line in the flow field, it is found that when the hydraulic oil enters the jack, the fastest flow velocity is at the oil inlet. It can be seen from the pressure formula that the through-hole of the oil inlet is very small; that is, the flow area is small, and the oil inlet pressure is 61 MPa. Then, it can be seen from the theoretical and simulation results that the hydraulic oil velocity at the oil inlet is the overall maximum. Through the fluid velocity simulation diagram, it can be seen that the internal flow rate of the cylinder tends to be stable and slow.
Because the jack is in the working process of a high-intensity load and works long hours, the overall temperature rising quickly cannot always be avoided. The biggest high-temperature effect on a jack is hydraulic oil; hydraulic oil’s working condition is associated with its viscosity, and the viscosity is affected by temperature; so, it is necessary to determine thermodynamic characteristics, which are also the most important part of the whole experiment.
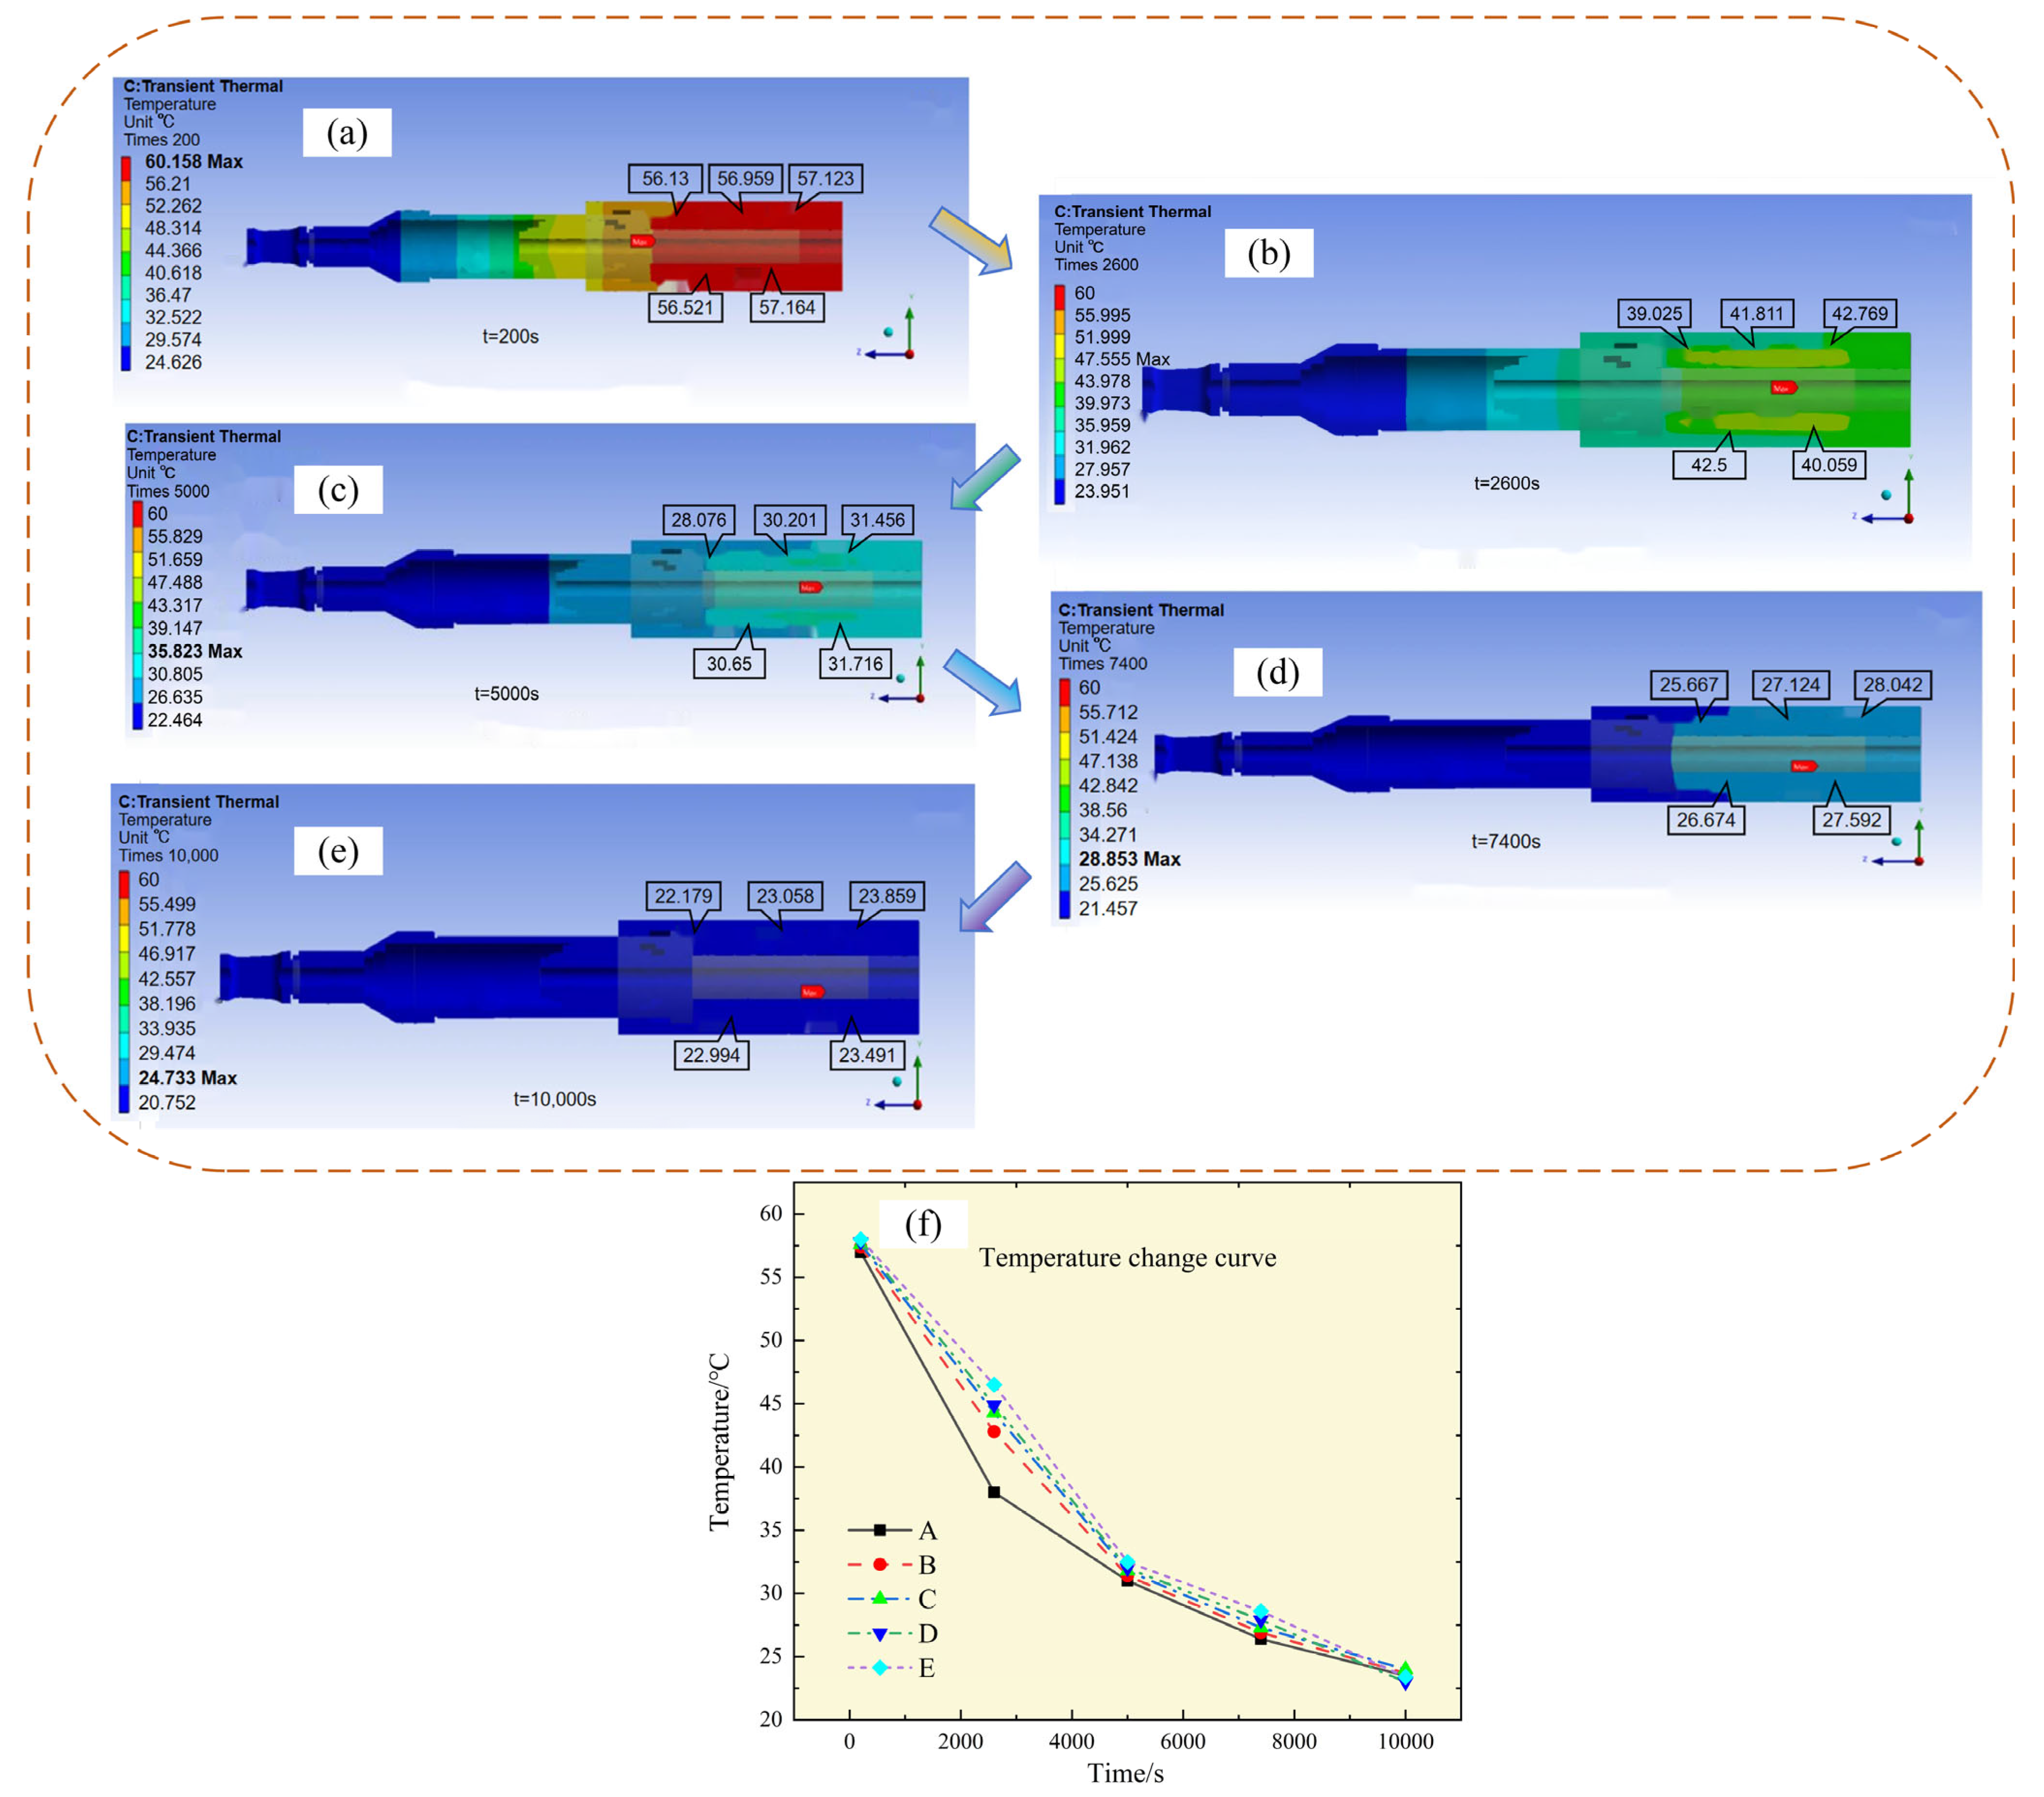
The boundary conditions of the simulation are set, and the steady-state temperature analysis is used to make the overall temperature reach the highest state. The oil temperature and the surrounding temperature reach 60 °C. Then, the transient analysis is carried out. The simulation results of the transient temperature field coupled with heat flow at different times are shown in Figure 5. The analysis time is extended to analyze the general temperature distribution and record the temperature of the five points, as shown in Figure 5f. The five curves represent the temperature changes in the five temperature sensors in the working process of the jack to capture the temperature dynamics in different areas. Specifically, the position of the sensor is arranged according to the distance from the oil inlet, in the order of A, D, B, E, C. These five points are located in different parts of the jack, including the inlet and outlet ports, the interior of the cylinder, the piston, and the base. The main reason for choosing these five points is that their location, temperature, flow rate, and direction are the most representative. By recording and analyzing the temperature data of these points, the thermal performance of the jack at different working stages can be more accurately evaluated.
From the simulation results, it can be seen that the overall heat convection of the jack is in an inversely proportional function state, the function slope is the highest at a high temperature, and the temperature heat convection is also very fast, 5000 s from 60 °C to 30 °C. From 30 °C onwards, the slope of the function begins to drop, and the thermal convection efficiency also begins to decrease, only falling by about 10 °C for 5000 s. And it can be seen from the simulation that the jack reaches a steady state at about 12,200 s; that is, the jack as a whole is consistent with the ambient temperature.

4.2. Friction Heat Generation Characteristics

Using the CDF friction heat source and UDF technology provided by finite element software, the dynamic simulation of the working process of the front hydraulic jack is carried out. The ANSYS R19.2 Gaussian heat source and UDF are used to define the viscosity and temperature characteristics of anti-wear hydraulic oil. In the simulation, the secondary development function of ANSYS/Fluent is used. Because the inlet speed and hydraulic value are different functions in the simulation, the inlet boundary conditions of the simulation software can no longer meet the conditions. Fluent UDF has a user-defined development function. UDF can be used to change the boundary conditions of the entrance, detect the velocity, pressure, and other conditions in the fluid domain at different positions and different times, and to customize the motion form of the grid. In the simulation, the functions of the three macros DEFINE_EXECUTE_AT_END, DEFINE_GRID_MOTION and DEFINE_PROFILE are to define the boundary conditions, define the boundary motion form, and collect the flow rate and pressure of a certain area in the flow channel in turn [20,21].
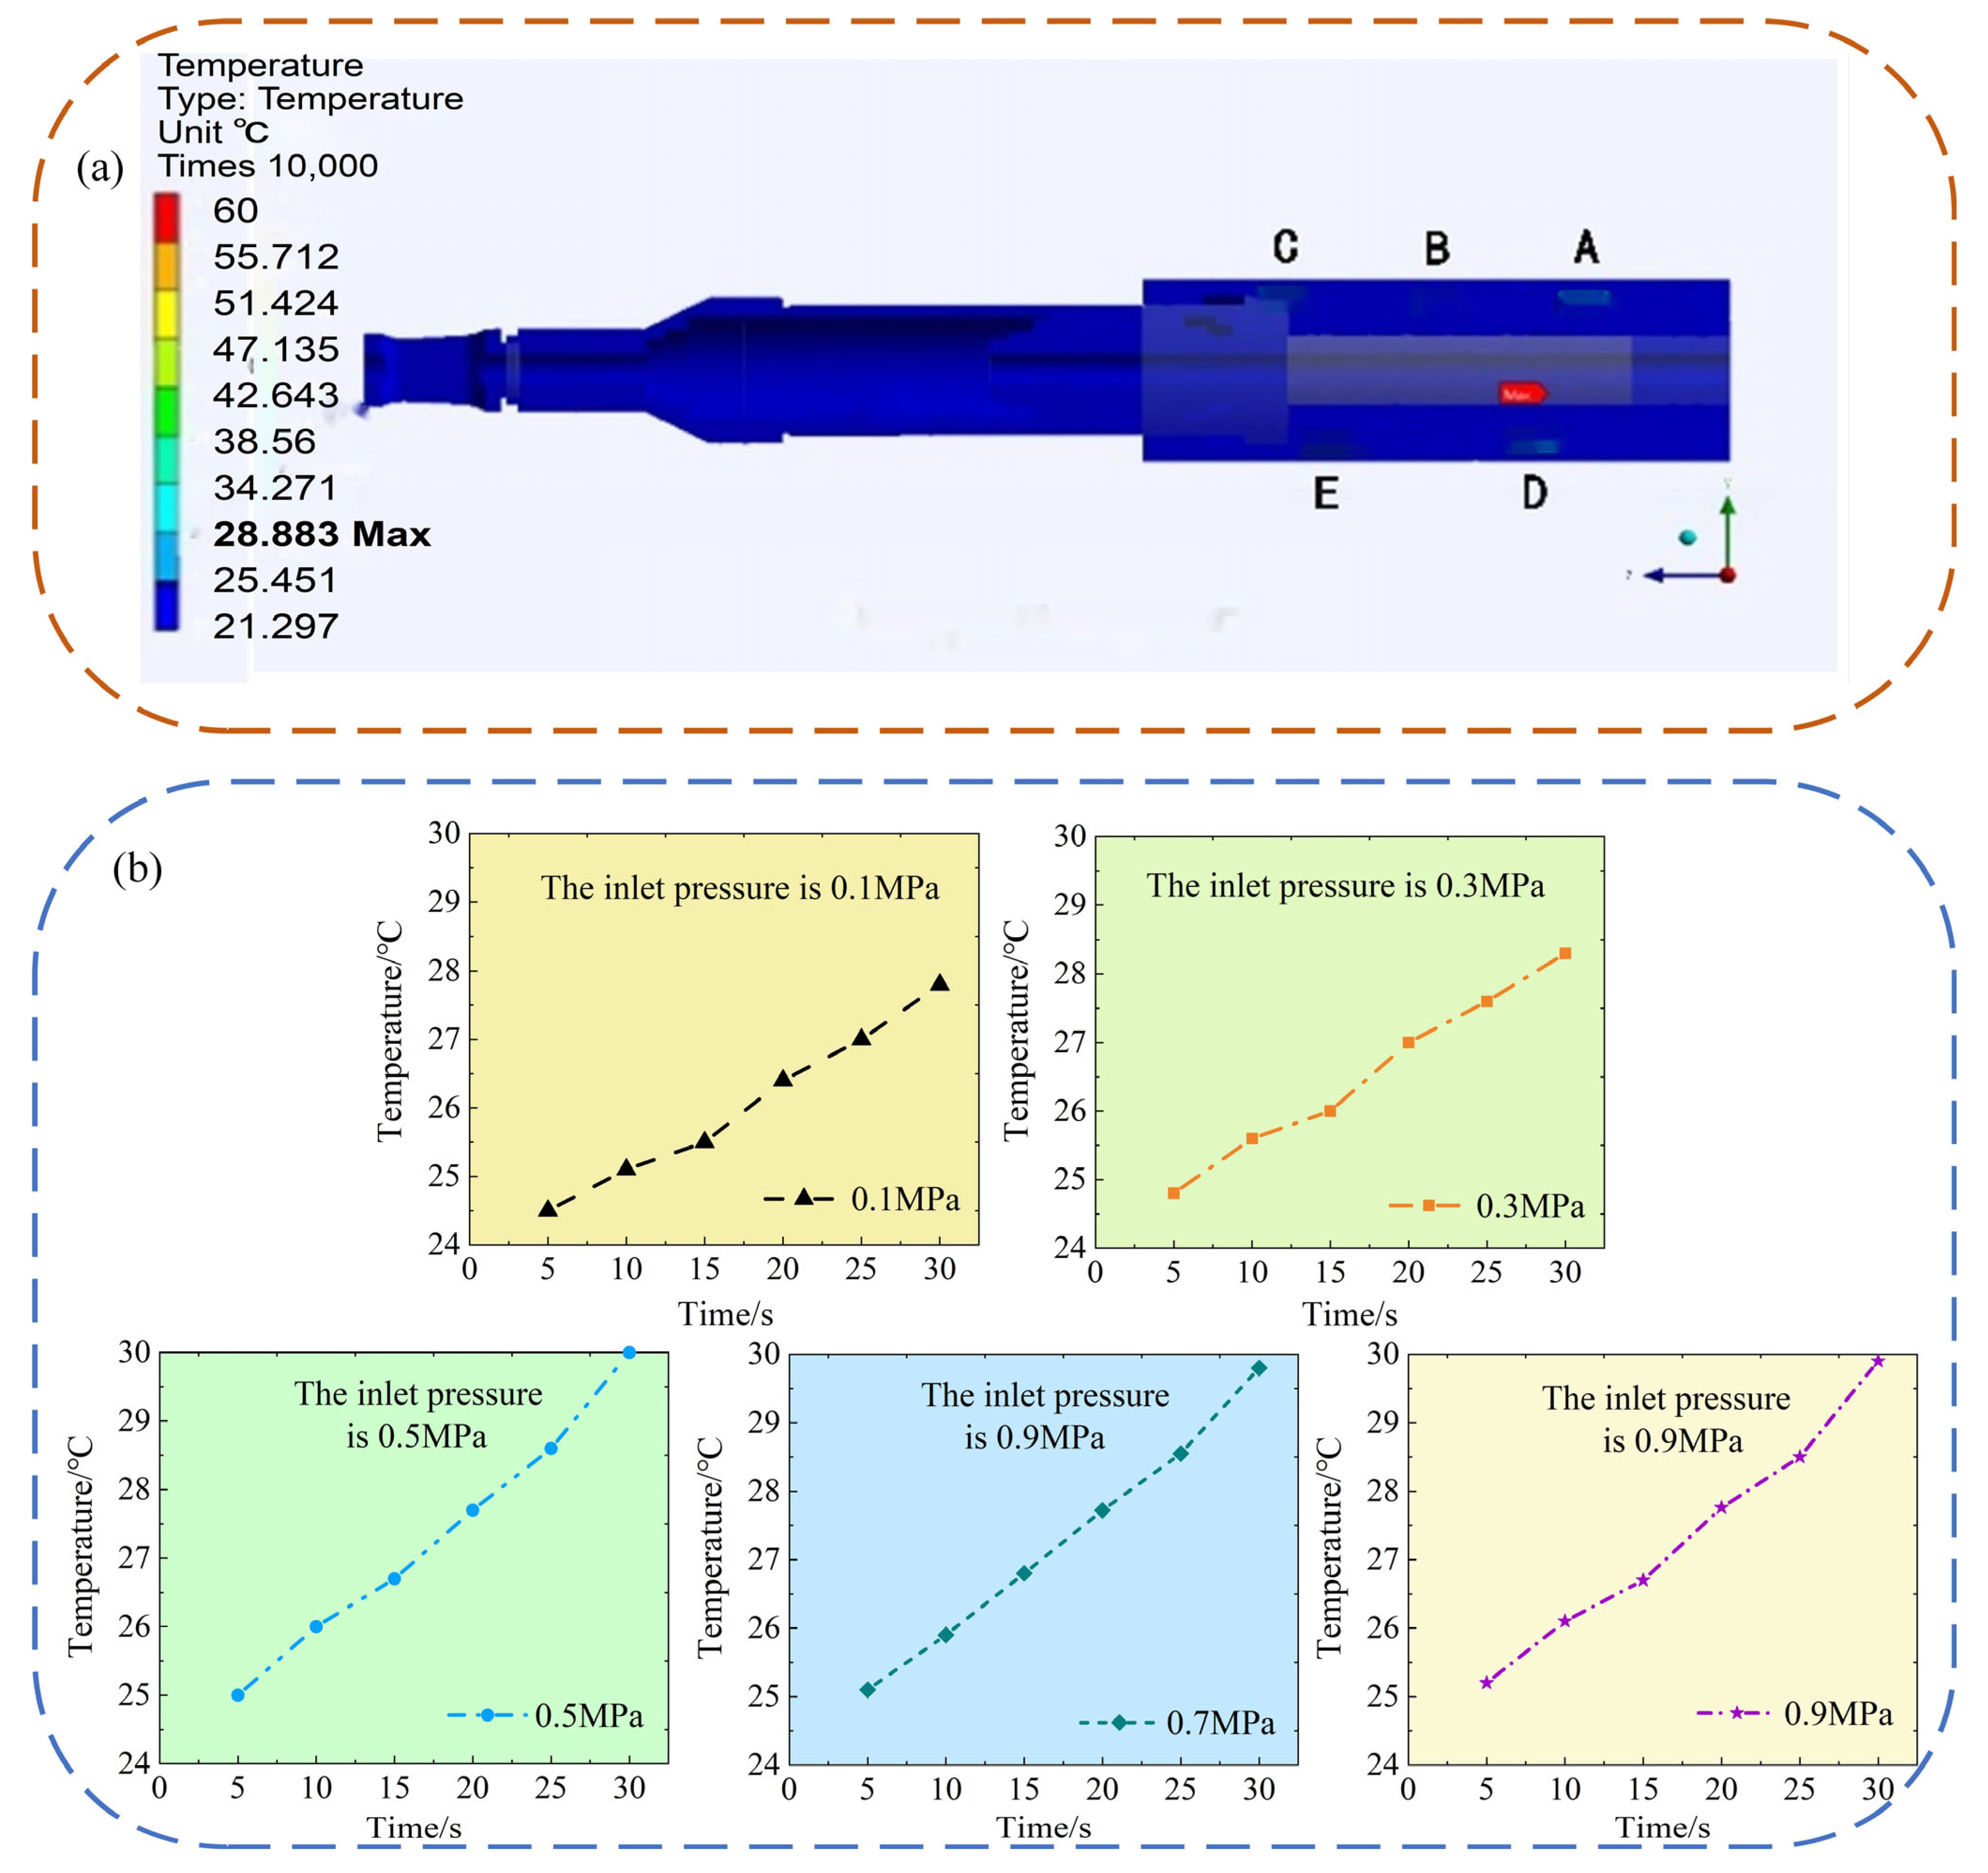
The outlet pressure of the front hydraulic jack is set to 0 MPa; that is, the ambient pressure, the temperature of the piston and hydraulic cylinder, is set to room temperature (24 °C), and the inlet pressure is set to 0.1 MPa, 0.3 MPa, 0.5 MPa, 0.7 MPa and 0.9 MPa, respectively. The temperature field distribution cloud diagram in the jack under 0.1 MPa inlet pressure conditions is shown in Figure 6a. The simulation results of the average temperature change in the five key points over time are shown in Figure 6b.
It can be seen from the simulation results that with the increase in tension times, the average oil temperature in the front hydraulic jack increases due to friction heat generation. Before reaching 0.5 MPa, the higher the inlet pressure, the faster the average oil temperature increases; that is, the slope of the temperature change curve becomes larger and larger. When the inlet pressure of the front hydraulic jack reaches 0.5 MPa, the average temperature change curve in the front hydraulic jack is almost the same, and the slope no longer changes, because after the inlet pressure reaches 0.5 MPa, the piston movement speed reaches a maximum of 0.2 m/s and remains unchanged (combined with Table 4); so, the temperature change trend is almost the same.
The numerical simulation results of piston velocity under different inlet pressures are shown in Table 4. It can be seen that when the inlet pressure of the front hydraulic jack is lower than 0.5 MPa, the corresponding piston movement speed increases with the increase in the inlet pressure of the jack. When the inlet pressure of the front hydraulic jack reaches 0.5 MPa, the piston movement speed reaches the maximum 0.2 m/s and remains unchanged, which is almost consistent with the trend of temperature change in the key point in the front hydraulic jack over time after the inlet pressure reaches 0.5 MPa, as shown in Figure 6b.

5. Experimental Section

5.1. Selected Materials and Apparatus

The dual-mode self-calibration tensioning system mainly includes the following aspects: hydraulic oil, a tensioning jack, a hydraulic power unit, and an external tension sensor. The test platform is shown in Figure 7.
In prestressed tensioning operations, hydraulic oil is the core component, which provides the necessary power for the tensioning process. Considering that the oil pressure required for the prestressed tensioning operation is large, but the amount of oil required is stable, special attention is paid to the performance and specifications of hydraulic oil when selecting a hydraulic source. After comprehensive consideration, it is decided to use anti-wear hydraulic oil No. 46 and No. 68 to meet the needs of different seasons and working conditions, as shown in Table 5. Among them, No. 46 anti-wear hydraulic oil is suitable for summer; because of its moderate viscosity and good fluidity, it can meet the working requirements at high temperatures. The No. 68 anti-wear hydraulic oil is suitable for winter, as its viscosity is slightly higher, and it can maintain good flow under low-temperature conditions to ensure the normal operation of the hydraulic system.
In the prestressed tensioning operation, the tensioning jack plays a very important role; it is the core equipment to realize the tensioning movement of the steel strand. Because the tension movement is essentially the reciprocating movement of the piston rod in the internal cylinder of the jack, the jack QYC-270 with through-core tension, which is manufactured by Kaifeng Tongli Hydraulic Company of China, is selected, as shown in Figure 7a, and its properties are shown in Table 6.
The hydraulic pump station is the power source of the hydraulic system, and its performance directly affects the stability and reliability of the hydraulic system. The hydraulic pump station is composed of a motor and an electric oil pump, as shown in Table 7 and Table 8 and Figure 7b.
To accurately monitor the working temperature of the oil inside the jack, five temperature sensors, model CHB702 FK02 MV*AN, are specially installed inside the jack, as shown in Figure 7c. The wide temperature measurement range of these sensors, covering −199.9~600.0 °C, ensures accurate temperature data under different operating conditions. The corresponding positions of the five temperature sensors are evenly arranged from the distance from the oil inlet, namely, A-D-B-E-C, and the positions of the sensors are distributed on both sides of the front hydraulic jack.
The external pressure sensor is an important part of the hydraulic system, which is responsible for real-time monitoring and recording the pressure value of the hydraulic system. When selecting an external pressure sensor, it is required that the sensor should be able to provide accurate values and appropriate measurement ranges to meet the needs of different tensioning operations. The analog hydraulic sensor using gravity is used to collect hydraulic pressure data, 0~1600 KPa, and has a good dynamic performance, enabling high-precision signal transmission and conversion so that the entire system can operate efficiently. The sensor operates at a standard supply voltage of 5 V, providing solid support for data accuracy and stability. Through a built-in high-precision temperature compensation circuit, the system has good temperature drift characteristics. The accuracy of the device is in the range of 0.5% to 1% (F·S); the response is rapid, no more than 2.0 milliseconds, and the consumption of static current is only 2.8 MA, which fully demonstrates its excellent energy efficiency, as shown in Figure 7d.
The main control module, as the core of input and output control, is responsible for accurately receiving and processing sensor signals to ensure the effectiveness of data input. Furthermore, the main control module is the key to realizing the efficient, stable, and safe operation of the system. The STM32F103RCT6 controller and its M3S development board are mainly used, and the EC200S-CN of the GSM network is used as the wireless communication module in this manuscript, as shown in Figure 7e.

5.2. Heat Conduction

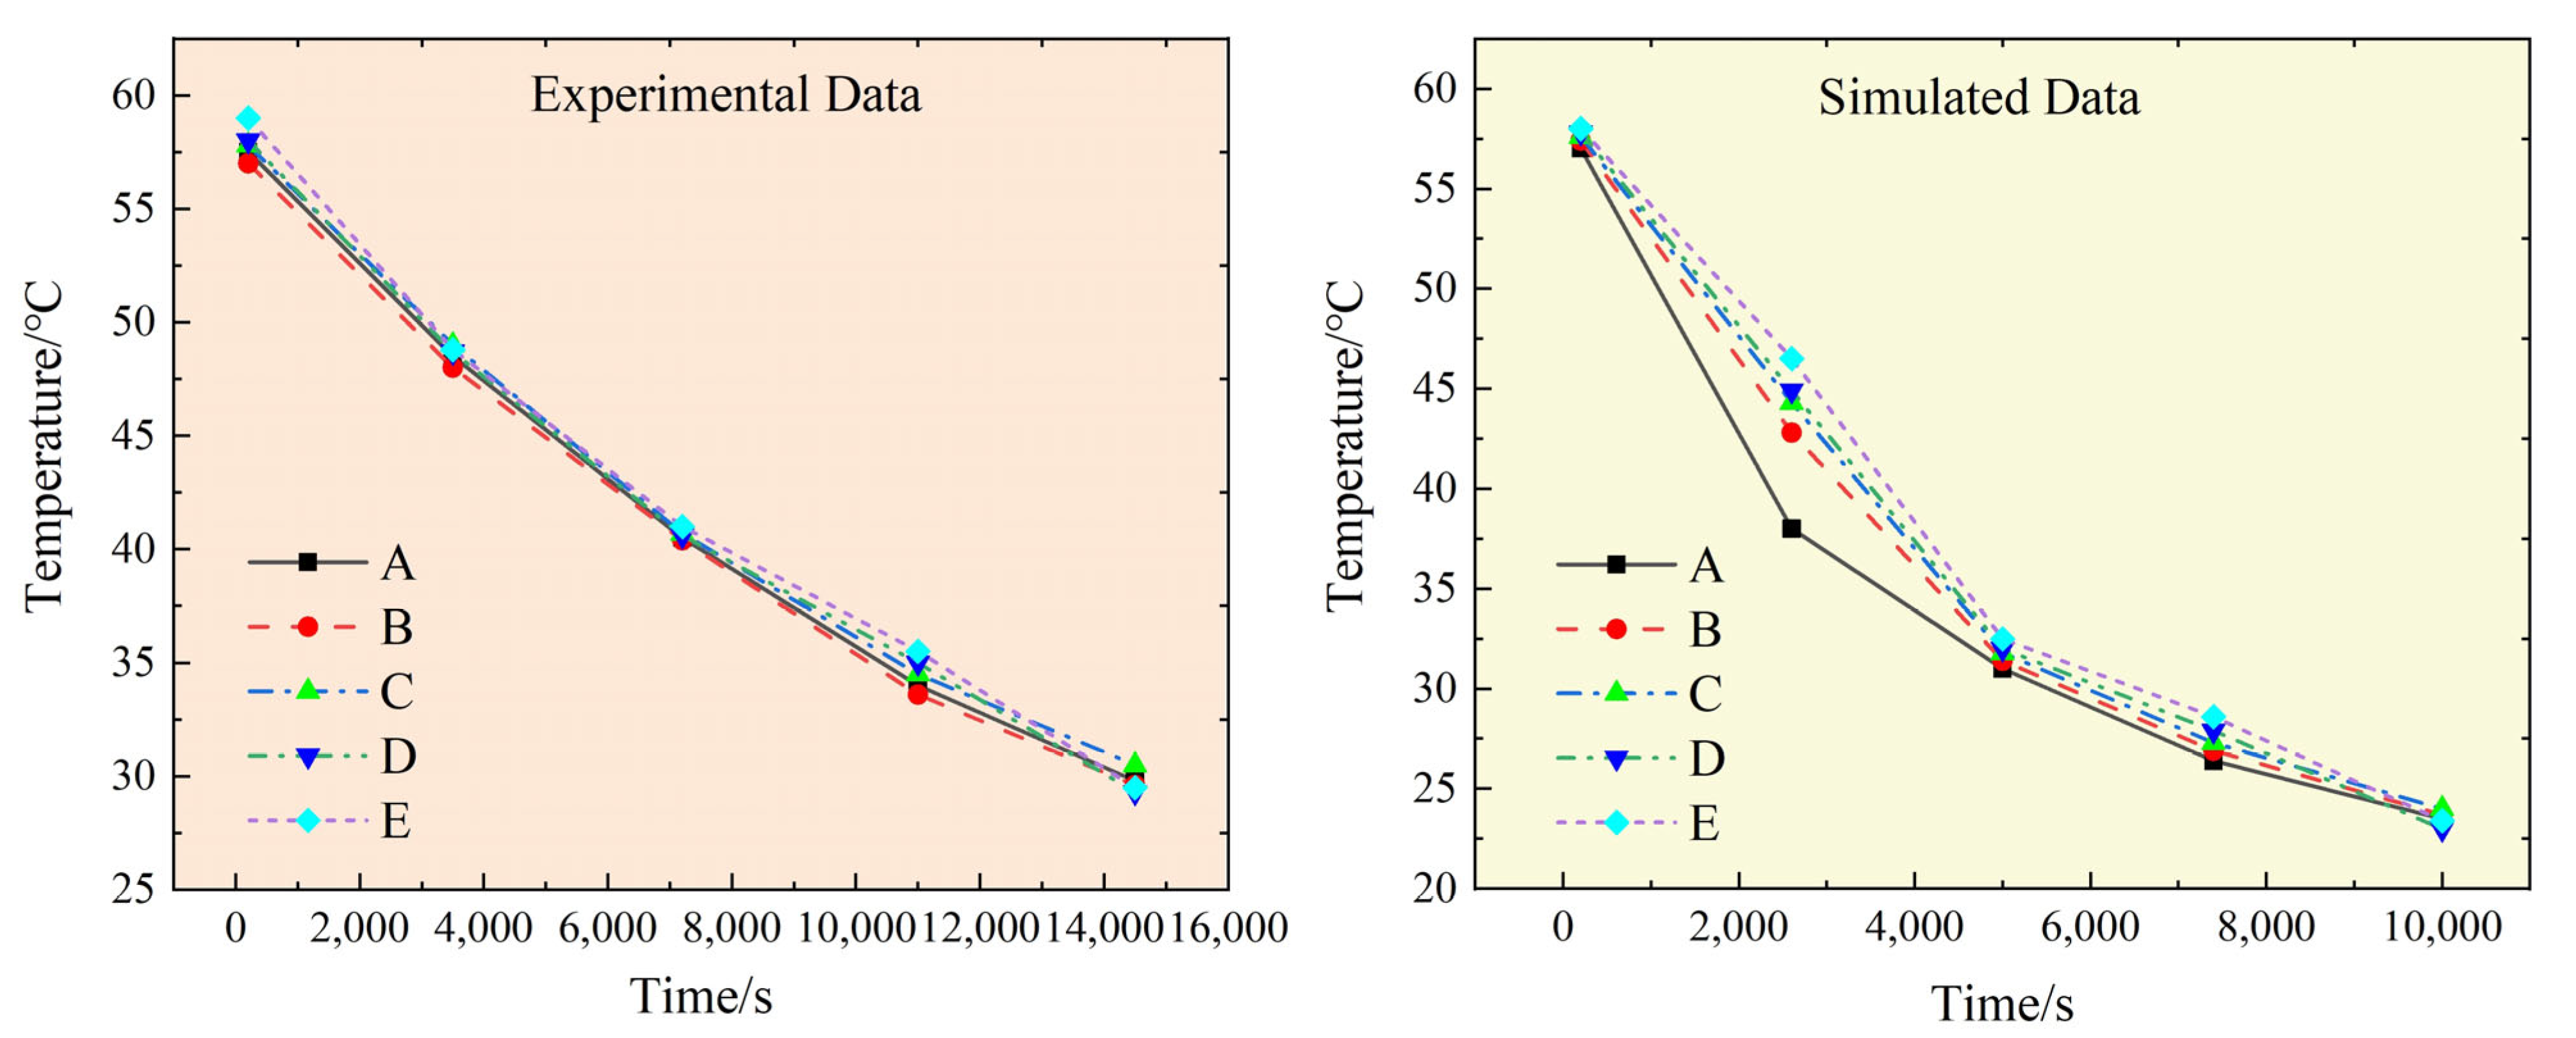
To verify these parameters through the finite element analysis results, the temperature field of the jack is tested. In the experiment, the temperature values of the inlet, outlet, piston, and outer surface of the jack are measured, and compared with the simulation results. Test conditions: start the electric heater to heat the stainless steel tube fully, and collect the temperature data when it reaches 60 °C. The sampling frequency of the data acquisition card is 1 KHz. Hydraulic oil heating uses a resistance wire heating rod directly in the oil heating because a resistance wire will produce a high-temperature phenomenon, that will damage the hydraulic oil’s body structure; so, continued stirring heating in the oil is necessary. It is thought that the jack contacts hydraulic oil in the simulation of the surface for constant temperature boundary conditions, as well as for convective heat transfer boundary surface; a jack transient temperature field simulation analysis is carried out with working conditions of a hydraulic oil temperature of 60 °C condition; the temperature change curve of the jack to reach the thermal equilibrium state after the process of each measuring point is shown in Figure 8.
The simulation results show that before 200 s, the temperature of each measuring point on the surface of the jack shell rises rapidly, and after about 12,200 s of the transition process time, the temperature of each measuring point tends to be stable. At this time, the temperature field inside the jack reaches a steady state. In the constant state, the highest temperature of each measuring point is about 25.4 °C, and the lowest temperature is about 24.6 °C. The difference between the highest temperature and the lowest temperature of the jack shell surface is about 3.6 °C. Comparing coupling boundary heat flux and temperature boundary condition of simulation results, the simulation results obtained by thermal coupling boundary, the transient process of the jack is more prolonged, taking about after 10,000 s to reach a thermal equilibrium state; after reaching a steady state, the inside of the jack temperature difference is more prominent, and the highest temperature of each measuring point cannot reach the hydraulic oil temperature. The simulation results obtained using temperature boundary conditions show that the transient process of the jack is concise, and it reaches thermal equilibrium after about 200 s. When it reaches a steady state, the temperature difference inside the jack is tiny, and the temperature of the whole jack is close to the working temperature of the hydraulic oil.
The comparison between the test data and the simulation results shows a particular deviation between the test temperature and the simulation results, and the test values are slightly lower than the simulation values. Nevertheless, the overall trend of data change is consistent. The deviation mainly lies in the gap between the selected convection heat transfer coefficient and the actual heat transfer situation. In the test, there is inevitable leakage inside the jack, and heat loss occurs, while the temperature of the gas is constant in the simulation calculation, and the heat loss is slight. There is a gap between the natural convective boundary conditions used in simulation and the actual surface contact conditions.
There is a specific deviation between the set boundary conditions and the actual environment, the performance of water bath heating and the heat loss of the pipeline have a more significant effect on temperature, and because the adhesive thermal coupling has a particular impact on the structure of the jack, there will be leakage, which has a specific influence on the test. However, when the heat transfer coefficient cannot be used to calculate the heat flux of the fluid and the solid, the thermodynamic analysis of the jack can be carried out by coupling the heat transfer model in the solid, and the turbulence model in the fluid.

5.3. Friction Heat Generation

Parameters such as inlet pressure, piston speed, outlet pressure, wall temperature, piston and wall roughness in this test are shown in Table 9.
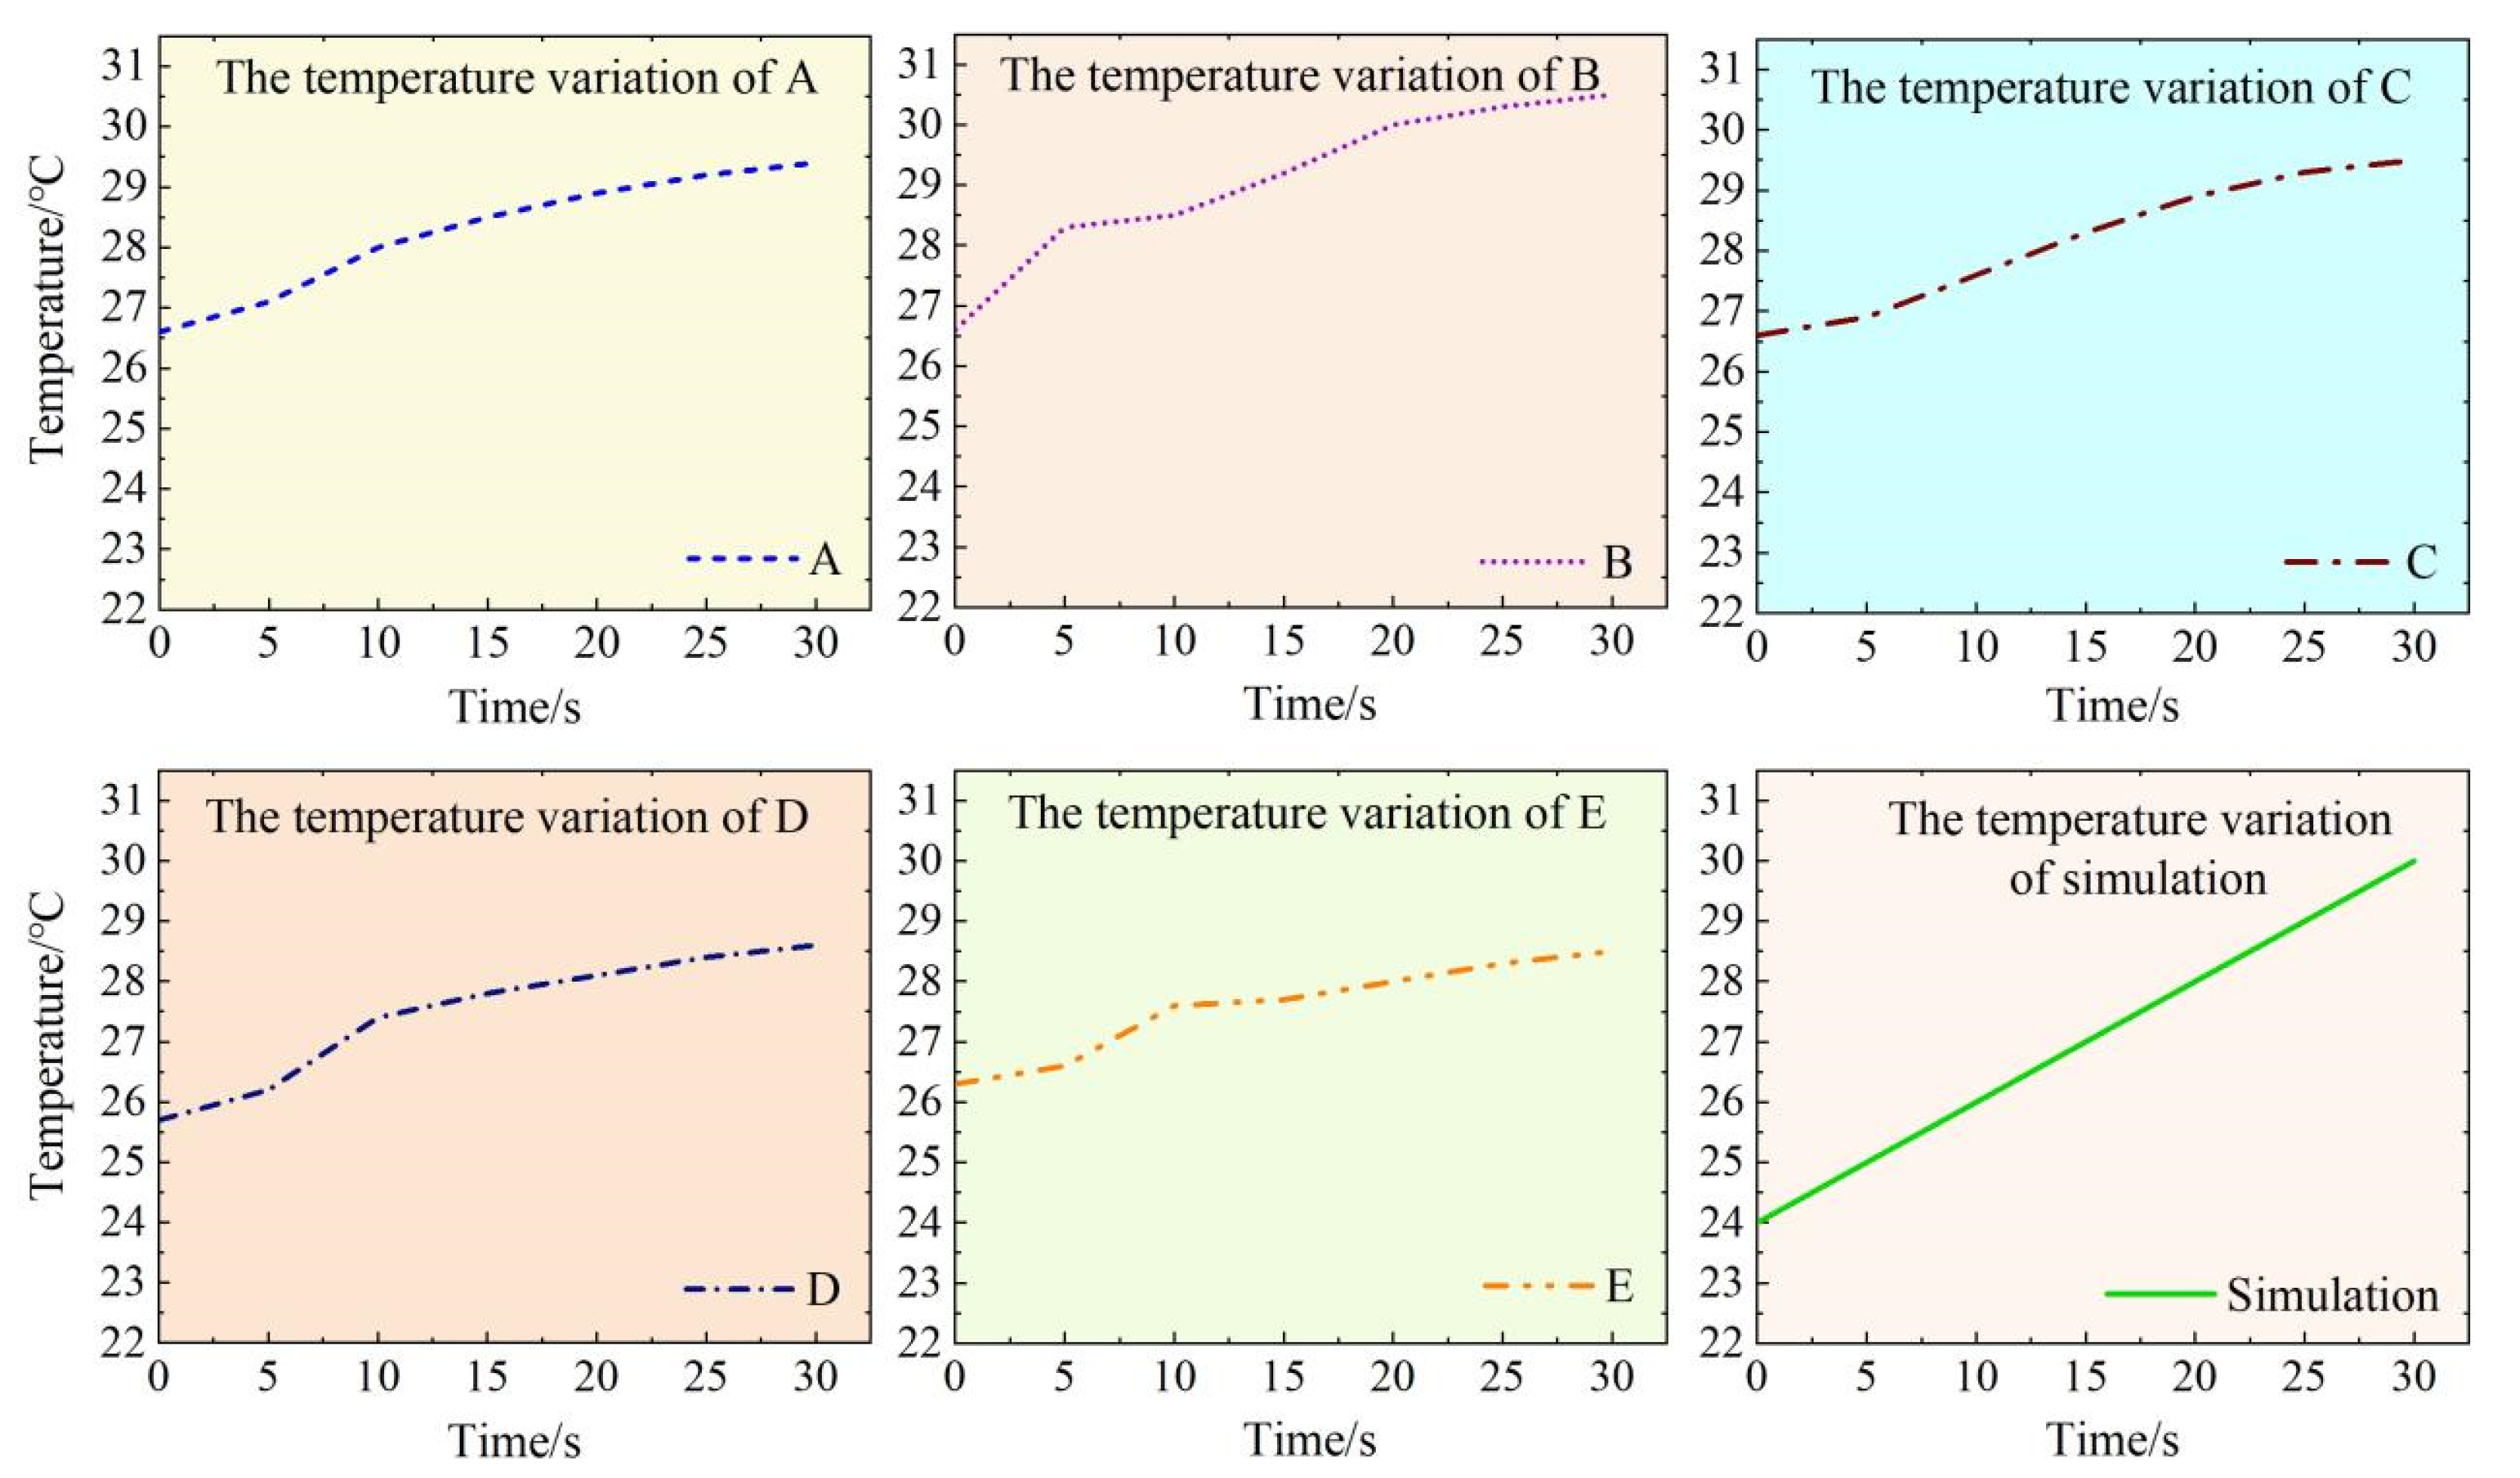
According to the numerical simulation results above, after the inlet pressure reaches 0.5 MPa, the piston movement speed reaches the maximum and remains unchanged (combined with Table 3); so, the temperature change curve is almost the same. Therefore, in the test, the inlet pressure of the clamping hydraulic jack before setting is 0.5 MPa. The five distributed temperature sensors detect the operating temperature changes in each key measurement point, as shown in Figure 9.
The five curves A, B, C, D, and E in the figure correspond to the measured oil temperature at the jack position of the five sensors, respectively. The orange curve represents the numerical simulation average temperature curve of the five key points when the inlet pressure is 0.5 MPa. It can be seen from the test results that the temperature of the hydraulic oil in the cylinder of the front clamp hydraulic jack gradually increases with the increase in tensioning times. After 15 tensioning times, the average temperature of the five key points reaches about 27 °C, and after 30 tensioning times, the average temperature reaches 30 °C, which is consistent with the overall trend of the simulation analysis results.
There are some errors between the temperature rise trend of the key point oil in the hydraulic cylinder and the numerical simulation data, which are mainly caused by the following aspects: (1) For safety considerations, the test pressure value of the front clamp hydraulic jack is reduced compared with that of the jack on the construction site. (2) Due to test requirements, five temperature sensors are drilled and installed on the main body of the jack, which are accompanied by a little oil leakage and heat dissipation during the working process. (3) In the test process, the 30 tensioning times of the front clamp hydraulic jack are manually operated by the test personnel, and its heat production efficiency is slightly lower than that of the simulation. (4) During the test process, the oil in the high-pressure oil pump generates heat due to compression; so, the room temperature is 24 °C, but the actual initial detection temperature is higher than the temperature value.

5.4. Regression Equations for Different Temperatures

As an important mechanical tool, the accuracy and reliability of jack performance are crucial for various engineering applications. In order to ensure that the performance of the jack meets the expected standard, the verification method is usually used at the factory to obtain the regression equation. The regression equation of the tensioning equipment used in the test in this paper was obtained from a third-party calibration center. A force pressure regression equation with force as the independent variable through least squares fitting is established:
y = a + b x ,
where y is pressure gauge value, and x is the standard force value. Ten calibration points from 10% (5 MPa) of the rated force value of the hydraulic jack are selected and calibrated point by point in increasing order. Based on the reading of the indicator pressure gauge, the reading of the standard force gauge is read, the test is repeated three times, and the data are recorded. The hydraulic jack test data are shown in Table 10.
Regression equations are established to group experimental data, where the trend lines of data fitting overlap and the slopes of the regression equations are equal. From Figure 10, it can be concluded that a = −1.01644, b = 4.31934, and the linear correlation r is 0.99998. The regression equation of the equipment is as follows: y = 4.31934x − 1.01644.
The high-precision standard force sensor and the hydraulic oil gauge after temperature compensation are used to carry out online self-calibration of the tension system, and the regression equation of the tension system under different oil temperatures is obtained, as shown in Table 11. C language is programmed into the controller, which is used for the controller to call different regression equations at different temperatures to achieve the online self-calibration function.
With the self-calibration function, the system can solve the problems of poor stability and short maintenance periods under extreme conditions. The specific parameters are shown in Table 12. Through the remote information transmission function, the intelligent management of the equipment is realized, and the problem that the traditional equipment is not intelligent is solved. At the same time, from the improvement and research of thermodynamics, the system further improves the accuracy and reduces the error based on the high precision of the original QYC-270 equipment.

6. Conclusions and Future Work

In conclusion, the heat conduction model and turbulence model were established for the solid and fluid parts of the hydraulic jack, respectively, by using the heat–fluid–solid coupling method. The thermodynamic characteristics of the jack were simulated and analyzed, and the distribution laws of the temperature field, thermal stress field, and thermal strain field in the hydraulic cylinder were obtained during normal operation. Aiming at the problem of oil film friction heat generation in the jack, UDF programming was carried out according to the piston motion equation by combining the CFD dynamic grid and slip grid method, the jack simulation calculation model was established according to the viscosity and temperature characteristics of oil, and the modeling and analysis method of oil film friction heat generation in reciprocating motion of jack piston was given. After the inlet pressure reached 0.5 MPa, the piston movement speed reached a maximum value of 0.2 m/s and remained unchanged, at which point the temperature change trend was essentially the same.
The simulation and experimental analysis results show that the closer the position of the oil inlet, the more significant the temperature change. The heat convection of the jack as a whole presented an inversely proportional function. The higher the oil temperature, the faster the heat dissipation of the jack. In the oil film friction heat generation, the temperature rose faster in the early stage, but after 15 tensioning times, the average temperature of the five key points reached about 27 °C, and after 30 tensioning times, the average temperature reached 30 °C, which is consistent with the overall trend of the simulation analysis results, as the temperature rise trend in the subsequent tensioning work was stable. The reasonableness, correctness of the theoretical model, and practicability of the application of the thermo-fluid–solid coupling method to predict the friction thermodynamic characteristics of oil in front clamped hydraulic jacks under steady state are verified. The thermodynamic characteristics of the jack provide a theoretical basis for the temperature compensation of the hydraulic oil gauge and the self-calibration of the regression equation under different temperatures.
The high-precision standard force sensor and the temperature-compensated hydraulic oil gauge were used to calibrate the regression equation of the tension system online, the regression equation of the tension system under different oil temperatures was given, and the C language was programmed into the controller for the controller to call different regression equations under different temperatures to achieve the online self-calibration function. Through the self-calibration function, the system can solve the problems of poor stability and short maintenance period of the equipment under extreme conditions, and realize real-time calibration by itself without waiting for the period and taking it to the professional site for calibration, reducing the inaccuracy of tension data caused by various factors in the construction process.
It should be noted that in order to consider safety issues, the embedded temperature sensor installed on the jack leads the jack to have a slight leakage of hydraulic oil, resulting in pressure reduction, and subsequent research will aim to improve this.

Author Contributions

Conceptualization, X.L. and J.S.; methodology, X.L. and S.L.; software, Y.Z.; validation, Y.Z., C.P., L.B. and K.Z.; formal analysis, X.L.; investigation, J.S.; resources, G.Y.; data curation, Y.Z.; writing—original draft preparation, X.L.; writing—review and editing, X.L., Y.Z., L.B. and K.Z.; visualization, J.S.; supervision, G.Y.; project administration, S.L.; funding acquisition, J.P. All authors have read and agreed to the published version of the manuscript.

Funding

This research was funded by the National Natural Science Foundation of China (grant number 52005453), the Key Scientific and Technological Project of Henan Province (grant number 252102241012), and the Science and Technology Project of the Henan Provincial Department of Transportation (grant number 2020J1 and 2023-5-3).

Data Availability Statement

The original contributions presented in the study are included in the article, further inquiries can be directed to the corresponding author.

Conflicts of Interest

The authors declare no conflicts of interest.

References

  1. Liu, Z.; Shi, G.; Zhang, A. Intelligent tensioning method for prestressed cables based on digital twins and artificial intelligence. Sensors 2020, 20, 7006. [Google Scholar] [CrossRef] [PubMed]
  2. Tao, Z.; Zhu, Z.; Han, W. Static tension test and the finite element analysis of constant resistance and large deformation anchor cable. Adv. Mech. Eng. 2018, 10, 1687814018810638. [Google Scholar] [CrossRef]
  3. Jun, C.; Xiu, L. Study on Fluid–Solid Coupling Heat Transfer in Fractal Porous Medium by Lattice Boltzmann Method. Appl. Therm. Eng. 2010, 30, 715–723. [Google Scholar]
  4. Wang, M. Analysis of Leakage Causes and Prevention of Mine Hydraulic Jack. MMD 2017, 32, 191–192. [Google Scholar]
  5. Zeng, W. Research on Multi-Field Coupling Characteristics of Pneumatic High Temperature Flow-Rate Control Valve. Master’s Thesis, Harbin Institute of Technology, Harbin, China, 2011. (In Chinese). [Google Scholar]
  6. Chen, X.; Li, S.; Nie, B. Thermodynamic Research on High Temperature Flow Rate Control Valve for Scramjet Engine. FPTC 2008, 5, 31–33. [Google Scholar]
  7. Kawaike, K.; Okano, K.; Furukawa, Y. Performance of a Large Thrust Bearing with Minimized Thermal Distortion. ASLE Trans. 2008, 22, 125–134. [Google Scholar] [CrossRef]
  8. Zheng, J.; Yang, F.; He, Y. A new servo hydraulic pad system and its thermal analysis. Hydraul. Pneum. 2020, 4, 117–122. [Google Scholar]
  9. Chen, B.; Yang, S.; Liu, Z. Research on a calibration device for hydraulic tension and pressure output devices. Metrol. Technol. 2017, 8, 54–57. [Google Scholar]
  10. Jiao, C. Simulation method of jack unloading process based on temperature regulation method. Construction 2022, 44, 826–829. [Google Scholar]
  11. Xing, X.; Jin, L.; Zhang, X. Experimental study on force calibration of hydraulic jack system with sliding friction resistance. LTM 2015, 12, 97–100. [Google Scholar]
  12. Chen, D. Thermodynamic Study of Jet Pipe Servo Valve with Cooling Oil Channel. Hydraul. Pneum. 2018, 4, 22–25. [Google Scholar]
  13. Chen, P.; Du, J.; Wang, Y. Design and algorithm analysis of error compensation for digital pressure gauge. Meas. Test. Tech. 2021, 48, 96–100. [Google Scholar]
  14. Chen, B.; Cheng, B.; Li, Y. Design of precision digital pressure gauge based on C8051F060. Telem. Telecontrol. 2019, 40, 71–74. [Google Scholar]
  15. Fang, X.; Liang, M.; Xing, X. Development of hydraulic support pressure gauge based on FBG and its performance test. J. Min. Saf. Eng. 2018, 35, 945–952. [Google Scholar]
  16. Shu, Z. Fire Pressure Gauge Circuit Design with Wireless Communication Function. Master’s Thesis, Hangzhou Dianzi University, Hangzhou, China, 2017. (In Chinese). [Google Scholar]
  17. Liu, W.; Bai, Y.; Song, H. Thermodynamic characteristics analysis of single tensioning front card jack. Chin. Hydraul. Pneum. 2023, 47, 42–48. [Google Scholar]
  18. Yan, X. Development and Application of High Quality Hydraulic Oils HM46, HM56, and HM68. Pet. Process. Petrochem. 1991, 11, 5–11. [Google Scholar]
  19. Huang, S.; Peng, D. Verification Regulation of Hydraulic Jack; Standards Press of China: Beijing, China, 2012. [Google Scholar]
  20. Dadouche, A.; Fillon, M.; Dmochowski, W. Performance of a Hydrodynamic Fixed Geometry Thrust Bearing: Comparison between experimental data and numerical results. Tribol. Trans. 2006, 49, 419–426. [Google Scholar] [CrossRef]
  21. Radhakrishnan, V.; Allwin, l.; Kennedy, J.S. Mitigation of insecticide detoxifying enzymes in Plutella Xylo stella using Bacillus thuringiensis. Environ. Sci. Indian J. 2009, 4, 77–82. [Google Scholar]
Figure 1. Construction of the front hydraulic jack. (a) Two-dimensional schematic diagram; (b) three-dimensional outline diagram; (c) simplified three-dimensional cross-section diagram.
Fluids 10 00115 g001
Figure 2. Viscosity–temperature characteristics of Nos. 46 and 68 anti-wear hydraulic oils.
Fluids 10 00115 g002
Figure 3. Sealing structure and model grid of the front hydraulic jack.
Fluids 10 00115 g003
Figure 4. The fluid velocity field and the flow field of the jack cylinder inlet during jack inlet. (a) Fluid velocity field profile of the cylinder; (b) fluid velocity field of the cylinder inlet; (c) flow field profile of the cylinder; (d) flow field of the cylinder inlet.
Fluids 10 00115 g004
Figure 5. Simulation results of heat flux coupled transient temperature field. (a) t = 200 s; (b) t = 2600 s; (c) t = 5000 s; (d) t = 7400 s; (e) t = 10,000 s; (f) simulation curve of temperature change for each key measurement point.
Fluids 10 00115 g005
Figure 6. Simulation results of friction heat generation. (a) Nephogram of the temperature field distribution in jack; (b) curves of the average temperature of the key points under different inlet pressures.
Fluids 10 00115 g006
Figure 7. Test piece and test platform of dual-mode self-calibration tensioning system. (a) Test platform; (b) high-pressure oil pump; (c) installation position of the temperature sensor; (d) tension sensor; (e) controller and wireless transmission module.
Fluids 10 00115 g007
Figure 8. Temperature curves of each key measuring point.
Fluids 10 00115 g008
Figure 9. Test curve of average temperature change at each key measuring point.
Fluids 10 00115 g009
Figure 10. Regression equation data for tensioning equipment at the factory.
Fluids 10 00115 g010
Table 1. Parameter of the front jack QYC270 for simulation and experiment.
No.Parameter NameValue
1Nominal tension270 KN
2Rated oil pressure61 MPa
3Area of tension cylinder4416 mm2
4Area of return cylinder1256 mm2
5Return oil pressure≤20 MPa
6Operating stroke200 mm
7Diameter of the center hole18 mm
Table 2. The basic parameters of the Fluent model’s material.
No.MaterialHydraulic OilAlloy Steel
1Density (kg∙m−3)7800886
2Thermal conductivity (W∙m−1∙°C−1)460.125
3Specific heat capacity (J∙kg−1∙°C−1)4602.273
4Dynamic viscosity (m2∙s−1)-0.05458
Table 3. Sealing rings and attribute dimensions.
No.TypeNameQuantityMaterialDimension/mm
Ddh
1SYTD-9-75J-type dust ring1Polyurethane87.5757
2SYTD-9-75YX shaft sealing ring1Polyurethane87756
3SYTD-9-75J-type ultra-thin dust ring1Polyurethane49403
4SYTD-9-75ST holes grit ring2F4 + Bronze8569.56.3
5SYTD-9-75ST shaft with Ster sealing2F5 + Bronze55.5406.3
Table 4. Piston movement velocity corresponding to different inlet pressures.
No.Inlet Pressure P1/MPaPiston Movement Velocity v/(m/s)
10.10.14
20.30.17
30.50.2
40.70.2
50.90.2
Table 5. Nos. 46 and 68 anti-wear hydraulic oil properties (40 °C).
No.Name46#68#
1Flash point240 °C204 °C
2Pour point−15 °C−10 °C
3Performance featureExcellent anti-wear properties, good lubrication properties, excellent oxidation resistance, good viscosity and temperature characteristics, good anti-wear properties, anti-emulsification properties
Table 6. Properties of the jack used in the experiment.
No.PropertiesNumber
1Nominal tension270 KN
2Rated oil pressure61 MPa
3Tension cylinder area4423 mm2
4Return oil pressure10 MPa
5Pulling stroke200 mm
6Dead load20 kg
Table 7. Electric oil pump.
Rated Oil PressureMotor PowerElectromotorOil Pump Speed
50 Mpa2 L/min3 kW/4 poles1420 r/min
Table 8. Parameters of the motor.
No.PropertiesNumber
1TypeYE2-100L2-4
2ElectromotorIM
3Anti-corrosion gradeIP55
4working systemS1
5Voltage380 V
6Power3.0 A
7Rotate speed1420 r/min
8CONNY
9EFF.%82.7
10Frequency50 Hz
Table 9. Parameter values of test conditions.
No.ParameterValue
1Inlet pressure (MPa)0.5
2Piston velocity (m/s)0.013
3Outlet pressure (MPa)0
4Wall temperature (K)297.35
5Piston roughness (μm)6.3
6Gasket roughness (μm)6.3
Table 10. Hydraulic jack test data.
Pressure Gauge Value/MpaDetection Force Value/kNAverage/kN
The First TimeThe Second TimeThe Third Time
521.220.821.121.0
1043.442.142.242.6
1564.362.862.963.3
2084.884.984.784.8
25106.4106.6106.7106.6
30128.7127.8128.8128.4
35150.6150.5150.4150.5
40172.0172.1172.3172.1
45193.4193.2193.3193.3
50214.2214.7216.0215.0
Table 11. Regression equations at different temperatures.
Temperature/°Caby = a + bx
15−0.034.3y = −0.03 + 4.3x
20−1.024.32y = −1.02 + 4.32x
25−2.484.35y = −2.48 + 4.35x
30−3.644.38y = −3.64 + 4.38x
Table 12. System data comparison.
No.Truth-Value
(Spring Meter)
Test Value (Standard Force Transducer)TemperatureTensile Force Value Is Converted by the Factory Regression EquationTensile Force Value Is Converted by the Self-Calibration Regression EquationSelf-Calibration Before and After Error Reduction Value
150 N49.8 N17.3 °C49.1 N49.5 N0.8%
2100 N99.5 N17.5 °C98.2 N99.0 N0.8%
3150 N149.4 N17.7 °C147.3 N148.9 N1.1%
4200 N199.2 N18.2 °C196.5 N198.4 N0.95%
5250 N249.1 N22.3 °C245.5 N248.3 N1.2%
6300 N299.1 N24.5 °C294.2 N297.9 N1.23%
7400 N398.8 N29.8 °C392.2 N397.5 N1.35%
8500 N498.9 N34.6 °C490.2 N496.9 N1.36%
Disclaimer/Publisher’s Note: The statements, opinions and data contained in all publications are solely those of the individual author(s) and contributor(s) and not of MDPI and/or the editor(s). MDPI and/or the editor(s) disclaim responsibility for any injury to people or property resulting from any ideas, methods, instructions or products referred to in the content.