Thermal Performance Analysis of LOX/LCH4 Engine Feed Systems Using CFD Modeling

Abstract
1. Introduction
2. Methodology
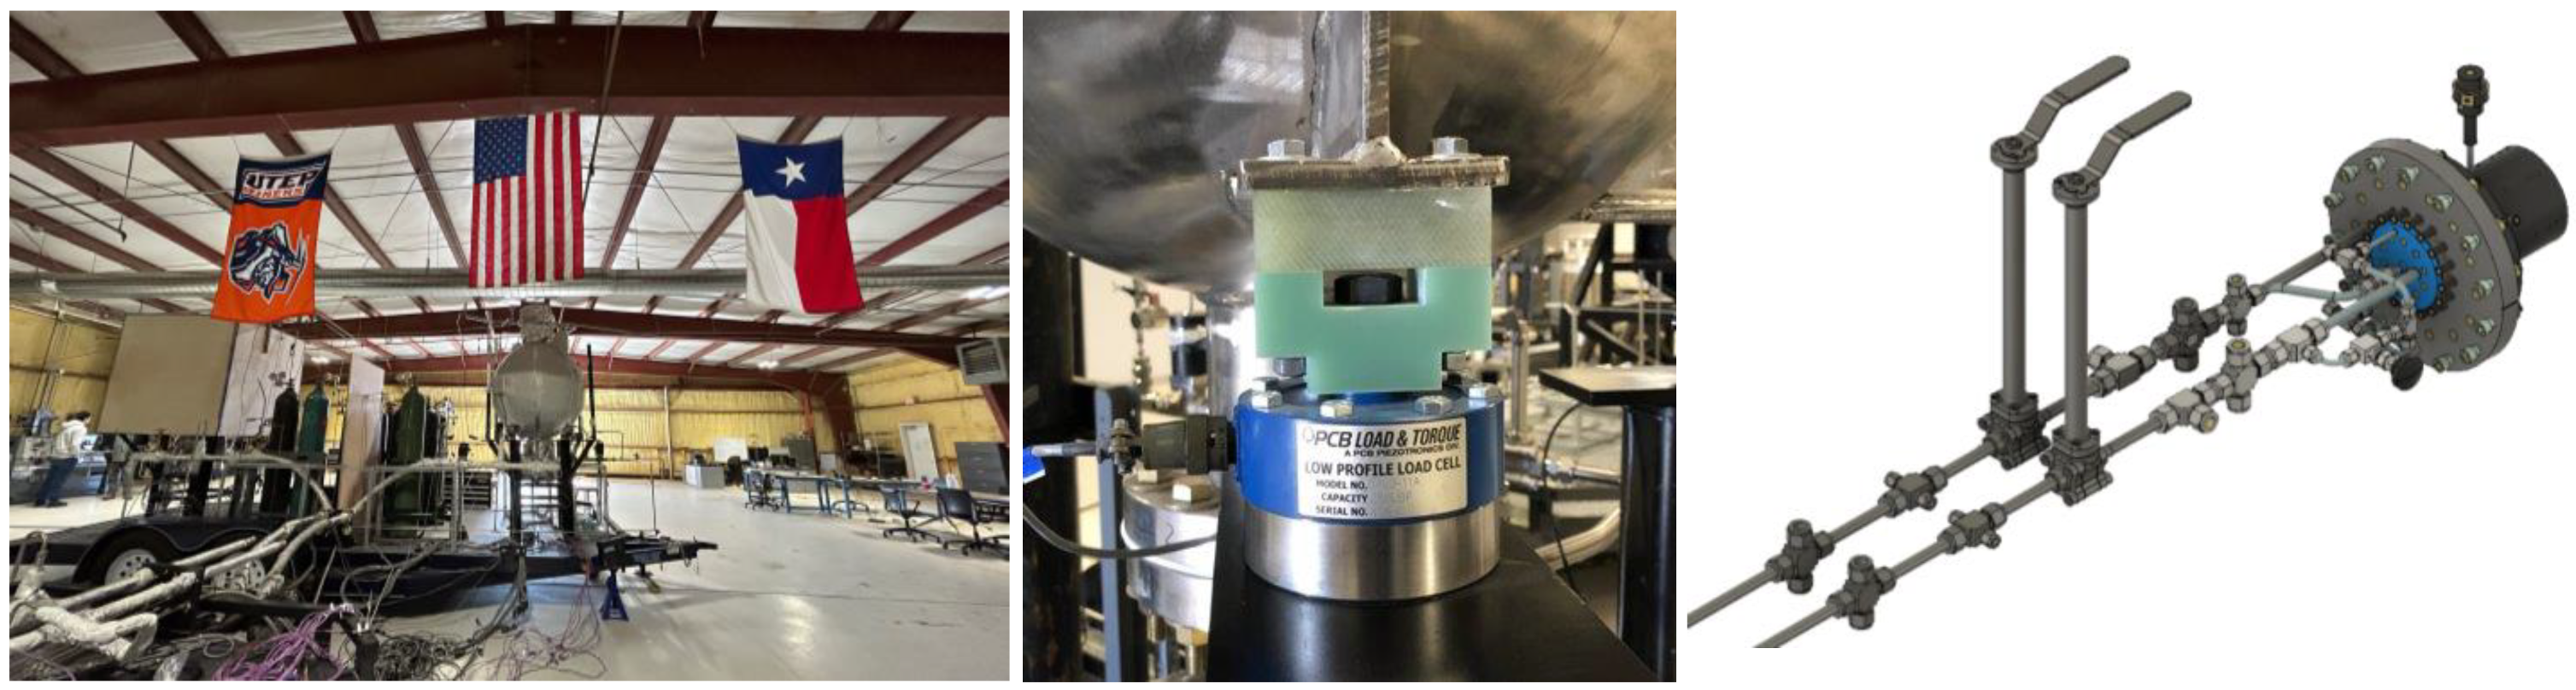
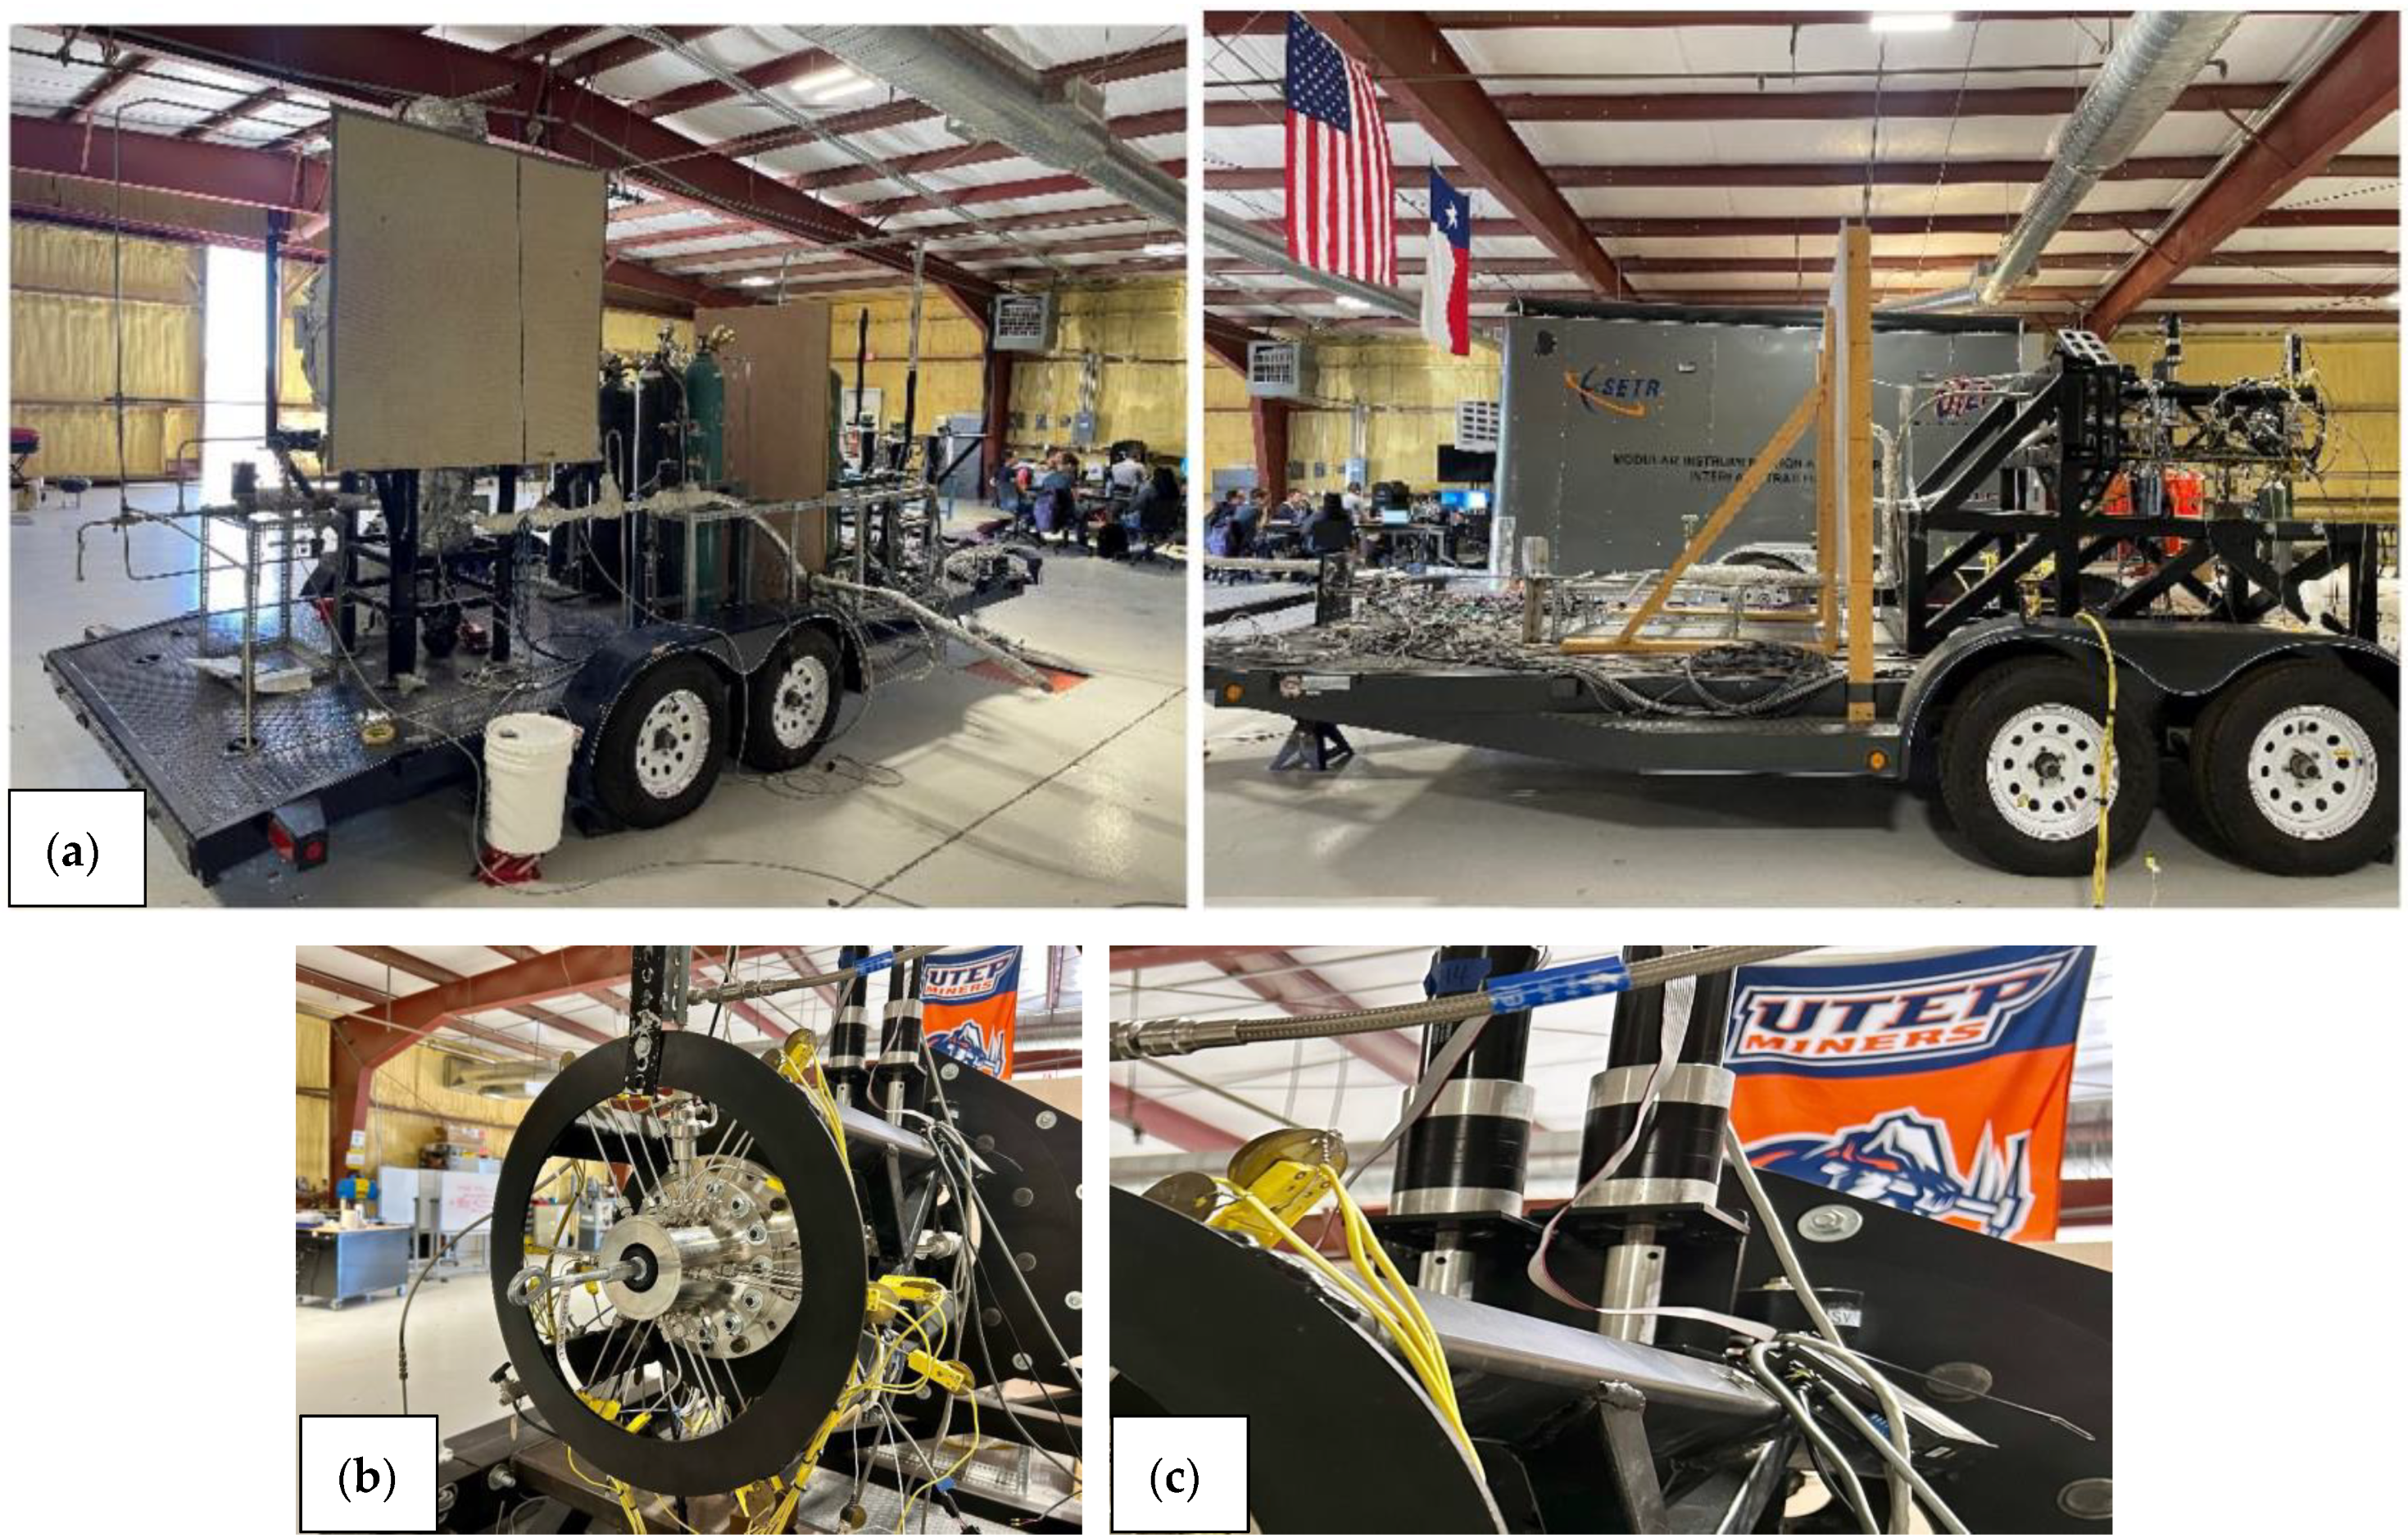
2.1. Experimental Test Setup
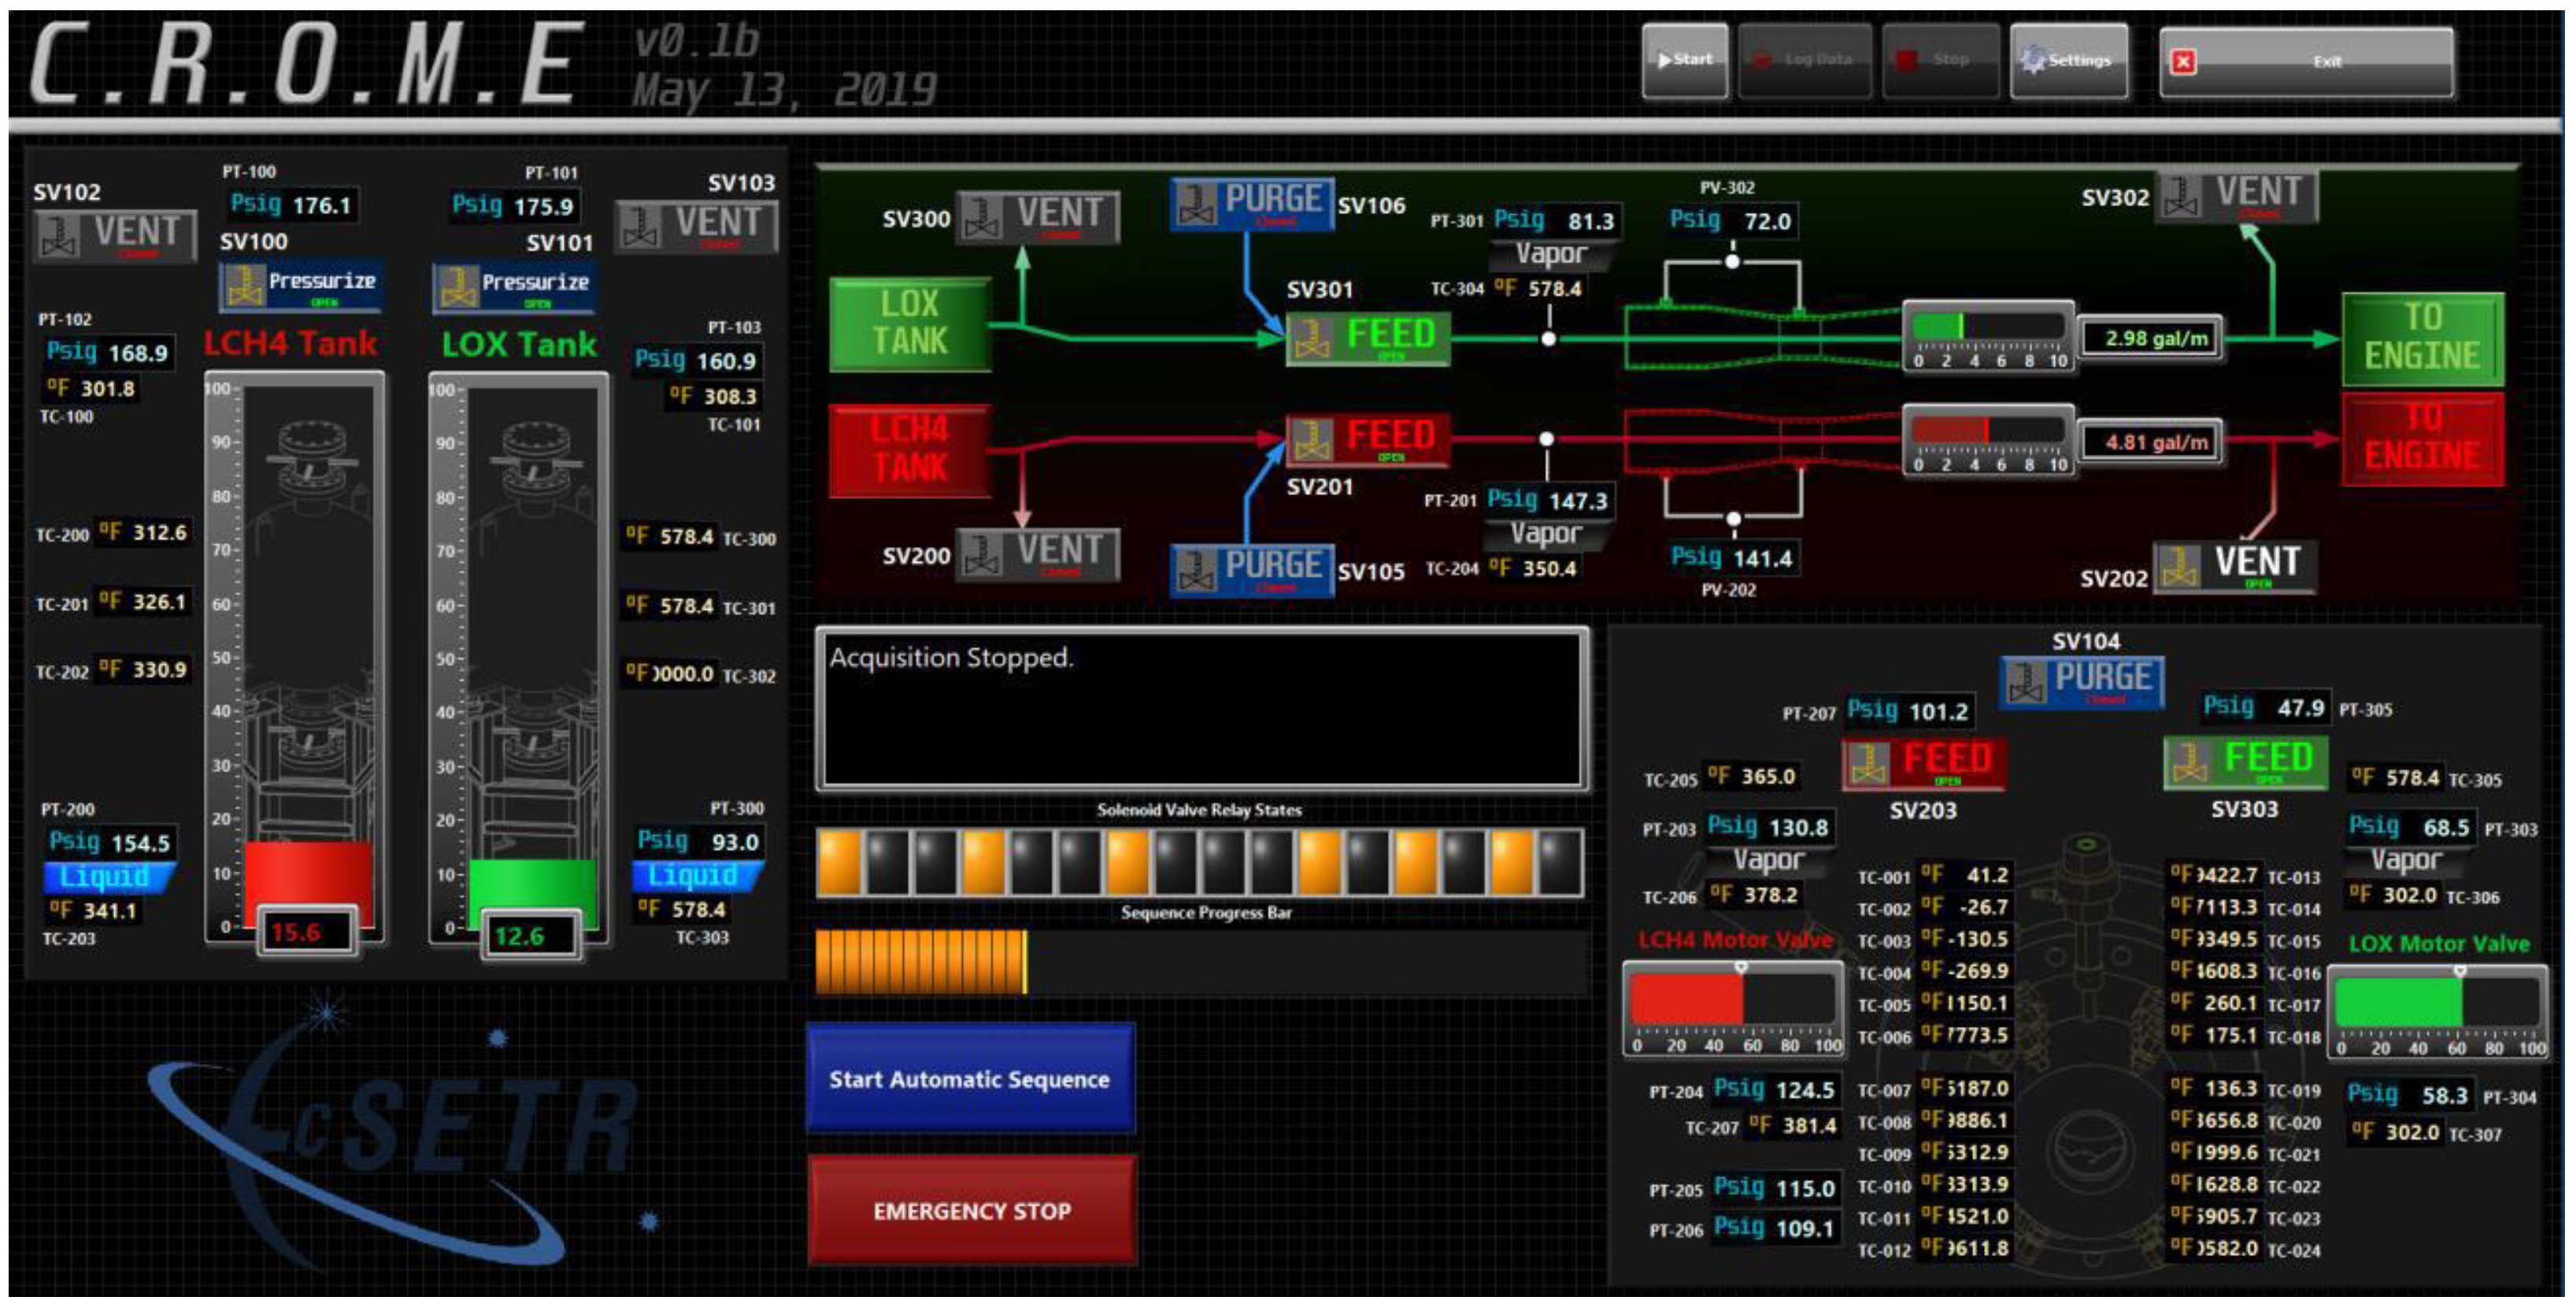
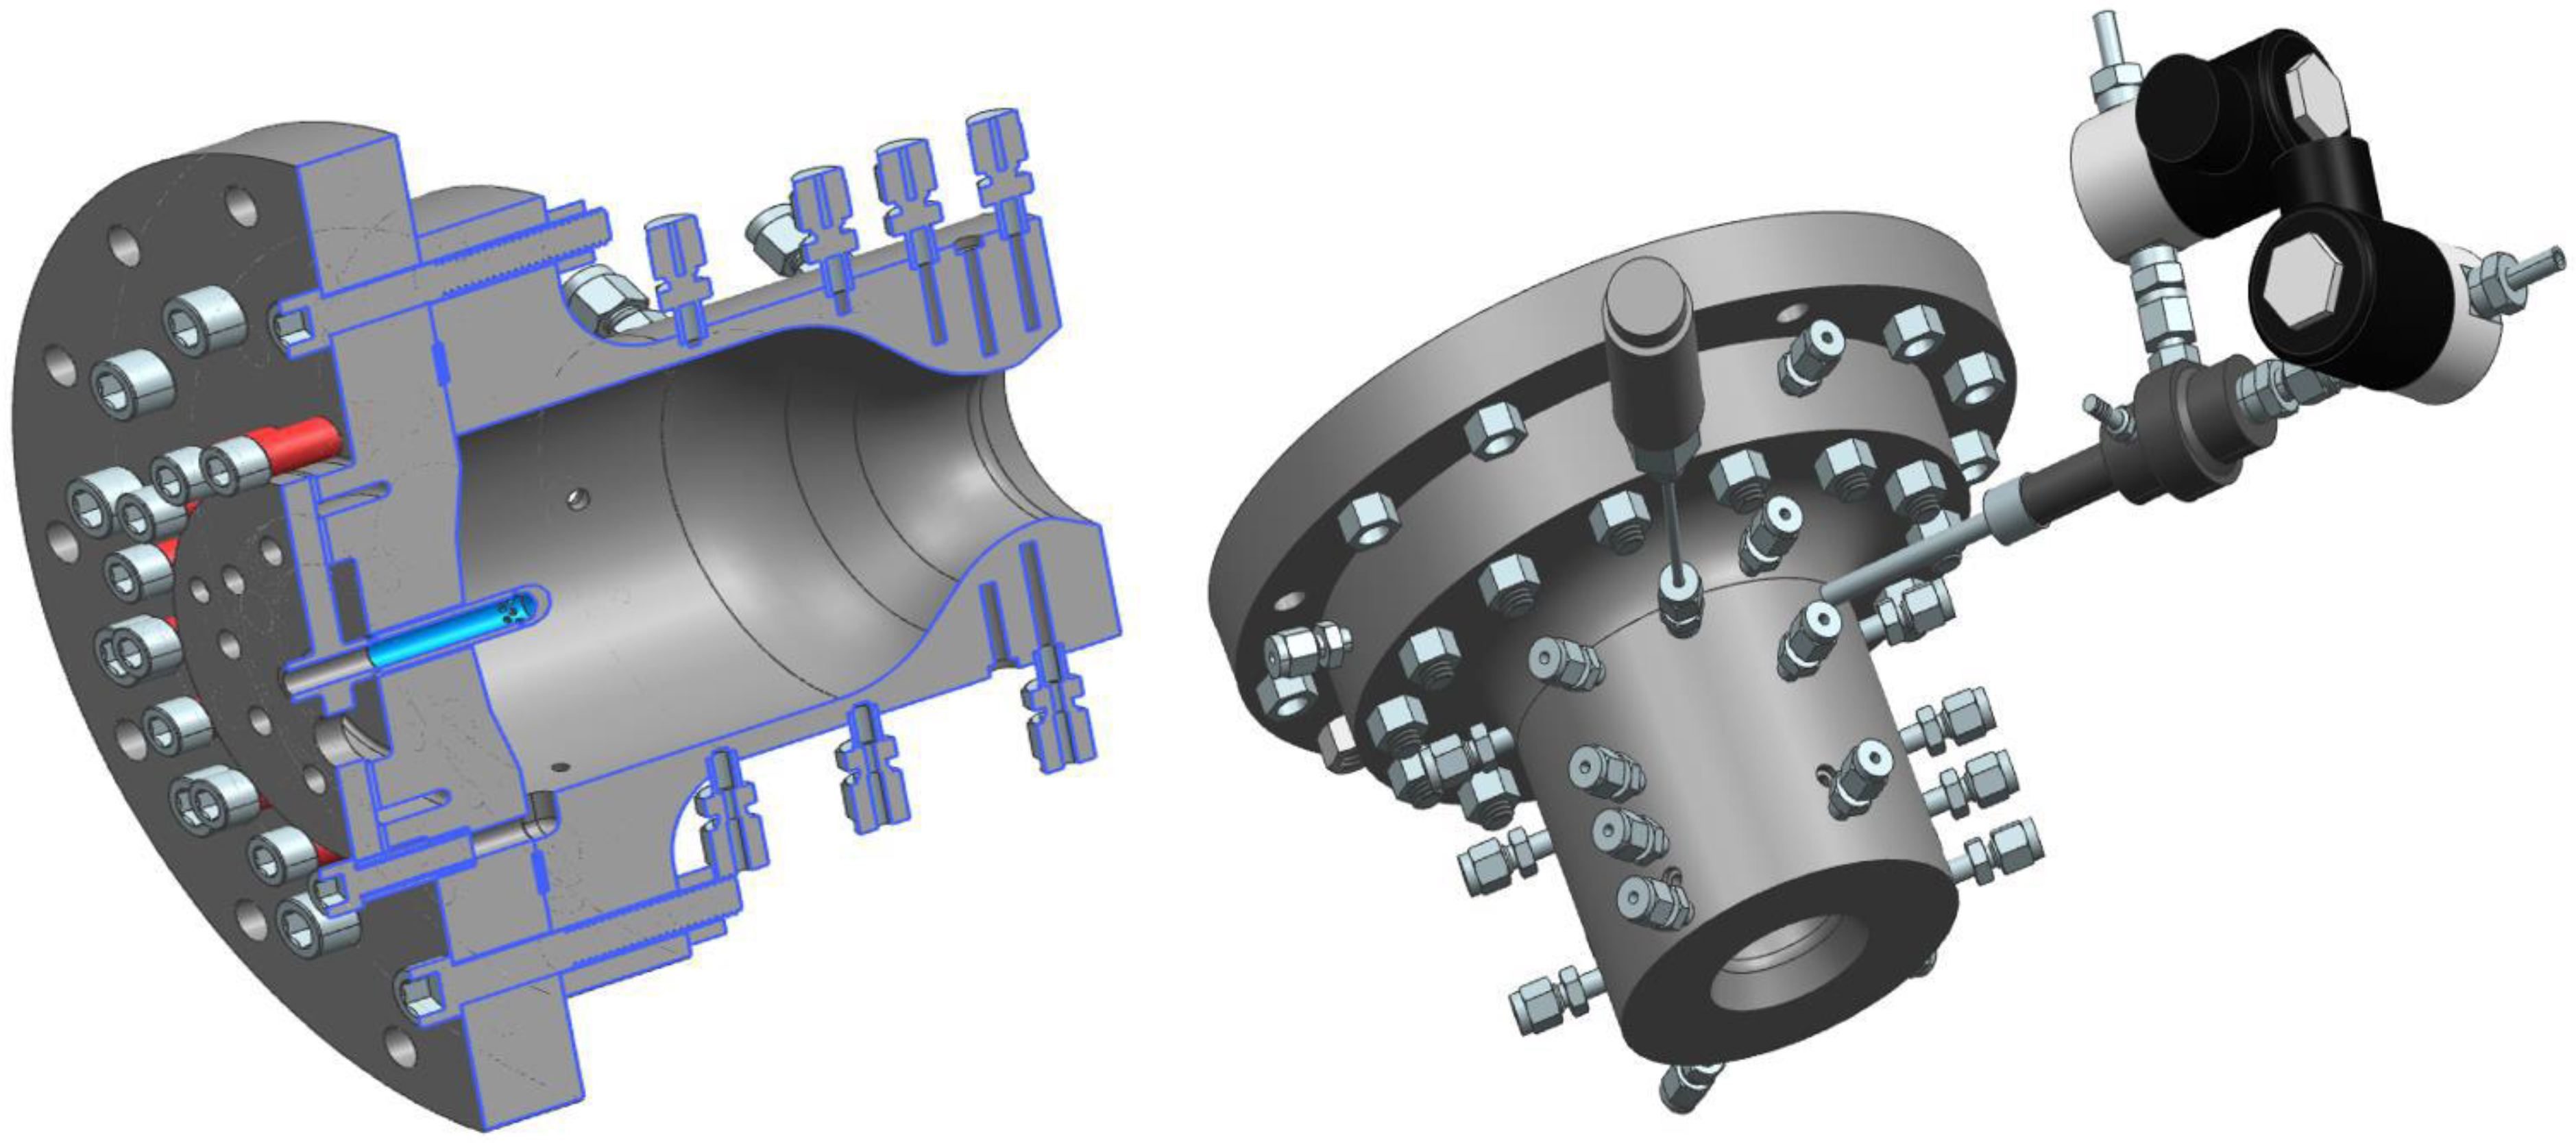
2.1.1. CROME
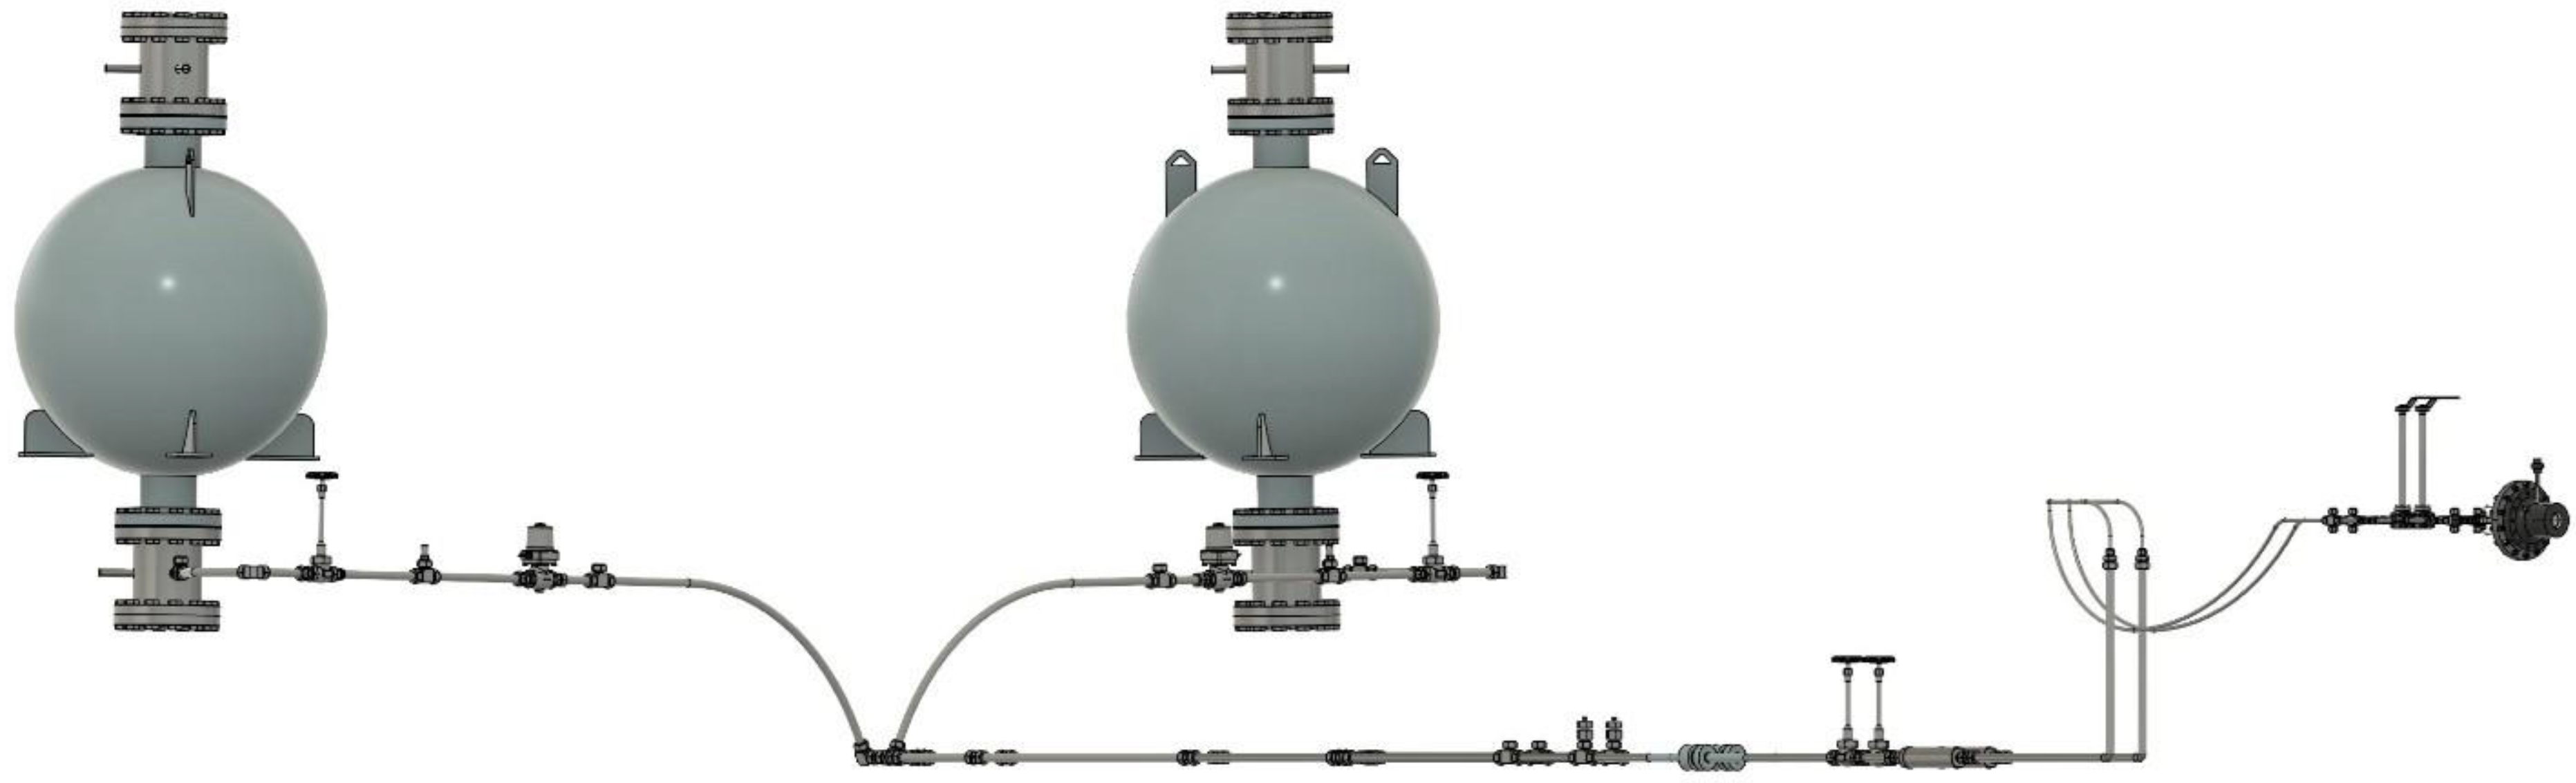
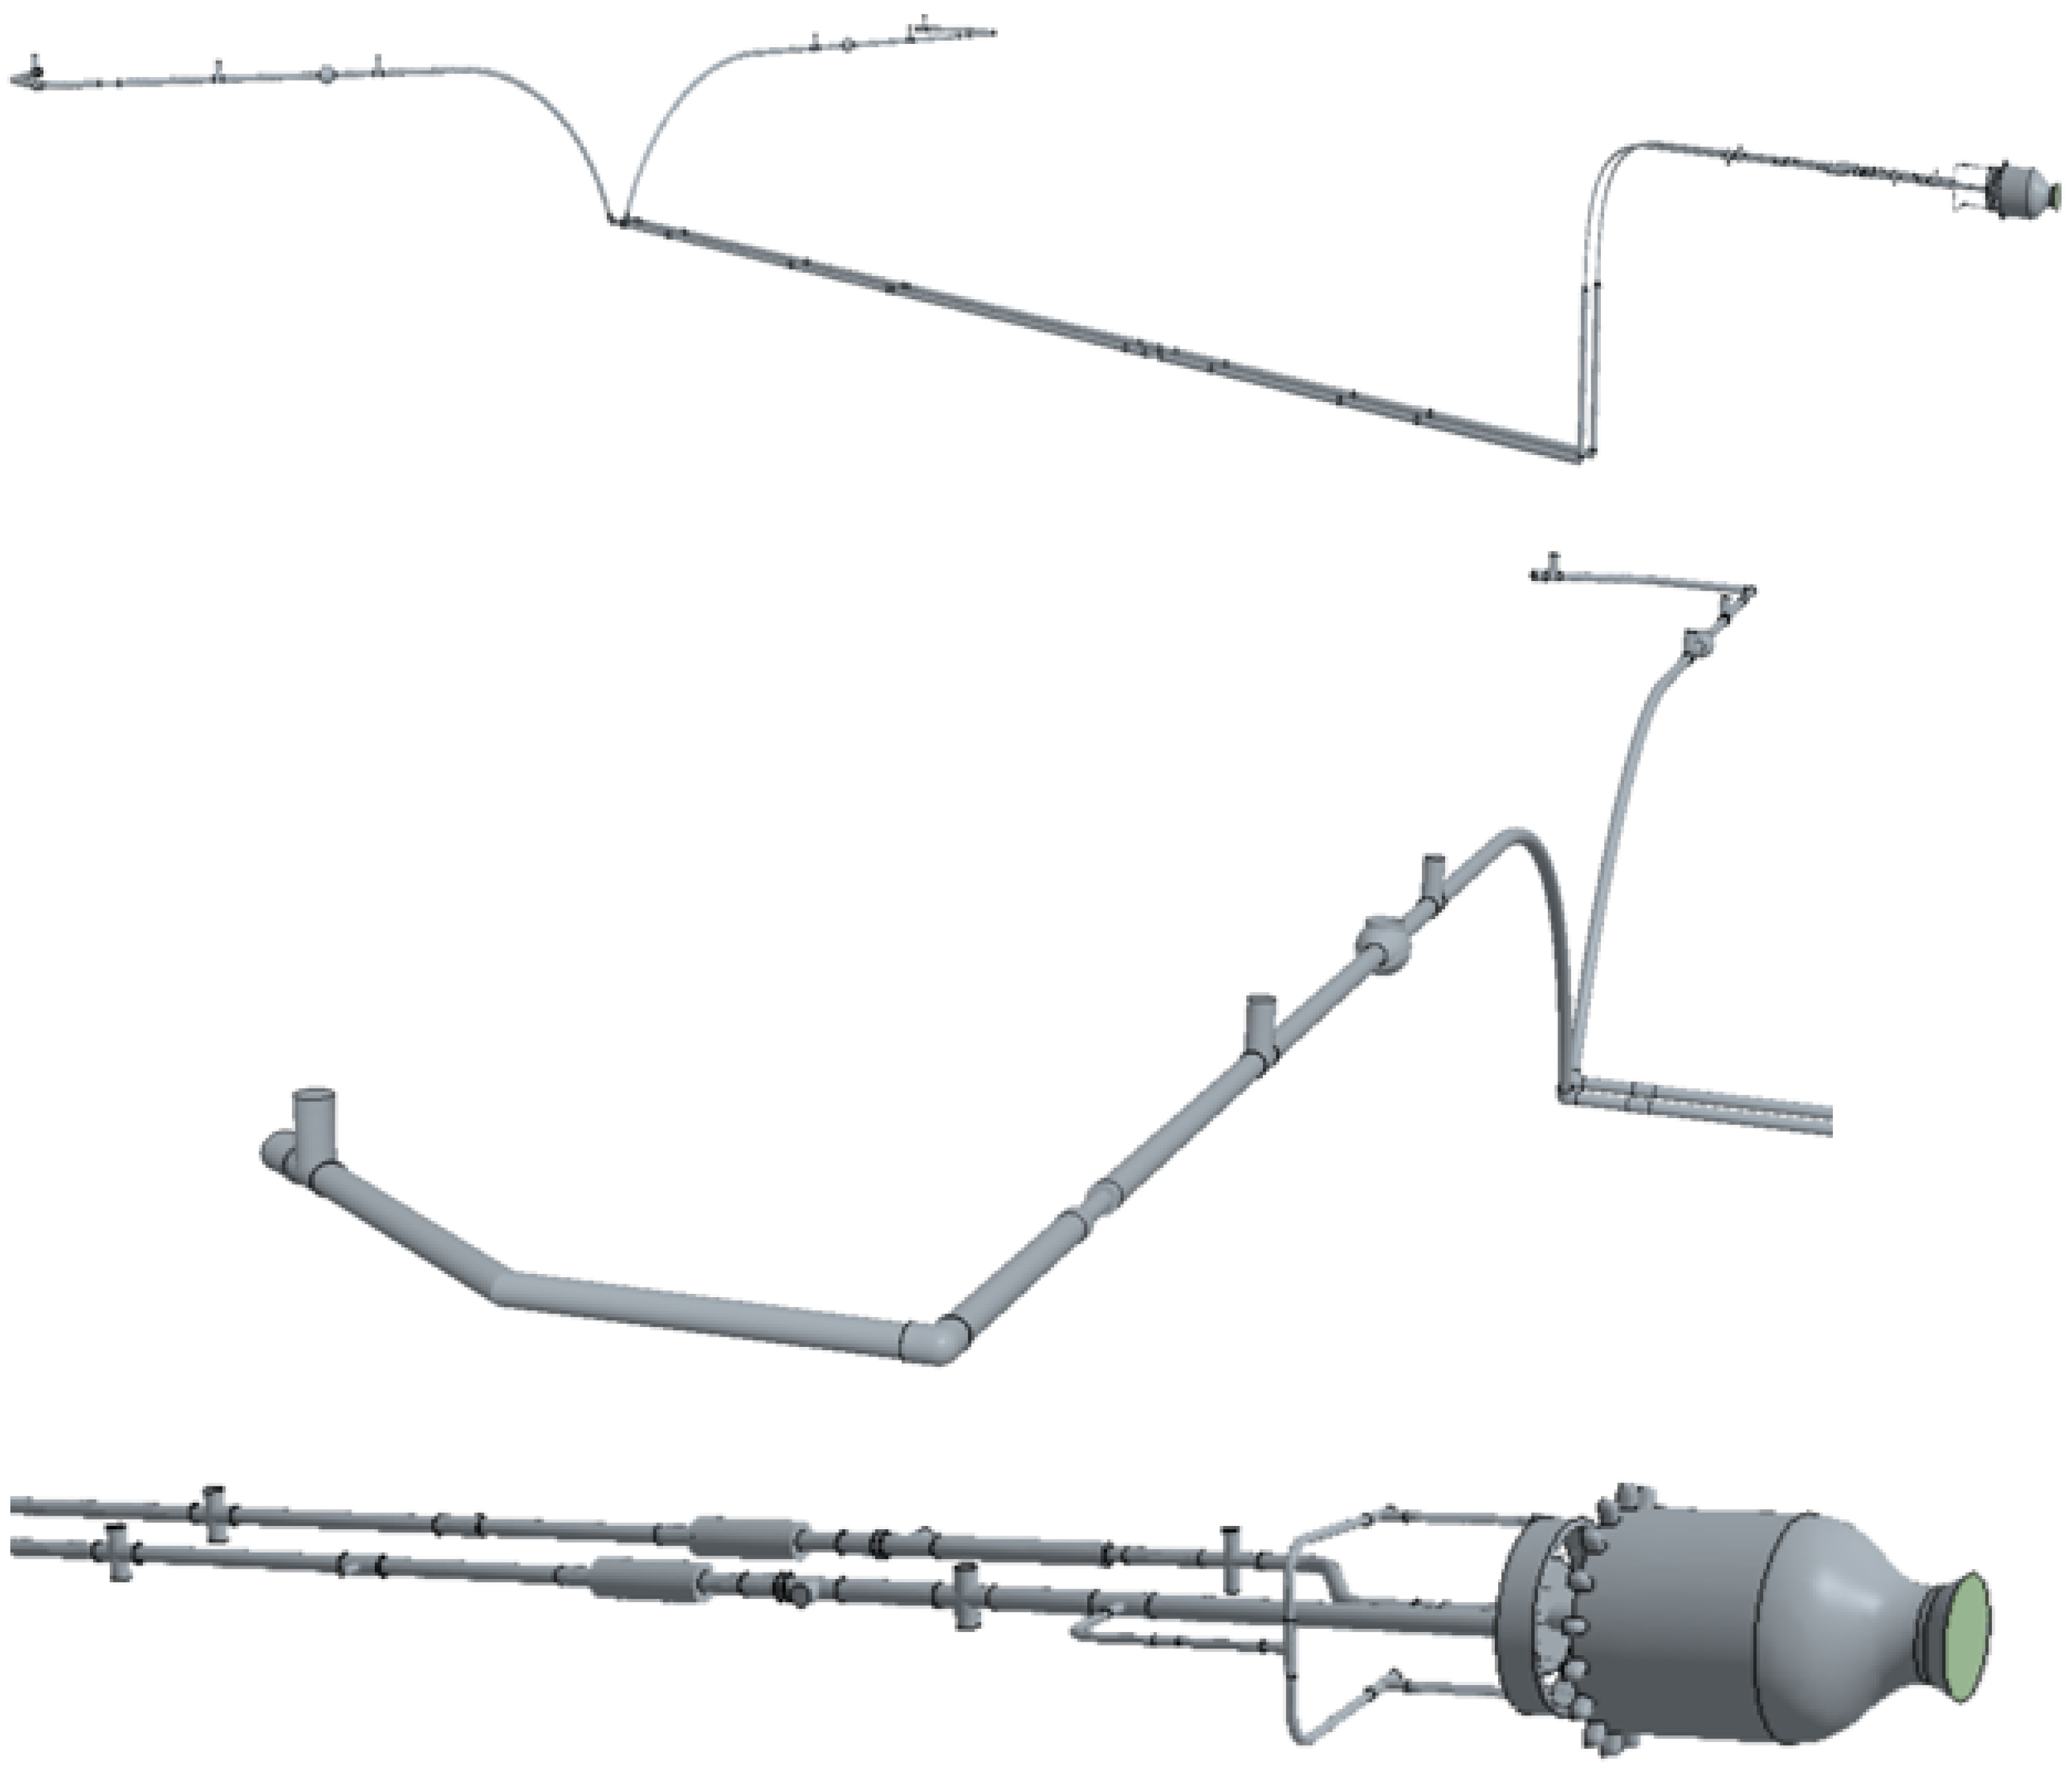
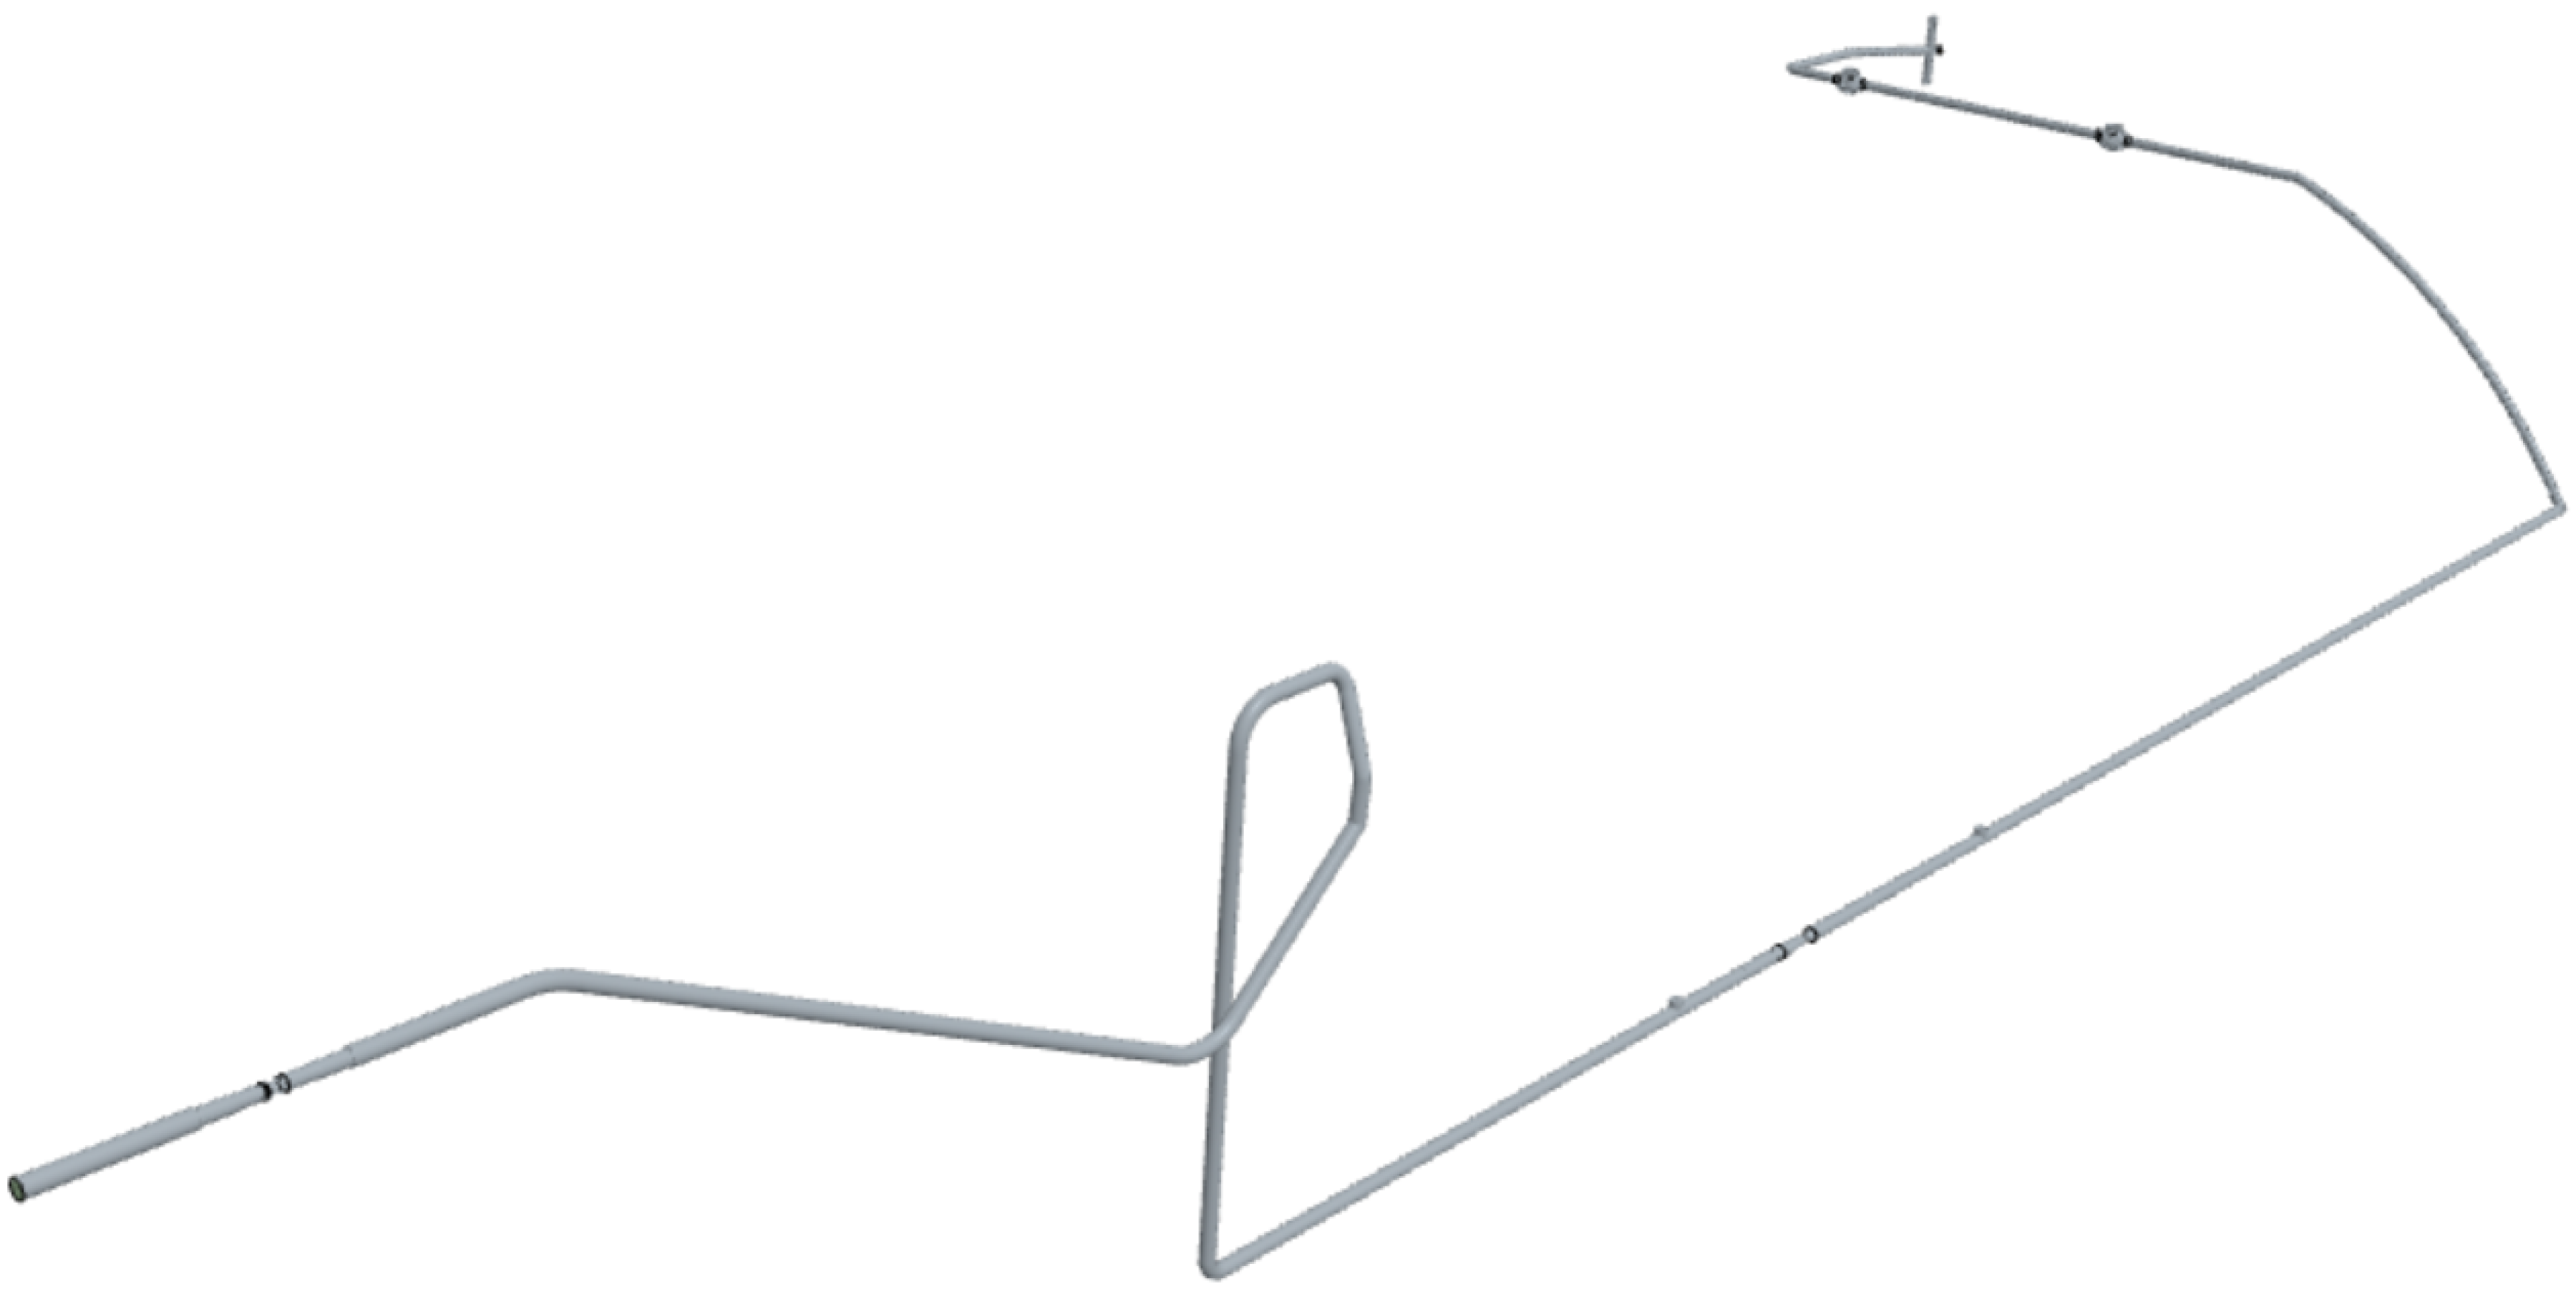
2.1.2. Feed System
2.1.3. Cold Flow Testing Strategies
2.2. Models Used to Validate the Test Conditions
2.2.1. Eulerian Single-Phase (ESP) Model for the First Case (Ptank = 33 psi and = 0.9 )
2.2.2. Volume of Fluid (VOF) Model for the Second Test Condition (Ptank = 100 psi and = 0.9 )
3. Results and Discussion
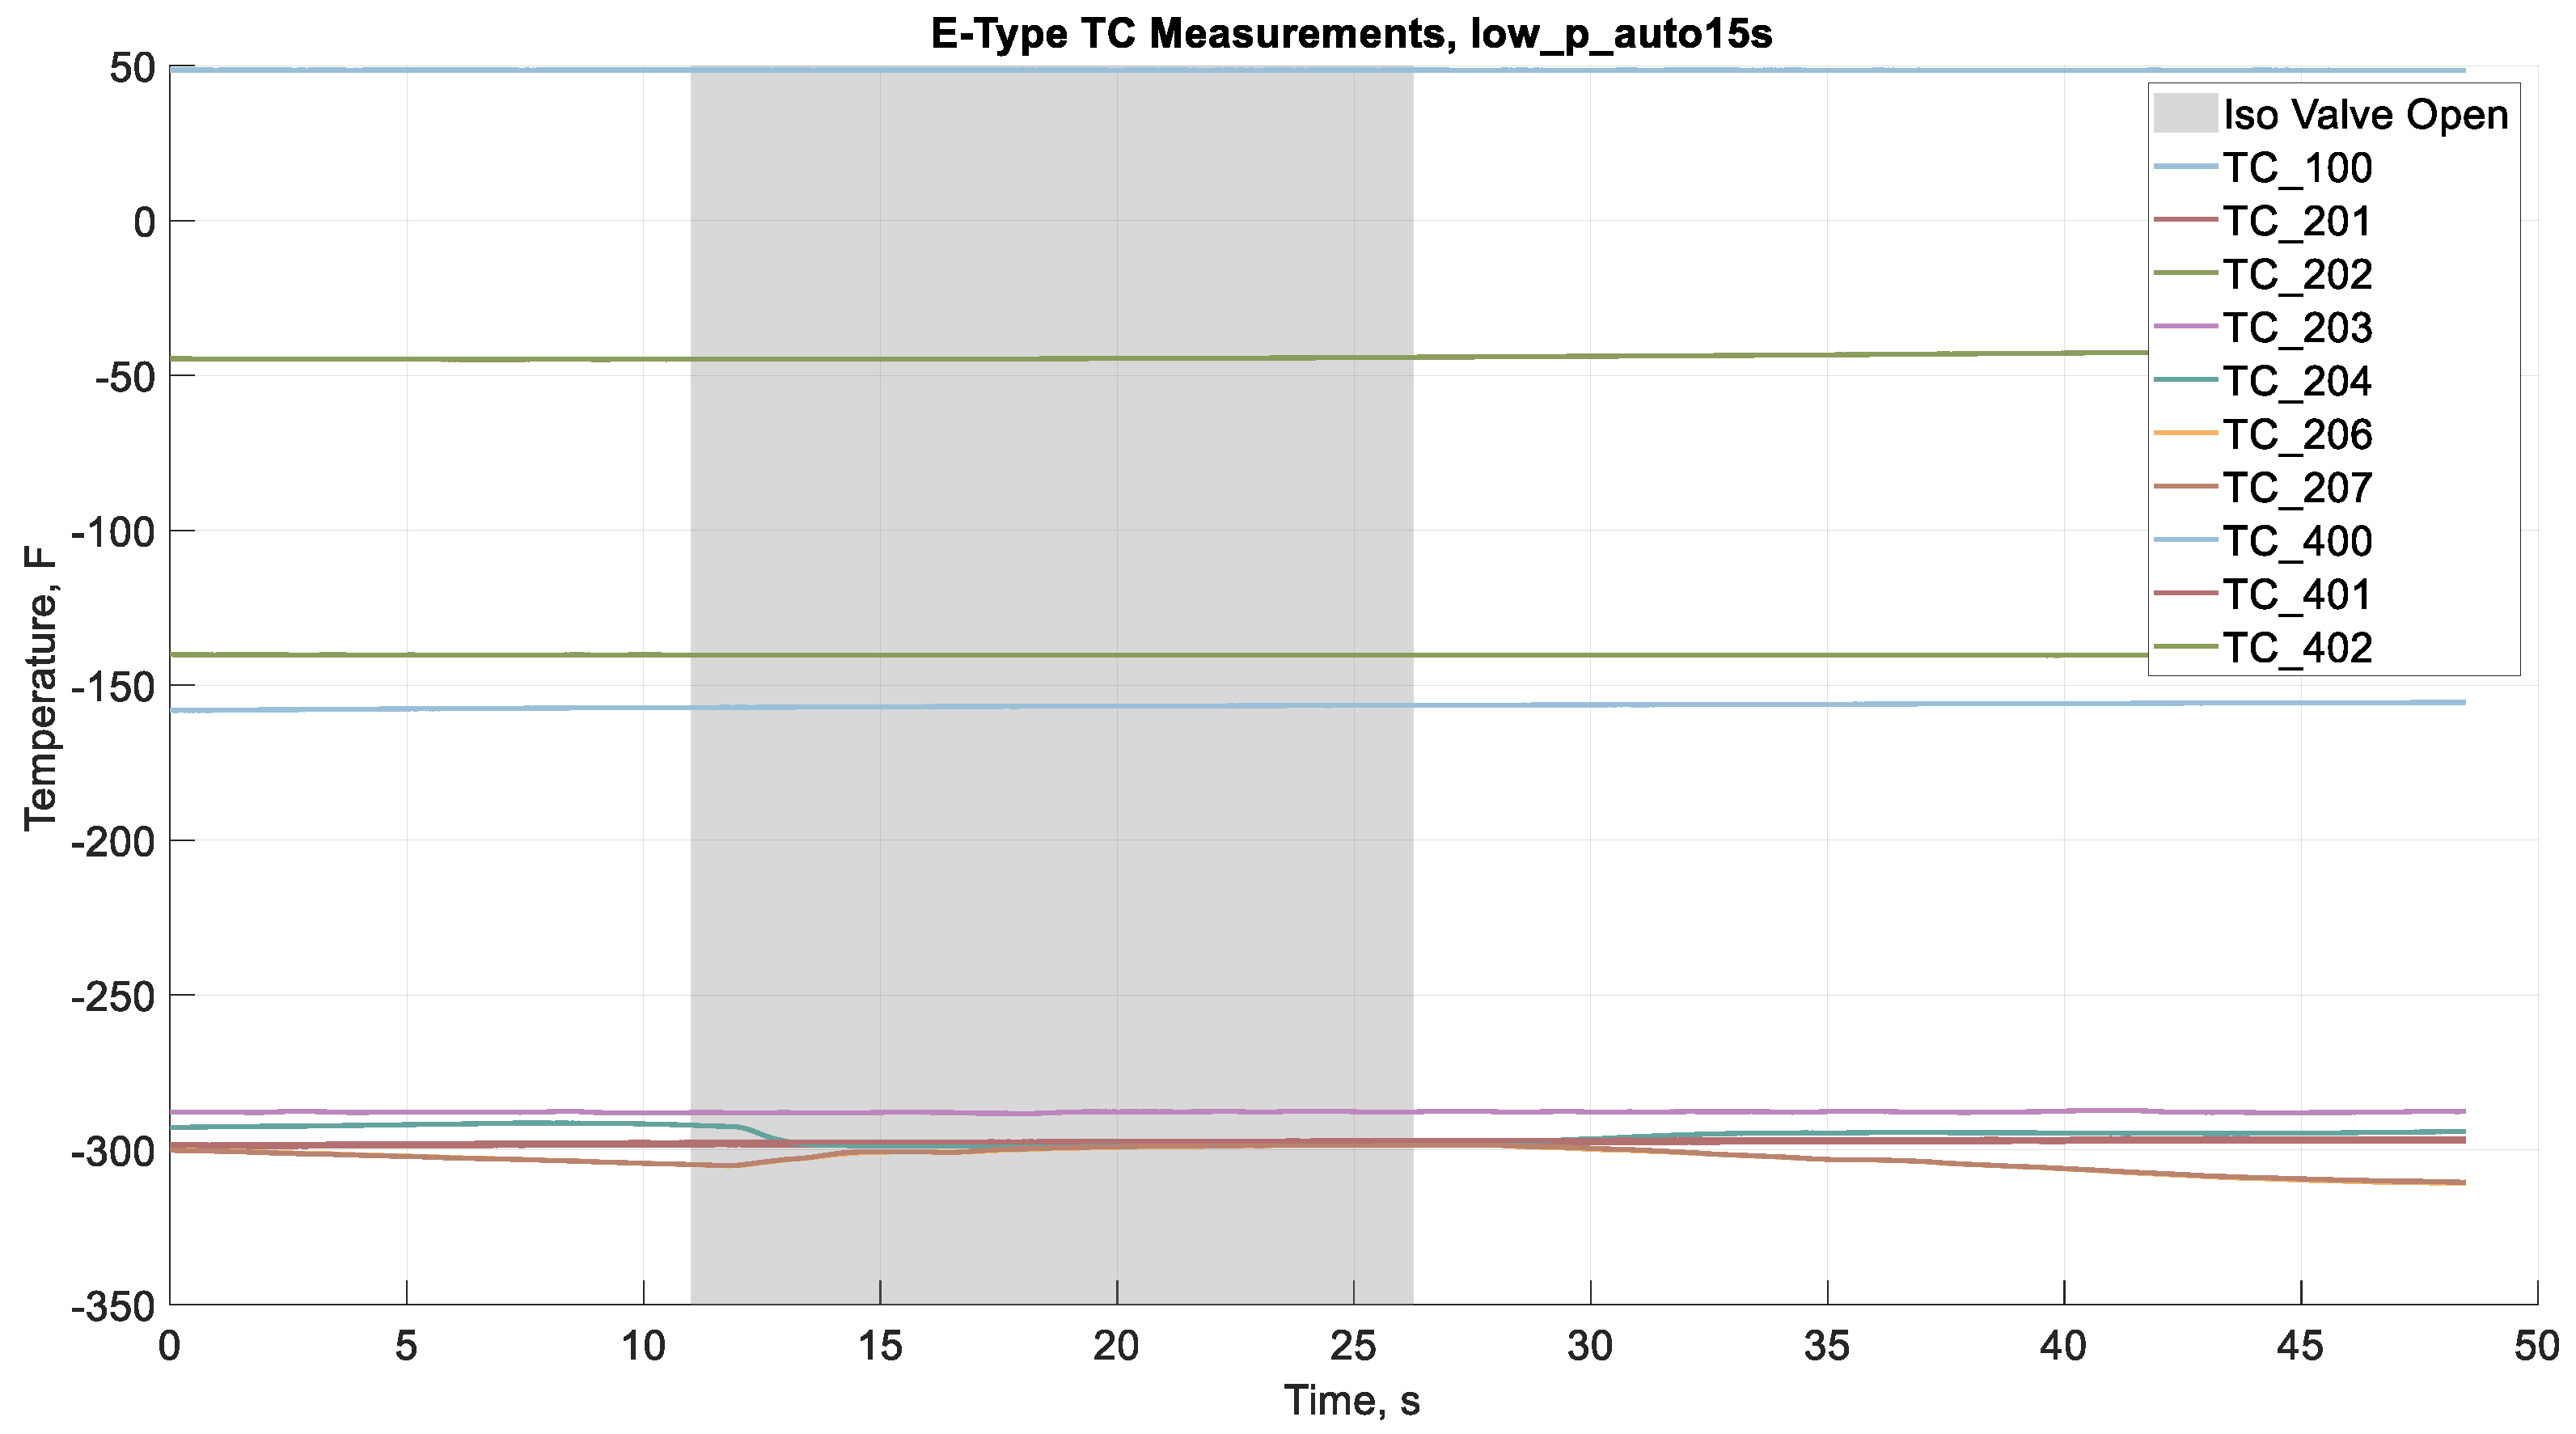
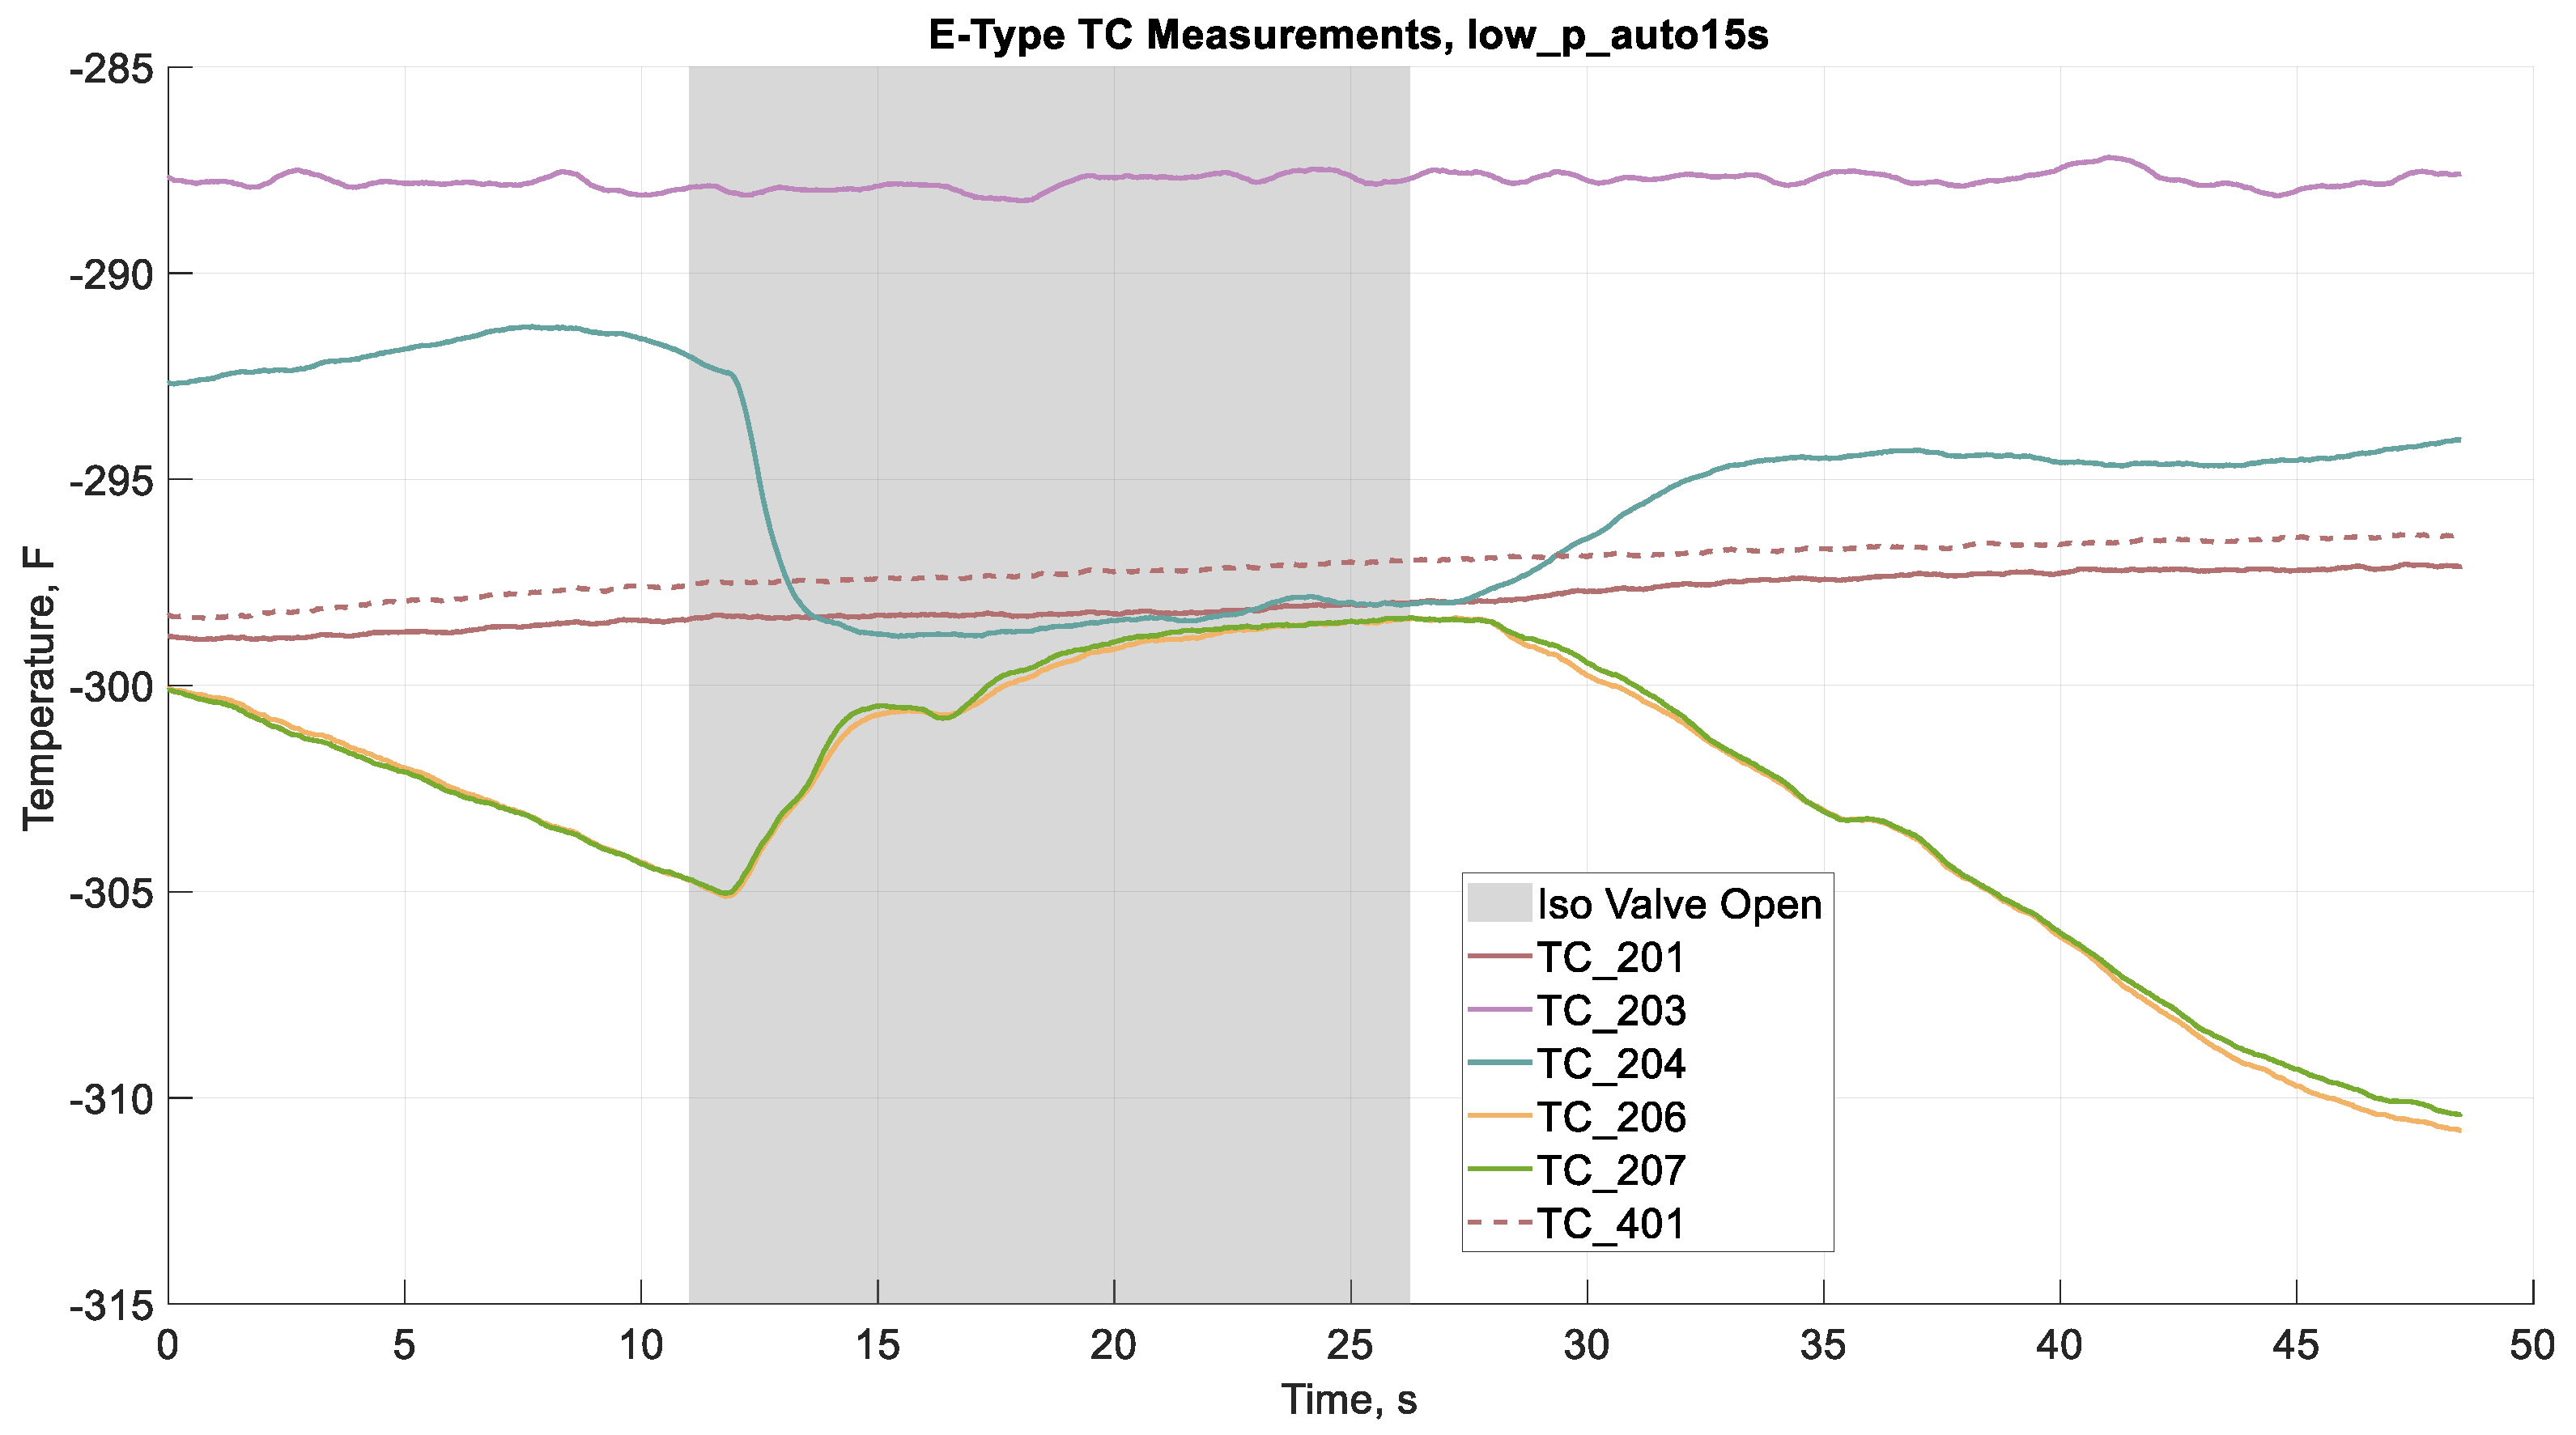
3.1. Experimental Observation
3.2. Performance Validation of CROME Feed System
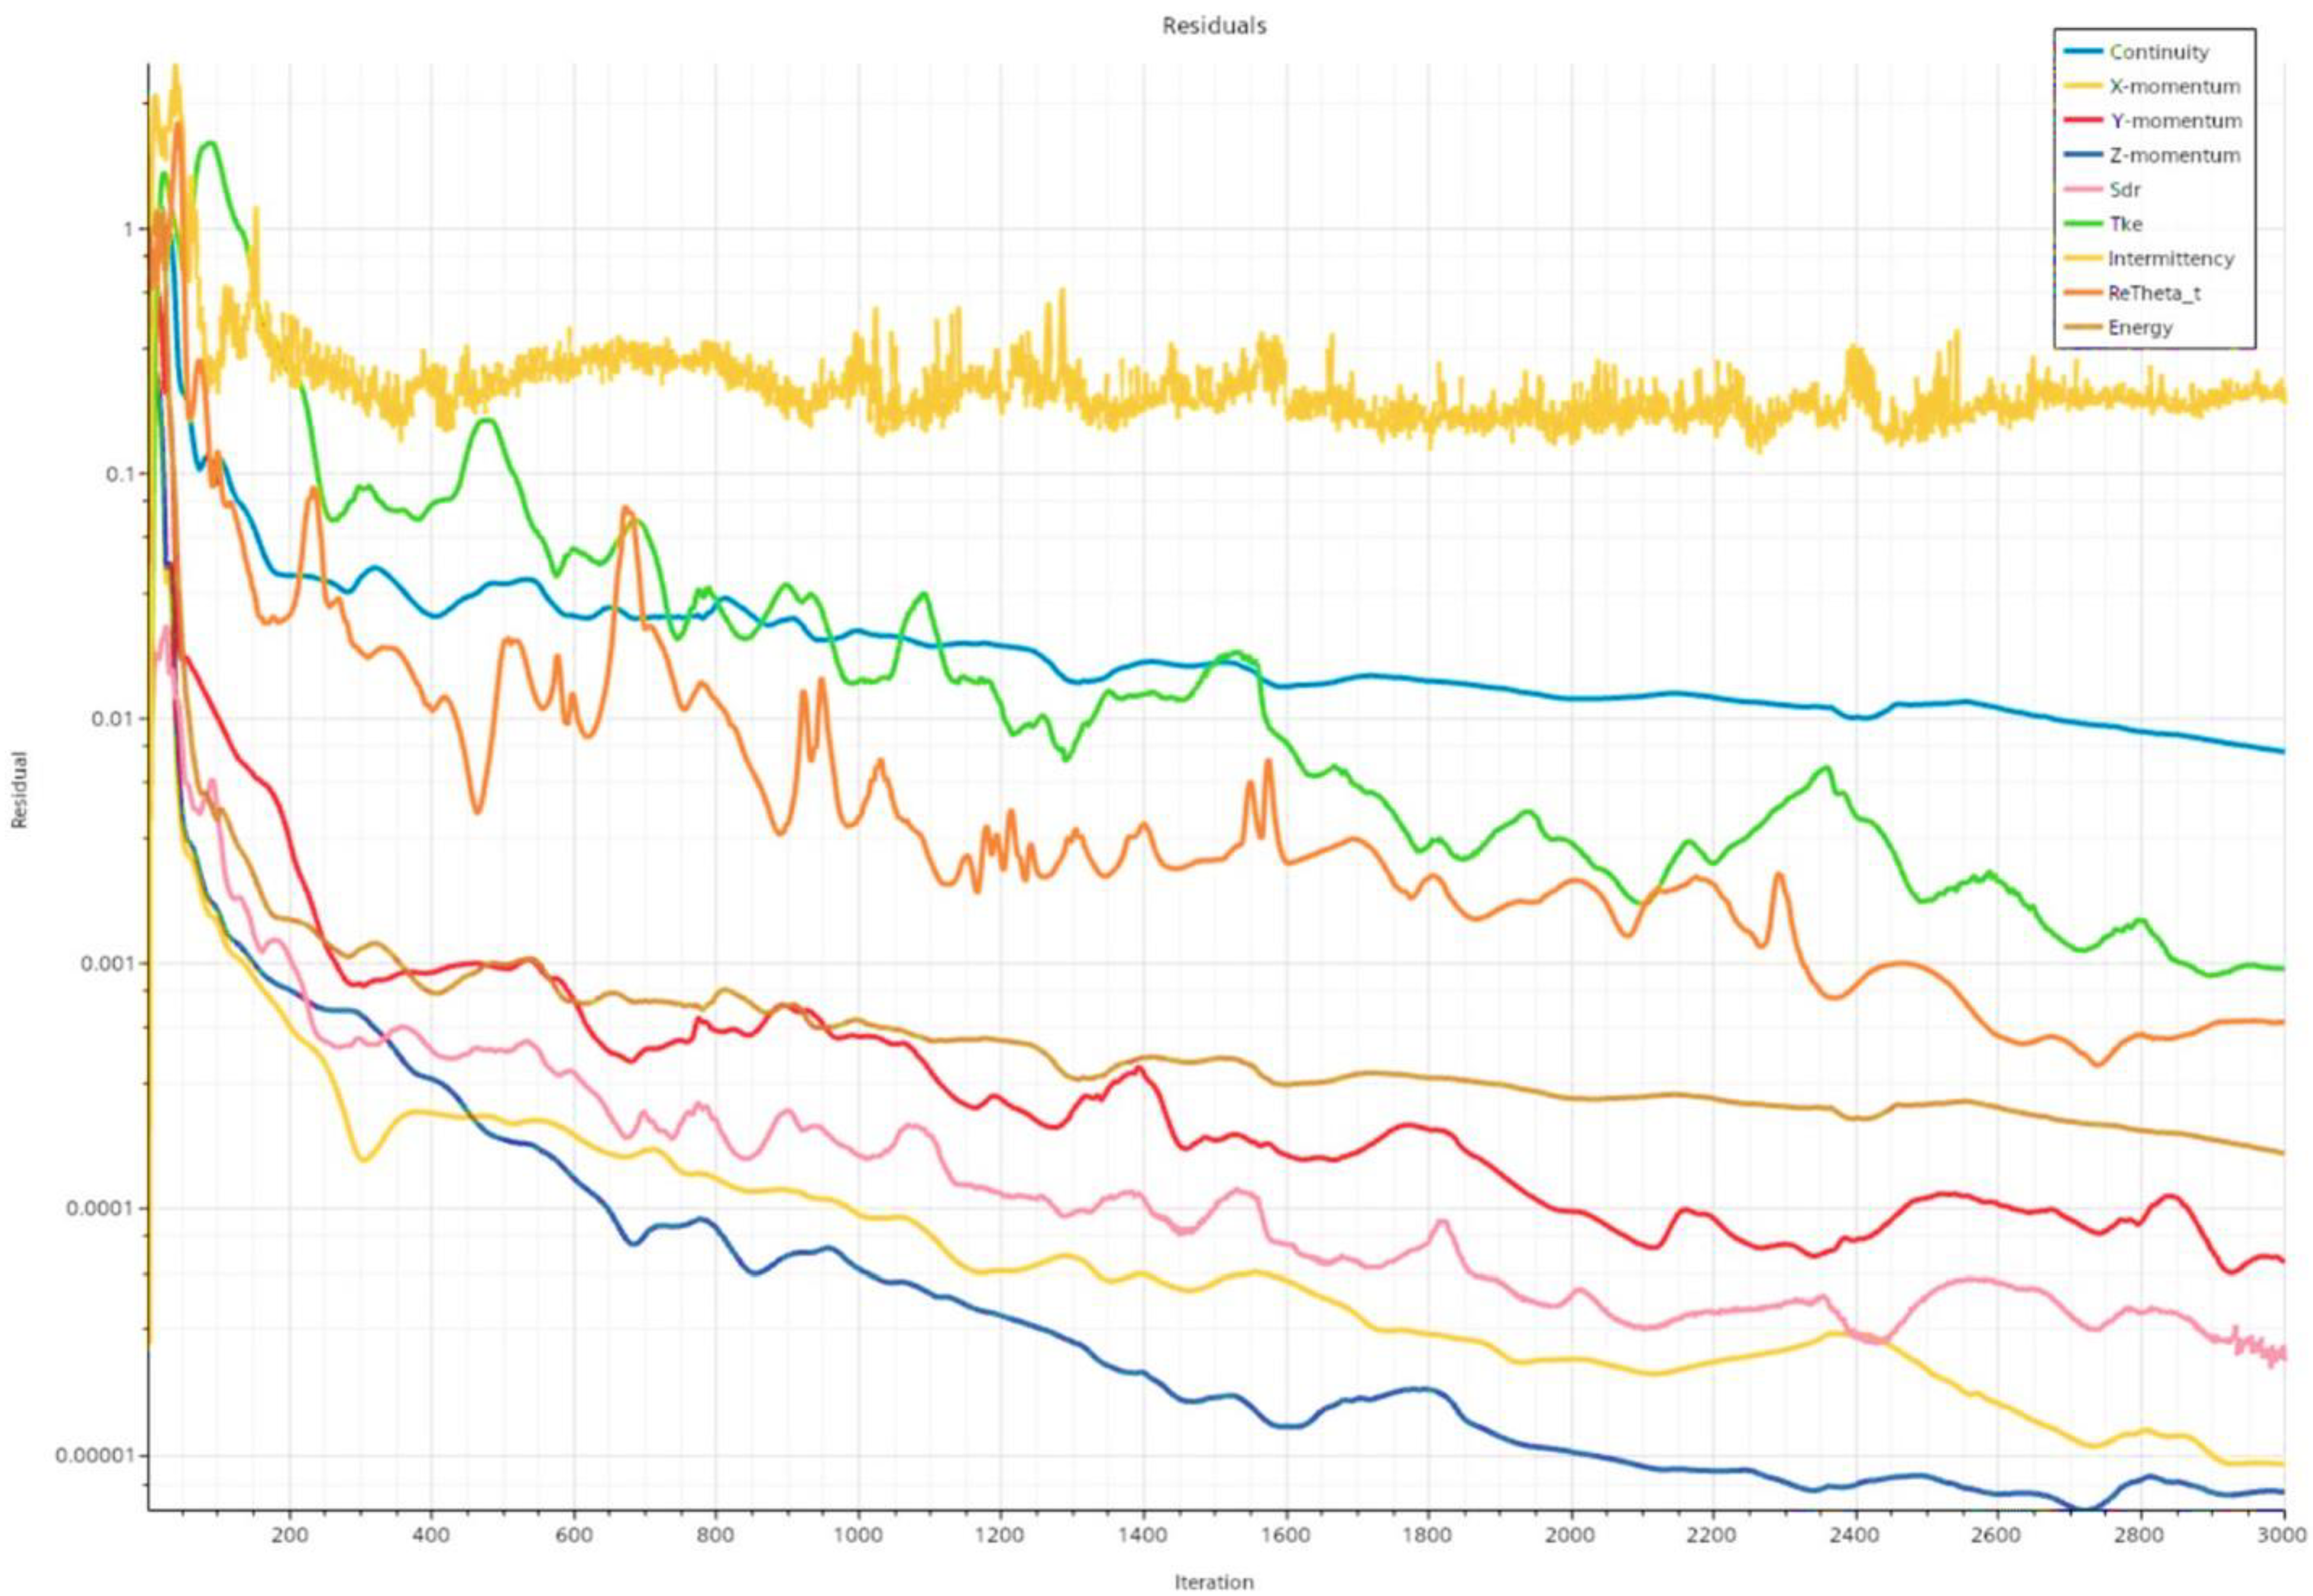
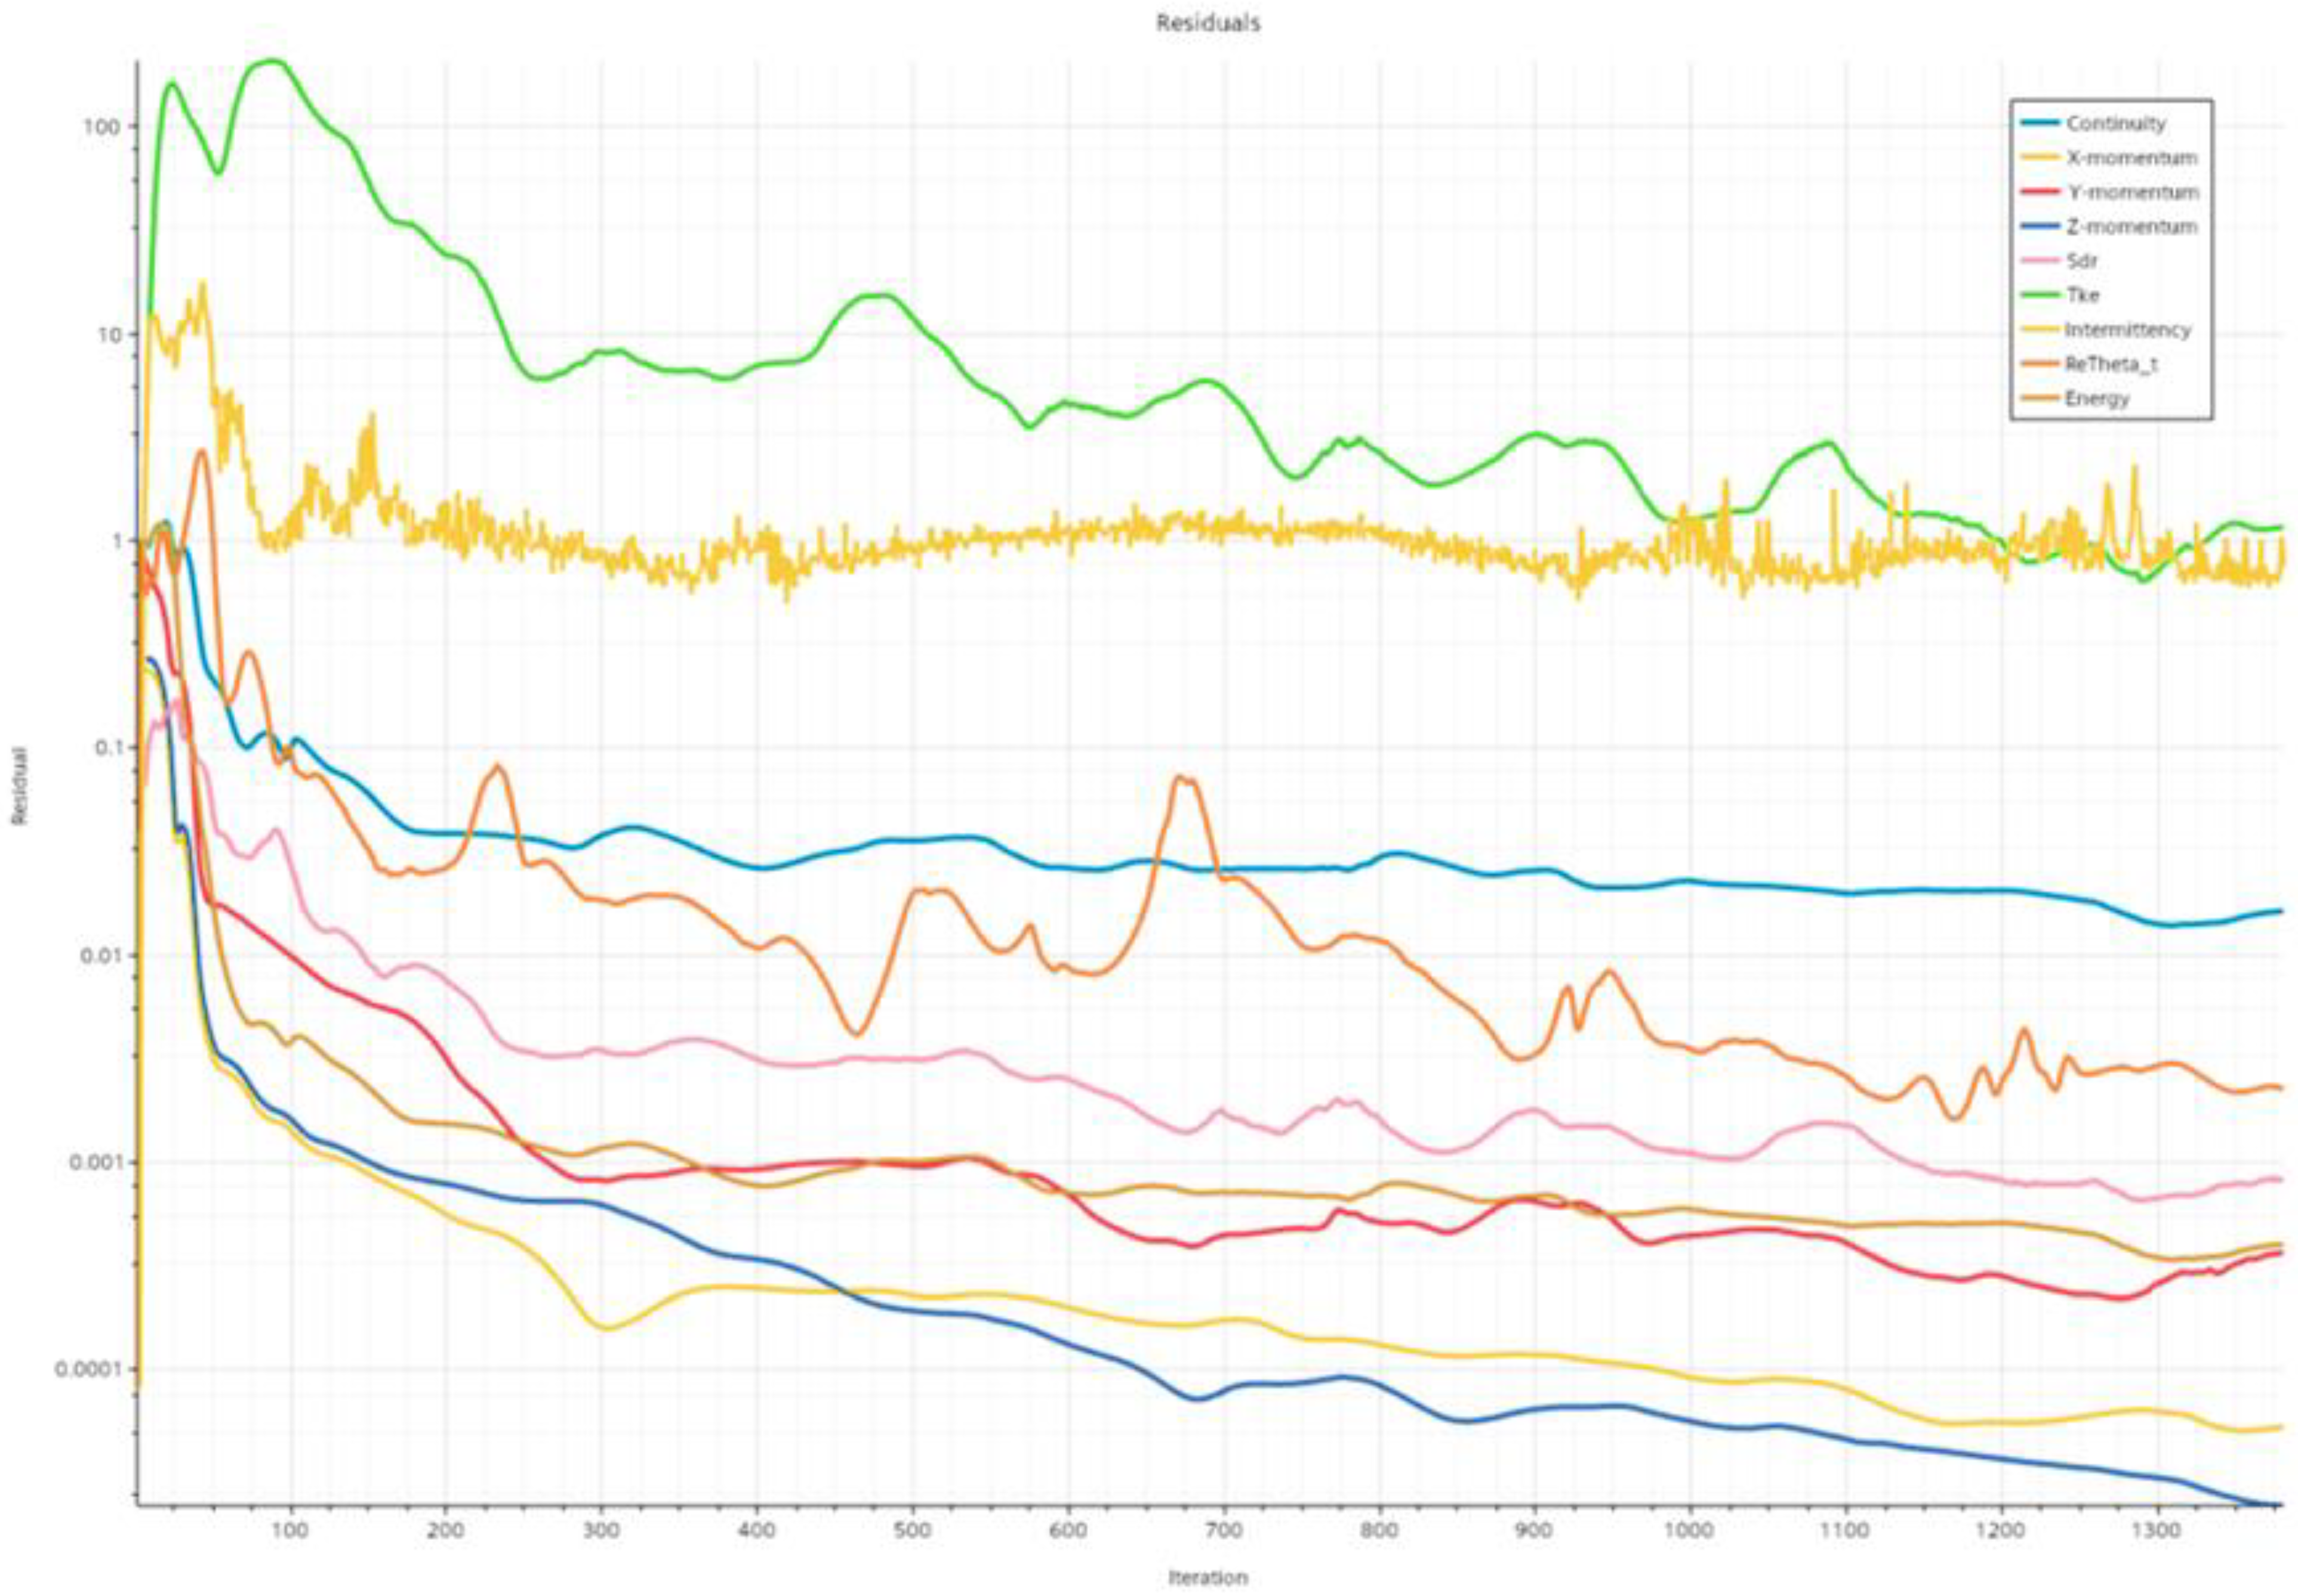
3.2.1. General Convergence Criteria for ESP and VOF Models
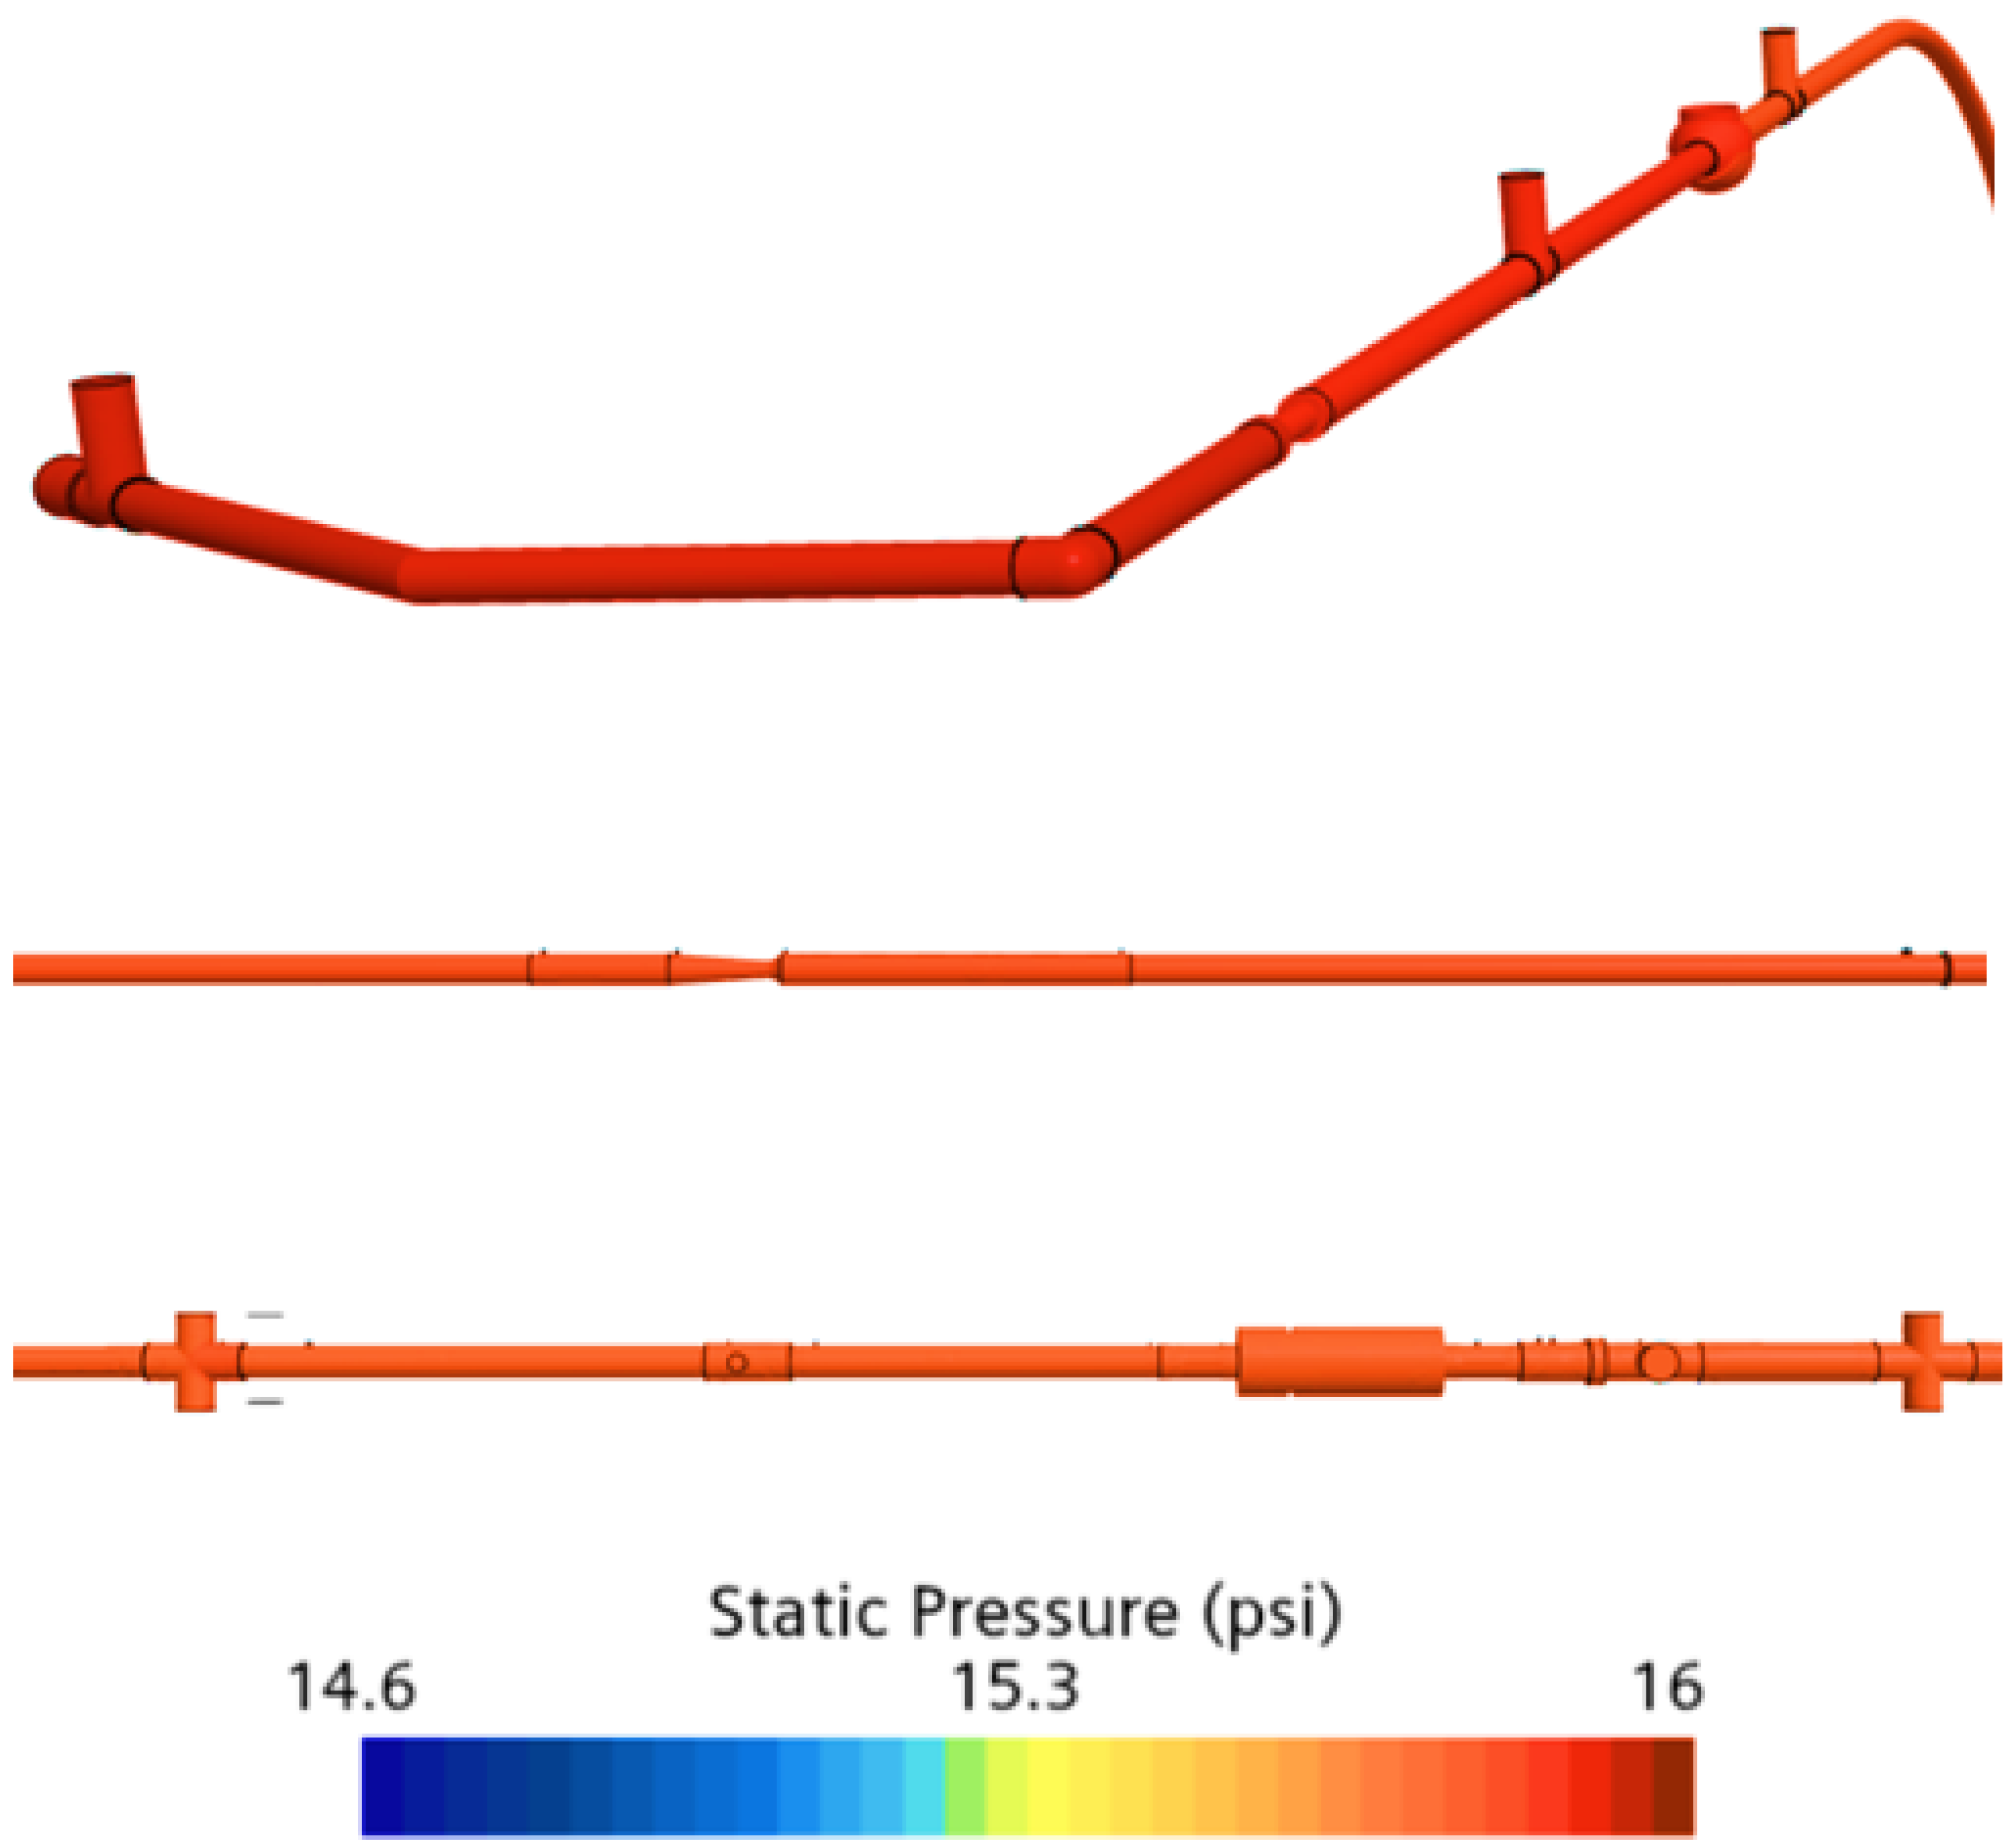
3.2.2. Feed System Behavior Using ESP for the First Case
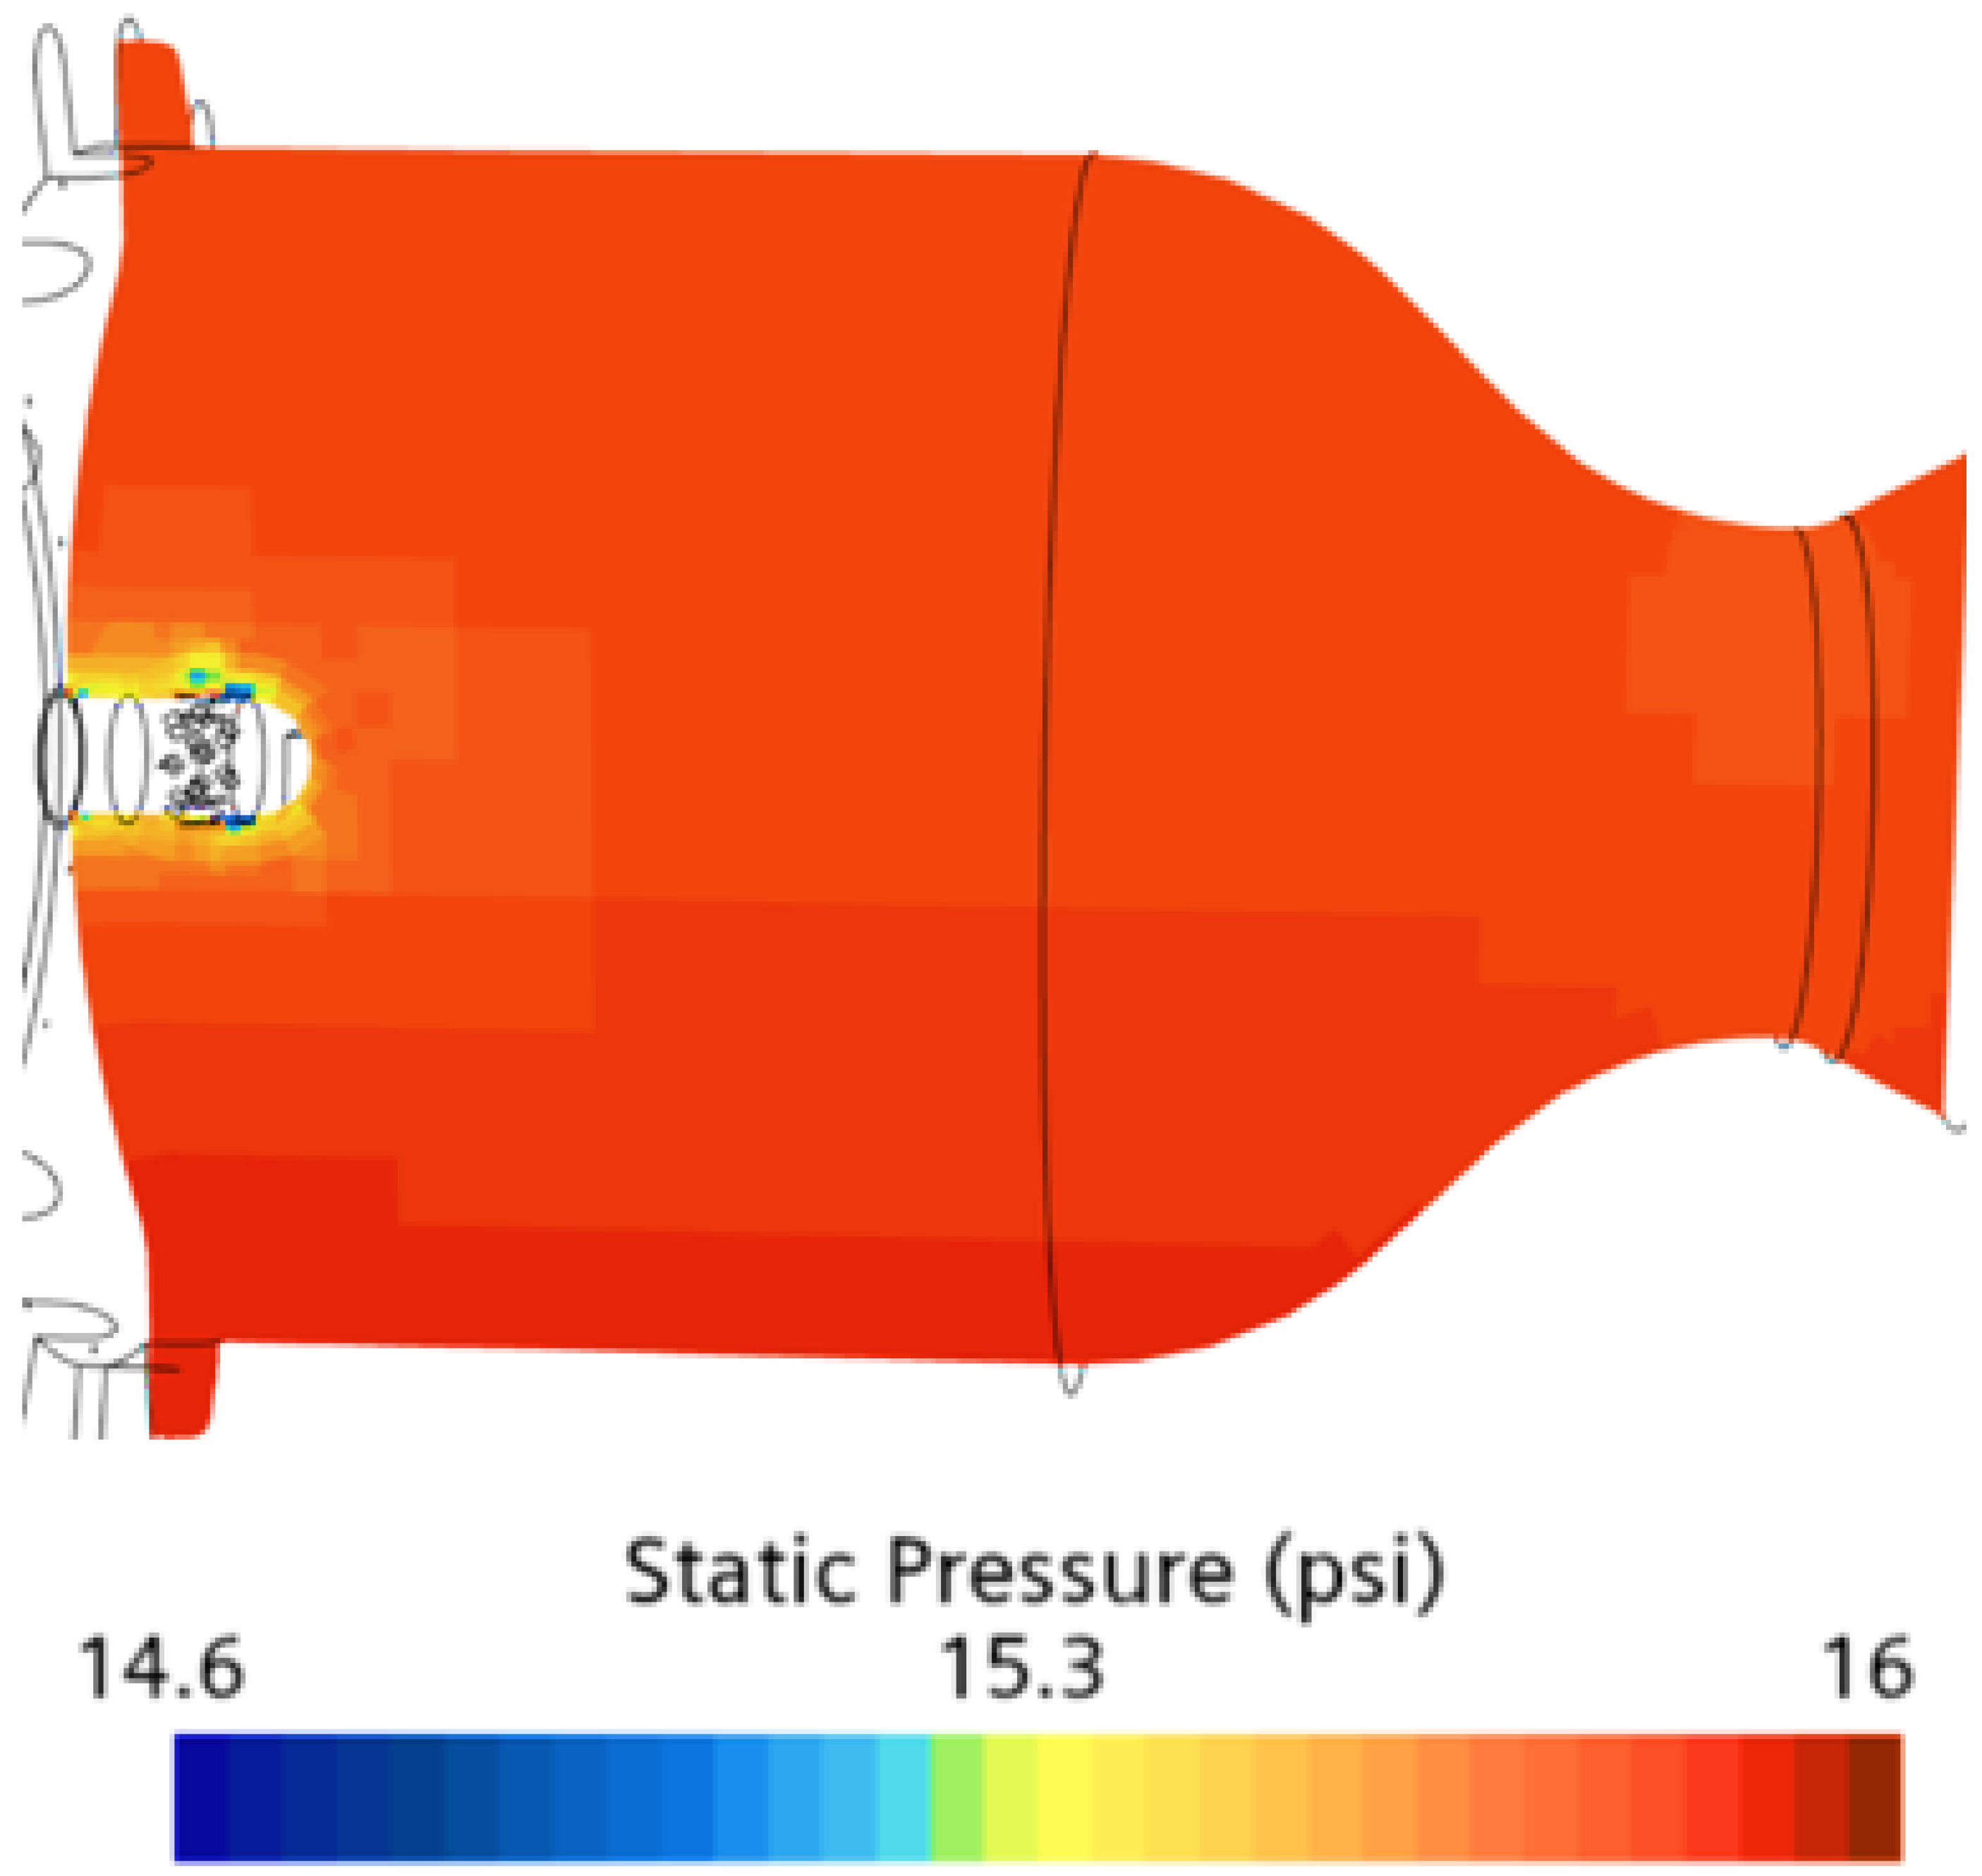
3.2.3. Feed System Behavior Using VOF for the 2nd Case
4. Conclusions
5. Future Work
Author Contributions
Funding
Data Availability Statement
Acknowledgments
Conflicts of Interest
Disclaimer
Nomenclature
| CROME | Centennial Restartable Oxygen Methane Engine |
| GFSSP | Generalized fluid system simulation program |
| GN2 | Gaseous Nitrogen |
| LCH4 | Liquid Methane |
| LN2 | Liquid Nitrogen |
| LOX | Liquid oxygen |
| lbf | Pound force |
| ΔP | Pressure change |
| RANS | Reynolds Averaged Navier–Stokes |
| ΔT | Temperature change |
| VOF | Volume of Fluid |
| ESP | Eulerian Single-Phase |
Appendix A
- A.
- Test Setup:
- B.
- Cold Flow Test:

| Cut-Off Shutdown Sequence | |
|---|---|
| Time (sec) | Event |
| 0 | TV-200, TV-300, SV-201, and SV-301 are CLOSED, Propellant Flow is Stopped |
| 0.5 | SV-202, SV-203, SV-102, and SV-103 are OPENED, Bleed Lines and Propellant Tank Lines are OPENED |
| 1 | SV-104, SV-105, SV-106 are OPENED, Run-line and Engine Purges are OPENED |
| 31 | SV-104, SV-105, SV-106 are CLOSED, Run-line and Engine Purges are CLOSED |
| 32 | TV-200 and TV-300 are fully OPENED, Main Engine Valves OPENED |
| 33 | SV-202 and SV-203 are CLOSED, Bleed Lines are CLOSED |
| 34 | SV-105 and SV-106 are OPENED, Run-line Purge through Main Engine Valves are OPENED |
| 44 | SV-105 and SV-106 are CLOSED, Run-line Purge through Main Engine Valves are CLOSED |
| 45 | TV-200 and TV-300 are fully CLOSED, Main Engine Valves CLOSED |
| 46 | SV-107 and SV-108 are OPENED, Igniter Purge is OPENED |
| 56 | SV-107 and SV-108 are CLOSED, Igniter Purge is CLOSED |
| End of Cut-off Shutdown Sequence | |
| Components Names | Vendor | Range | Accuracy | Types |
|---|---|---|---|---|
| Pressure Transducer | Omega or Generant | 0–1000 psig | 0.1% to 0.25% | Cryo or Static |
| Thermocouples | Omega | 32 to 1652 °F (E-Type) 32 to 2282 °F (K-Type) | ±1.7 °C (E-Type) ±2.2 °C (K-Type) | E-Type or K-Type (Grounded, Ungrounded, or Exposed) |
| Solenoid Valves | Gems Sensors & Controls or Clark Cooper Peterpaul | 375–1500 psia | ±1% to 10% | Cryo |
| Venturi | Lord | 0–300 psid | 0.25% FSO ±1% of Cd | Cryo |
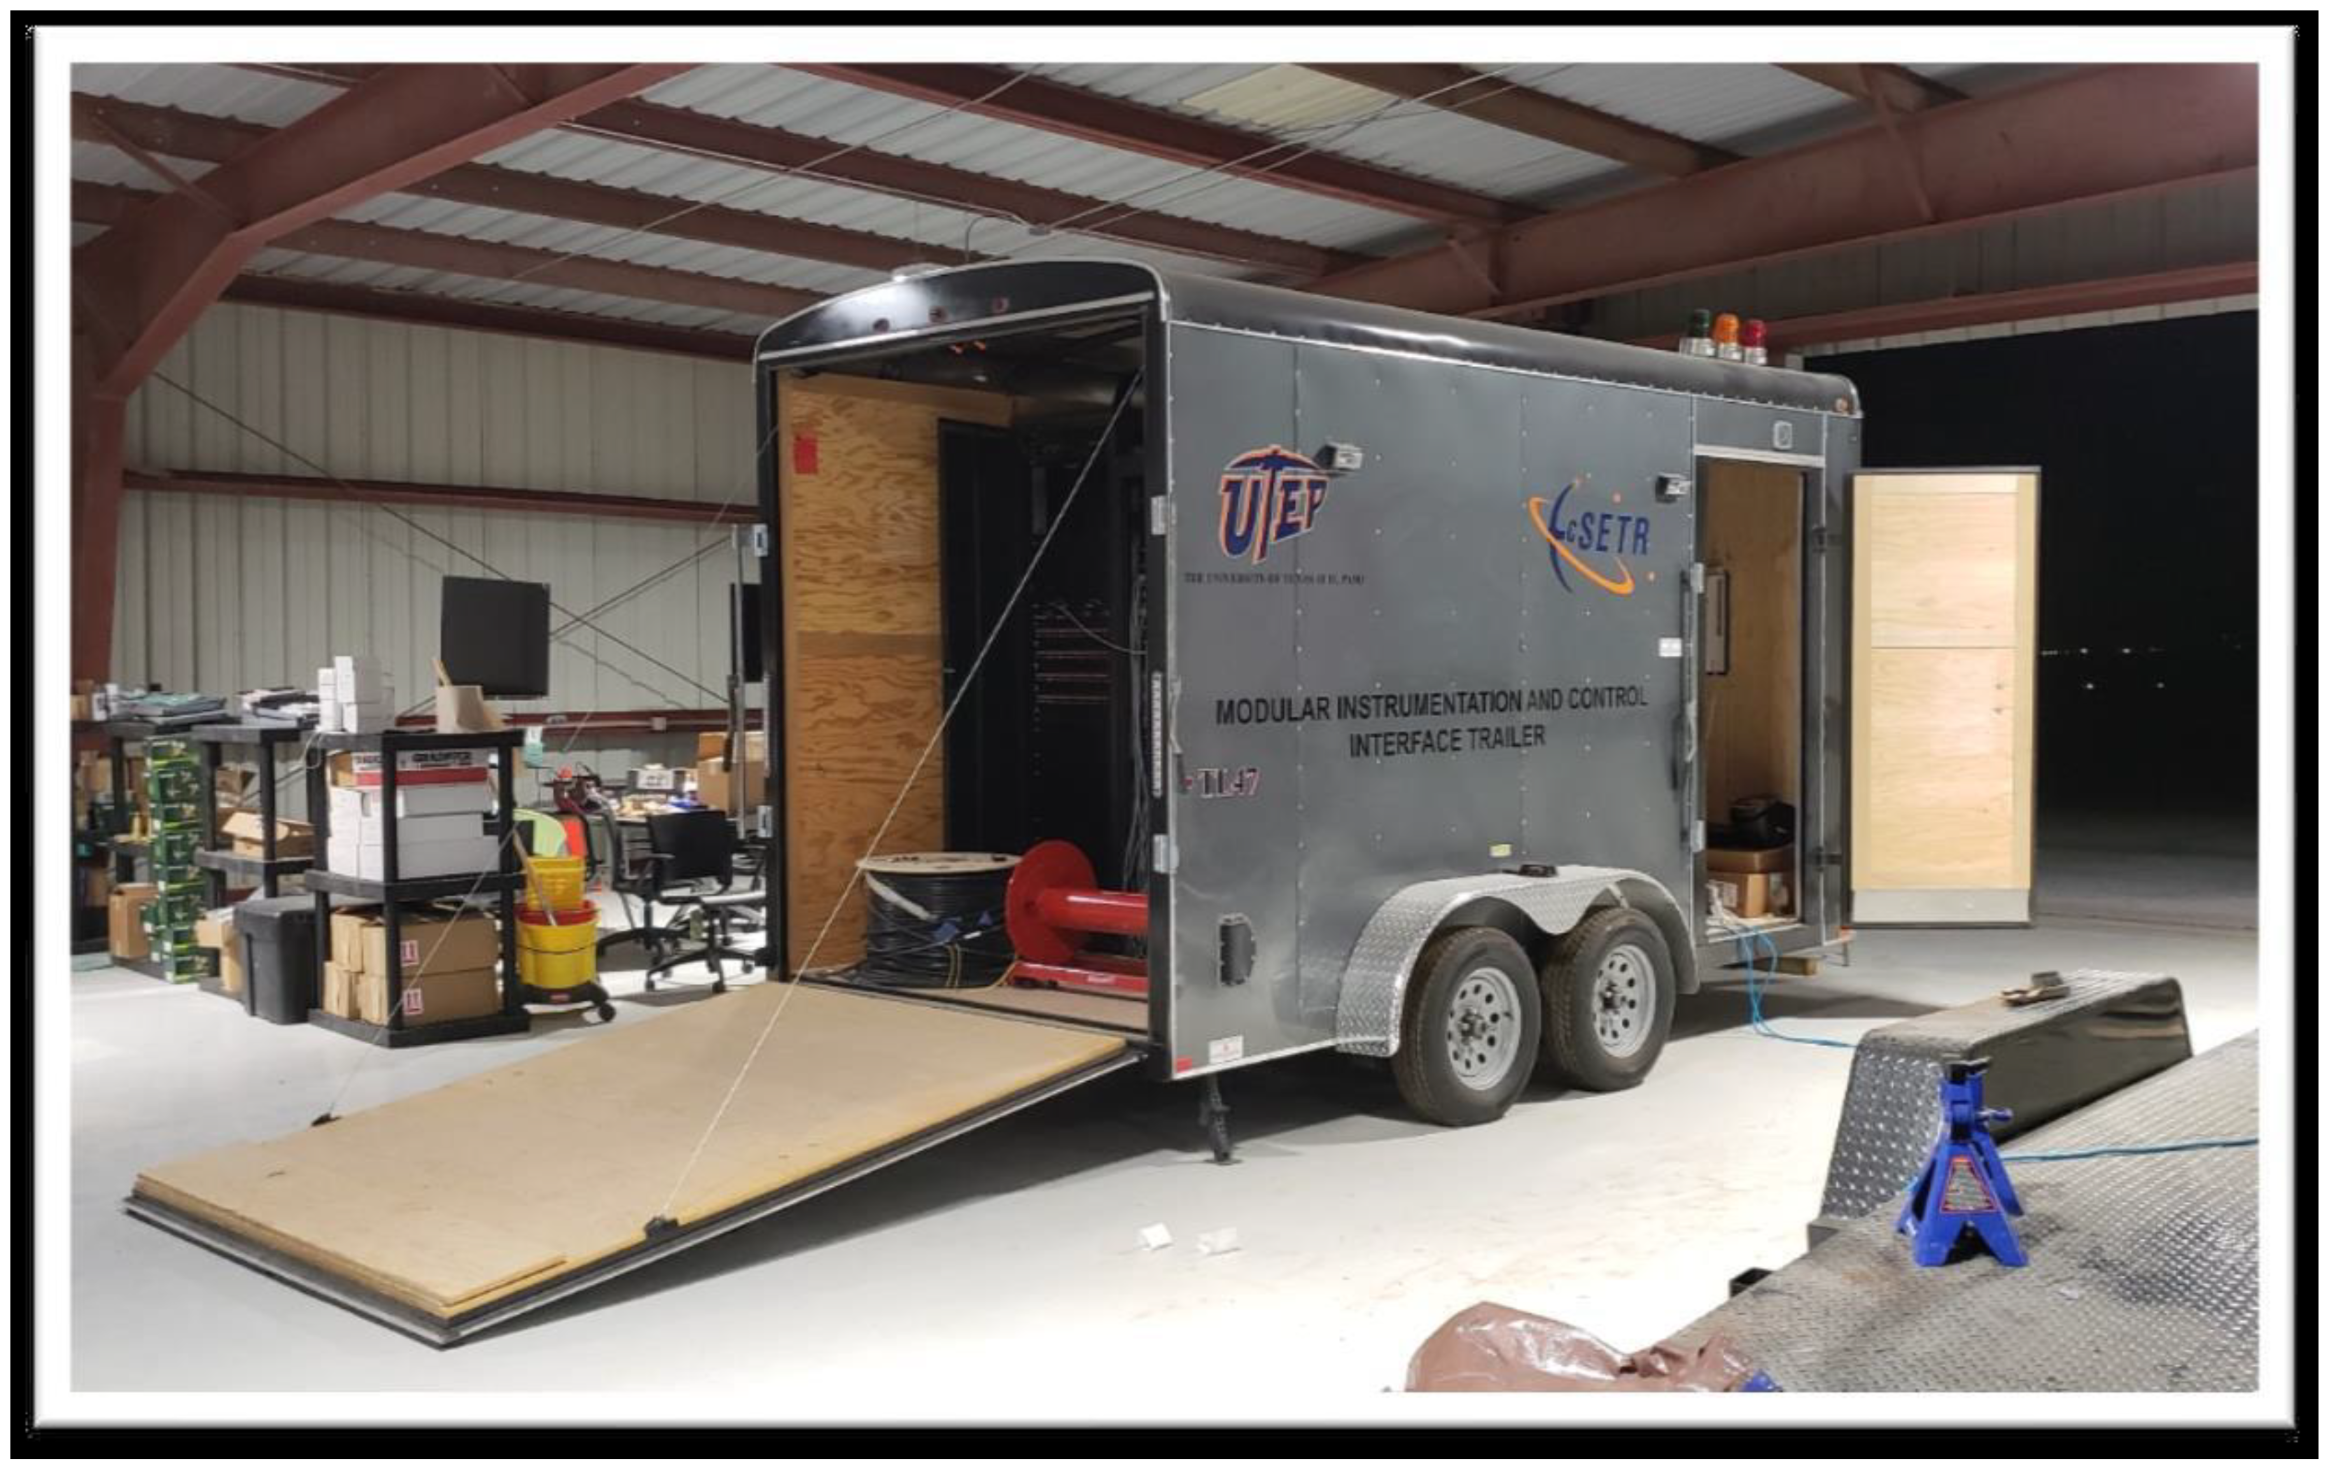
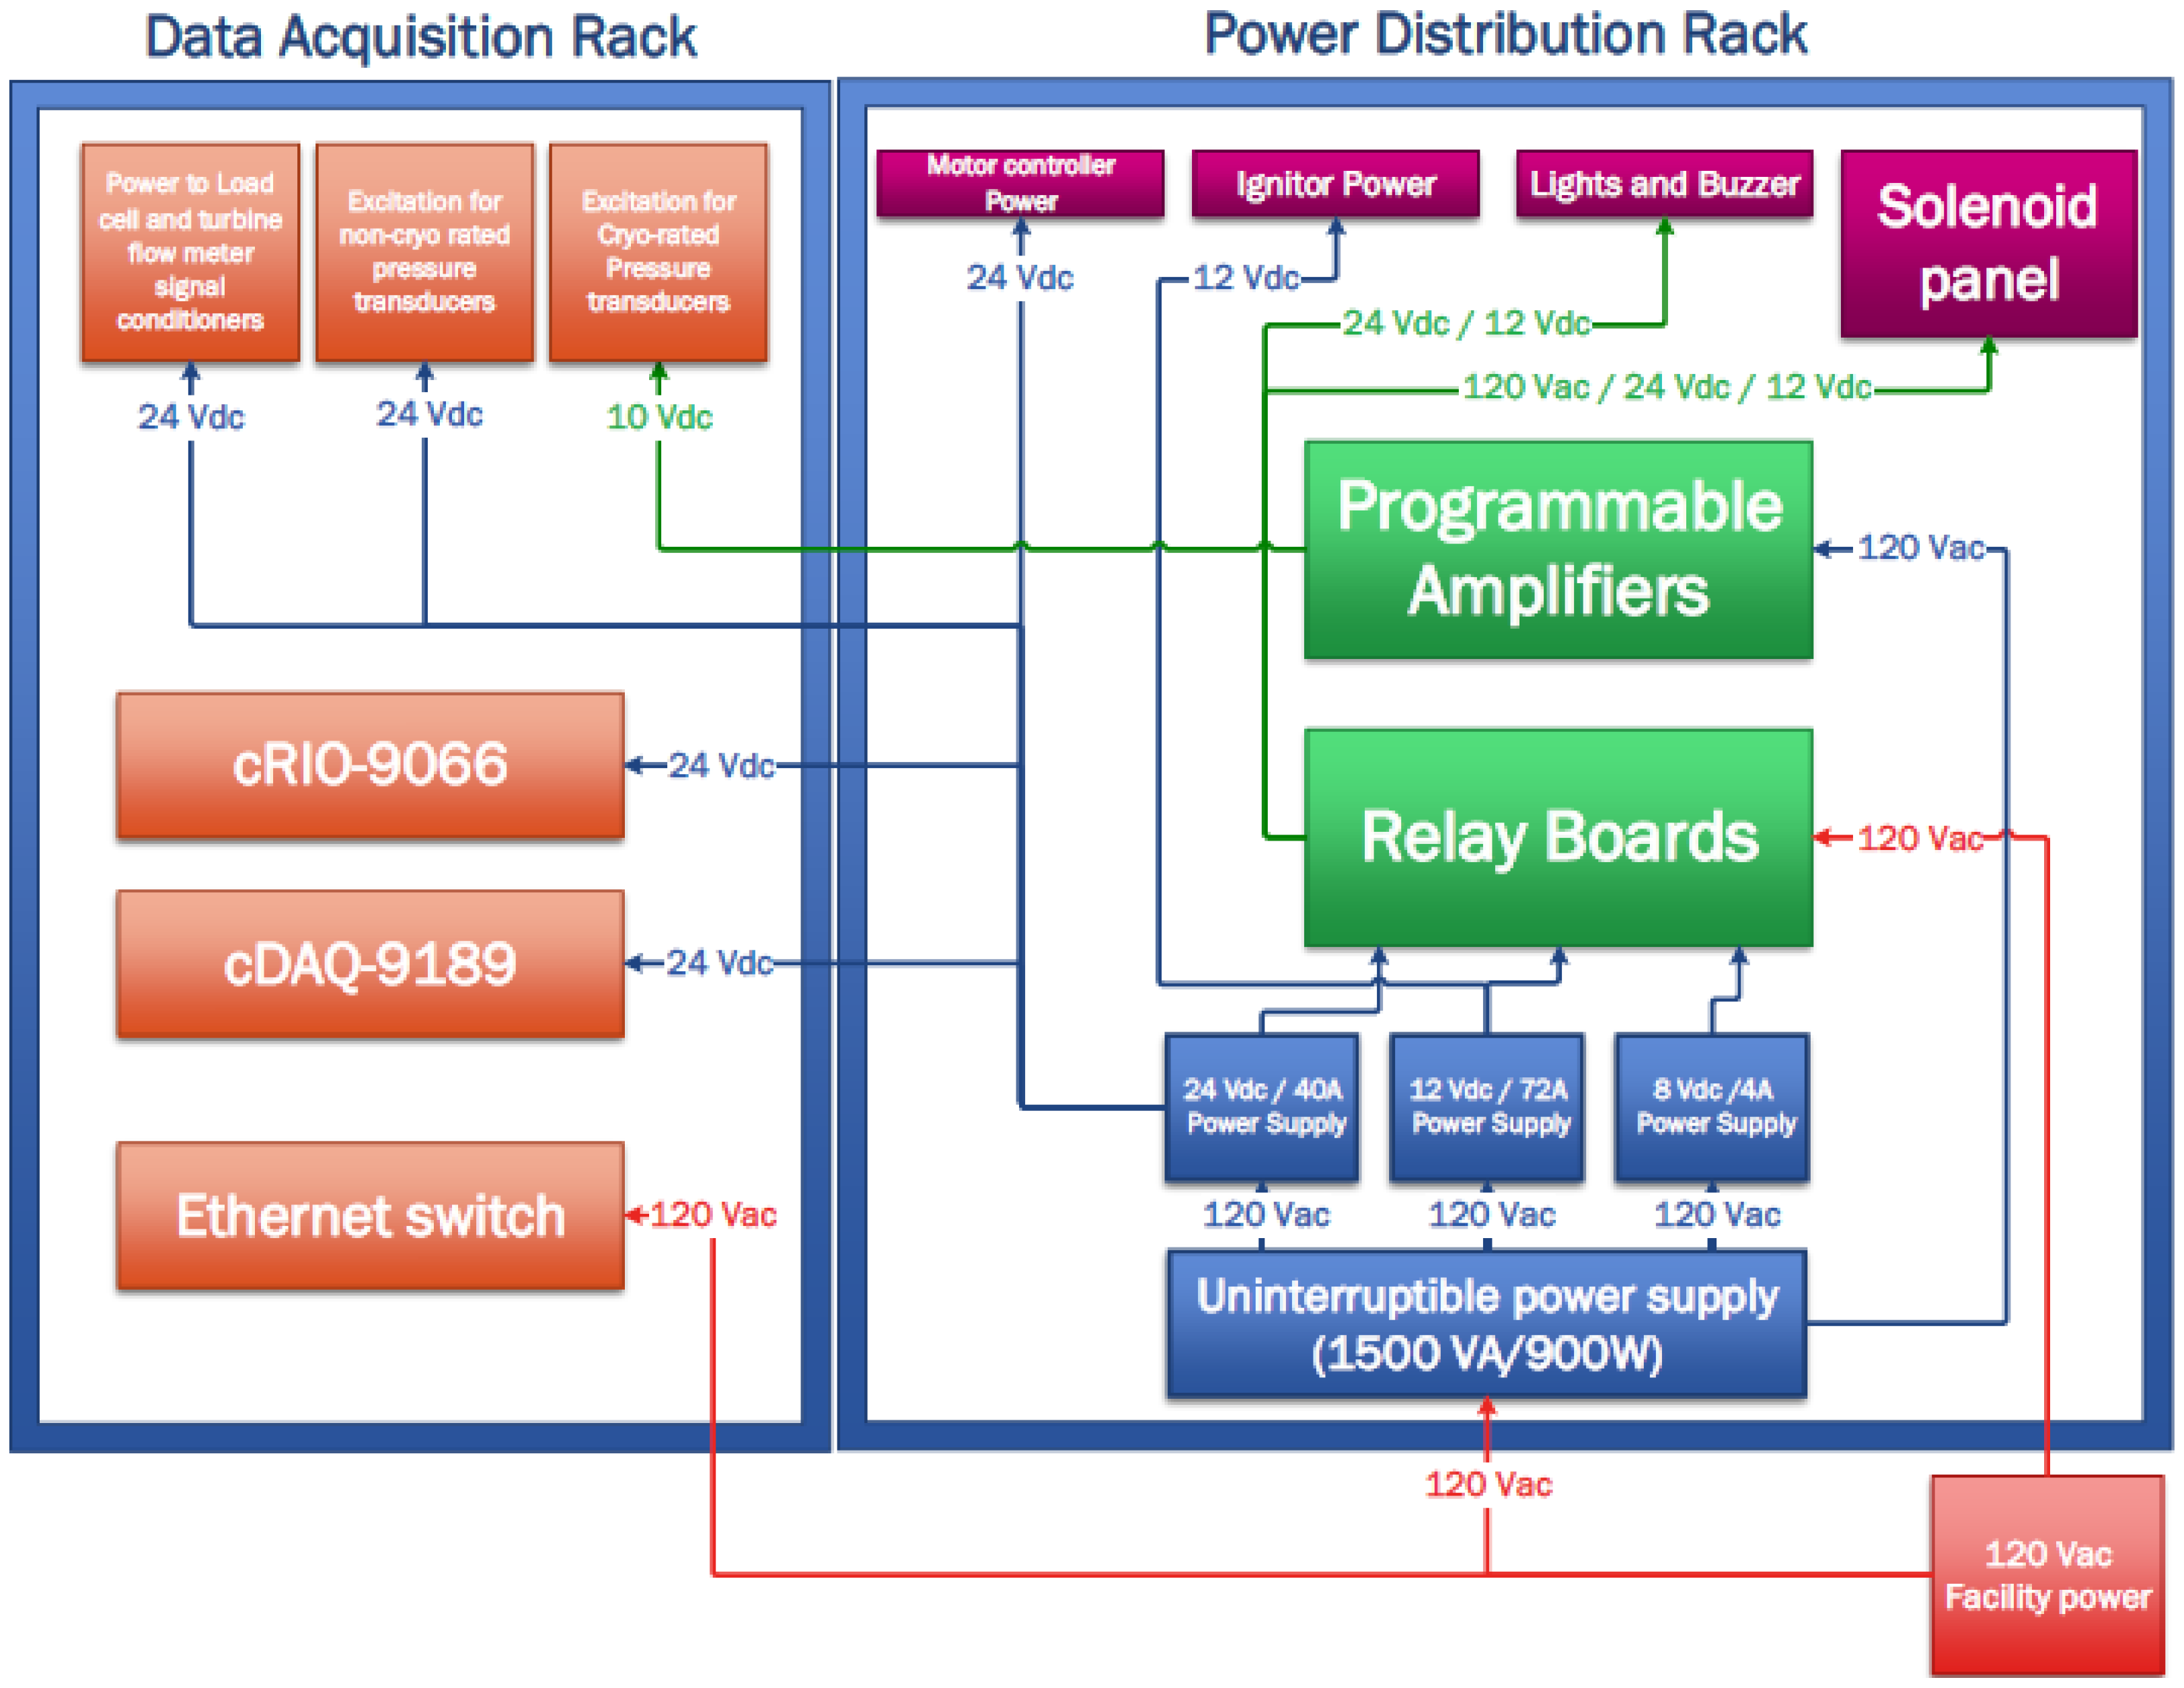
- C.
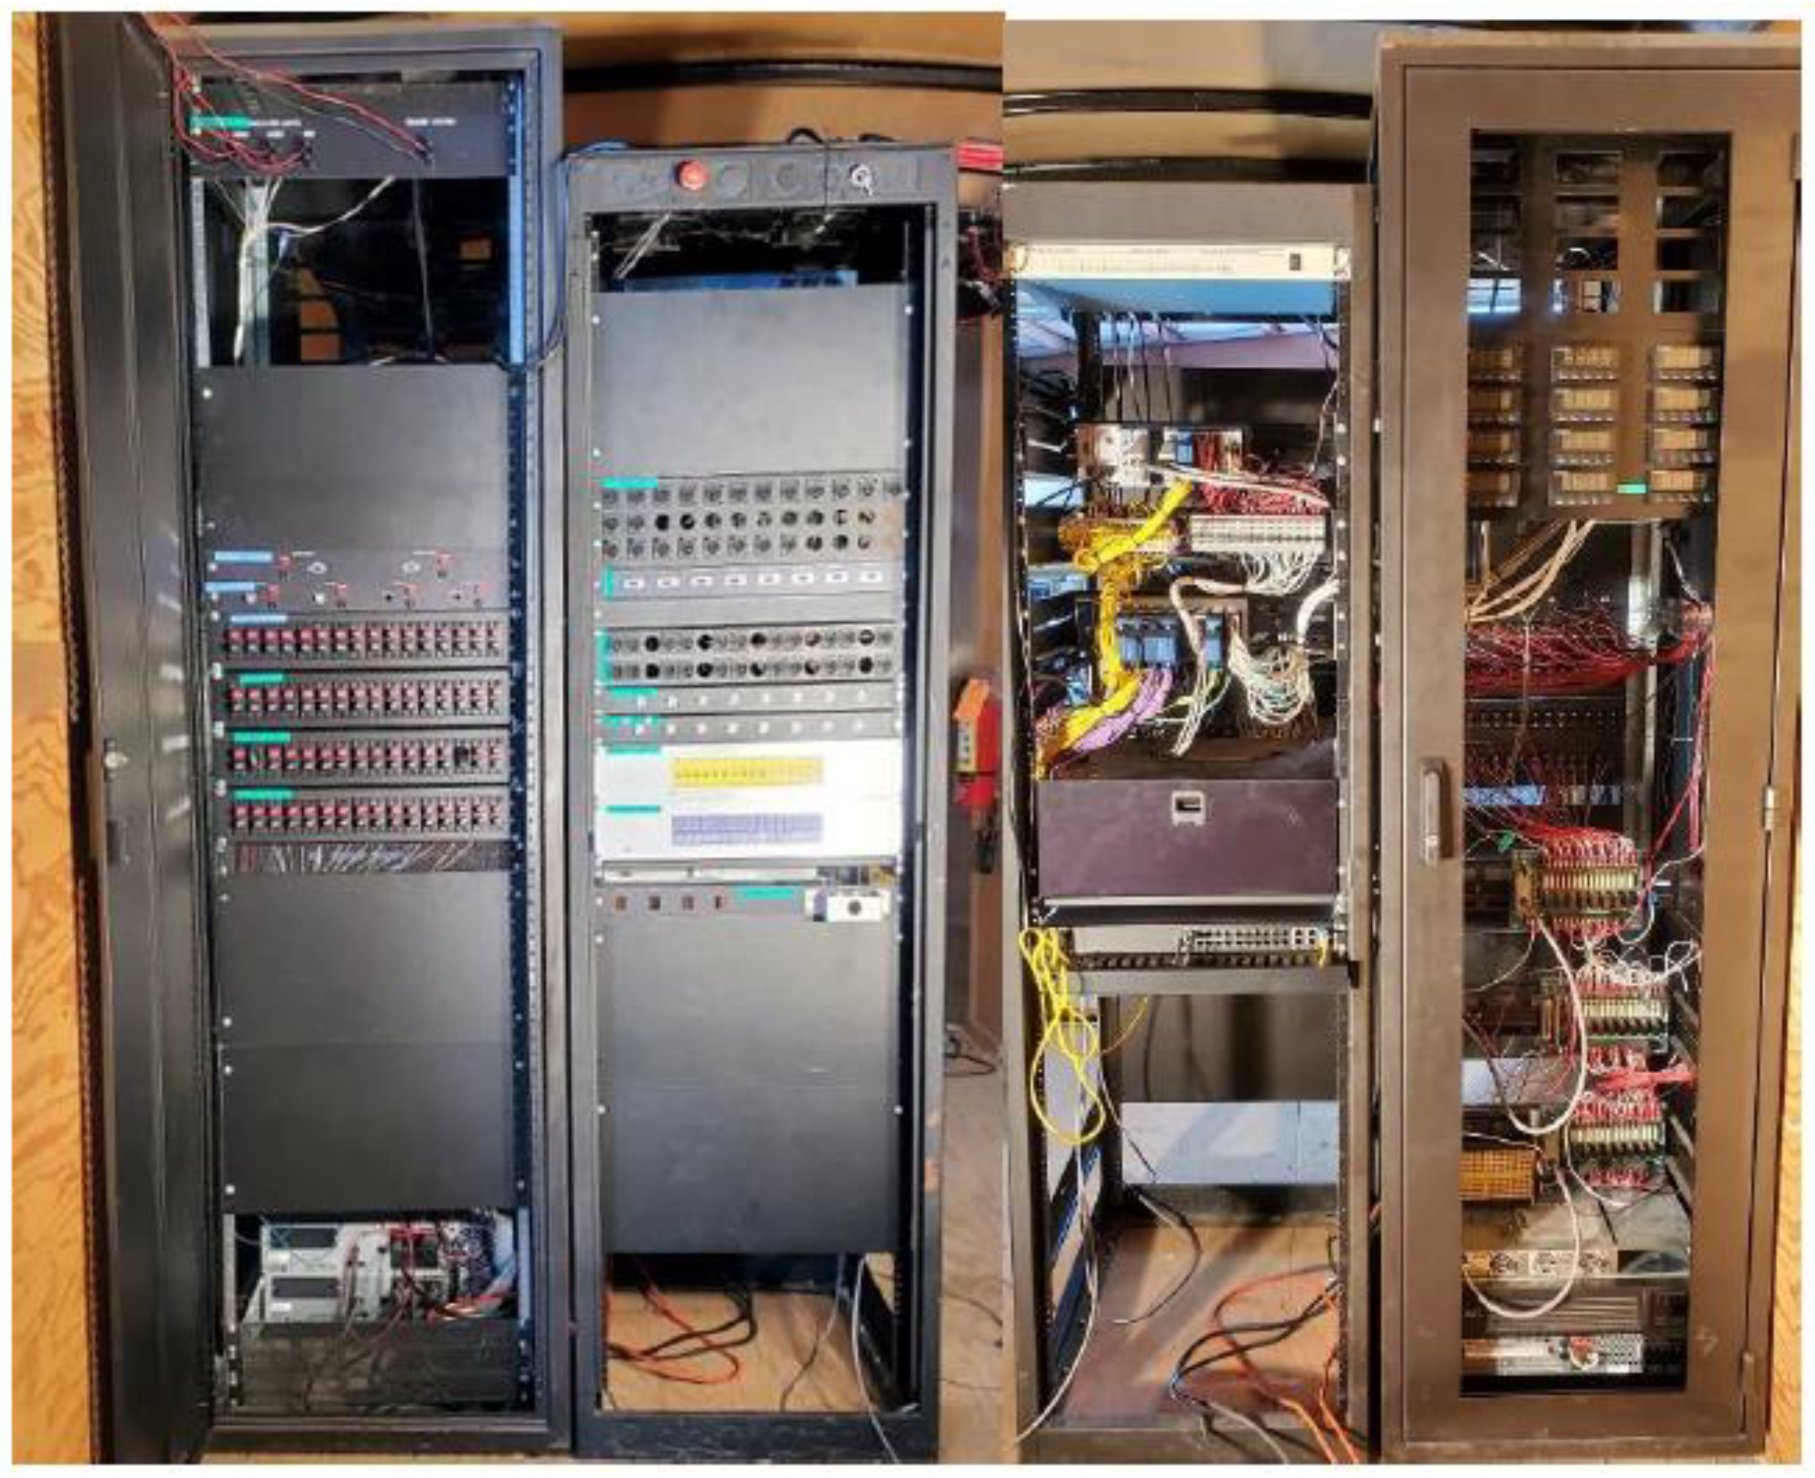
- Data Acquisition and Control System:
References
- Hao, Z.; Xintong, L.; Yuanjun, Z.; Yang, L.; Hui, T.; Guobiao, C. Trajectory/propulsion integrated design optimization of the manned lunar lander propelled by hybrid rocket motors using analytical target cascading. Acta Astronaut. 2024, 222, 375–390. [Google Scholar]
- Shi, T.; Yang, Y.; Zhang, Z.; Liu, C.; Liu, C.; Ma, D. Soft-landing dynamics of a type of four-legged space lander. Aerosp. Sci. Technol. 2024, 150, 109217. [Google Scholar] [CrossRef]
- Cohen, B.A.; Chavers, D.G.; Ballard, B.W. NASA’s robotic lunar lander development project. Acta Astronaut. 2012, 79, 221–240. [Google Scholar] [CrossRef]
- Evans, M.E.; Graham, L.D. A flexible lunar architecture for exploration (FLARE) supporting NASA’s Artemis program. Acta Astronaut. 2020, 177, 351–372. [Google Scholar] [CrossRef] [PubMed]
- Pontani, M.; Celani, F.; Carletta, S. Lunar descent and landing via two-phase explicit guidance and pulse-modulated reduced-attitude control. Acta Astronaut. 2023, 212, 672–685. [Google Scholar] [CrossRef]
- Braun, M.; Gollins, N.; Trivino, V.; Hosseini, S.; Schonenborg, R.; Landgraf, M. Human lunar return: An analysis of human lunar exploration scenarios within the upcoming decade. Acta Astronaut. 2020, 177, 737–748. [Google Scholar] [CrossRef]
- Spedding, C.P.; Lim, S.; Nuttall, W.J. ISRU technology deployment at a lunar outpost in 2040: A Delphi survey. Acta Astronaut. 2021, 181, 316–324. [Google Scholar] [CrossRef]
- Bennett, N.J.; Ellender, D.; Dempster, A.G. Commercial viability of lunar in-situ resource utilization (ISRU). Planet. Space Sci. 2020, 182, 104842. [Google Scholar] [CrossRef]
- Palos, M.F.; Serra, P.; Fereres, S.; Stephenson, K.; González-Cinca, R. Lunar ISRU energy storage and electricity generation. Acta Astronaut. 2020, 170, 412–420. [Google Scholar] [CrossRef]
- Reid, E.; Iles, P.; Muise, J.; Cristello, N.; Jones, B.; Faragalli, M.; Visscher, P.; Boucher, D.; Simard-Bilodeau, V.; Apostolopoulos, D.; et al. The Artemis Jr. rover: Mobility platform for lunar ISRU mission simulation. Adv. Space Res. 2015, 55, 2472–2483. [Google Scholar] [CrossRef]
- Guerrero-Gonzalez, F.J.; Zabel, P. System analysis of an ISRU production plant: Extraction of metals and oxygen from lunar regolith. Acta Astronaut. 2023, 203, 187–201. [Google Scholar] [CrossRef]
- Hoffman, J.A.; Hinterman, E.R.; Hecht, M.H.; Rapp, D.; Hartvigsen, J.J. 18 Months of MOXIE (Mars oxygen ISRU experiment) operations on the surface of Mars-Preparing for human Mars exploration. Acta Astronaut. 2023, 210, 547–553. [Google Scholar] [CrossRef]
- Anand, M.; Crawford, I.A.; Balat-Pichelin, M.; Abanades, S.; Van Westrenen, W.; Péraudeau, G.; Jaumann, R.; Seboldt, W. A brief review of chemical and mineralogical resources on the Moon and likely initial in situ resource utilization (ISRU) applications. Planet. Space Sci. 2012, 74, 42–48. [Google Scholar] [CrossRef]
- Neill, T.; Judd, D.; Veith, E.; Rousar, D. Practical uses of liquid methane in rocket engine applications. Acta Astronaut. 2009, 65, 696–705. [Google Scholar] [CrossRef]
- Salgado, M.C.V.; Belderrain, M.C.N.; Devezas, T.C. Space propulsion: A survey study about current and future technologies. J. Aerosp. Technol. Manag. 2018, 10, e1118. [Google Scholar]
- Tajmar, M. Advanced Space Propulsion Systems; Springer Science & Business Media: Berlin/Heidelberg, Germany, 2012. [Google Scholar]
- Baiocco, P. Overview of reusable space systems with a look to technology aspects. Acta Astronaut. 2021, 189, 10–25. [Google Scholar] [CrossRef]
- Seedhouse, E. The Rise of the Falcon. In SpaceX: Starship to Mars—The First 20 Years; Springer International Publishing: Cham, Switzerland, 2022; pp. 58–70. [Google Scholar]
- Dutheil, J.P.; Boué, Y. Highly reusable LOx/LCH4 ACE rocket engine designed for SpacePlane: Technical Maturation progress via key system demonstrators results. In Proceedings of the 7th European Conference for Aeronautical and Space Sciences, Milan, Italy, 3–6 July 2017. [Google Scholar]
- Klem, M.D. LOX/Methane In-Space Propulsion Systems Technology Status and Gaps. In Proceedings of the Southwest Emerging Technology Symposium (SETS) 2017 (No. GRC-E-DAA-TN40702), El Paso, TX, USA, 1 April 2017. [Google Scholar]
- Feng, S.; Nie, W.; He, B.; Cheng, Y. Three-Dimensional Numerical Simulations of Low Frequency Combustion Instability in a LOX/Methane Rocket Engine. In Proceedings of the AIAA SPACE 2010 Conference & Exposition, Anaheim, CA, USA, 27–30 September 2010; p. 8776. [Google Scholar]
- Haidn, O.; Oschwald, M.; Clauss, W.; Arnold, R.; Sender, J.; Preuss, A.; Preclik, D.; Mäding, C.; Görgen, J.; Soller, S. LOx/Methane technology efforts for future liquid rocket engines. In Proceedings of the 5th International Spacecraft Propulsion Conference & 2nd International Symposium on Propulsion for Space Transportation, Crete, Greece, 5–8 May 2008. [Google Scholar]
- Taya, K.; Ishikawa, Y.; Kimoto, K.; Ishizaki, S. Development status of LOX/LCH4 rocket engine. In Proceedings of the 50th AIAA/ASME/SAE/ASEE Joint Propulsion Conference, Cleveland, OH, USA, 28–30 July 2014; p. 3480. [Google Scholar]
- Zurbach, S.; Thomas, J.L.; Sion, M.; Kachler, T.; Vingert, L.; Habiballah, M. Recent advances on LOX/methane combustion for liquid rocket engine injector. In Proceedings of the 38th AIAA/ASME/SAE/ASEE Joint Propulsion Conference & Exhibit, Indianapolis, Indiana, 7–10 July 2002; p. 4321. [Google Scholar]
- Brown, T.; Klem, M.; McRight, P. Foundational Methane Propulsion Related Technology Efforts, and Challenges for Applications to Human Exploration Beyond Earth Orbit (No. M16-5248). In Proceedings of the Space Propulsion 2016, Roma, Italy, 2–6 May 2016. [Google Scholar]
- Tao, F.; Xiao, B.; Qi, Q.; Cheng, J.; Ji, P. Digital twin modeling. J. Manuf. Syst. 2022, 64, 372–389. [Google Scholar] [CrossRef]
- Jiang, L.; Su, S.; Pei, X.; Chu, C.; Yuan, Y.; Wang, K. Product-part level digital twin modeling method for digital thread framework. Comput. Ind. Eng. 2023, 179, 109168. [Google Scholar] [CrossRef]
- Wang, T.; Tan, C.; Huang, L.; Shi, Y.; Yue, T.; Huang, Z. Simplexity testbed: A model-based digital twin testbed. Comput. Ind. 2023, 145, 103804. [Google Scholar] [CrossRef]
- Aláez, D.; Olaz, X.; Prieto, M.; Villadangos, J.; Astrain, J.J. VTOL UAV digital twin for take-off, hovering and landing in different wind conditions. Simul. Model. Pract. Theory 2023, 123, 102703. [Google Scholar] [CrossRef]
- Kim, S.; Im, J.H.; Kim, M.; Kim, J.; Kim, Y.I. Diagnostics using a physics-based engine model in aero gas turbine engine verification tests. Aerosp. Sci. Technol. 2023, 133, 108102. [Google Scholar] [CrossRef]
- Xiong, M.; Wang, H.; Fu, Q.; Xu, Y. Digital twin–driven aero-engine intelligent predictive maintenance. Int. J. Adv. Manuf. Technol. 2021, 114, 3751–3761. [Google Scholar] [CrossRef]
- Liu, Z.; Blasch, E.; Liao, M.; Yang, C.; Tsukada, K.; Meyendorf, N. Digital twin for predictive maintenance. NDE 4.0, Predictive Maintenance, Communication, and Energy Systems: The Digital Transformation of NDE. Proc. Spie 2023, 12489, 27–37. [Google Scholar]
- Aivaliotis, P.; Georgoulias, K.; Chryssolouris, G. The use of Digital Twin for predictive maintenance in manufacturing. Int. J. Comput. Integr. Manuf. 2019, 32, 1067–1080. [Google Scholar] [CrossRef]
- Matulić, N. Combustion Engine Digital Twin Development and Application Methodology for Real Time Diagnostic Systems. Ph.D. Thesis, Faculty of Electrical Engineering, Mechanical Engineering and Naval Architecture, University of Split, Split, Croatia, 2020. Available online: https://data.fesb.unist.hr/documents/public/Kvalifikacijski_Matulic.pdf (accessed on 20 December 2024).
- Rosen, R.; Von Wichert, G.; Lo, G.; Bettenhausen, K.D. About the importance of autonomy and digital twins for the future of manufacturing. IFAC-PapersOnLine 2015, 48, 567–572. [Google Scholar] [CrossRef]
- Jimenez Mena, D.; Pluchart, S.; Mouvand, S.; Broca, O. Rocket engine digital twin–modeling and simulation benefits. In Proceedings of the AIAA Propulsion and Energy 2019 Forum, Indianapolis, Indiana, 19–22 August 2019; p. 4114. [Google Scholar]
- Vazquez, O. Trade Study Analysis of the Janus Moon Lander Vehicle. Ph.D. Thesis, The University of Texas at El Paso, El Paso, TX, USA, 2022. [Google Scholar]
- Herrera, M.; Chaidez, M.; Welsh, Z.; Adams, J.; Bugarin, L.I.; Chessa, J.; Choudhuri, A.R. Design and Testing of a 500 lbf Liquid Oxygen/Liquid Methane Engine. In Proceedings of the AIAA Propulsion and Energy 2019 Forum, Indianapolis, Indiana, 19–22 August 2019; p. 3937. [Google Scholar]
- Orozco Martinez, S.; Hernandez, I.; Hossain, M.A.; Choudhuri, A. Thermo-Structural Dynamics of the CROME Propulsion System: A Preliminary Study. In Proceedings of the AIAA SCITECH 2025 Forum, Orlando, FL, USA, 6–10 January 2025; p. 2340. [Google Scholar]
- Trillo, J.E. Design of a 500 Lbf Liquid Oxygen and Liquid Methane Rocket Engine for Suborbital Flight. Master’s Thesis, University of Texas at El Paso, El Paso, TX, USA, 2016; p. 767. [Google Scholar]
- Hossain, M.A.; Morse, A.; Hernandez, I.; Quintana, J.; Choudhuri, A. Liquid Rocket Engine Performance Characterization Using Computational Modeling: Preliminary Analysis and Validation. Aerospace 2024, 11, 824. [Google Scholar] [CrossRef]
- Welsh, Z.W. Qualification and Implementation of A Liquid Oxygen/Liquid Methane Data Acquisition System. Master’s Thesis, Department of Mechanical Engineering, The University of Texas at El Paso, El Paso, TX, USA, 2020. [Google Scholar]
- Hansen, C.G. Design Specifications and Requirements for a Mobile Data Acquisition System. Master’s Thesis, Department of Mechanical Engineering, The University of Texas at El Paso, El Paso, TX, USA, 2019. [Google Scholar]
- Rojo, R.M. Development and Implementation of the tRIAC Data Acquisition and Control System. Master’s Thesis, Department of Mechanical Engineering, The University of Texas at El Paso, El Paso, TX, USA, 2019. [Google Scholar]
- Pizzarelli, M.; Betti, B.; Nasuti, F.; Ricci, D.; Roncioni, P.; Battista, F.; Salvatore, V. Cooling channel analysis of a LOX/LCH4 rocket engine demonstrator. In Proceedings of the 50th AIAA/ASME/SAE/ASEE Joint Propulsion Conference, Cleveland, OH, USA, 28–30 July 2014; p. 4004. [Google Scholar]
- Liberatori, J.; Malpica Galassi, R.; Liuzzi, D.; Filosa, A.; Valorani, M.; Ciottoli, P.P. Injection of LOX spray in Methane cross-flow RANS modeling uncertainty quantification. In Proceedings of the AIAA Propulsion and Energy 2021 Forum, Virtual Event, 9–11 August 2021; p. 3570. [Google Scholar]
- De Giorgi, M.G.; Sciolti, A.; Ficarella, A. Application and comparison of different combustion models of high pressure LOX/CH4 jet flames. Energies 2014, 7, 477–497. [Google Scholar] [CrossRef]
- Siemens. Star CCM+ User’s Manual. Ver. 2021.3. New Features and Enhancements. Available online: https://www.aerofem.com/assets/files/Simcenter-STAR-CCM-2021.3-New-features-List-Fact-Sheet.pdf (accessed on 20 December 2024).
- Vashahi, F.; Dafsari, R.A.; Rezaei, S.; Lee, J.K.; Baek, B.J. Assessment of steady VOF RANS turbulence models in rendering the internal flow structure of pressure swirl nozzles. Fluid Dyn. Res. 2019, 51, 045506. [Google Scholar] [CrossRef]
- Ye, W.; Pan, Y.; He, L.; Chen, B.; Liu, J.; Gao, J.; Wang, Y.; Yang, Y. Design with modeling techniques. In Industrial Ventilation Design Guidebook; Academic Press: Cambridge, MA, USA, 2021; pp. 109–183. [Google Scholar]
- Zhou, W.; Chen, B.; Zhu, Q.; Rao, S.; Xu, X. Numerical simulation of angled-injected liquid jet breakup in supersonic crossflow by a hybrid VOF-LPT method. Int. J. Multiph. Flow 2023, 166, 104503. [Google Scholar] [CrossRef]
- Cui, L.; Chen, Z.; Feng, Y.; Li, G.; Liu, J. An improved VOF method with anti-ventilation techniques for the hydrodynamic assessment of planing hulls-Part 2: Applications. Ocean Eng. 2021, 237, 109505. [Google Scholar] [CrossRef]
- Wang, J.H.; Luo, J.; Huang, S.X.; Xia, J.; Yang, B.; Wang, Y. Numerical simulation of single aluminum droplet evaporation based on VOF method. Case Stud. Therm. Eng. 2022, 34, 102008. [Google Scholar] [CrossRef]
- Majumdar, A.; Valenzuela, J.; LeClair, A.; Moder, J. Numerical modeling of self-pressurization and pressure control by a thermodynamic vent system in a cryogenic tank. Cryogenics 2016, 74, 113–122. [Google Scholar] [CrossRef]
- Qin, X.; Li, P.; Sun, P.; Huang, Y. Testing and comparison of a thermodynamic vent system operating in different modes in a liquid nitrogen tank. Appl. Therm. Eng. 2021, 197, 117393. [Google Scholar] [CrossRef]


| Requirements | Value |
|---|---|
| Thrust | 500–125 lbf |
| Operation/Ambient Pressure | Steady State/12.8 psia |
| Propellants | LOX/LCH4 |
| Max Tank Pressure | 425 psig |
| Engine Mixture Ratio | 2.7 |
| Fuel Film Cooling (FFC) | 30% of Incoming Fuel Flow |
| Engine Chamber Pressure (Pc) | 235-70 psia |
| Component Materials | Chamber/Nozzle: Inconel 718 Injector Assembly: Inconel 625 Manifolds and Lines: SS 316 |
| Nozzle Expansion Ratio (ɛ) | 1.7 |
| Cold Flow Tests | Feed Line | Tank Pressure (psi) | Mass Flow Rate (lbm/s) | Expected Saturation Temperatures at The Engine Inlet (°F) |
|---|---|---|---|---|
| Test 1 | LCH4 | 33 | 0.9 | −309 to −312 |
| Test 2 | 100 | −283 to −285 |
| Categories | Parameters Used in ESP Simulation |
|---|---|
| Mesh Settings |
|
| Models |
|
| Initial Conditions |
|
| Regional Boundary Conditions |
|
| Categories | Parameters |
|---|---|
| Mesh Settings |
|
| Models |
|
| Initial Conditions |
|
| Regional Boundary Conditions |
|
| Parameters/Categories | First Test | Second Test |
|---|---|---|
| Sample Data Set | 339,000 | 340,010 |
| Venturi Mass Flow Rate (lbm/s) | 0.833 to 0.906 Avg. = 0.869; Std Dev = 0.0048 | 0.851 to 1.08 Avg. = 0.965; Std Dev = 0.0047 |
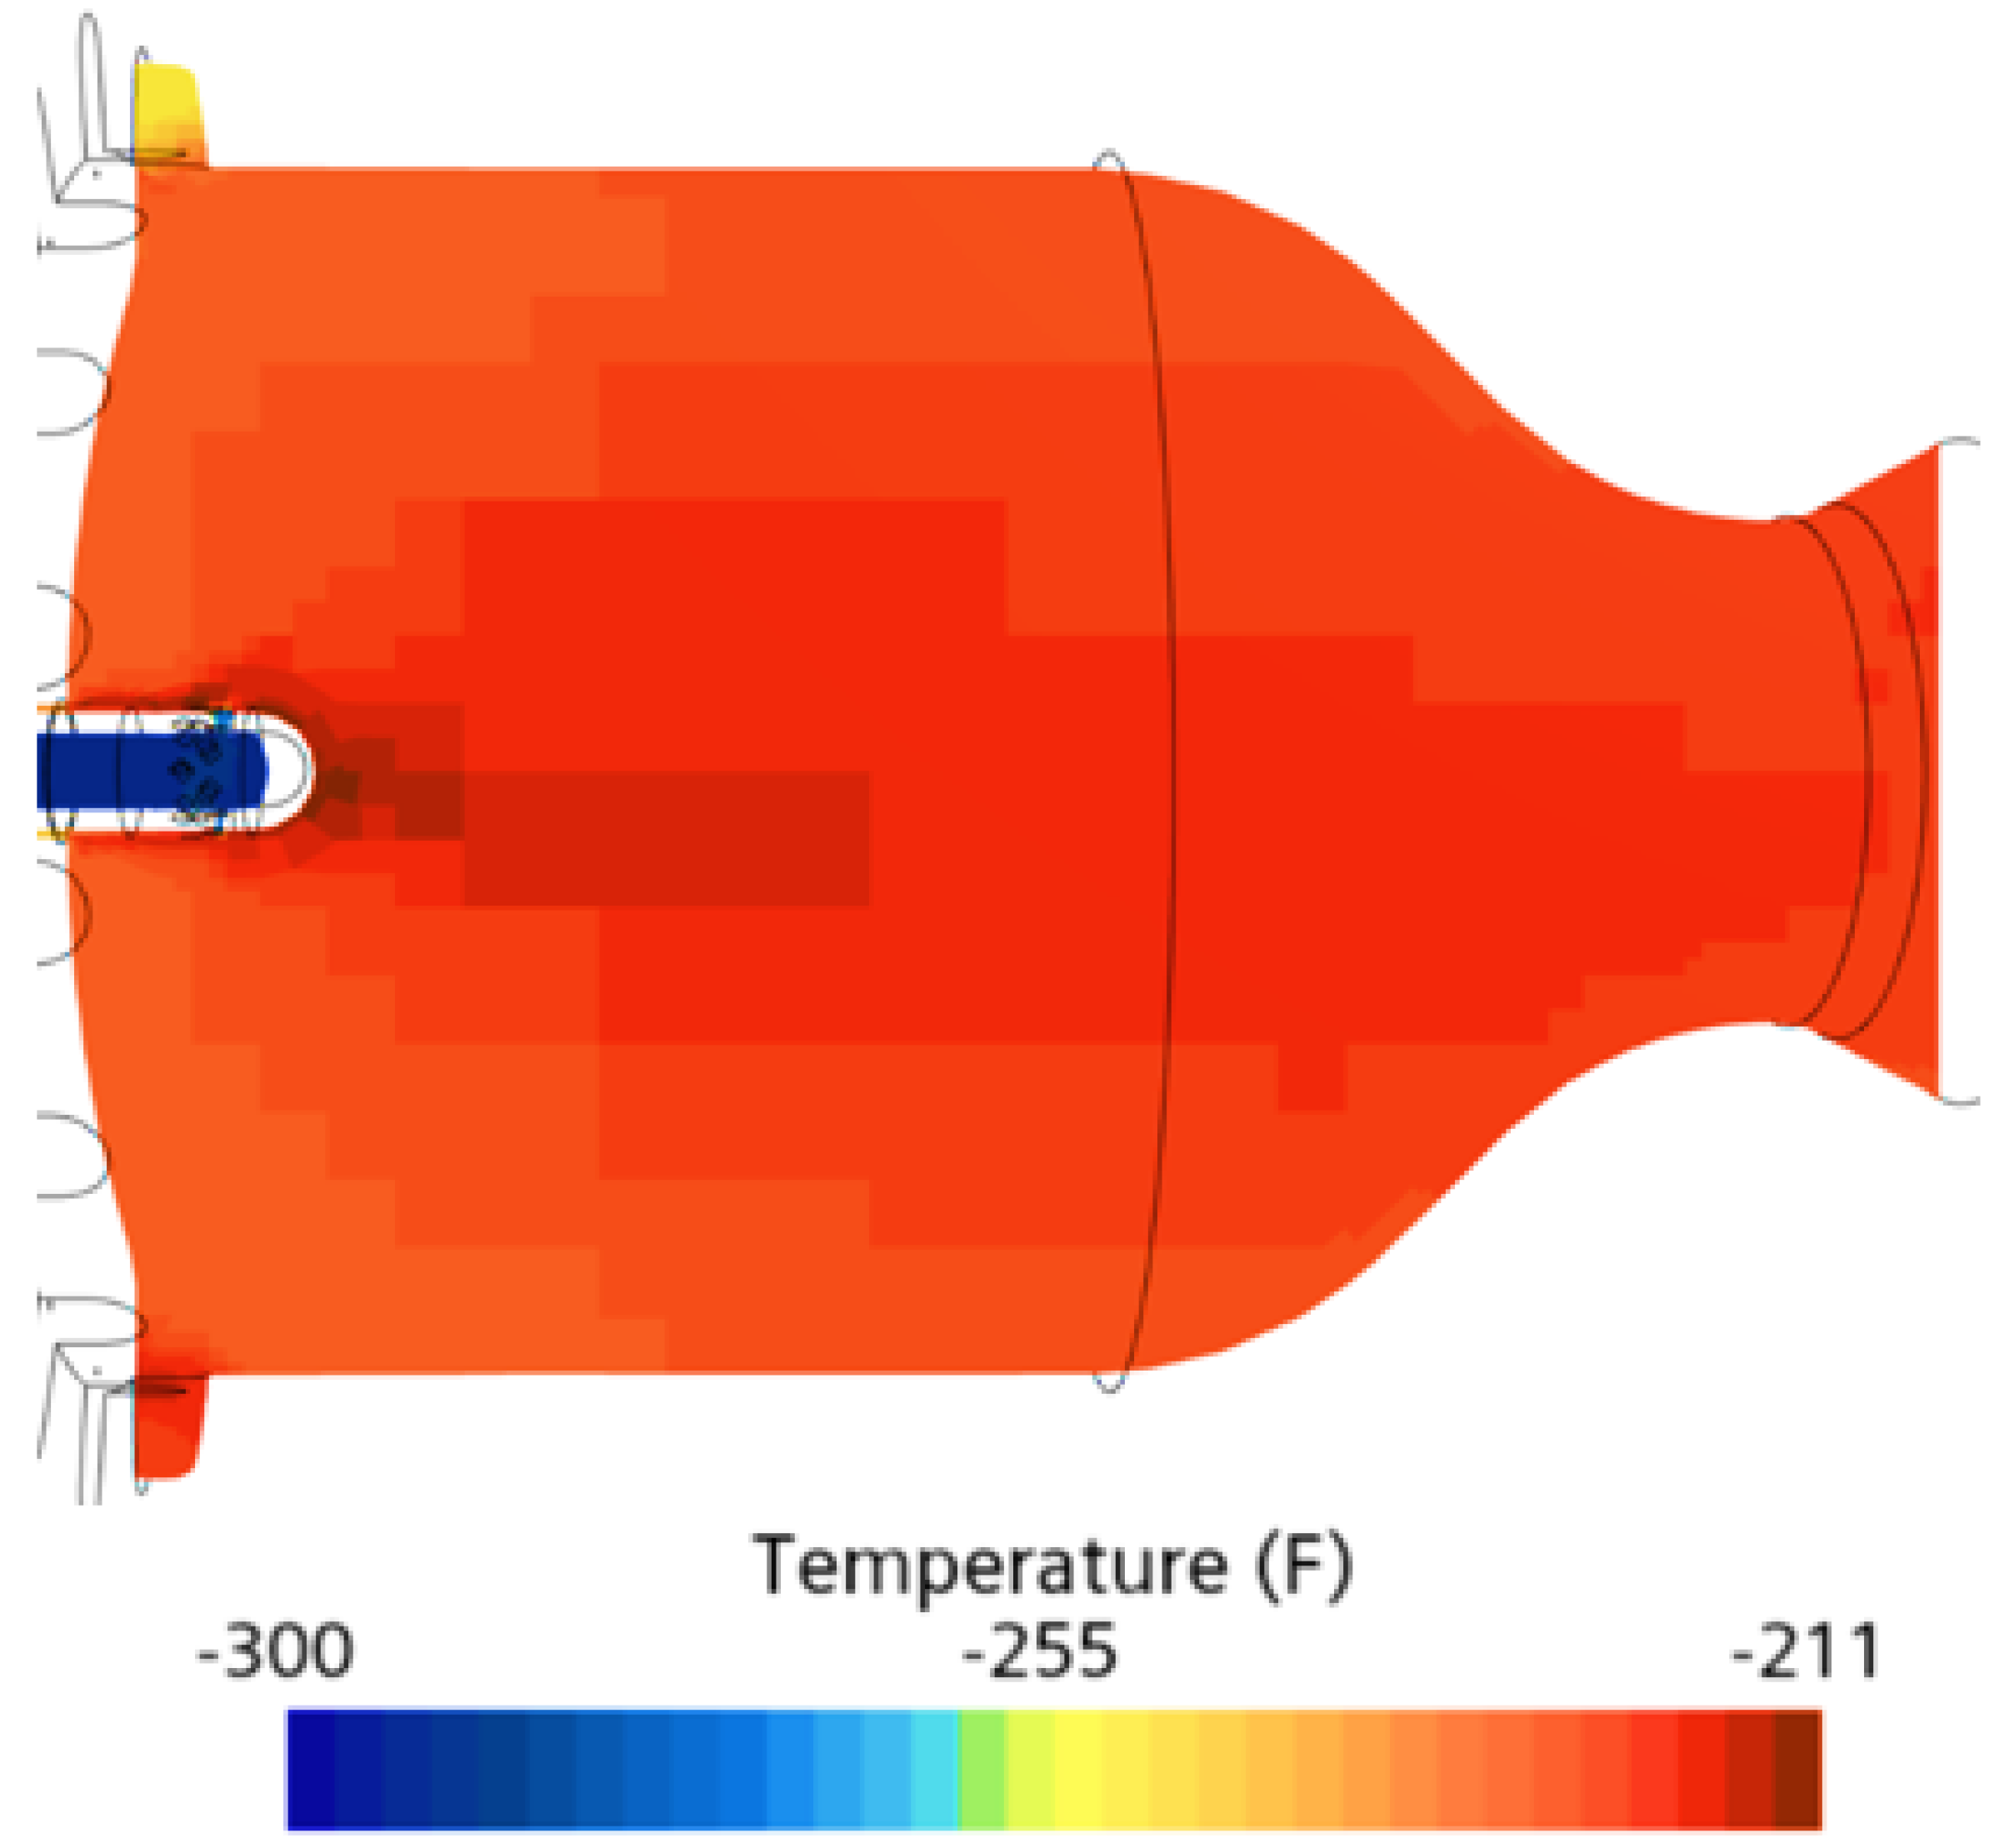
| Tank Surface Temperature (°F) | −300.4 to −298.7 Avg. = −299.5; Std Dev = 0.251 | −298.1 to −279.2 Avg. = −288.6; Std Dev = 0.230 |
| Tank Pressure (psi) | 33.1 to 33.6 Avg. = 33.3; Std Dev = 0.30 | 100.3 to 101.6 Avg. = 100.9; Std Dev = 0.31 |
| Parameters | Experimental | CFD | |
|---|---|---|---|
| Fixed Initial Conditions | Ptank = 33.0 ± 2.0 psi = 0.9 ± 0.075 | Ptank = 33.0 psi = 0.9 | |
| 31.0 ± 2.0 psi | 33.0 psi | 6.4 | |
| −287.3 ± 1.5 °F | −299 °F | 4.1 | |
| 29.6 ± 2.0 psi | 29.6 psi | -- | |
| −300.0 ± 2.25 °F | −294.0 °F | 2.0 | |
| 17.1 ± 2.0 psi | 16.0 psi | 6.4 | |
| 17.5 ± 2.0 psi | 16.0 psi | 8.6% |
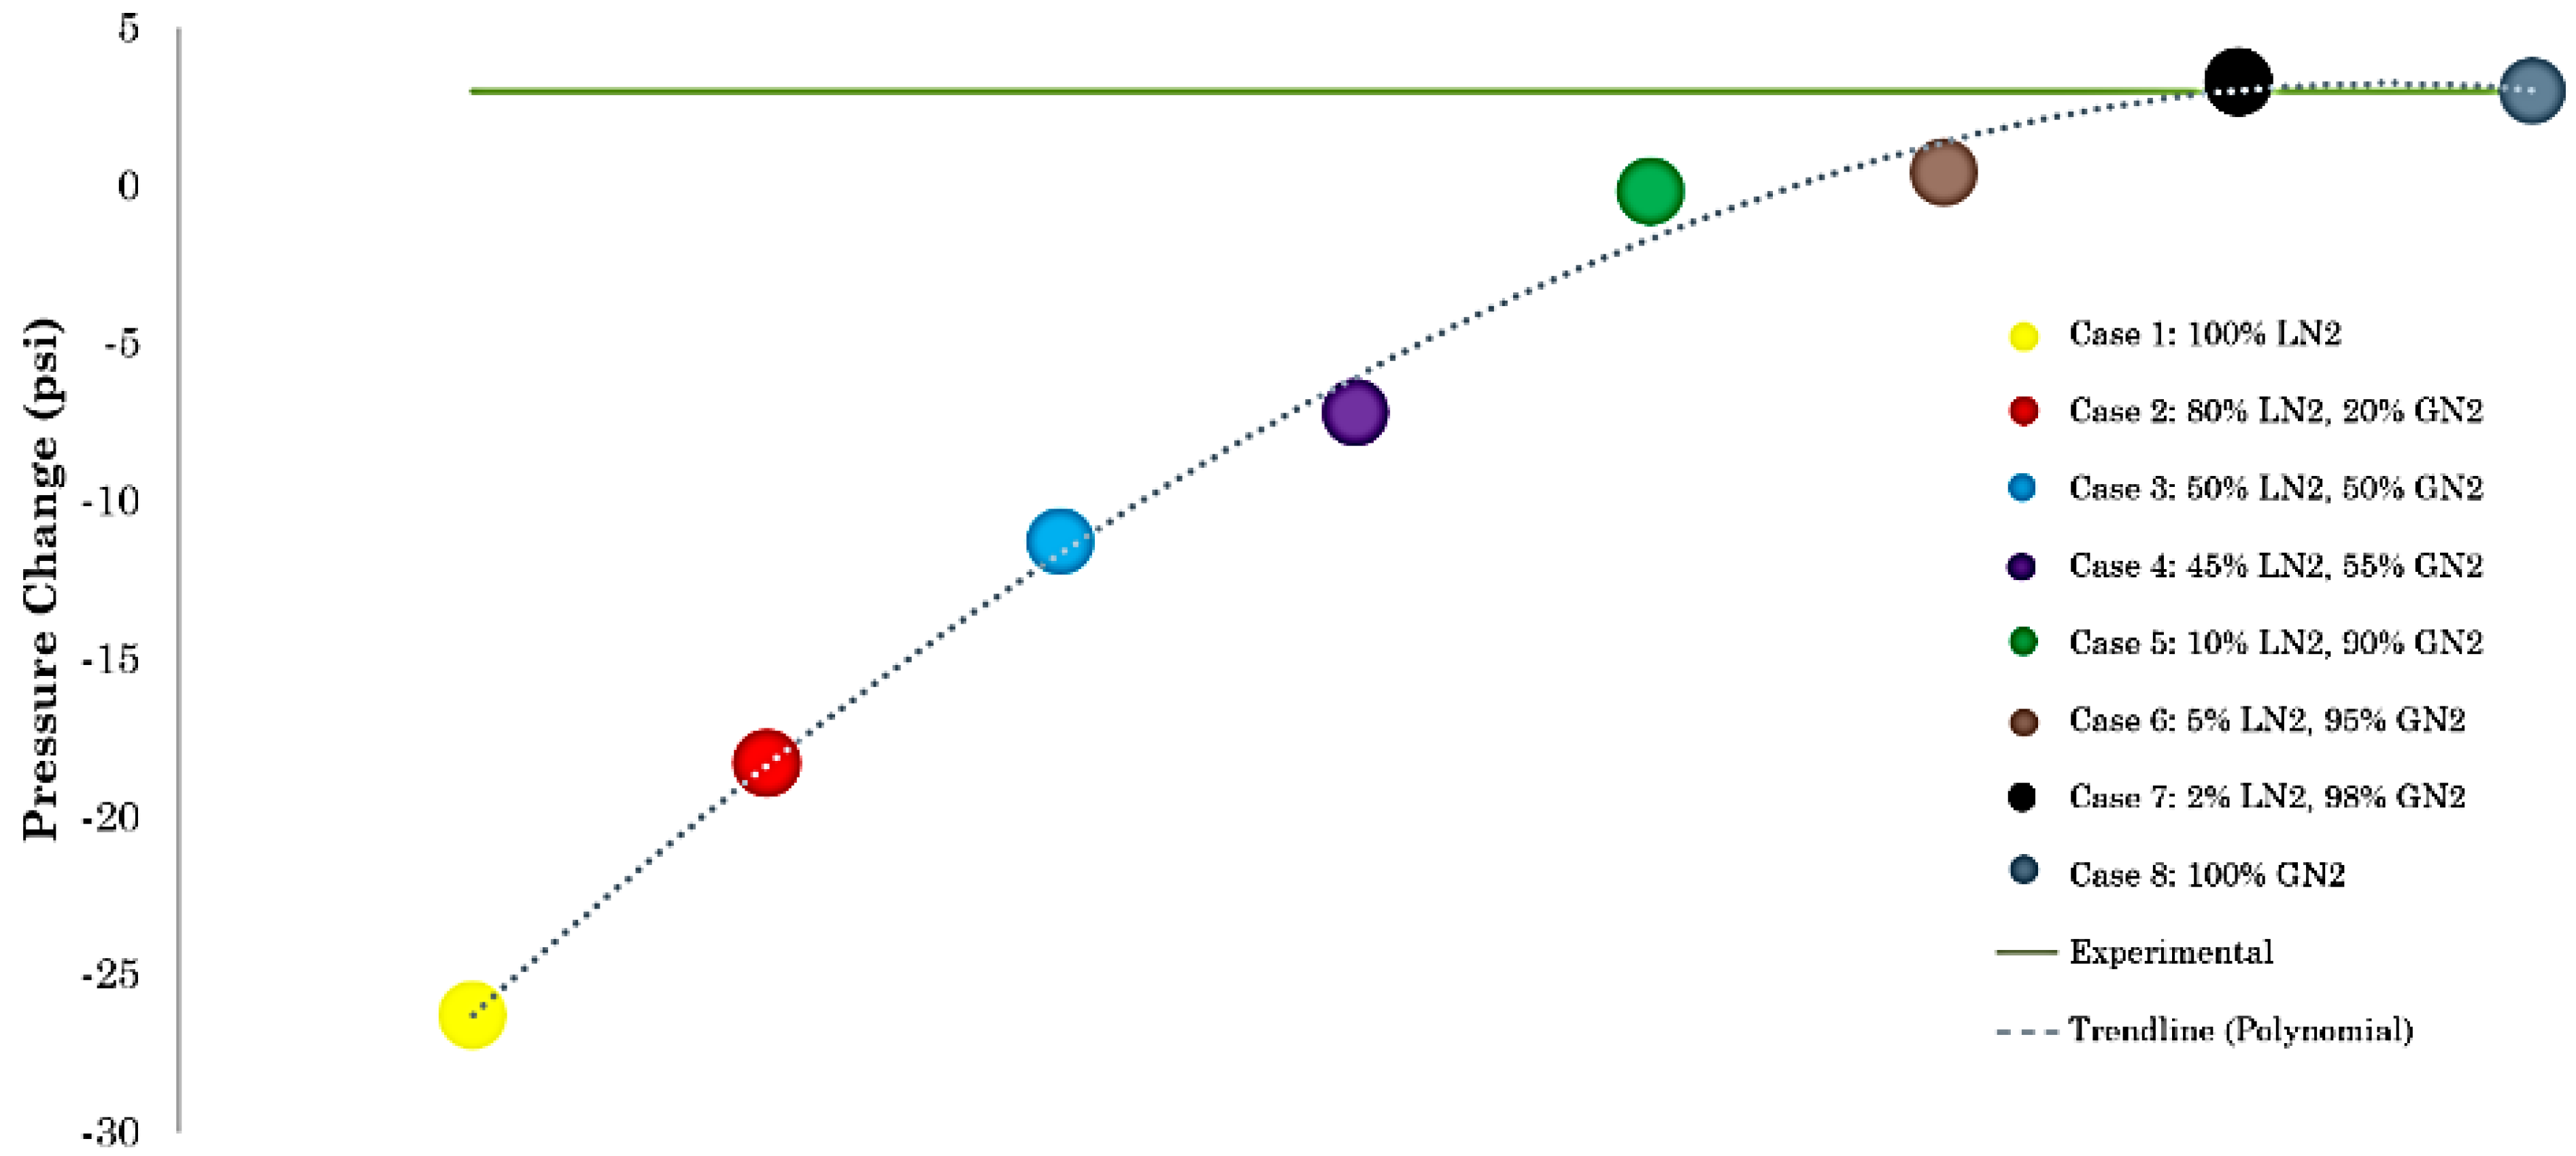
| Cases | Mixture Fractions | ΔPCFD | ΔPExperimental |
|---|---|---|---|
| 1 | 100% LN2 | 26.3 psi (Drop) | 3 psi (~20.7 kPa) (Rise) |
| 2 | 80% LN2, 20% GN2 | 18.2 psi (Drop) | |
| 3 | 50% LN2, 50% GN2 | 11.3 psi (Drop) | |
| 4 | 45% LN2, 55% GN2 | 7.2 psi (Drop) | |
| 5 | 10% LN2, 90% GN2 | 0.2 psi (Drop) | |
| 6 | 5% LN2, 95% GN2 | 0.44 psi (Rise) | |
| 7 | 2% LN2, 98% GN2 | 3.3 psi (Rise) | |
| 8 | 100% GN2 | 3.1 psi (~21.4 kPa) (Rise) |
Disclaimer/Publisher’s Note: The statements, opinions and data contained in all publications are solely those of the individual author(s) and contributor(s) and not of MDPI and/or the editor(s). MDPI and/or the editor(s) disclaim responsibility for any injury to people or property resulting from any ideas, methods, instructions or products referred to in the content. |
© 2025 by the authors. Licensee MDPI, Basel, Switzerland. This article is an open access article distributed under the terms and conditions of the Creative Commons Attribution (CC BY) license (https://creativecommons.org/licenses/by/4.0/).
Share and Cite
Hernandez, I.; Orozco, S.; Hossain, M.A.; Choudhuri, A. Thermal Performance Analysis of LOX/LCH4 Engine Feed Systems Using CFD Modeling. Fluids 2025, 10, 62. https://doi.org/10.3390/fluids10030062
Hernandez I, Orozco S, Hossain MA, Choudhuri A. Thermal Performance Analysis of LOX/LCH4 Engine Feed Systems Using CFD Modeling. Fluids. 2025; 10(3):62. https://doi.org/10.3390/fluids10030062
Chicago/Turabian StyleHernandez, Iram, Salvador Orozco, Md Amzad Hossain, and Ahsan Choudhuri. 2025. "Thermal Performance Analysis of LOX/LCH4 Engine Feed Systems Using CFD Modeling" Fluids 10, no. 3: 62. https://doi.org/10.3390/fluids10030062
APA StyleHernandez, I., Orozco, S., Hossain, M. A., & Choudhuri, A. (2025). Thermal Performance Analysis of LOX/LCH4 Engine Feed Systems Using CFD Modeling. Fluids, 10(3), 62. https://doi.org/10.3390/fluids10030062