Abstract
This study aims to contribute to the optimization of bio-methanation in bubble columns, making it a more viable alternative to stirred tank reactors. The primary challenge to be addressed is the enhancement of mass transfer, which strongly depends on parameters such as bubble size and gas hold-up. Various disperser designs were examined in a 0.14 mm diameter column, comparing their performance in terms of bubble diameter distribution and gas hold-up. The results indicate that an optimized plate disperser featuring a porous structure outperformed other designs by maintaining high gas retention without significant coalescence. Additionally, newly developed plug-in dispersers allowed for counter-current flow operation, enhancing process flexibility. Commercially available porous pin dispersers produced smaller bubbles compared to the other designs, yielding high gas hold-ups at lower gas velocities. Correlations between disperser type and column design parameters were established, laying the foundation for apparatus optimization. The findings contribute to the development of digital twin models, facilitating the refinement of bio-methanation processes within bubble columns for increased efficiency.
1. Introduction
Power to gas is an emerging technology that tackles common problems of renewable energy sources like availability and storability. Energy surpluses are used to produce chemical compounds such as methane. Methane is particularly advantageous due to its high calorific value and compatibility with the existing natural gas infrastructure [1]. Among the available methods, thermochemical methanation has been widely implemented. This process operates at high temperatures (300–550 °C) and relies on nickel-based catalysts to facilitate the conversion of hydrogen and carbon dioxide into methane. However, this approach faces several challenges related to the performance and durability of catalysts [1,2,3,4,5]. For example, nickel-based catalysts are prone to deactivation under fluctuating operating conditions, such as those caused by variable renewable energy inputs. Additionally, issues such as mass transfer limitations, uneven catalyst distribution within the reactor, and thermal stability can hinder process efficiency. These challenges are further compounded by broader concerns, including the availability of raw materials for catalyst production and geopolitical uncertainties [6,7].
An alternative approach to methane production is bio-methanation, also known as anaerobic digestion. This biological process converts organic matter, such as agricultural waste, municipal solid waste, wastewater sludge, or food waste, into methane-rich biogas [8,9,10]. Bio-methanation occurs in the absence of oxygen, facilitated by microorganisms called methanogens, within aqueous solutions at temperatures between 40 and 70 °C. Various reactor concepts from continuous stirred tank reactors (CSTRs), trickle-bed, or biofilm plug flow reactors were developed. Continuous processes thereby show higher methane production rates [10,11,12,13]. Among the various reactor designs used for this process, bubble column reactors have emerged as particularly advantageous for large-scale applications due to their simple construction, low energy requirements, and enhanced mass transfer [14,15,16]. Bubble column reactors facilitate efficient gas–liquid mixing through the interaction of gas bubbles and the surrounding liquid. In the homogeneous regime, bubbles are uniformly distributed, leading to even mixing throughout the column. However, in the heterogeneous regime, larger bubbles rise in the center while smaller ones stay near the walls, creating distinct flow patterns. The transition between these regimes and the performance of the reactor are influenced by factors such as bubble size, gas hold-up, and disperser design [17,18,19,20,21]. In a study by Kougias [22], the efficiency of upflow reactors, CSTRs, and bubble column reactors were compared for biogas upgrading. The reactors, with volumes ranging from 1.2 L to 1.4 L, demonstrated varying performance, with the bubble column reactor achieving the highest conversion rate. Specifically, 84% of the injected H2 was consumed, resulting in biogas with a CH4 content of 73%. By further increasing the recirculation flow rate from 4 L/h to 12 L/h, Kougias demonstrated that higher gas flow rates can significantly improve process efficiency, achieving a CH4 content of 97–98%. Separately, the working group led by Bassani [23] investigated the impact of pore sizes (ranging from 0.4 μm to 2 μm) on the biogas upgrading process using a smaller experimental setup (0.85 L). Their findings highlighted the positive influence of increasing pore size on the diffusion devices, which led to higher mixing rates, enhanced conversion efficiency, and faster reaction kinetics. While smaller bubbles are often considered advantageous for improving mass transfer, this study underscored that the associated losses in mixing power can outweigh the potential benefits. Notably, the bubble sizes produced in their experiments were not determined. Efficient hydrogen transfer into the liquid phase is one of the primary challenges in bio-methanation, as hydrogen is 500 times less soluble in water than carbon dioxide. Previous investigations, such as those by Jensen [24], have demonstrated that conventional venturi-type, bottom-fed injection systems often produce large bubbles (~10 mm diameter), resulting in insufficient mass transfer and limited hydrogen consumption, with only 62% of the injected hydrogen being utilized. By reducing bubble size to ~2.5 mm, they observed enhanced mass transfer due to increased surface area and retention time, significantly improving hydrogen utilization. However, their system relied on a stirrer to shear the bubbles into smaller sizes, introducing trade-offs between mixing efficiency, energy consumption, and potential damage to microorganisms from excessive shear forces. On a pilot scale, Ngu [25] investigated bio-methanation in a larger setup, where two different dispersers were tested. Their research emphasized the critical role of bubble size, as H2 mass transfer was identified as the limiting factor. By decreasing the bubble size from 3 to 5 mm to 2 mm, efficiency increased by 81% in CH4 purity. For the biological methanation process, a uniform porous plate was favored due to its ability to produce smaller bubbles and improve mass transfer. However, their findings also revealed that using a single disperser in industrial applications is insufficient for achieving optimal gas distribution. They suggested that a combination of different disperser types could provide better performance.
These findings collectively highlight the importance of disperser design in optimizing gas–liquid systems, particularly in bubble columns. While Kougias and Bassani demonstrated the significance of recirculation flow rates, pore sizes, and mixing power in improving process efficiency, Jensen et al. emphasized the limitations of conventional venturi systems and the trade-offs introduced by mechanical shearing to reduce bubble size. Ngu further highlighted the critical role of bubble size and disperser configuration in enhancing mass transfer and achieving higher CH4 purity. Together, these studies underscore the necessity of investigating novel disperser designs and combinations to achieve the best possible gas distribution and mass transfer efficiency, forming the focus of the present study.
The air/water system, widely recognized in chemical engineering for its hydrodynamic similarity to liquids used in bio-methanation processes, provides valuable insights into bubble formation and disperser design [26,27,28]. The physical processes of bubble formation, size control, and gas hold-up—primarily governed by gas velocity, disperser design, and liquid properties—can be effectively studied in an air/water system, where fluid mechanics drive these phenomena, enabling extrapolation to bio-methanation environments with appropriate scaling and adjustments for gas properties [12,13]. Many established empirical correlations in chemical engineering between air/water systems and other gas/liquid systems provide a solid foundation for making these extrapolations [26,27,29]. Thus, the results of this study should be viewed as a critical first step in reactor design and optimization, focusing on hydrodynamics and disperser efficiency before introducing the complexities of biochemistry
1.1. General Disperser Design
The choice of gas disperser is crucial in determining bubble size and distribution, both of which directly influence the reactor efficiency. Plate dispersers are known for their ability to evenly distribute the bubbles but they often require additional structural support in larger reactors due to the weight of the liquid, leading to higher costs. In contrast, pipe dispersers, while less expensive and structurally simpler, may fail to cover the entire cross-sectional area of the reactor, resulting in potential inefficiencies in gas distribution [30,31,32,33,34,35]. To overcome these challenges, innovative disperser designs such as porous dispersers and advanced materials like 3D-printed structures are being explored to enhance performance and reduce operational costs [36,37].
Studies using X-Ray tomography have demonstrated that disperser design affects not only bubble formation at the reactor’s base, but also the overall flow dynamics within the column. Möller et al. [38] demonstrated that, depending on the sparger design, flow dynamics varied across four distinct heights (0.1 ≤ h/D ≤ 7.0) within the column. Finer spargers led to a more uniform distribution throughout the reactor, while coarse spargers enhanced mixing in the sparger zone. This enhanced mixing led to higher liquid circulation velocities and increased bubble breakup rates. Therefore, sparger design must be tailored to meet the specific needs of the intended reaction, balancing bubble formation with mixing efficiency.
1.2. Plates with Holes
Plate dispersers are widely recognized for their simplicity and extensive use in industrial applications. Critical design parameters, such as pore size and free area, have been established to prevent weeping—a phenomenon where insufficient gas velocity allows liquid to seep into the gas chamber beneath the plate. Research by Kulkarni et al. shows that plate dispersers with pore diameters of 1 mm and a free area below 1% mitigate weeping by ensuring that the kinetic energy of the gas overcomes the surface tension and hydrostatic pressure [32,39]. The dynamics of bubble formation at the disperser interface involve gas transitioning through the pores into the liquid medium. At lower gas flow rates, bubble formation and release occur intermittently, allowing for their easy escape due to a lower frequency of formation. Conversely, elevated flow rates induce a vigorous bubble generation mechanism, characterized by departing bubbles drawing gas trails, culminating in a ‘jet gas’ phenomenon. This leads to their disintegration into finer bubbles. The shift from discrete bubble generation to jet gas formation is quantifiable through the Weber number, derived from Equation (1), incorporating hole diameter and dispersed phase density. A Weber number of two or above signifies surpassing the transition threshold. This principle is particularly advantageous in industrial applications demanding higher efficiency, as it enables the generation of smaller bubbles, thereby maximizing the total surface area for gas–liquid interaction. Additionally, the Weber number serves as a metric for determining the optimal gas velocity to fully activate all pores in a plate disperser [40].
At low gas velocities, the initial bubble diameter is considered to be a function of the orifice diameter, while at larger gas velocities, the dependency is reversed [35,40,41,42]. As the gas tends to follow the path of least resistance, opening a single pore requires less energy compared to initiating the opening of a subsequent pore. Consequently, there is a higher likelihood for the gas to overcome the hydrostatic pressure at the points where the pores have already been opened, leaving the other pores unaffected. This asymmetry in pore opening leads to an augmented gas flow through the opened pores, thereby contributing to an increase in the bubble diameter [43].
1.3. Porous Dispersers Description
Plates and stones with porous structures generate bubbles ranging in size from several millimeters to 3 cm in diameter, depending on the pore size and superficial gas velocity [35]. Smaller bubbles promote a more homogeneous flow, whereas larger bubbles enhance large-scale mixing along the column height. This makes such dispersers particularly suitable for processes that require fine bubble generation and uniform mixing [44]. These dispersers can be manufactured from a wide range of materials, including sintered glass, metals, and metal alloys such as aluminum oxide, titanium, nickel, and Hastelloy [45]. Additionally, materials like acrylic fibers (e.g., polypar), refractory bricks, and ceramics are commonly used, offering varying levels of durability and chemical compatibility for diverse gas–liquid applications [46].
1.4. Gas Hold-Up Correlations
Gas hold-up, a measure of the volume of gas relative to the total volume of gas and liquid, is influenced by column design, fluid properties, and gas velocity. It provides an indication of the interfacial area of mass transfer, which is critical in bio-methanation processes. Relevant correlations and models predicting bubble size and gas hold-up for various reactor designs are summarized in Table 1.

Table 1.
Relevant hold-up correlations for this work [29].
1.5. Bubble Size Correlations
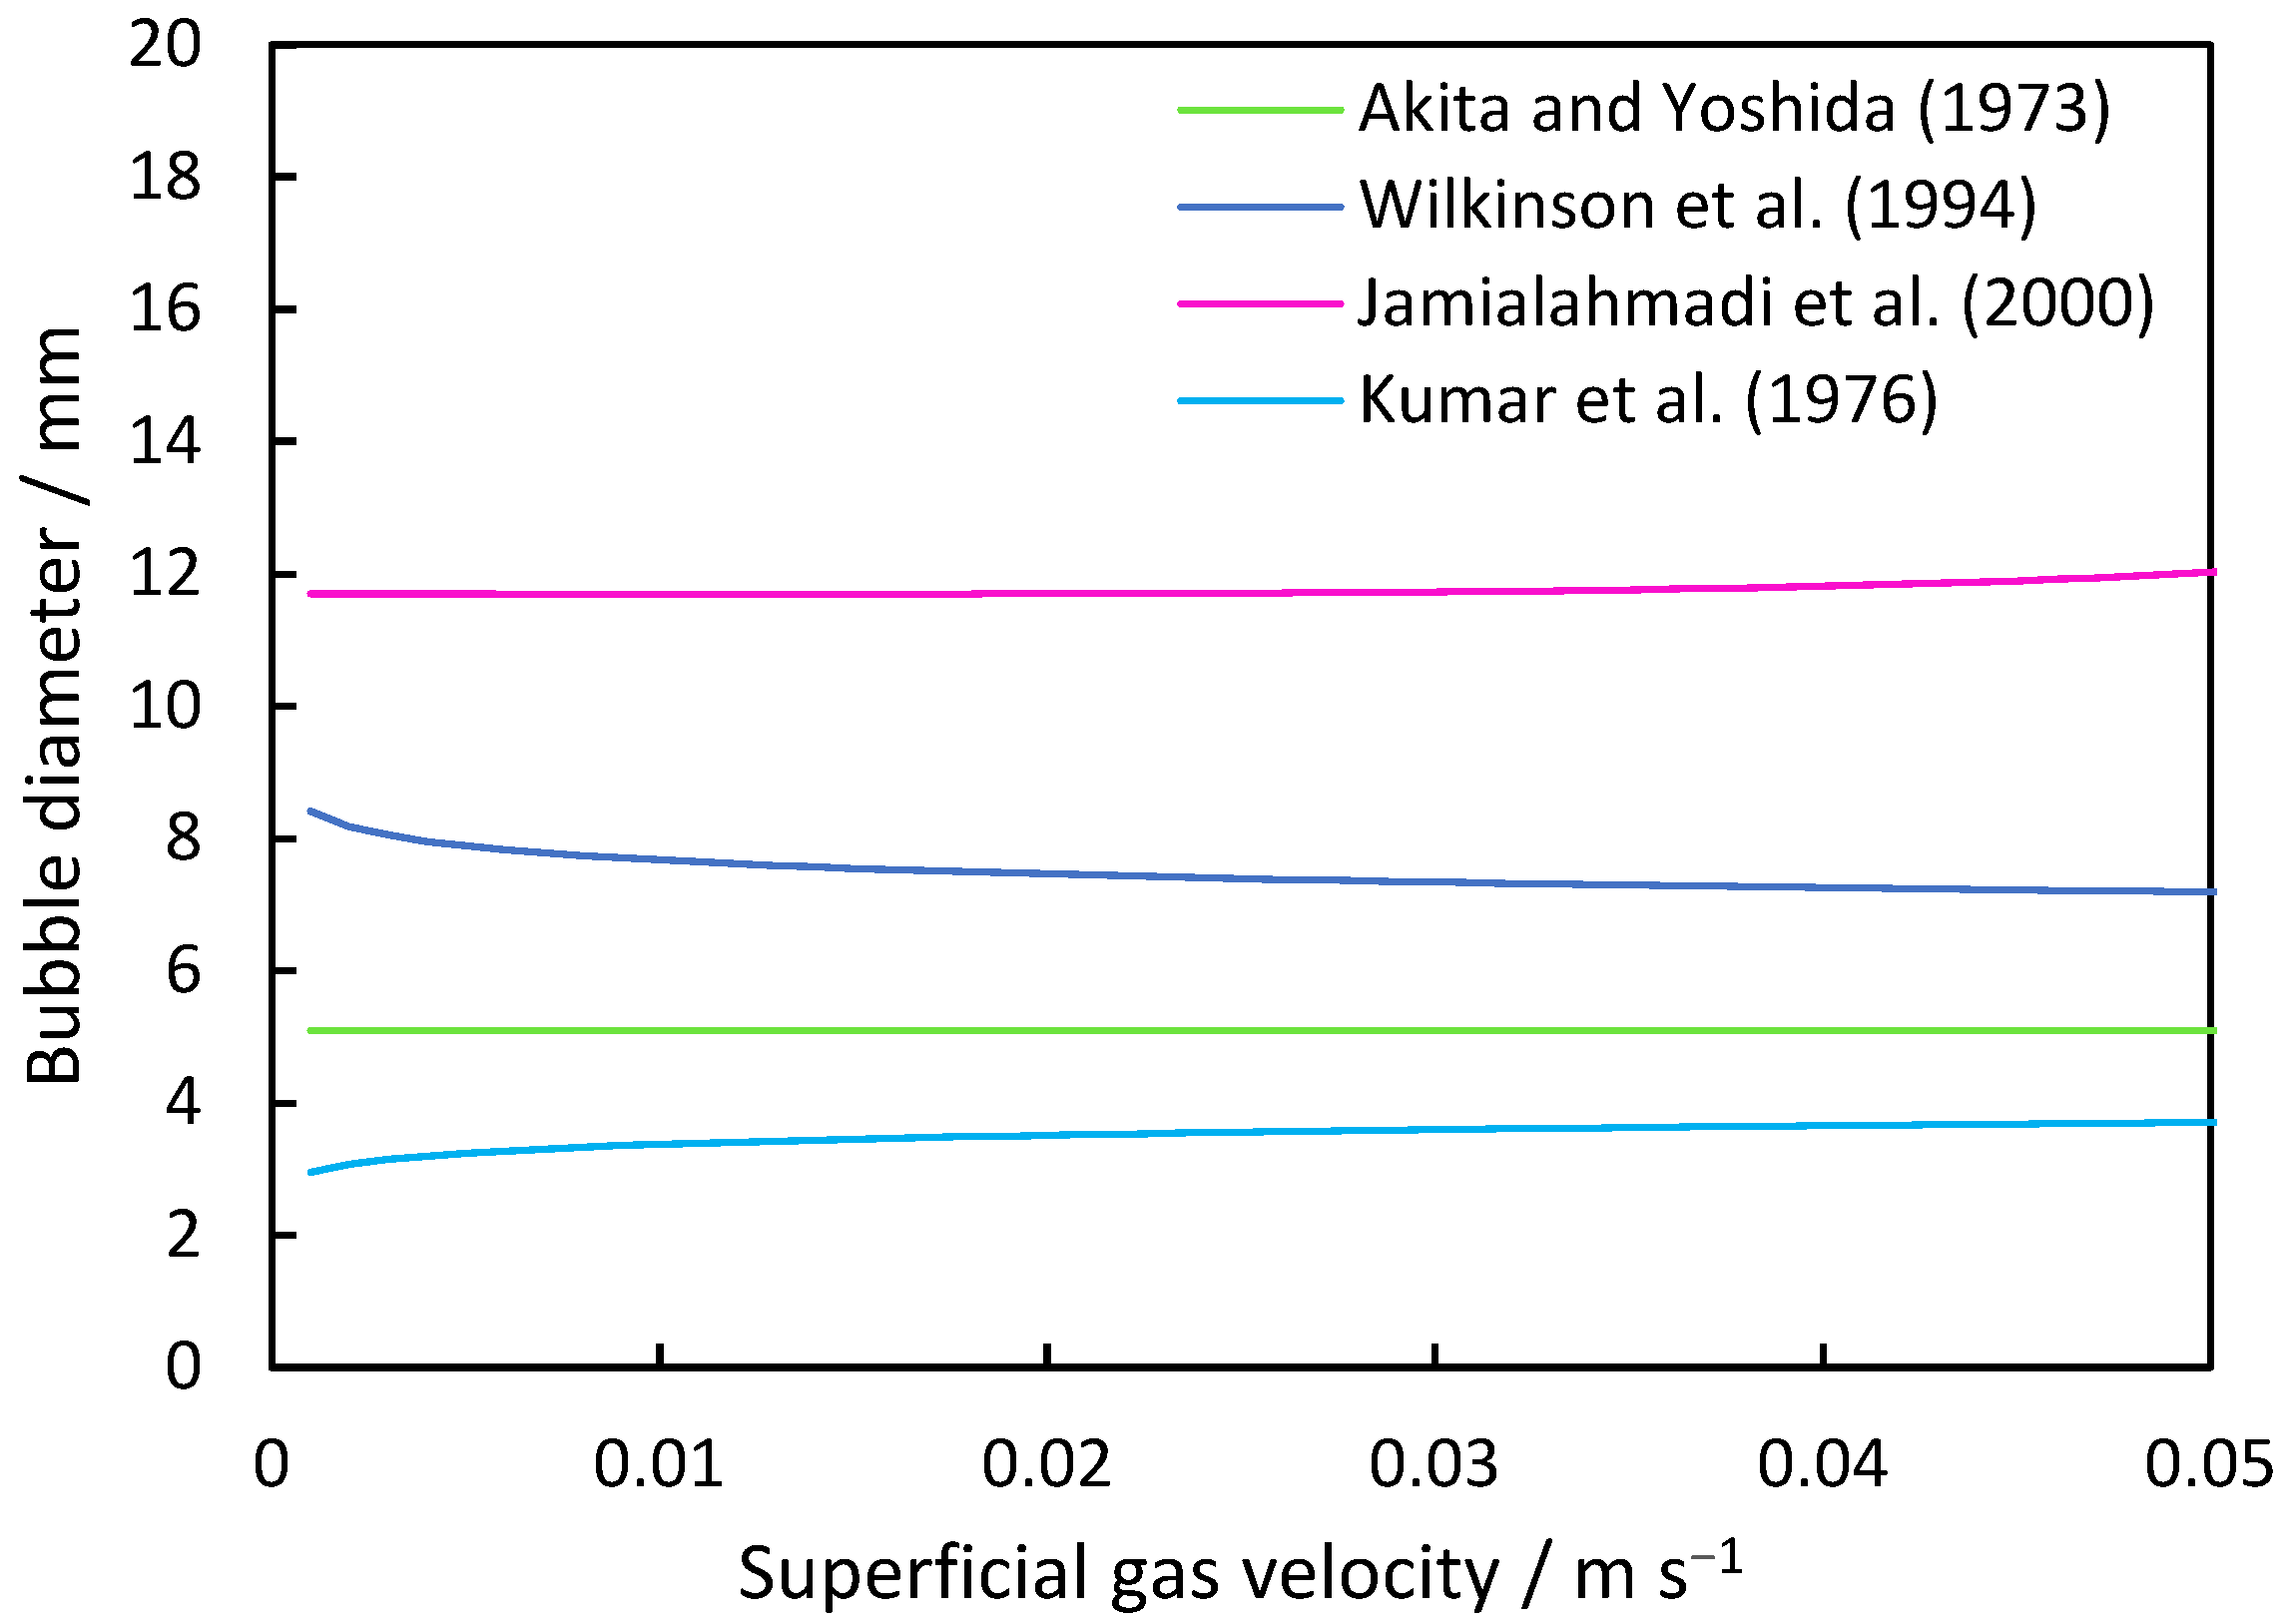
The fundamental derivations for the prediction of bubble sizes within column systems are summarized in Table 1. Figure 1 illustrates the trends of these equations for an air/water system. Akita and Yoshida [47] formulated Equation (6), which considered surface tension and viscosity, specifically tailored for a bubble column with a single-hole disperser. Wilkinson et al.’s [48] Equation (7) accommodates systems operating at elevated pressures, factoring in the increasing gas density to determine the mean bubble size. The experimental setup involved a ring with 19 holes of 10 mm as the disperser. Jamialahmadi et al. [49] derived Equation (8) based on experiments conducted across various column geometries capable of predicting gas hold-up and the transition between homogeneous and heterogeneous regimes. To determine the mean bubble size, the model incorporates the initial diameter into its calculations. Similarly to Jamialahmadi et al., Kumar et al. [50] also considered the initial bubble diameter for their model (Equation (9)), utilizing dispersers in conical form with replaceable plates. The pore sizes ranged from 0.87 to 3.1 mm in their experiments.
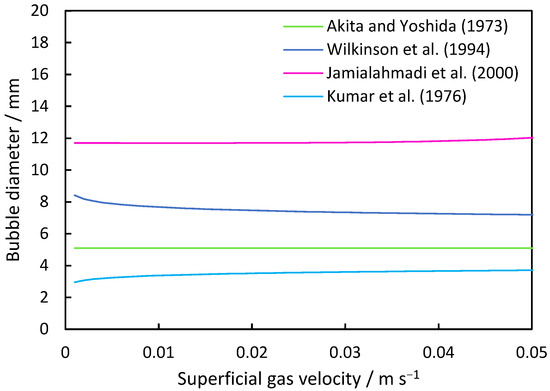
Figure 1.
Average bubble size inside the column based on correlations between a disperser hole diameter of 1 mm and 144 holes and the air/water system.
Correlations for the average bubble diameter are shown in Table 2. While Equation (7) of Wilkinson et al. shows a decreasing trend in the average bubble size from 8.1 mm at a superficial gas velocity of 0.001 m s−1 to 7.2 mm at 0.05 m s−1, the equation of Jamialahmadi et al. shows an increasing trend for the investigated range. The equation of Krishna und Ellenberger includes a change in the sizes due to the transition regime. First, a decrease from 8.7 mm at 0.001 m s−1 superficial gas velocity to 1.4 mm at a superficial gas velocity of 0.029 m s−1 is observed, while it increases from this point to values larger than 20 mm. The equations of Akita and Yoshida show a quasi-constant trend at 5 mm. The Kumar et al. equation shows an increase from 3 mm to 3.9 mm bubble size, respectively.

Table 2.
The literature correlations to determine the average bubble size inside the column.
1.6. Aim of This Work
This study addresses the challenges of mass transfer in bio-methanation by investigating tailored disperser designs to optimize key hydrodynamic parameters, such as bubble size, bubble size distribution, and gas hold-up. The aim is to achieve efficient mixing and mass transfer through bubble dynamics alone, eliminating the need for mechanical stirring. While previous research has underscored the importance of flow rates and pore sizes, our approach takes one step further by customizing disperser configurations to the unique solubility and mixing requirements of individual gases, particularly hydrogen and carbon dioxide. This tailored approach seeks to enhance the overall efficiency and scalability of bio-methanation reactors.
Most existing studies typically operate at low gas flow rates (around 1 L min−1), which often limits the understanding of bubble formation and behavior at higher flow rates. In this work, we aim to explore the impact of elevated gas flow rates on bubble dynamics, focusing on how these conditions affect bubble formation, size distribution, and gas hold-up in the column. By using the air/water system as a benchmark, we compare various disperser designs and their effects on hydrodynamic phenomena, providing new insights into optimizing mass transfer for bio-methanation processes. The findings contribute to the development of more sustainable and energy-efficient power-to-gas technologies, paving the way for improved reactor designs and operational strategies.
2. Materials and Methods
A transparent acrylic glass pipe (purchased from Transparentdesign (4040 Linz, Austria), inner diameter of 140 mm, wall thickness of 5 mm, and height 2000 mm) was installed. The column base was designed to hold a plate disperser or be sealed with a base plate for other disperser configurations. For experiments involving the plate disperser, a gas chamber matching the column dimensions was installed beneath it. The column was filled with deionized water (temperature: 20 °C ± 1; density: 998.2 kg m−3; surface tension: 72.8 mN m−1; and viscosity: 1.003 mPa s) to a height of 1.5 m from the base.
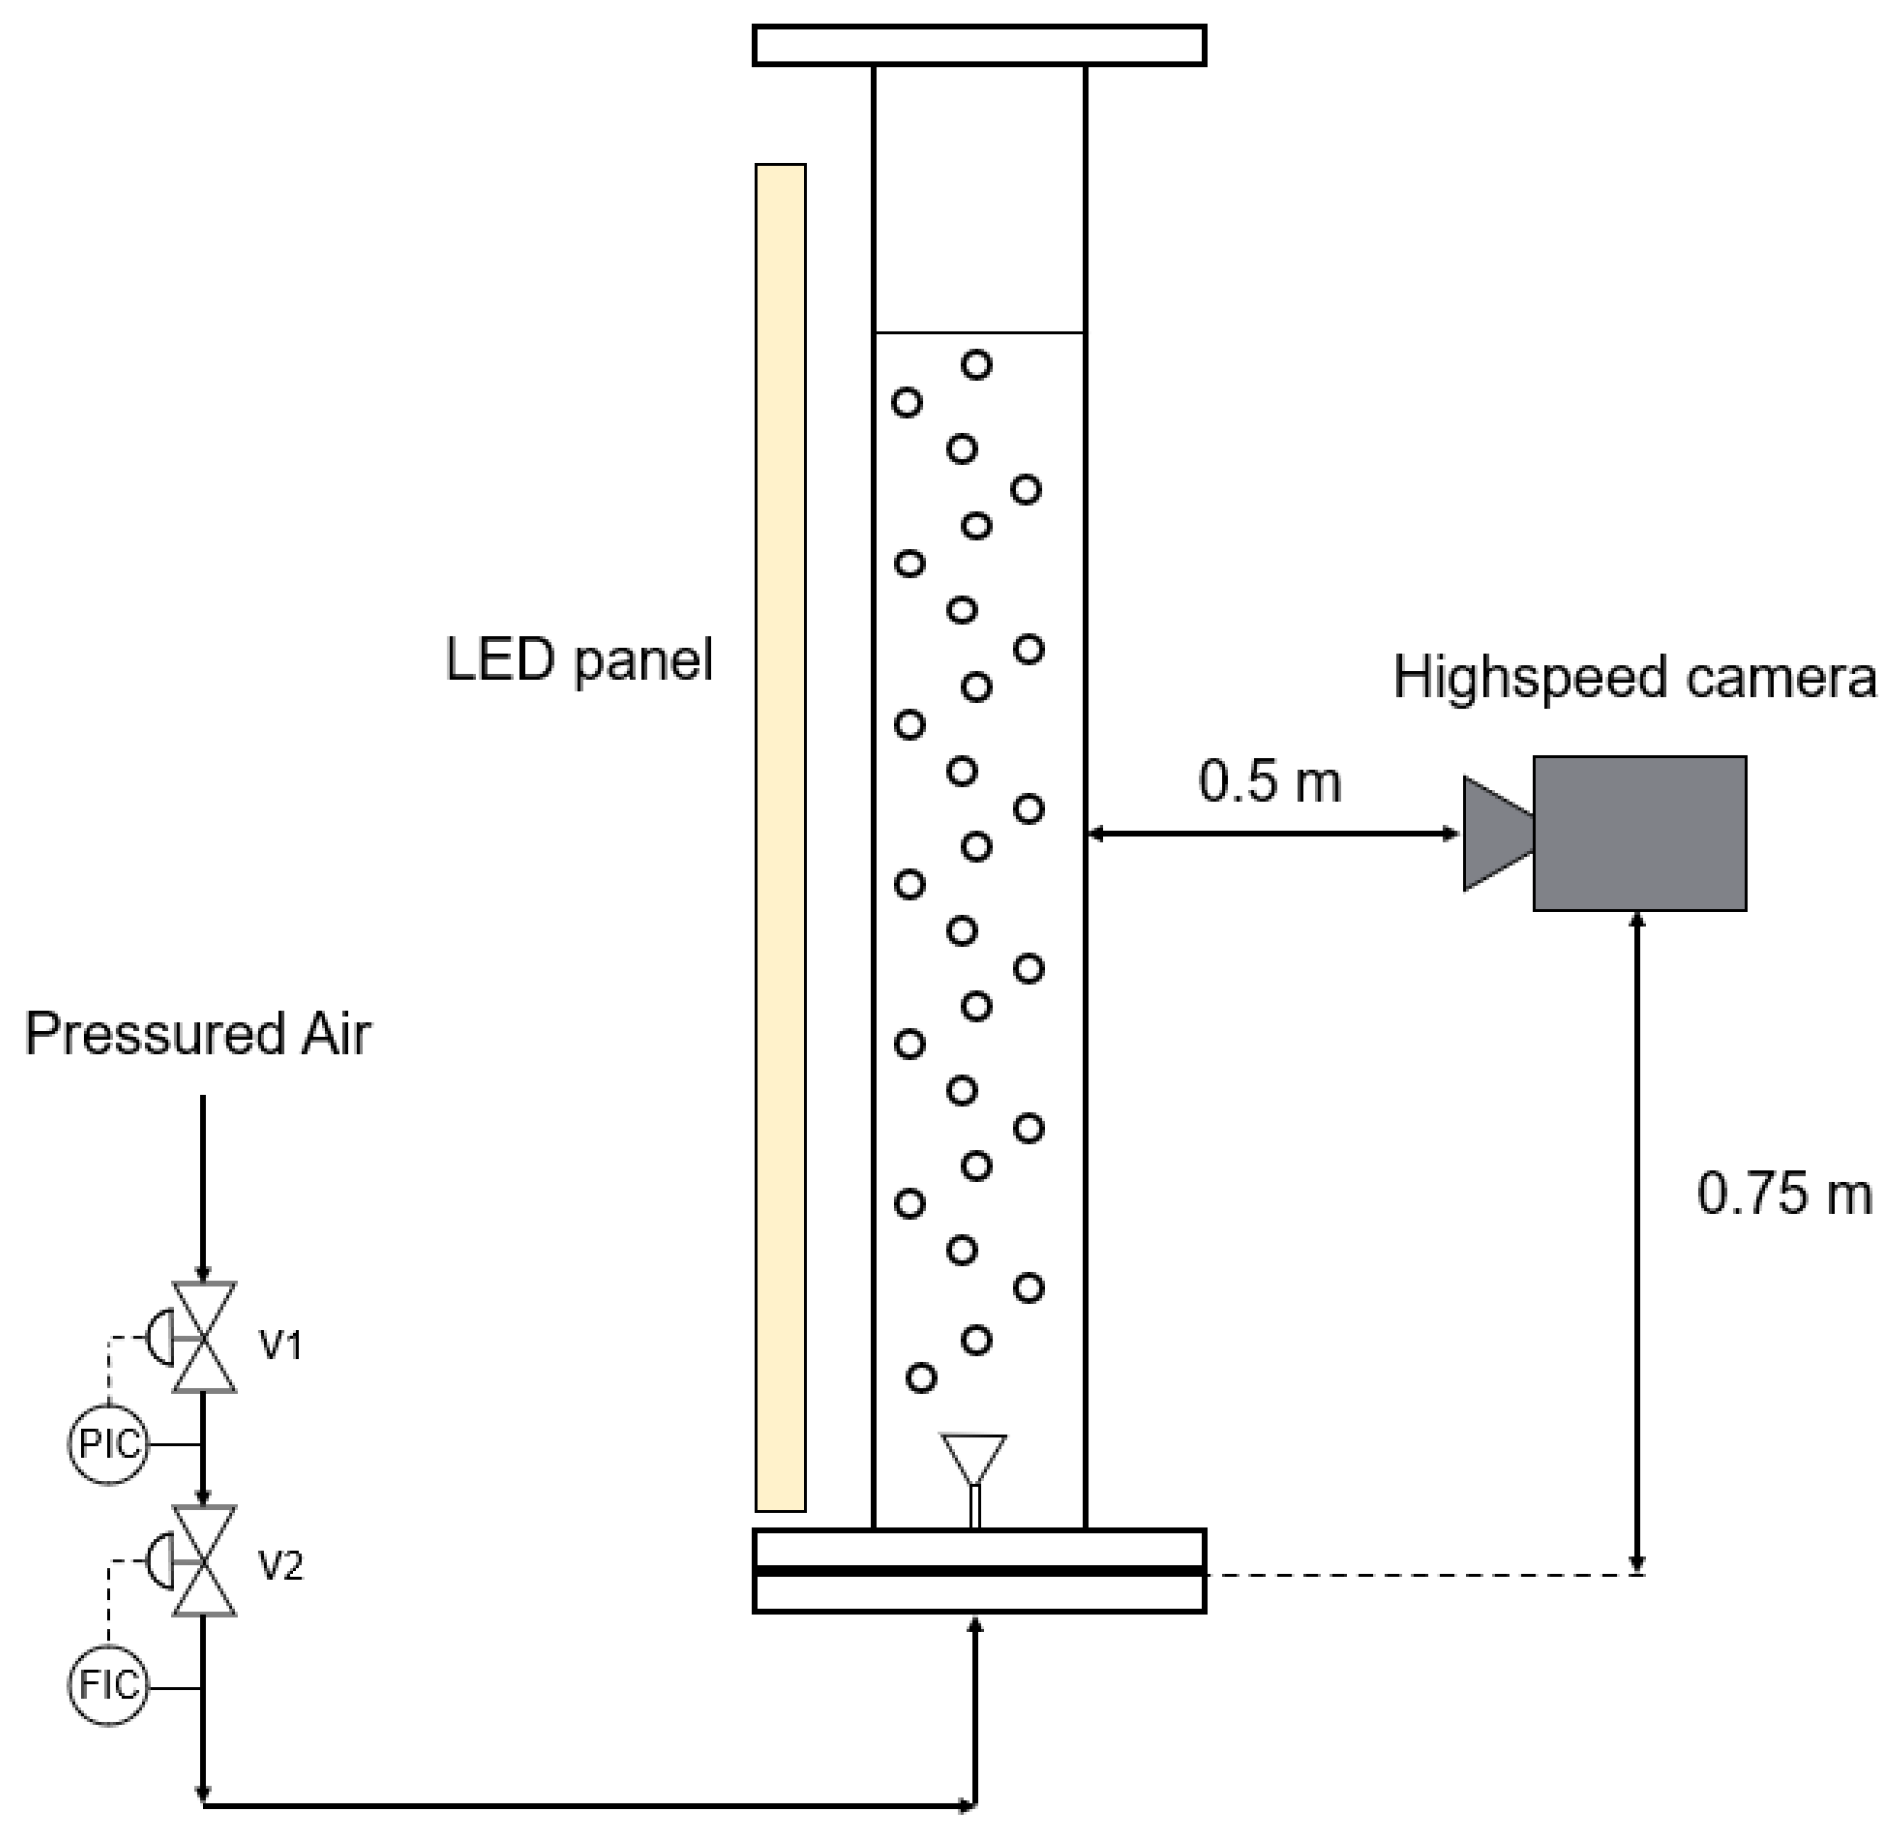
Gas flow rates of 1; 5; 10; 20; 30; 40; and 50 L min−1 were tested and bubble size was captured using a high-speed camera (model: OS-X8-S2; shutter speed: 1000 f/s; Venus Laowa Obiettivo 60 mm, f/2.8). Measurements were conducted using the open-source program Fiji [51], with 400 bubbles measured per flow rate to calculate the average diameter and standard deviation. The setup positioned the high-speed camera in front of the bubble column, illuminated by an LED panel positioned behind it. The camera was precisely placed at the middle of the filling height and focused on the center of the column (Figure 2). During the experiment, the disperser under study was centrally installed, and the column was filled with deionized water up to a height of 1.5 m. Gas flow was initiated, with regulation performed using a digital flow meter (Brooks Instruments; SLA5850S1GAB1C2A1; flowrate range for air 0–50 L min−1).
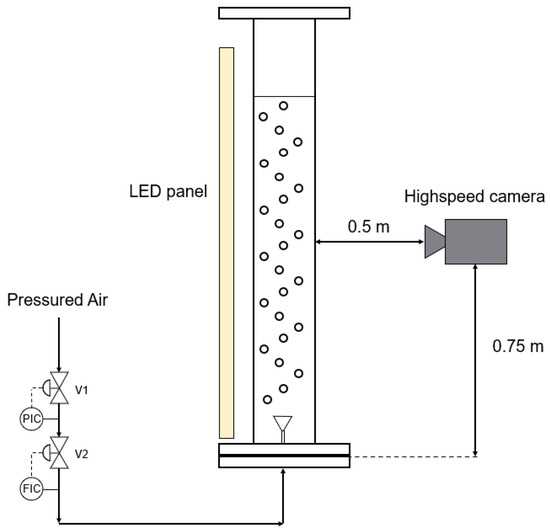
Figure 2.
Experimental arrangement for measuring bubble diameters involved positioning a high-speed camera in front of the bubble column, with an LED panel situated behind it serving as the light source.
Additionally, gas hold-up was determined by measuring surface level changes at different gas flow rates.
Disperser Designs
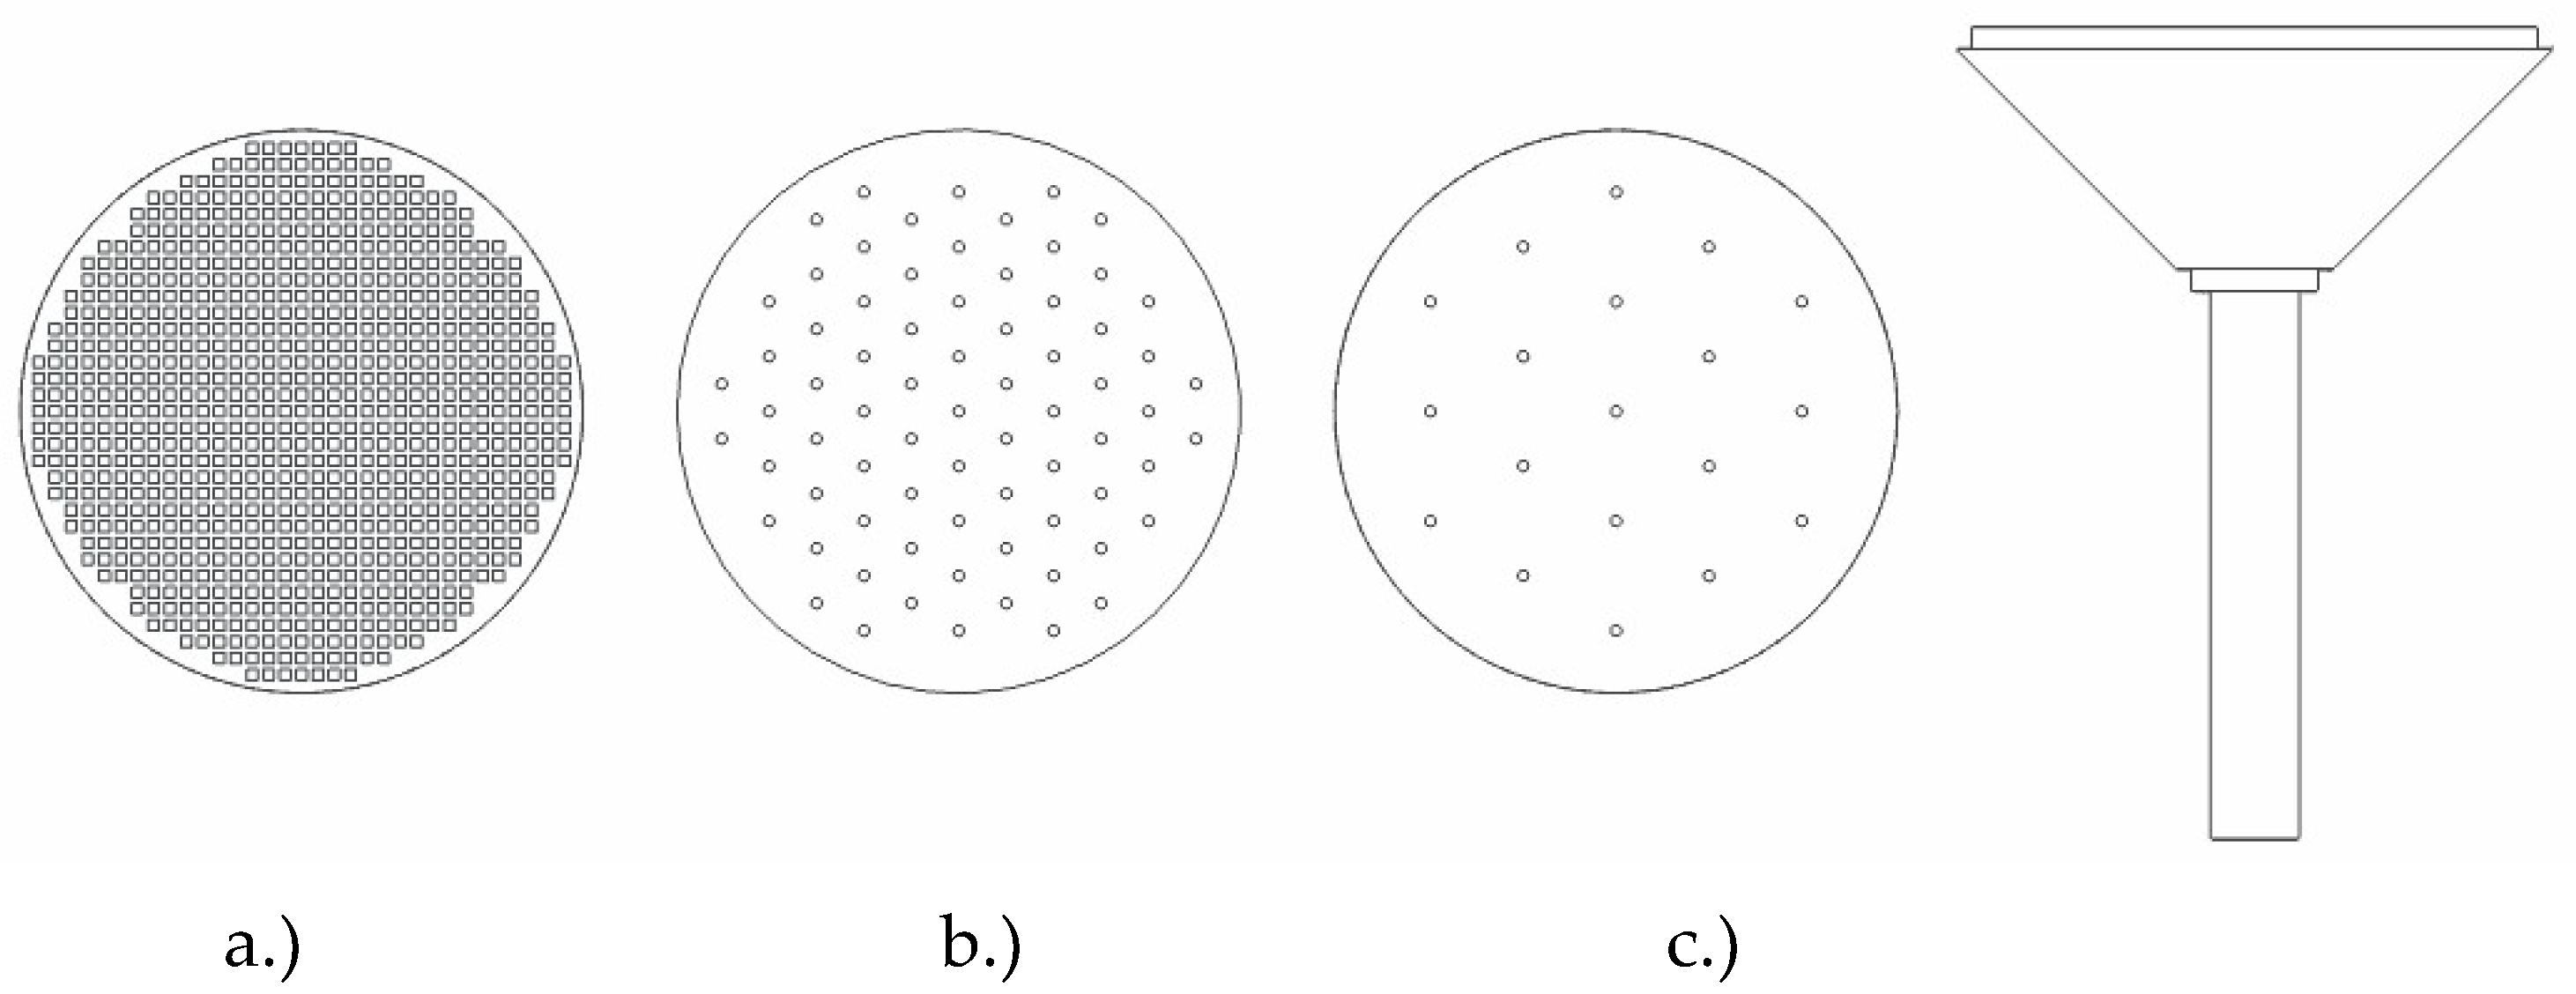
Following general design principles for dispersers, three disperser variants, designed to occupy partial column cross-sections and be attachable at the bottom plate, were experimentally compared to each other. These dispersers are hereafter referred to as plug-in dispersers. Additionally, a plate disperser was designed, and commercially available porous dispersers were investigated and compared to the plug-in dispersers. The plug-in dispersers (Figure 3) differ in their hole arrangements: disperser a.) mimics a porous plate with 818 holes of 1 mm diameter, disperser b.) has 85 holes with 5 mm spacing, and disperser c.) has 19 holes with 10 mm spacing. Their gas activation criteria were calculated as 0.725 m s−1, 0.054 m s−1, and 0.022 m s−1, respectively. The key data are given in Table 3.
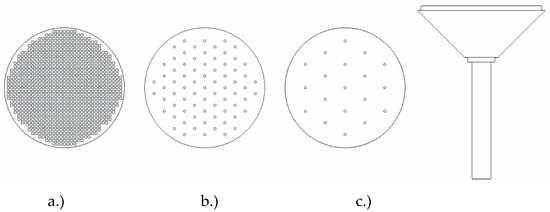
Figure 3.
Design configurations for the plug-in disperser include a.) square pores featuring a 40% open area, b.) circular pores with 1 mm diameter and 5 mm spacing, and c.) circular pores with 1 mm diameter but with a 10 mm inter-pore center distance. The disperser head has a diameter of 50 mm and total height of 80 mm.

Table 3.
Design parameter for the plug-in and plate dispersers.
The plate disperser features an open area of 0.7%, with 144 holes of a 1 mm diameter. The ≥ 2 is reached at a superficial gas velocity of 0.108 m s−1, which was never reached in this investigation. Underneath the plate, a porous structure was considered to achieve a homogenous pressure loss and the distribution of bubble generation across the plate.
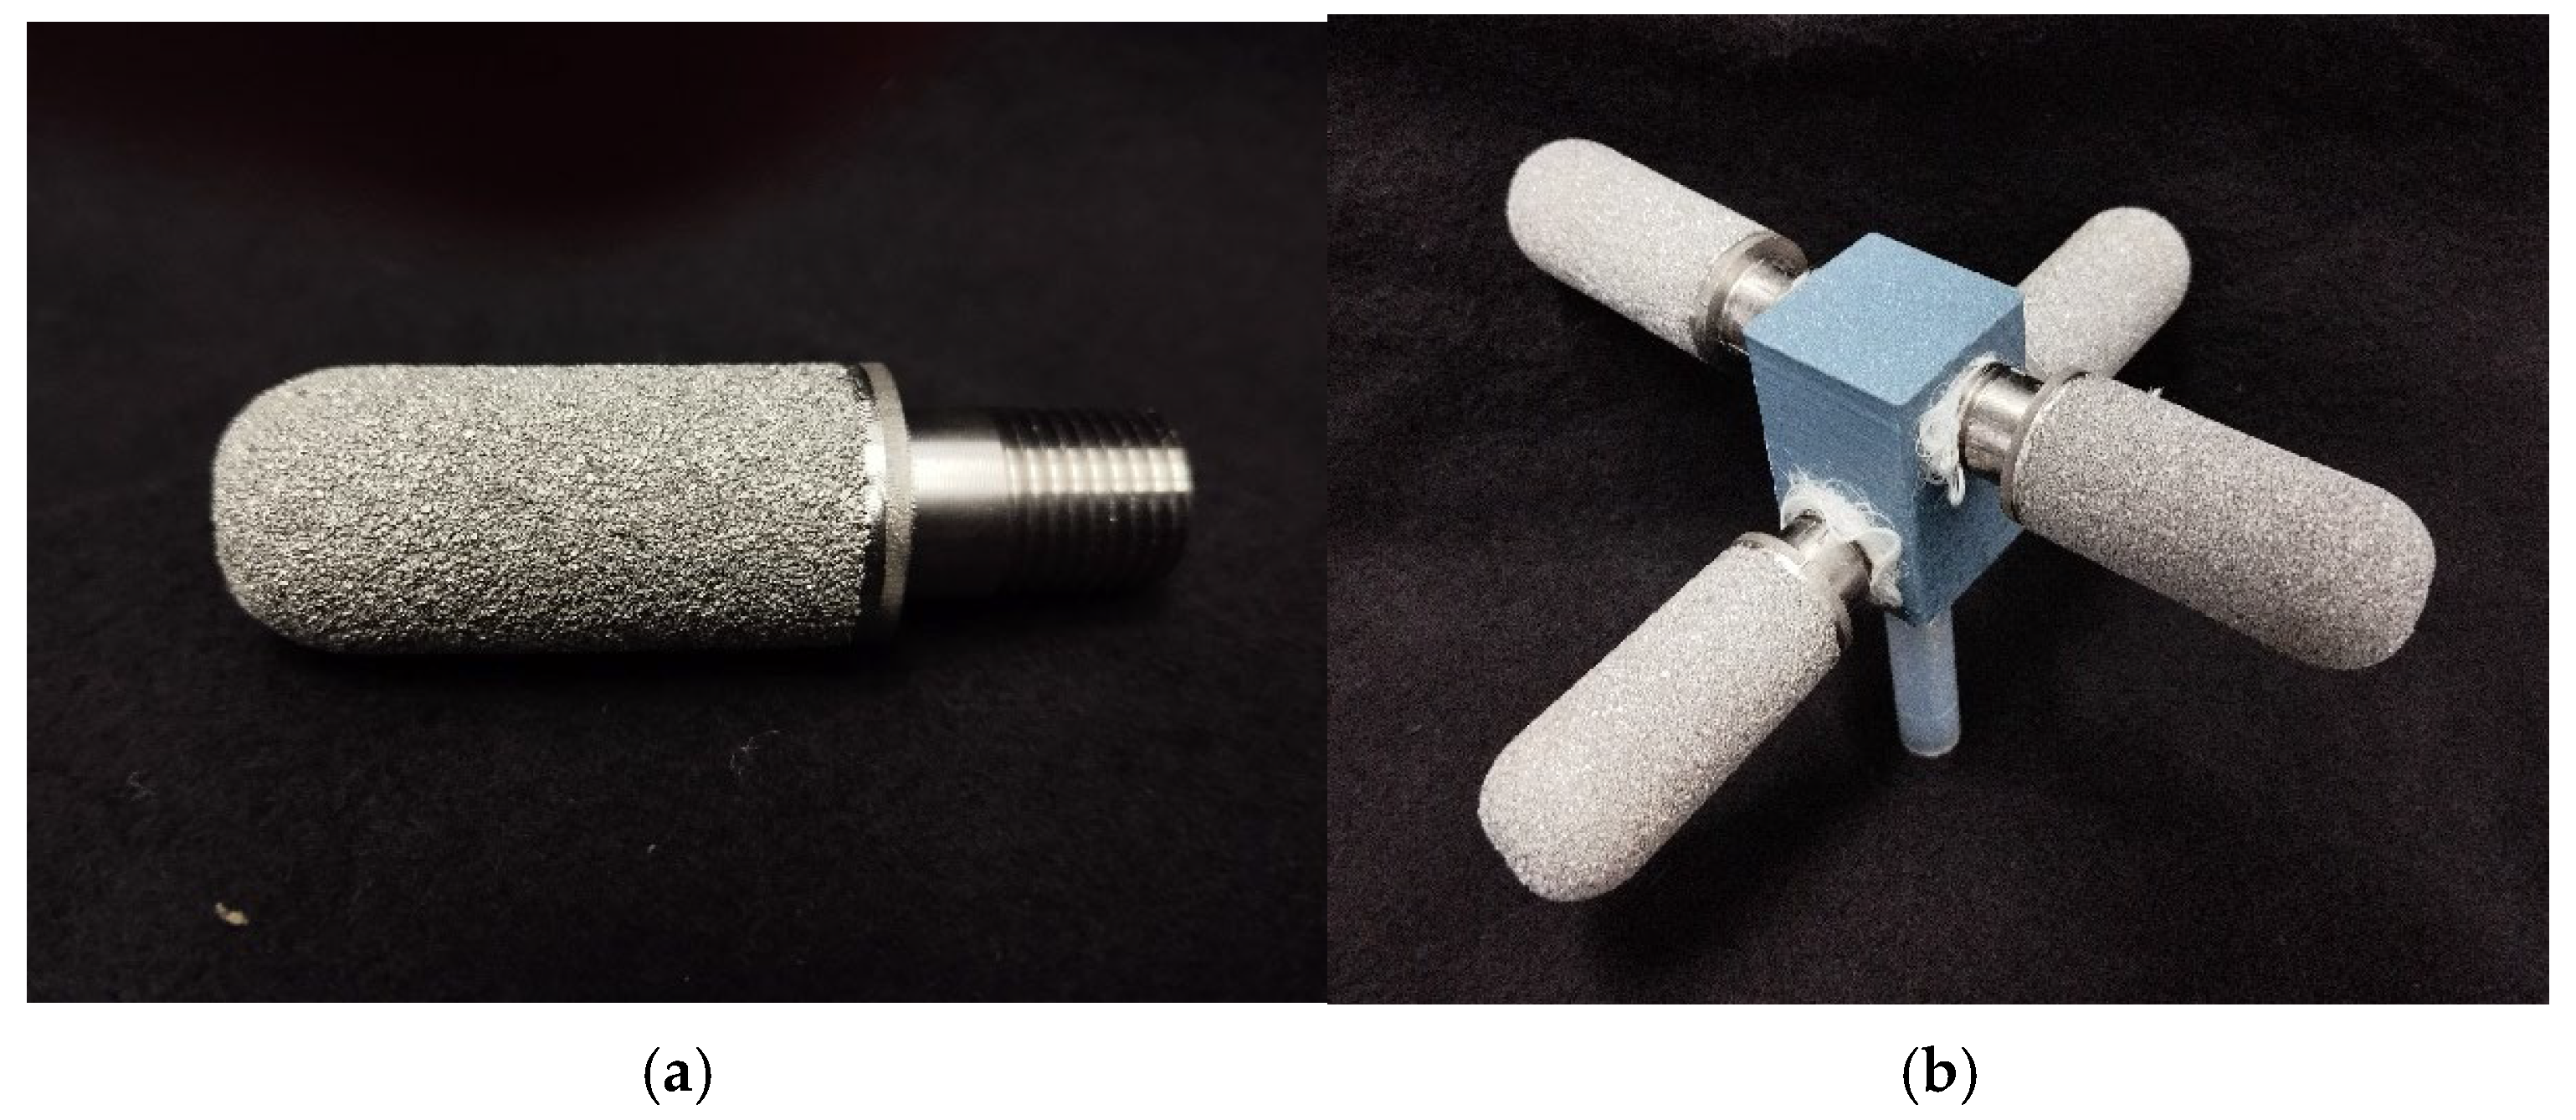
Porous pin dispersers made of sintered titanium, with pore sizes of 1 μm and 50 μm, were also evaluated (from Shijiazhuang Jintai Purification Equipment Co., Ltd., Shijiazhuang, China). To study their behavior, the dispersers were mounted in a custom 3D-printed bracket (Figure 4). For each pore size, a configuration was designed where the four dispersers were arranged at 90° intervals. The plug-in and plate dispersers were manufactured using 3D printing and CNC milling, offering significant flexibility. This rapid prototyping approach allows for easy design adjustments, making it an efficient alternative to traditional manufacturing methods.
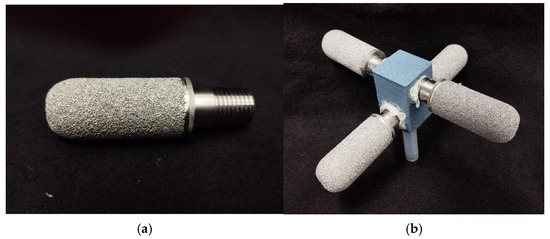
Figure 4.
(a) The porous pin disperser (50 μm) influenced the development of the bracket design through its significant length. (b) Shows the assembled disperser, which prevents any contact with the column wall. A single pin has a length of 60 mm, and installed all together the total length is 140 mm with a height of 80 mm.
3. Results and Discussion
3.1. Bubble Diameter
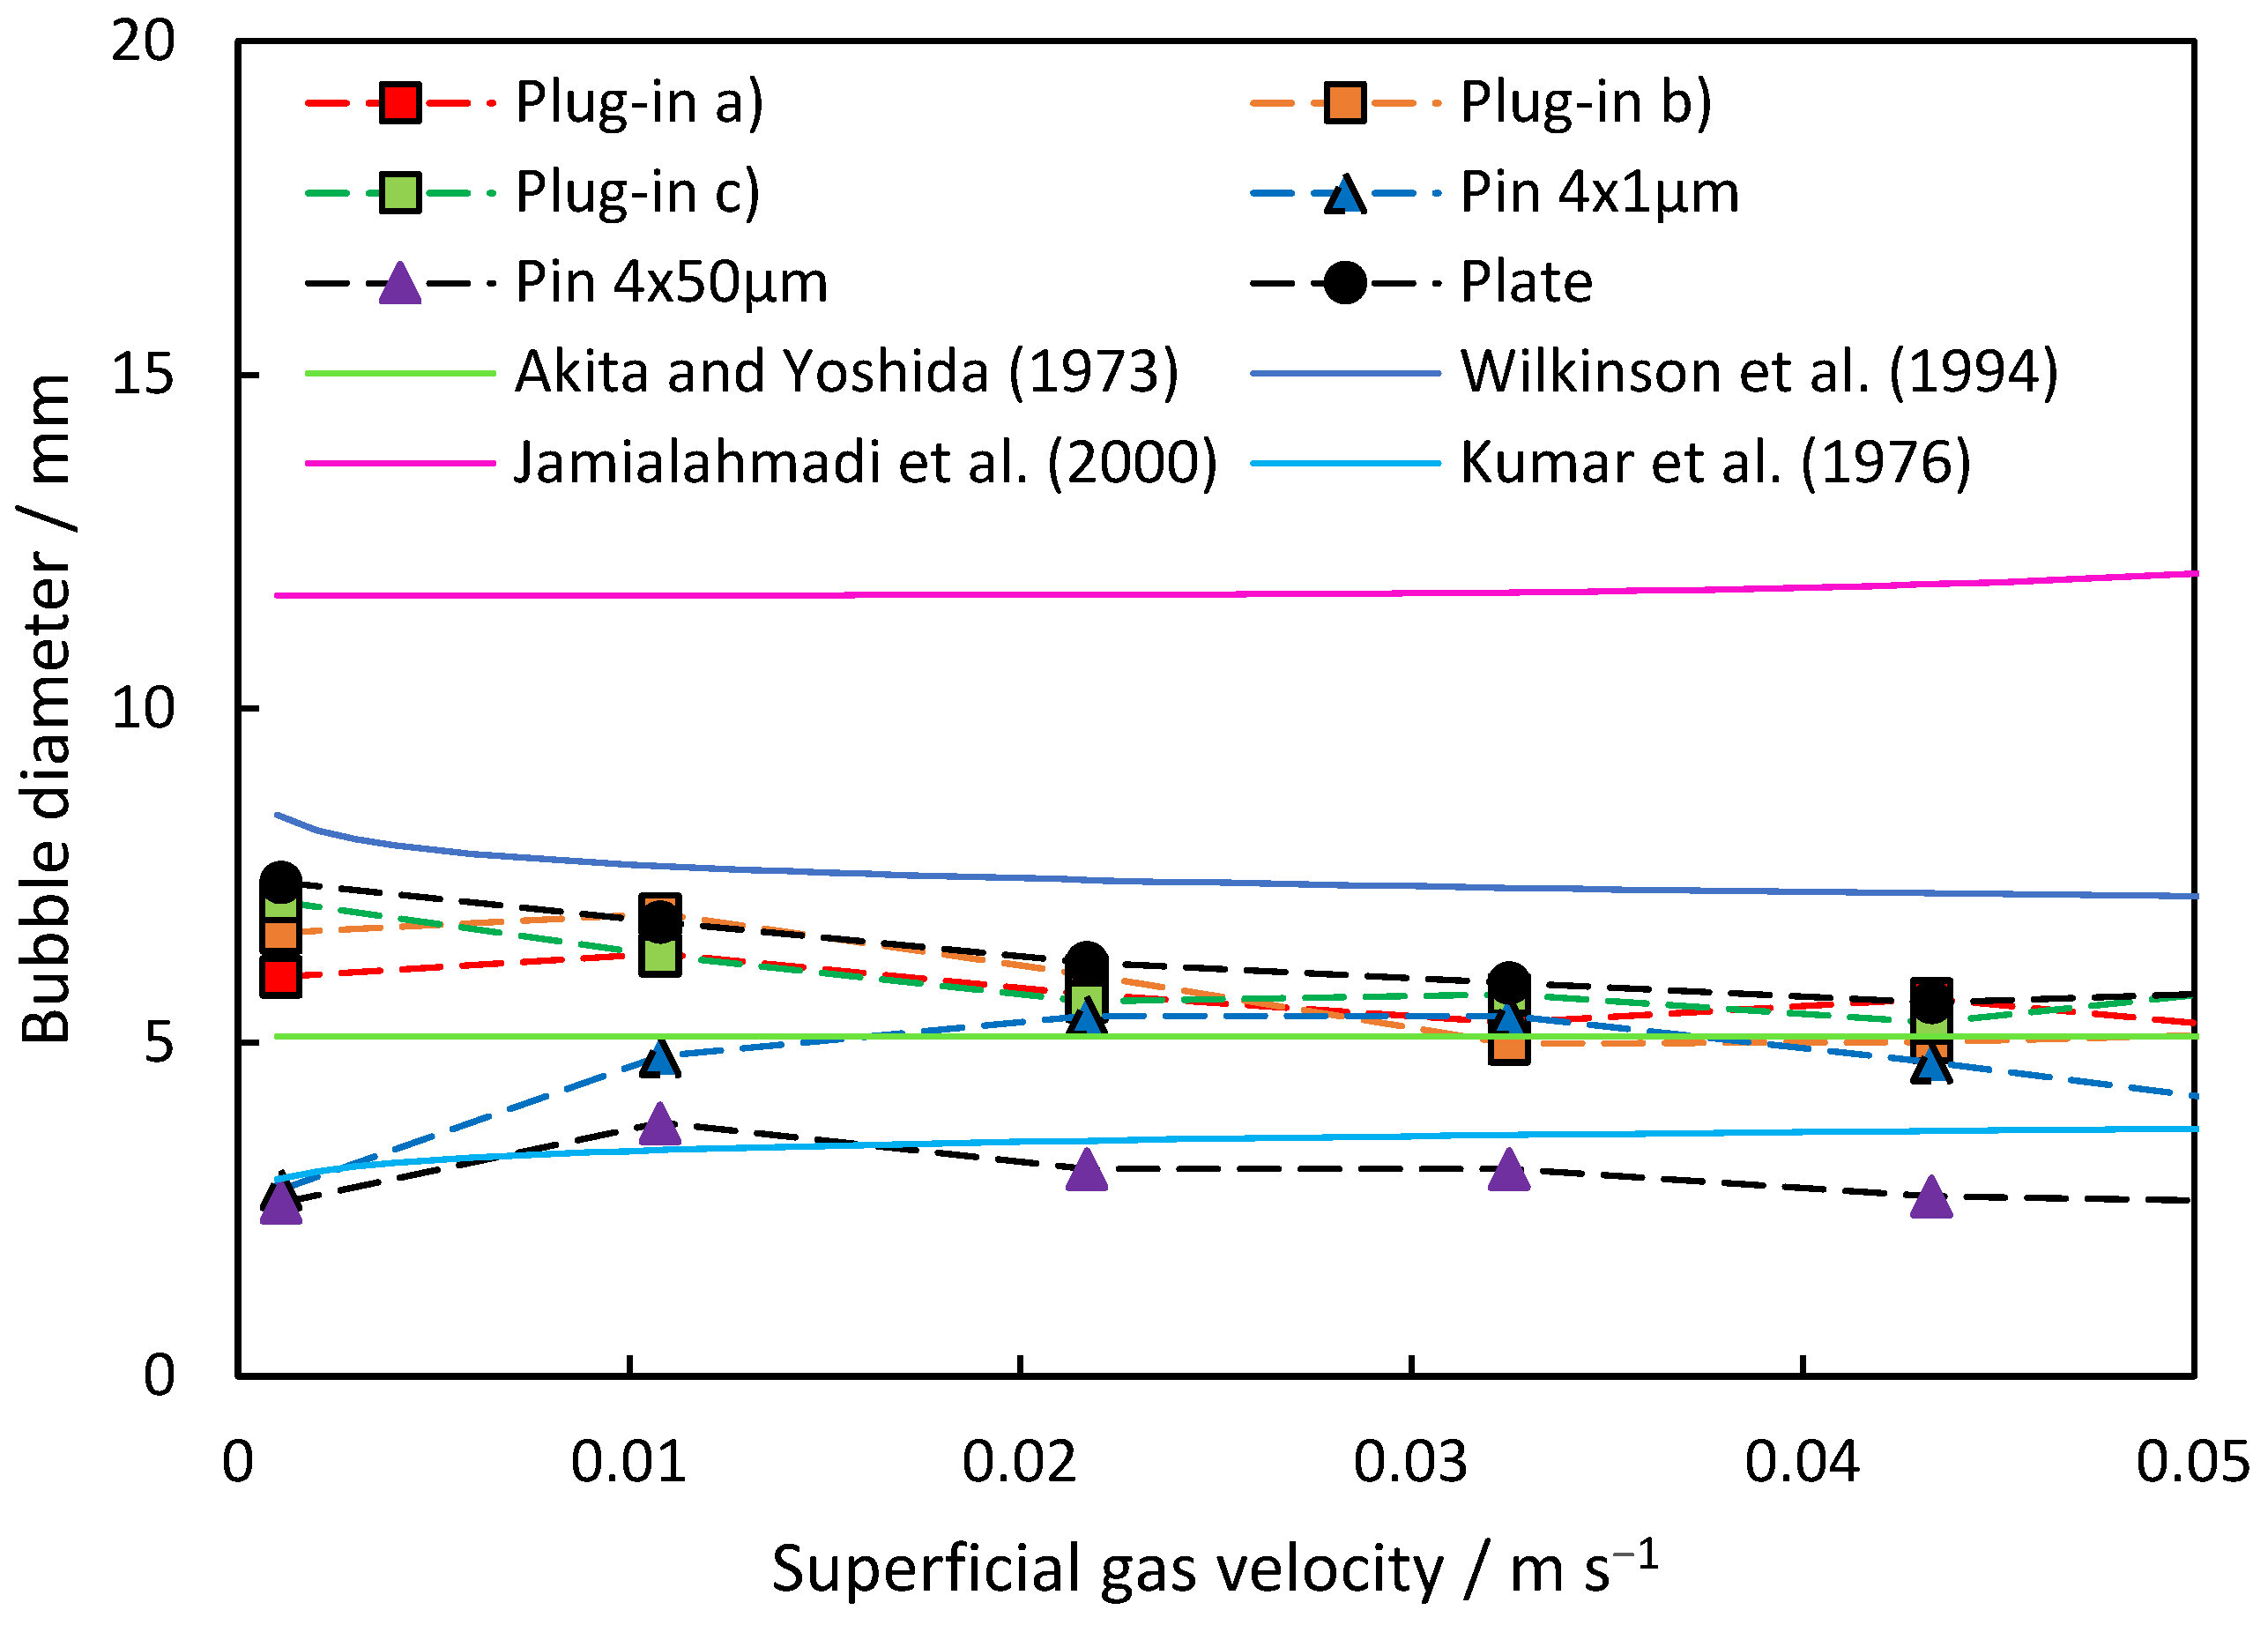
The resulting average bubble diameters are depicted in Figure 5 for the investigated dispersers. Both plate and plug-in dispersers exhibit a similar trend, with bubble size decreasing as superficial gas velocity across the study range increases. The initial average bubble sizes of 6 to 7.5 mm at 0.001 m s−1 reduce to 5.5 to 6.0 mm at 0.055 m s−1 superficial gas velocity. However, at 0.011 m s−1, a slight increase in average bubble size is observed for plug-in dispersers a.) and b.). This suggests a non-linear increase in the number of open pores with increasing superficial gas velocity, temporarily resulting in larger bubble diameters. It is noteworthy that the gas velocity remains low enough to rule out the occurrence of the “jet gas” phenomenon if the gas flow is evenly distributed to all pores. However, it is possible that the pores in the center can experience the jet gas phenomenon much earlier than anticipated, since the gas stream coming from the disperser pipe is aimed directly at the pores in the center. At higher velocities, the average bubble diameter decreases again as more pores are open and gas can flow in a more evenly distributed manner.
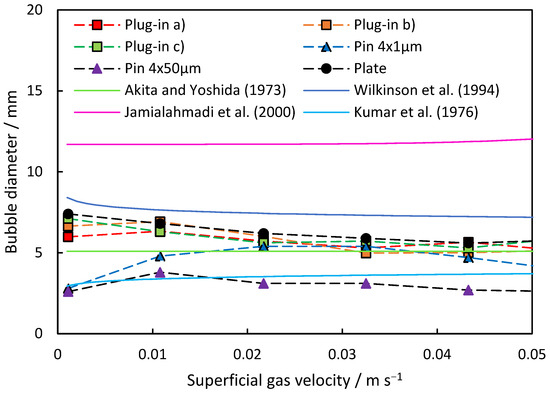
Figure 5.
Comparison of the theoretical models with the measured average bubble diameter of the investigated dispersers at rising superficial gas velocity.
In contrast, the commercially porous pin dispersers demonstrate different behavior compared to the plug-in and plate dispersers. Starting with low bubble diameters of 2.6 to 2.8 mm, the produced bubbles are notably smaller than those generated by all other tested dispersers, which is because of the much smaller pore sizes. Initially, the porous pin dispersers show an increase in average bubble diameter with rising superficial gas velocity. The porous pin disperser with 50 μm pores reaches its maximum at 0.011 m s−1, with a bubble diameter of 3.8 mm, coinciding with the point where plug-in dispersers a.) and c.), as well as the plate disperser, also experience a slight increase. As the superficial gas velocity continues to rise, the average bubble diameter for the porous pin disperser with 50 μm pores decreases to an average size of 2.6 mm at 0.054 m s−1. Conversely, the porous pin disperser with 1 μm pores reaches its maximum at 0.033 m s−1, with an average size of 5.4 mm. Beyond this point, the average bubble diameter decreases more, reaching 3.9 mm at 0.054 m s−1. This behavior can be attributed to a principle similar to that observed in plug-in dispersers and plate dispersers, where the presence of open pores, the gas flow through them, and the resulting pressure drop influence the measured average bubble diameter.
Compared to the correlations, the resulting bubble size lies in between the correlations of Wilkinson et al. and Akita and Yoshida for the plate-like dispersers. The porous pin disperser (50 μm) is represented by the correlation of Kumar et al., and the one with (1 μm) is represented by a superficial gas velocity of 0.01 m s−1 from the equation of Akita and Yoshida. The equation of Jamialahmadi et al. predicts overall large bubble sizes.
3.2. Bubble Diameter Distribution
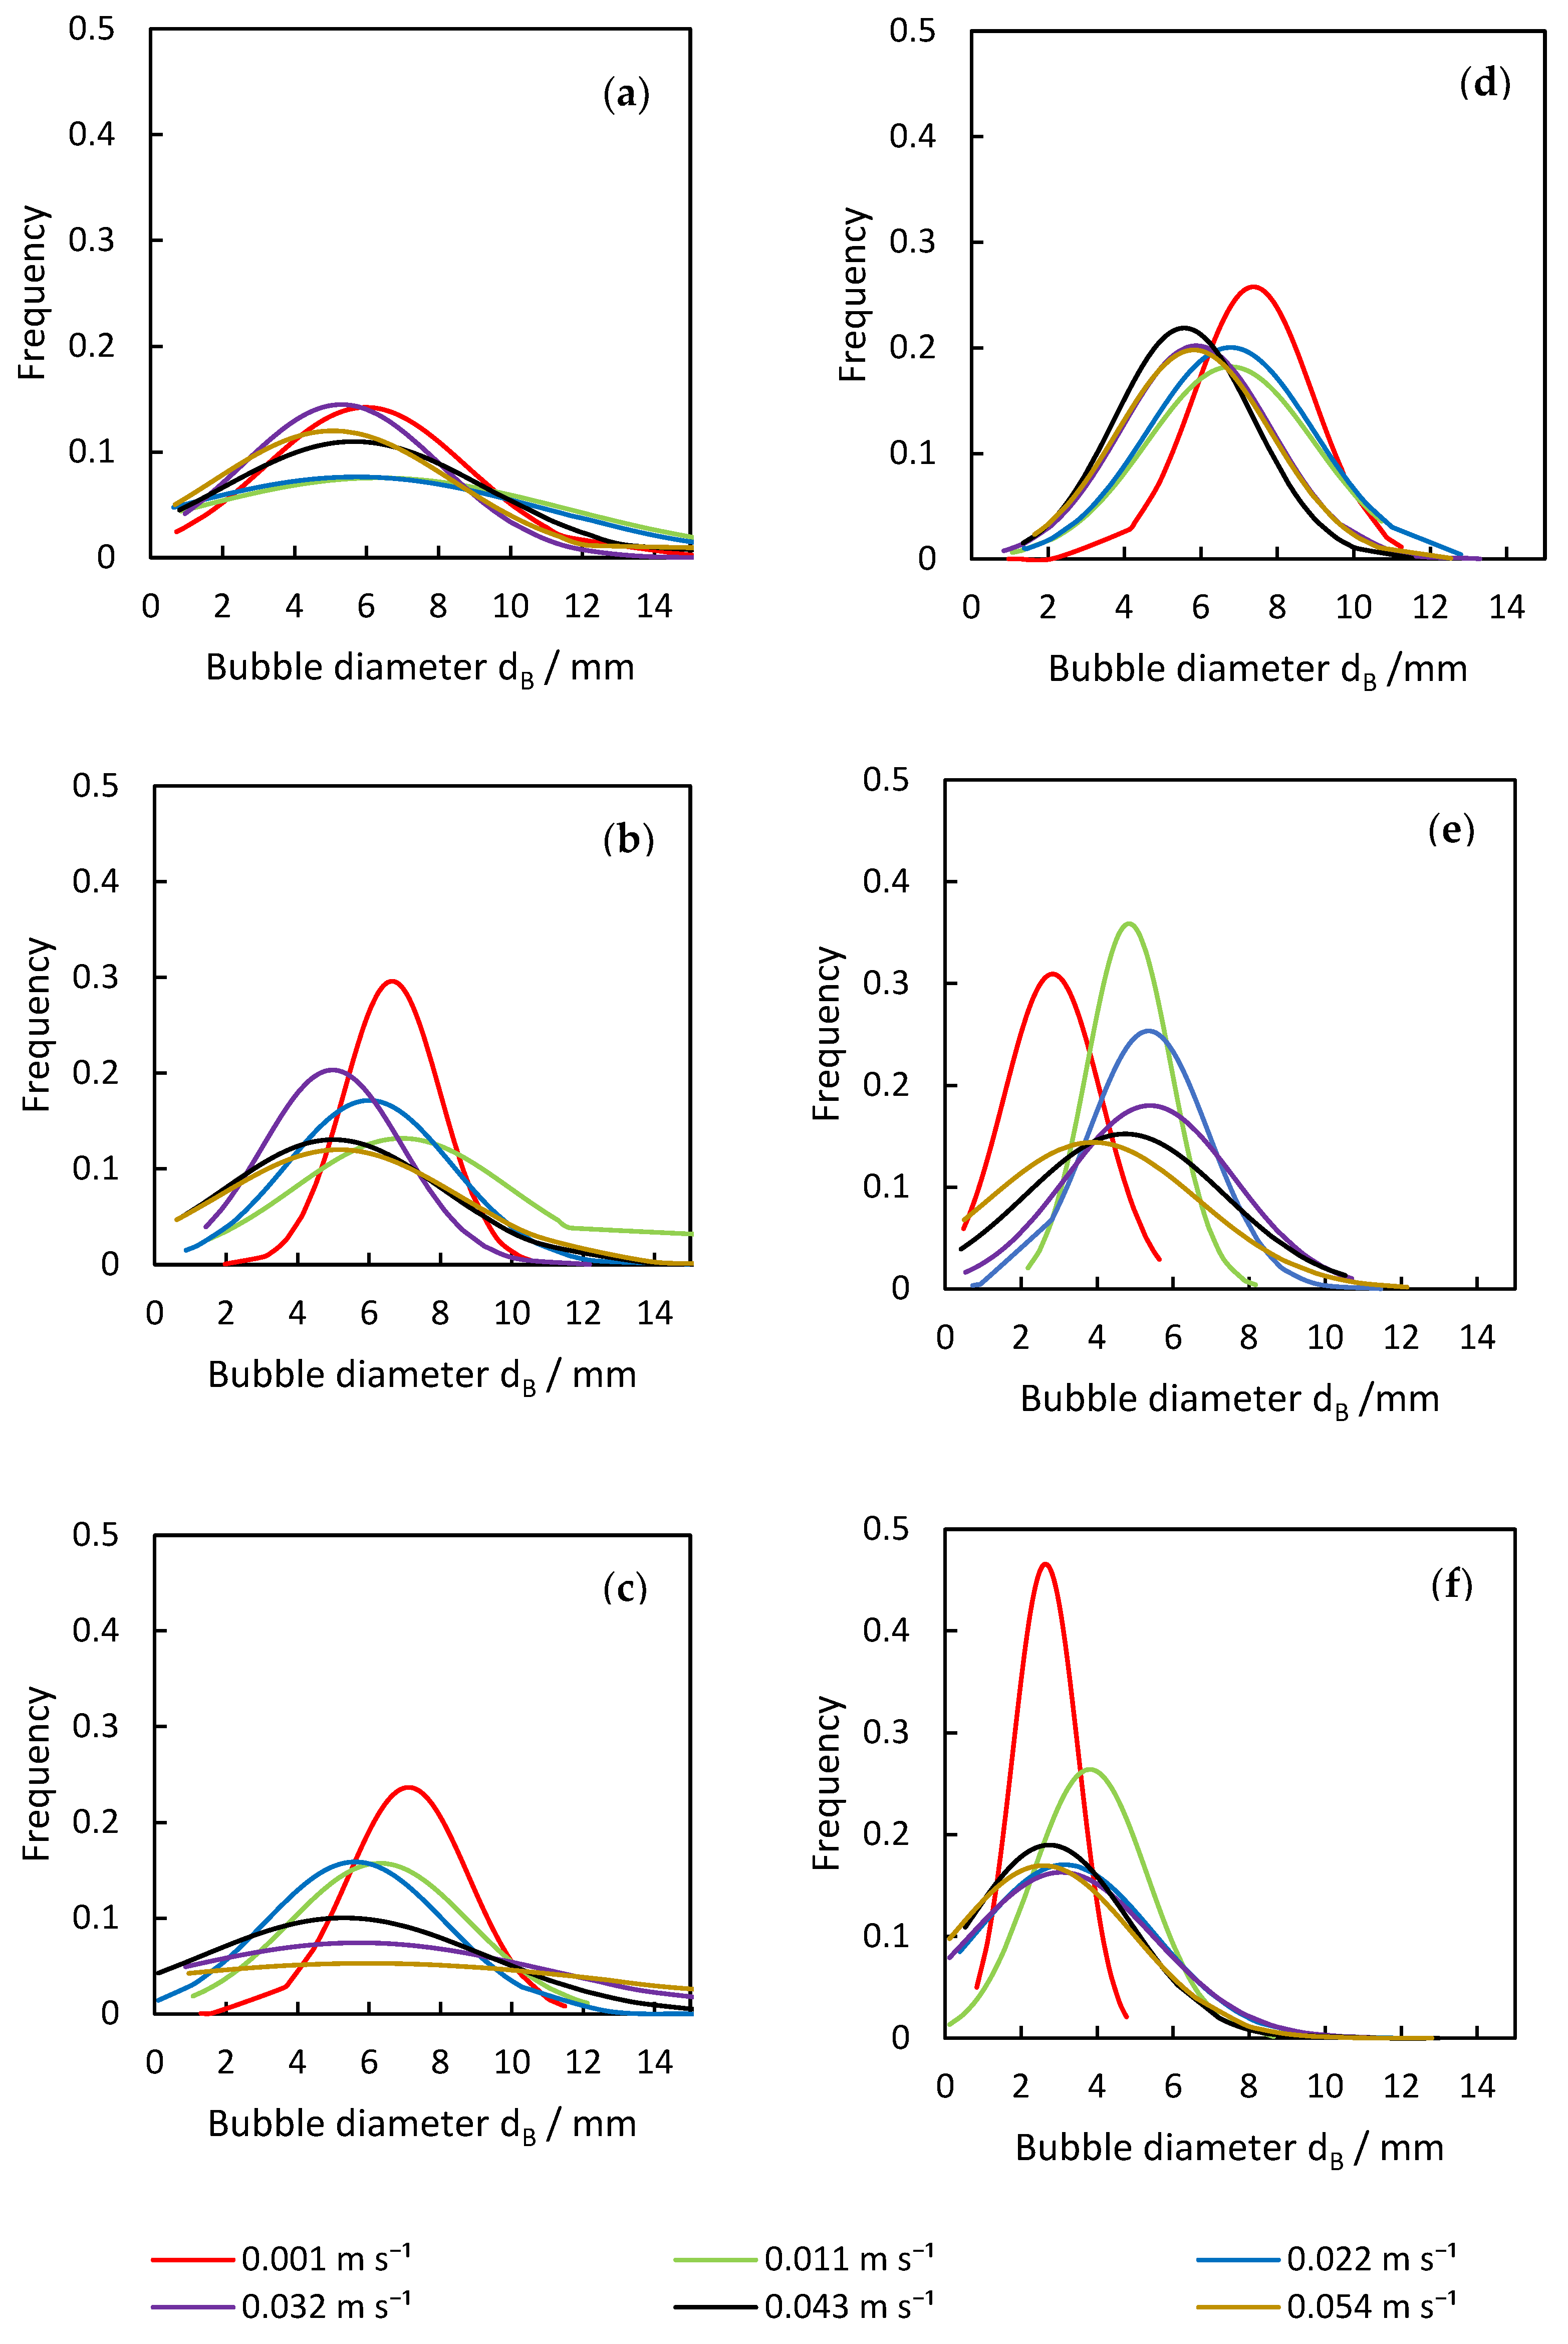
Another important parameter that is influenced by the disperser design is the bubble size distribution (Figure 6), affecting the total specific surface area and also the flow inside the column. Each result is discussed in the following sections.
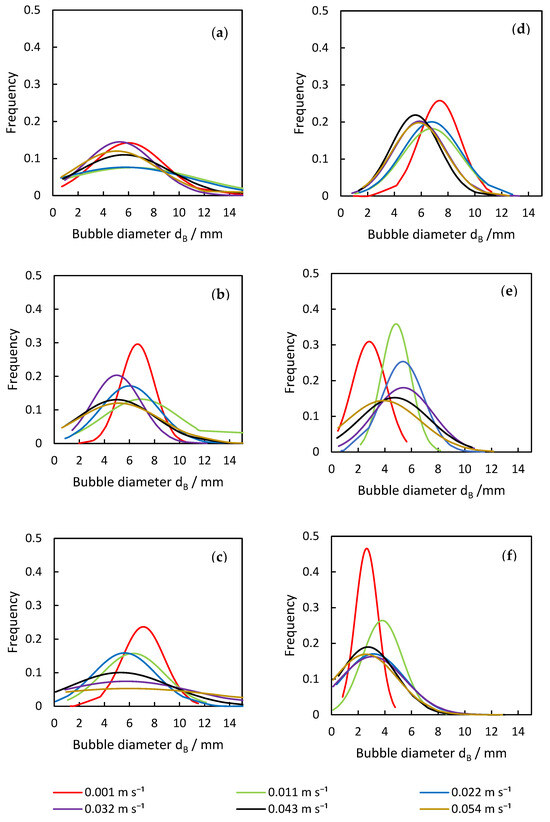
Figure 6.
Analysis of deviation in bubble diameter from the (a) plug-in a.), (b) plug-in b.), (c) plug-in c.), (d) plate, (e) porous pin 4 × 1 µm, and (f) porous pin 4 × 50 µm dispersers across varying superficial gas velocities.
3.2.1. Plug-in Dispersers
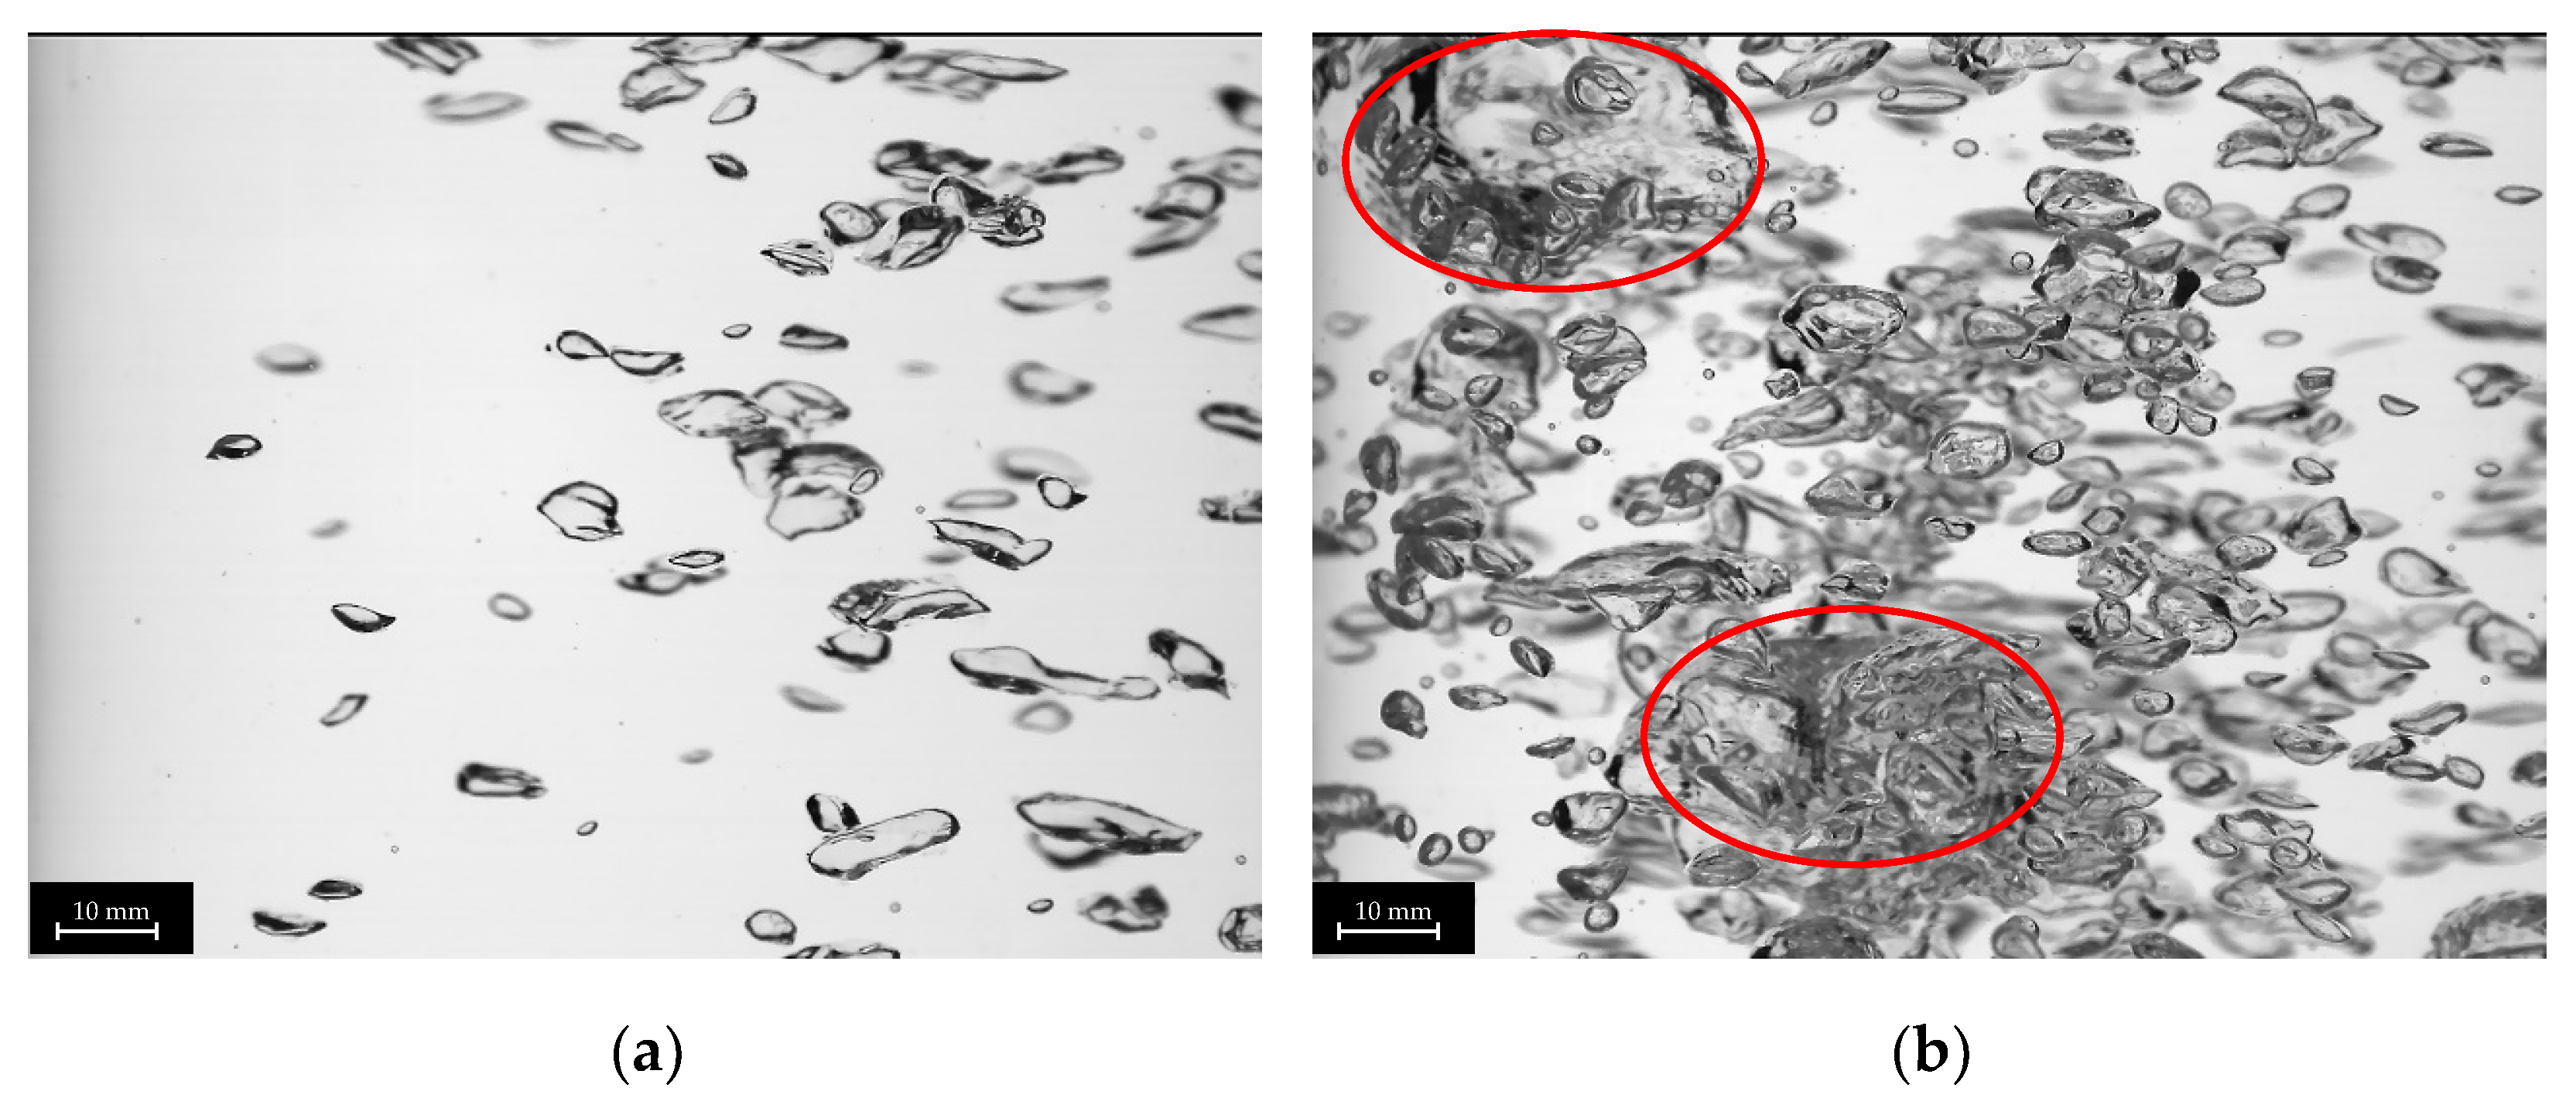
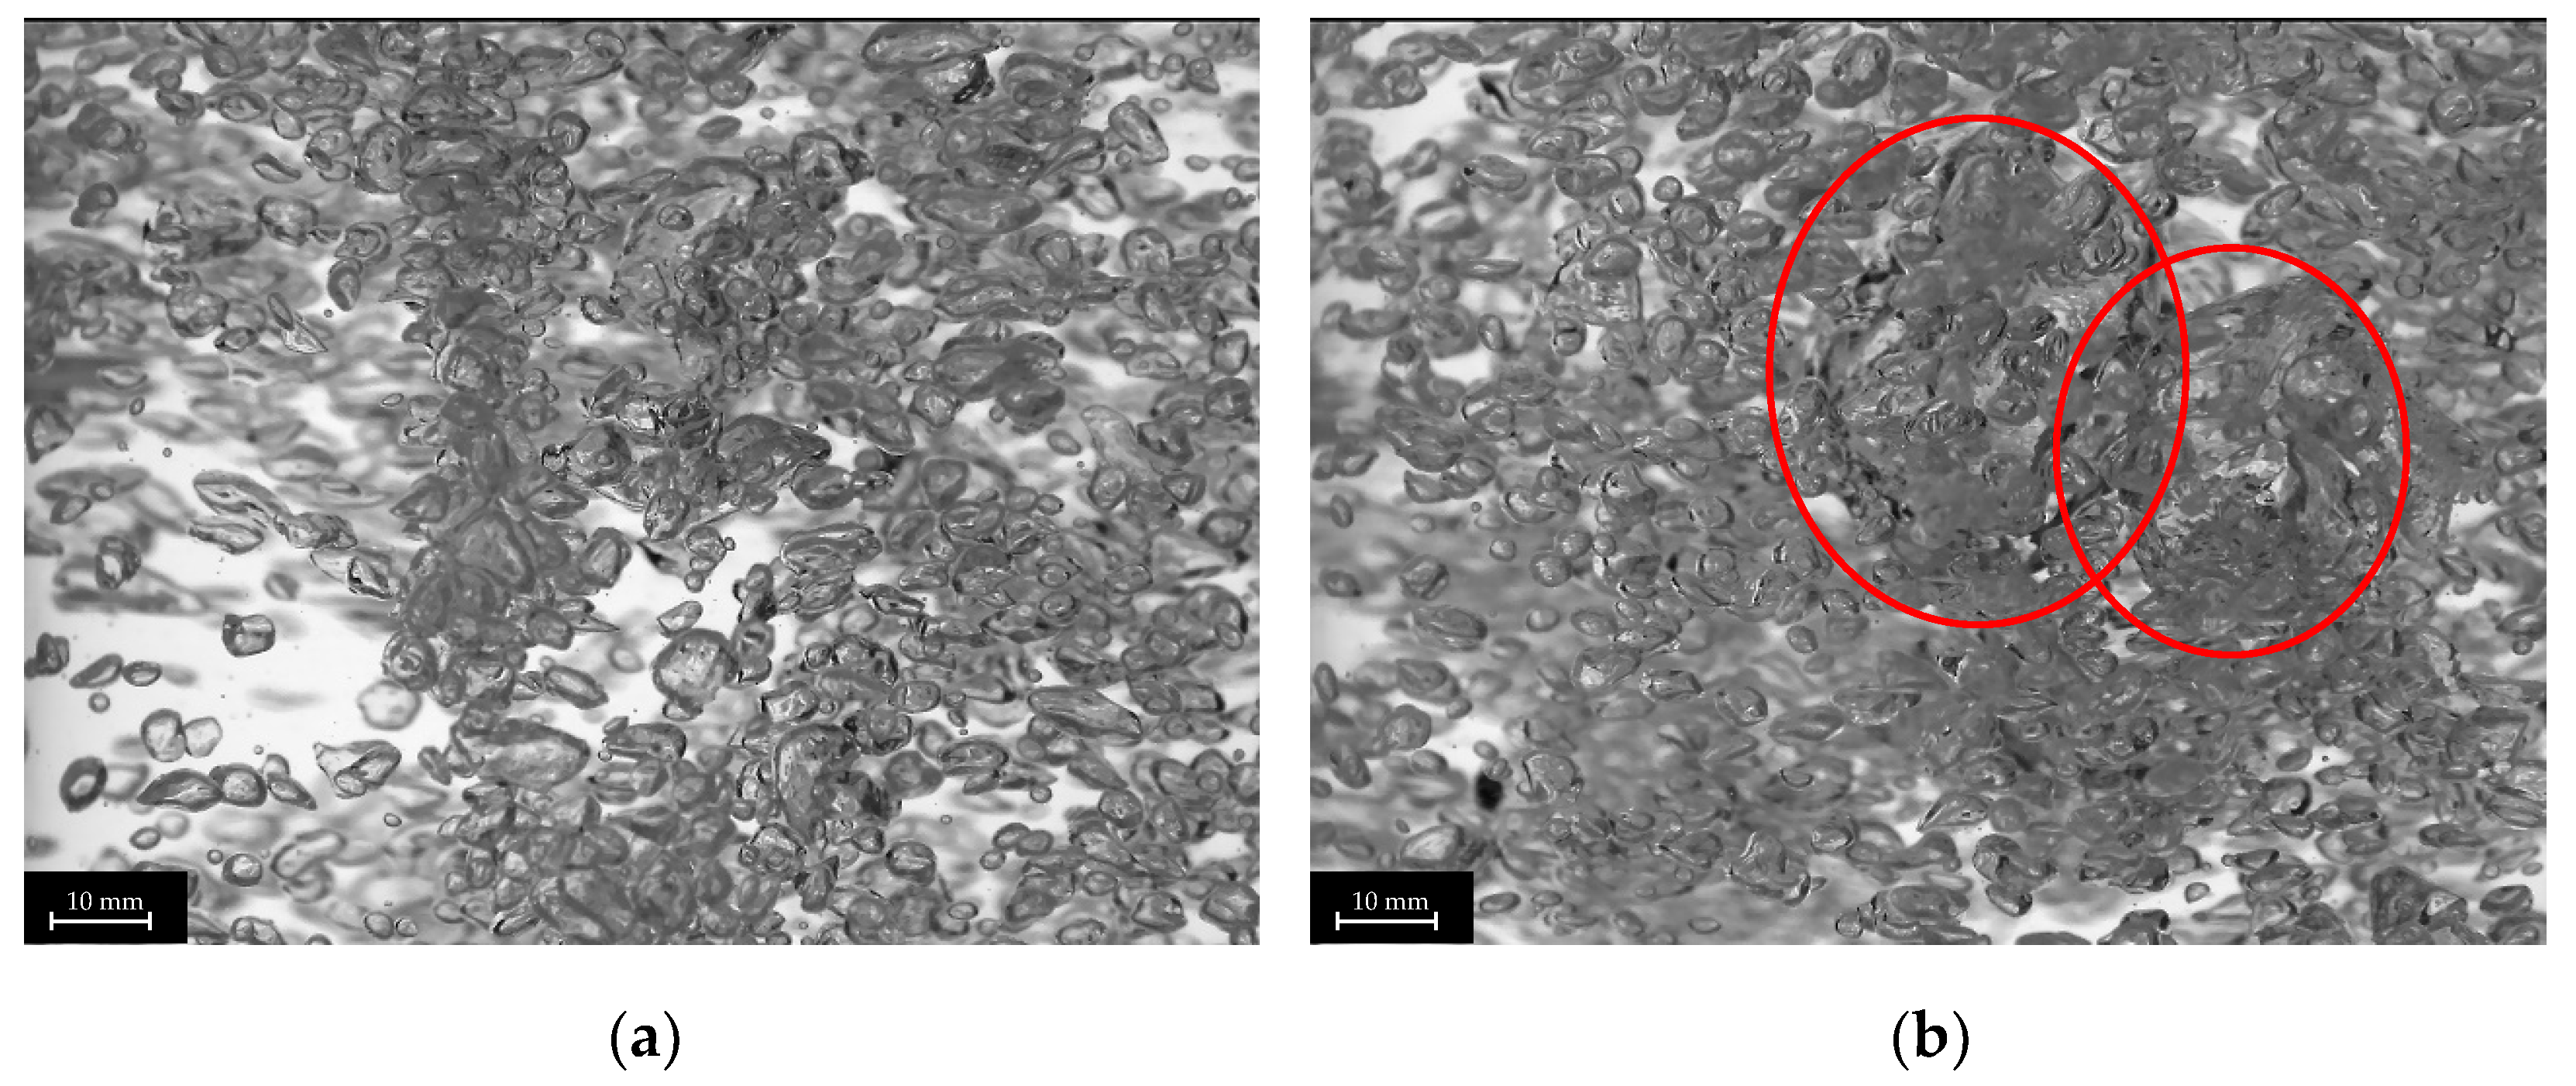
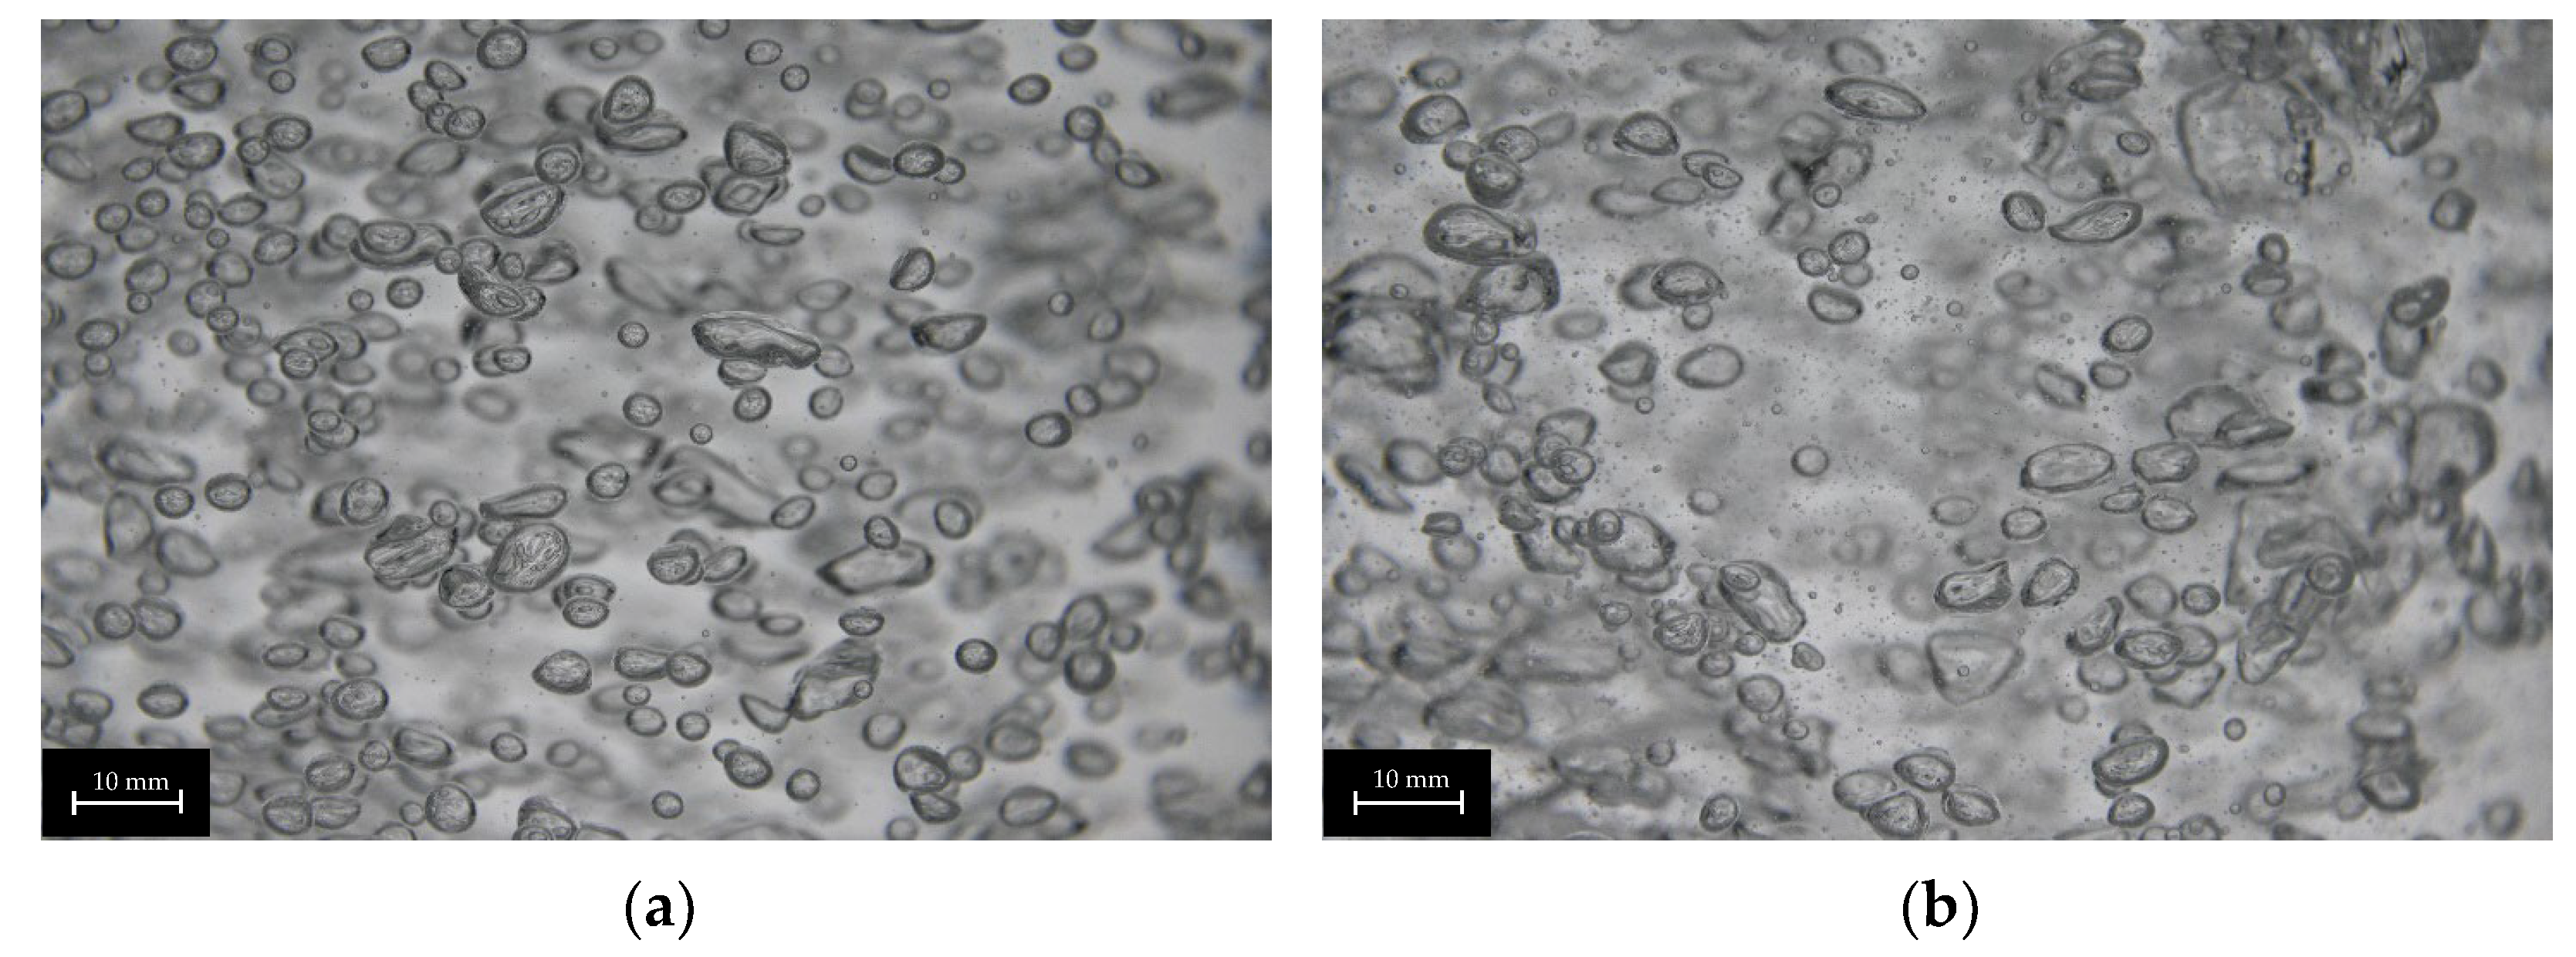
The plug-in disperser a.) exhibits the broadest bubble size distribution overall within the researched gas velocities. From 0.001 to 0.011 m s−1 (Figure 6a), the average bubble diameter increases with rising superficial gas velocity, reaching a maximum. High-speed images of the plug-in disperser a.) in Figure 7a show a narrow bubble size distribution at a superficial gas velocity of 0.001 m s−1. Due to the low velocity, bubble formation is more uniform. However, by further increasing the gas flow rate, the bubble size distribution broadens because bubble formation becomes more turbulent. These turbulences, combined with the specific design of the disperser, result in the formation of larger bubbles (highlighted by red circles in Figure 7b). The high number of closely spaced pores enhances the coalescence effects. Further increases in superficial gas velocity lead to a reduction in both average bubble size and deviation. Intriguingly, at 0.032 m s−1, a decrease in bubble size deviation (±2.7 mm) is observed, similar to the behavior at 0.001 m s−1. This behavior may indicate an optimal setting for this disperser, where a favorable combination of open pores and superficial gas velocity is achieved. Figure 8a shows no large bubbles, while Figure 8b displays bubbles with a diameter larger than 15 mm, leading to an increased deviation (±3.6 mm).
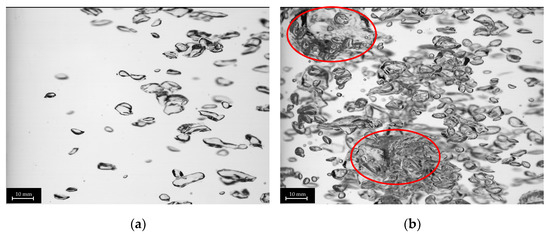
Figure 7.
Images of different bubble size distributions of plug-in disperser a.) at 0.001 (a) and 0.011 (b) m s−1. Larger bubbles (>15 mm) are highlighted with red circles.
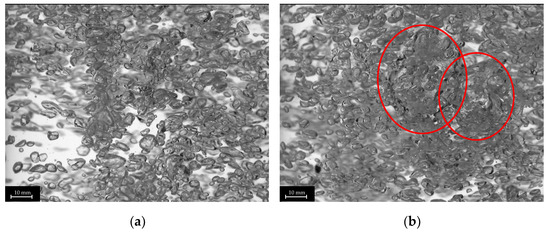
Figure 8.
Images of different bubble size distributions of plug-in disperser a.) at 0.032 (a) and 0.043 (b) m s−1. Larger bubbles (>15 mm) are highlighted with red circles.
Although plug-in disperser b.) produced larger average bubble sizes at lower superficial gas velocities, it achieved the narrowest bubble size deviation among all investigated plug-in dispersers. At a superficial gas velocity of 0.001 m s−1, the deviation was only ±1.4 mm. The reduced number of pores and their increased spacing contributed to more uniform bubble formation. At a gas flow rate of 0.011 m s−1, the deviation increased, leading to non-uniform bubble formation. As the superficial gas velocity increased further, the bubble size deviation decreased again, indicating that more pores were opening. Similarly to disperser a.), at a superficial gas velocity of 0.032 m s−1, a deviation comparable to that at 0.001 m s−1 was observed. Beyond this point, the deviation increased with rising superficial gas velocity. The calculated benchmark 2 was theoretically reached in the last investigated velocity step, indicating that all available pores should have been opened. However, due to design limitations, certain pores reached this threshold earlier in the investigation. After the pores opened at 0.032 m s−1, no additional pores opened, forcing the increasing gas flow through already open pores, which influenced bubble formation.
For plug-in disperser c.), the critical superficial gas velocity required to attain a Weber number exceeding two was determined to be 0.022 m s−1. At this point, all disperser pores are expected to be fully opened, facilitating the onset of the jet gas phenomenon with further increases in superficial gas velocity. This phenomenon leads to an expanded bubble size distribution and a reduction in average bubble diameter. The occurrence of the jet gas phenomenon creates a mix of smaller and larger bubbles, enhanced by the shear forces acting on the hydrodynamics above the disperser. These forces simultaneously reduce bubble size and promote the coalescence effects. Plug-in disperser c.) performed as expected; the bubble size deviation remained narrow until the preset limitation of 2 was reached, after which the deviation increased.
3.2.2. Porous Dispersers
Both porous pin dispersers produce relatively narrow bubble size distributions, although the extent of the deviation varies with increasing superficial gas velocities, as shown in Figure 6e,f. For the porous pin 4 × 1 μm disperser, the bubble size deviation increases with superficial gas velocity, except at the first investigated velocity. In contrast, for the porous pin 4 × 50 μm disperser, the deviation increases consistently across the entire investigated velocity range. At a superficial gas velocity of 0.022 m s−1, the porous pin 4 × 1 μm disperser experiences an increase in deviation, coinciding with the peak average bubble diameter. Interestingly, this increased deviation is not attributed to the rise in number of larger bubbles (>15 mm), but rather the formation of very small bubbles (<1 mm). A similar trend is observed with the porous pin 4 × 50 μm disperser, as can be seen in Figure 9.
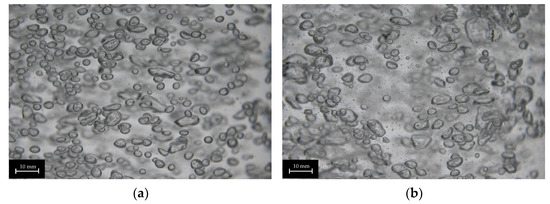
Figure 9.
Images of different bubble size distributions of porous pin 4 × 50 μm at 0.011 m s−1 (a) and 0.022 m s−1 (b), with increasing numbers of small bubbles (<1 mm).
The porous structure enables a uniform opening of the pores based on the applied flow. This mechanism promotes uniform bubble formation at lower superficial gas velocities. However, as the superficial gas velocity increases, the critical Weber number for the pore’s disperser pores may be exceeded. When the threshold is surpassed, bubble breakup becomes more pronounced, resulting in the formation of smaller bubbles. In addition to the jetting phenomenon and the effects of shear forces, the placement of the pin dispersers in the bracket may also contribute to the observed behavior. The spacing between the pins is sufficient to prevent mutual interference, thereby minimizing the coalescence effects during bubble formation. However, this assumption requires further investigation to confirm its validity.
3.2.3. Plate Disperser
The behavior of the plate disperser (Figure 6d) closely mirrors that of plug-in disperser c.), which is attributable to their shared design parameters. However, disparities are observed in the development of bubble size deviation, as the plate disperser does not exceed a Weber number of two. Consequently, the deviation remains narrow, with no detection of bubbles exceeding 15 mm in diameter. Comparative examination of the respective distributions (Figure 6d) reveals that the distribution curves for the plate disperser remain tightly clustered, whereas those for plug-in disperser c.) progressively broaden with increasing superficial gas velocity. This divergence can be attributed to the greater number of available pores and the presence of a porous plate beneath the plate disperser, which collectively exert a positive influence on bubble size distribution. Nevertheless, smaller average bubble diameters are achieved with the plug-in disperser c.), which emphasizes the interaction between disperser design and the resulting bubble properties.
3.3. Gas Hold-Up
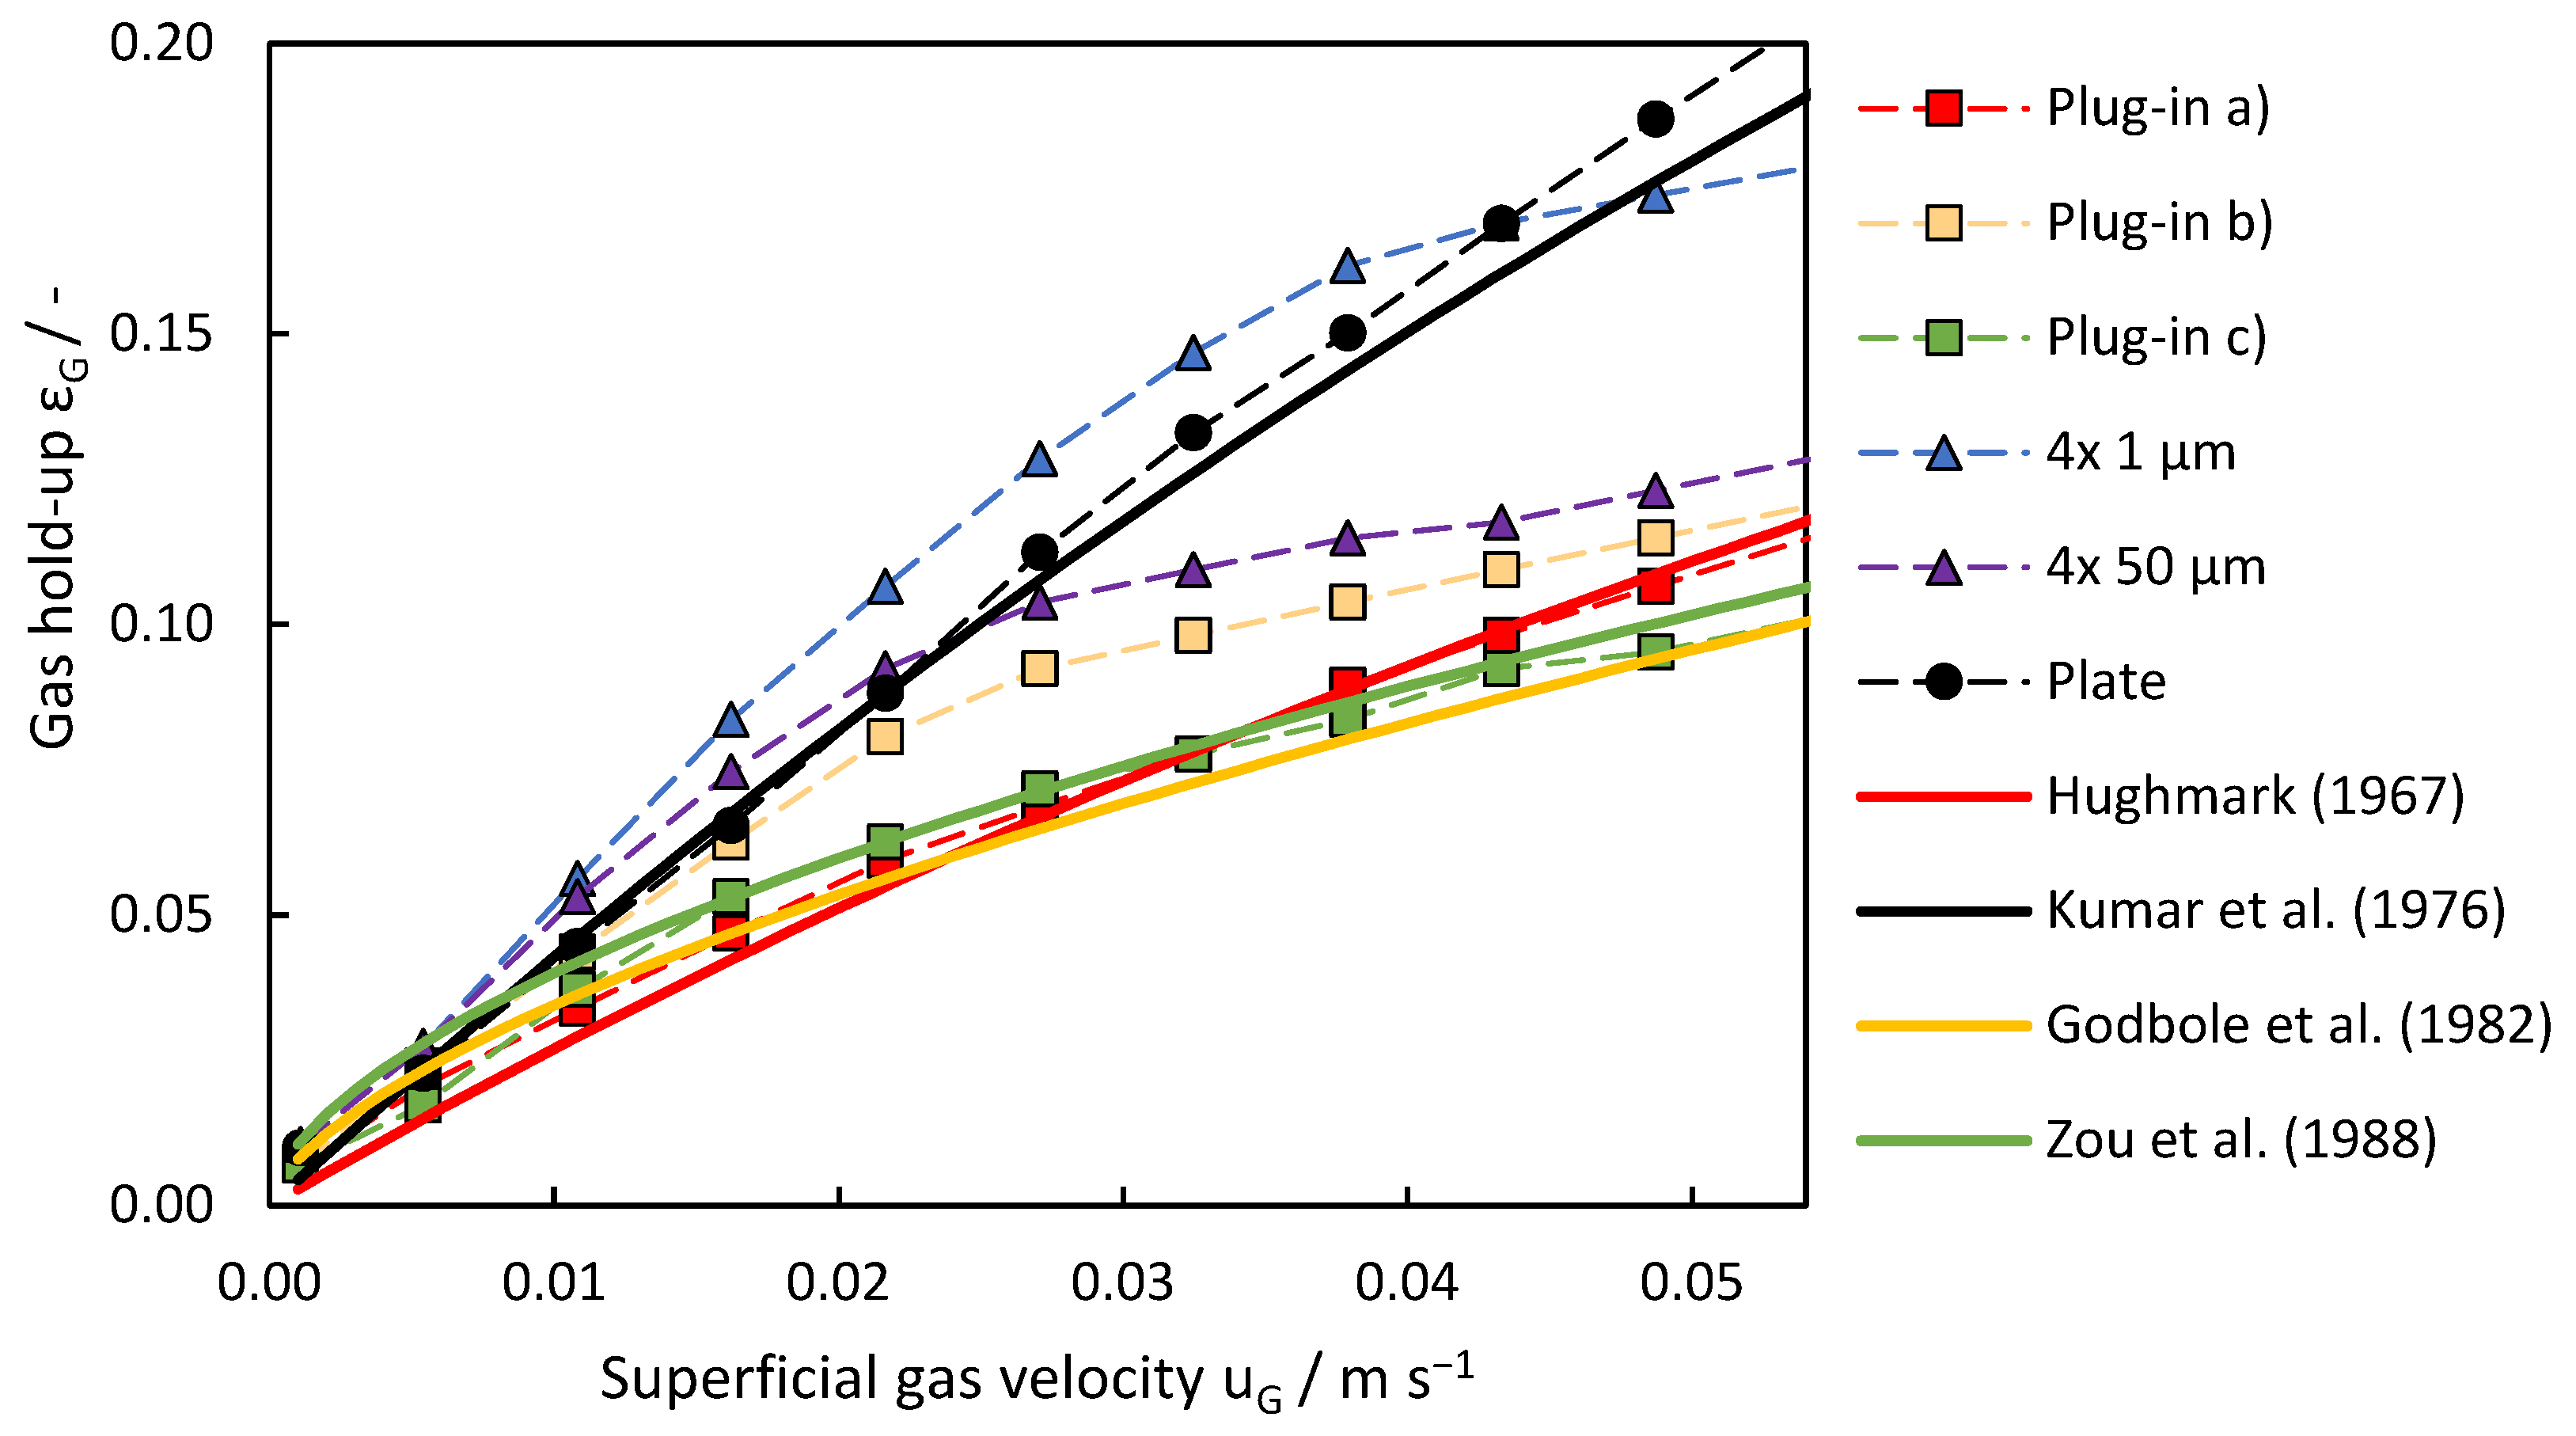
In the investigation of the effect of disperser design on gas hold-up, Figure 10 provides an overview of the corresponding trends observed across different disperser configurations. The plate disperser and porous pin disperser with 4 × 1 μm pores achieved the highest gas hold-up. The gas hold-up of the 4 × 1 μm disperser increased linearly up to a superficial gas velocity of 0.043 m s−1, where a break in linearity was observed. At this point, bubble size distribution broadened significantly, with smaller bubbles (around 4 mm) dominating at higher velocities due to enhanced pore activation and increased shear forces.
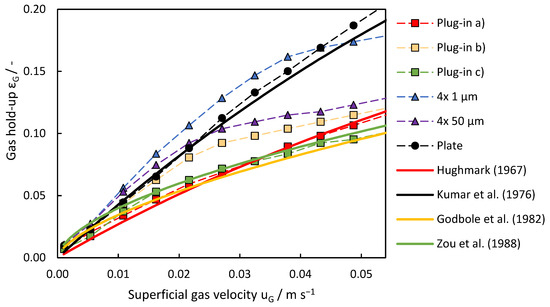
Figure 10.
Evolution of gas hold-up across different gas disperser systems with increasing superficial gas velocity. Comparison of the measured values with the literature models to determine the gas hold-up.
In contrast, the pin disperser with 4 × 50 μm pores exhibited an earlier decline in gas hold-up, occurring at a superficial gas velocity of 0.022 m s−1. This decline was associated with the rapid broadening of the bubble size distribution, likely caused by irregular gas jetting through larger pores and higher coalescence rates at intermediate velocities. At 0.011 m s−1, the 4 × 50 μm disperser exhibited its largest average bubble size (~4 mm), but further increases in gas velocity resulted in reduced bubble diameters and the narrowing of the size distribution due to stronger shear forces breaking up larger bubbles.
The plate disperser consistently performed better and outperformed all plug-in dispersing systems. The narrow distribution of bubble size produced by the plate disperser contributes to its effectiveness at higher superficial gas velocities, while the other dispersers have wider distributions. The lower hold-up performance of the plug-in disperser is attributed to the larger deviation in average bubble diameter and its design, which restricts gas introduction into the bottom of the column, resulting in the formation of a cone-shaped swarm of bubbles. Despite sharing a similar drawback, but not to the same extent, the pin dispersers demonstrated superior performance compared to the plug-in disperser.
These findings underscore the complex interplay between pore size, gas velocity, and bubble formation dynamics, highlighting the critical role of disperser design in optimizing gas–liquid systems. Smaller pore sizes favor stable gas hold-up trends, while larger pores are more prone to coalescence and irregular distributions, resulting in earlier performance declines.
In accordance with the experimental findings, the theoretical models offer insights into gas hold-up development with increasing superficial gas velocity for different disperser configurations. The model depending on Equation (3) proposed by Kumar et al. (1976) aligns well with the observed trends for the plate disperser, with practical values rising steeper than theoretical predictions beyond 0.022 m s−1. The model introduced by Kumar is based on experiments with smaller bubble columns (50, 75, and 100 mm in diameter) and different gas dispersers, which could explain the increasing discrepancy between the theoretical model and the experimental data. In addition to the scale-up effects, real-world factors such as non-uniform gas distribution and coalescence effects are not considered in the model. For plug-in disperser a.), two distinct models provide insights into its behavior. The model by Godbole et al. (Equation (4)) describes gas hold-up development at lower superficial gas velocities up to 0.022 m s−1, after which the experimental values deviate from theoretical predictions. Conversely, the theoretical model by Hughmark (Equation (2)) underestimates gas hold-up development at lower gas velocities, but accurately represents it after reaching 0.027 m s−1. The plug-in disperser c.) can be described using the model proposed by Zou et al. (Equation (5)), particularly in the range from 0.011 to 0.043 m s−1. However, at lower gas flow rates, this model predicts higher gas hold-up levels and a more linear increase at higher gas flow rates than those observed experimentally. The models of Hughmark, Godbole, and Zou generally provide a good fit when the specific assumptions are met, such as uniform bubble distribution, ideal gas flow conditions, and specific disperser design. Since different dispersers were used and they did not behave ideally, none of the models described the system perfectly across the entire range of gas flow rates. The behavior of plug-in disperser b.) is very similar to the 4 × 50 μm pin disperser after exceeding superficial gas velocities of 0.027 m s−1. The sudden increase in the number of smaller bubbles is not predictable by any of the models. For the pin dispersers, however, none of the chosen models can describe the gas hold-up development accurately, as all the models are based on either plate or ring dispersers. At lower gas flow rates, at least for the 4 × 50 μm pin disperser, the model of Kumar is slightly accurate, but as soon as the formation of microbubbles begins, the model is no longer applicable.
4. Conclusions
Bio-methanation in bubble columns offers a promising alternative to stirred tank reactors, offering advantages in gas/liquid separation and reactor stability. In this study, various disperser designs were investigated, focusing on achieving efficient gas/liquid interaction and maintaining liquid circulation. The dispersers were compared in terms of bubble diameter distribution and gas hold-up, with a column diameter of 0.14 m and an initial liquid level of 1.5 m.
The plate disperser demonstrated a stable performance across all investigated velocity ranges. Its key strength lies in maintaining a consistently narrow bubble size distribution, with no recorded bubbles exceeding 15 mm in diameter. This uniformity not only ensured efficient gas hold-up, but also contributed to a linear increase in gas hold-up, optimizing the overall efficiency of the reactor. The porous structure beneath the plate disperser ensured an even gas distribution, enhancing bubble formation and improving overall performance. These characteristics make the plate disperser highly effective for processes requiring controlled bubble formation and efficient gas hold-up.
In contrast, the plug-in dispersers exhibited several performance limitations, particularly in achieving high gas hold-ups. These dispersers suffered from broader bubble size distributions and the formation of larger bubbles exceeding 15 mm in diameter, which adversely impacted gas hold-up efficiency. A critical design flaw of the plug-in dispersers was the absence of a porous structure below the pores to ensure an even gas distribution. The central pore likely received a disproportionately high gas throughput, resulting in uneven bubble formation and suboptimal gas distribution, which ultimately reduced reactor efficiency.
The porous pin dispersers showed their distinct advantage in producing significantly smaller bubbles compared to the other disperser types. This characteristic is particularly beneficial in processes where enhanced mass transfer is crucial, such as bio-methanation. However, it is important to note that the production of these small bubbles comes with trade-offs (reduced overall mixing efficiency). Therefore, while the porous pin dispersers may be ideal for improving mass transfer in bio-methanation applications, their impact on mixing efficiency must be carefully considered. This highlights the need for a balanced design, where bubble size and distribution are optimized to meet the specific requirements of the process, whether it is maximizing mass transfer or ensuring effective mixing.
These results highlight the critical role of disperser design in gas–liquid systems. Features such as pore density, uniform gas distribution mechanisms, and structural enhancements significantly influence bubble dynamics and gas hold-up efficiency. While the plate disperser set a benchmark for performance, the insights gained from this investigation into disperser designs in air/water systems offer valuable guidance for bio-methanation reactor optimization. Due to the hydrodynamic similarities between water and liquid media used in bio-methanation, the findings from this work can be extrapolated to real bio-methanation processes. Additionally, the identification of suitable empirical correlation systems provides a robust basis for scaling and adapting to methane and CO2 environments. This early-phase research lays essential groundwork for understanding disperser performance, optimizing reactor hydrodynamics, and advancing bio-methanation technologies.
Author Contributions
Conceptualization, F.K.; methodology, F.K.; software, F.K. and M.W.H.; validation, F.K. and M.W.H.; formal analysis, F.K. and M.W.H.; investigation, F.K.; resources, M.W.H.; data curation, F.K. and M.W.H.; writing—original draft preparation, F.K.; writing—review and editing, F.K. and M.W.H.; visualization, F.K.; supervision, M.W.H.; project administration, M.W.H.; funding acquisition, M.W.H. All authors have read and agreed to the published version of the manuscript.
Funding
The authors acknowledge financial support through the COMET Centre CHASE, funded within the COMET—Competence Centers for Excellent Technologies program by the BMK, the BMDW and the Federal Provinces of Upper Austria and Vienna. The COMET program is managed by the Austrian Research Promotion Agency (FFG).
Data Availability Statement
The original contributions presented in this study are included in the article. Further inquiries can be directed to the corresponding author.
Conflicts of Interest
The authors declare no conflicts of interest.
References
- Logroño, W.; Popp, D.; Nikolausz, M.; Kluge, P.; Harms, H.; Kleinsteuber, S. Microbial Communities in Flexible Biomethanation of Hydrogen Are Functionally Resilient Upon Starvation. Front. Microbiol. 2021, 12, 619632. [Google Scholar] [CrossRef] [PubMed]
- Sauerschell, S.; Bajohr, S.; Kolb, T. Methanation Pilot Plant with a Slurry Bubble Column Reactor: Setup and First Experimental Results. Energy Fuels 2022, 36, 7166–7176. [Google Scholar] [CrossRef]
- Mills, G.A.; Steffgen, F.W. Catalytic Methanation. Catal. Rev. 1974, 8, 159–210. [Google Scholar] [CrossRef]
- Er-rbib, H.; Bouallou, C. Methanation catalytic reactor. Comptes Rendus Chim. 2014, 17, 701–706. [Google Scholar] [CrossRef]
- Younas, M.; Loong Kong, L.; Bashir, M.J.K.; Nadeem, H.; Shehzad, A.; Sethupathi, S. Recent Advancements, Fundamental Challenges, and Opportunities in Catalytic Methanation of CO2. Energy Fuels 2016, 30, 8815–8831. [Google Scholar] [CrossRef]
- Stangeland, K.; Kalai, D.; Li, H.; Yu, Z. CO2 Methanation: The Effect of Catalysts and Reaction Conditions. Energy Procedia 2017, 105, 2022–2027. [Google Scholar] [CrossRef]
- Frontera, P.; Macario, A.; Ferraro, M.; Antonucci, P. Supported Catalysts for CO2 Methanation: A Review. Catalysts 2017, 7, 59. [Google Scholar] [CrossRef]
- Bywater, A.; Heaven, S.; Zhang, Y.; Banks, C.J. Potential for Biomethanisation of CO2 from Anaerobic Digestion of Organic Wastes in the United Kingdom. Processes 2022, 10, 1202. [Google Scholar] [CrossRef]
- Grimalt-Alemany, A.; Skiadas, I.V.; Gavala, H.N. Syngas biomethanation: State-of-the-art review and perspectives. Biofuels Bioprod. Biorefining 2018, 12, 139–158. [Google Scholar] [CrossRef]
- Rönsch, S.; Schneider, J.; Matthischke, S.; Schlüter, M.; Götz, M.; Lefebvre, J.; Prabhakaran, P.; Bajohr, S. Review on methanation—From fundamentals to current projects. Fuel 2016, 166, 276–296. [Google Scholar] [CrossRef]
- Hoffstadt, K.; Nikolausz, M.; Krafft, S.; Bonatelli, M.L.; Kumar, V.; Harms, H.; Kuperjans, I. Optimization of the Ex Situ Biomethanation of Hydrogen and Carbon Dioxide in a Novel Meandering Plug Flow Reactor: Start-Up Phase and Flexible Operation. Bioengineering 2024, 11, 165. [Google Scholar] [CrossRef] [PubMed]
- Götz, M.; Koch, A.M.; Graf, F. State of the Art and Prespective of CO2 Methanation Process Concepts for Power-to-Gas Applications. In Proceedings of the International Gas Union Research Conference, Copenhagen, Denmark, 17–19 September 2014; Volume 13. [Google Scholar]
- Thapa, A.; Jo, H.; Han, U.; Cho, S.-K. Ex-situ biomethanation for CO2 valorization: State of the art, recent advances, challenges, and future prospective. Biotechnol. Adv. 2023, 68, 108218. [Google Scholar] [CrossRef] [PubMed]
- Li, X.; Chen, J.; Griffin, D.; Li, X.; Henson, M.A. (Eds.) Integrated Metabolic and Process Modeling of Bubble Column Reactors for Gas Fermentation; Elsevier: Amsterdam, The Netherlands, 2018. [Google Scholar]
- Vlaev, S.D.; Fialova, M. Bubble Column Bioreactors: Comparison with Stirred Fermenters Based on Local Gas Hold-up Distribution. Can. J. Chem. Eng. 2003, 81, 535–542. [Google Scholar] [CrossRef]
- Munasinghe, P.C.; Khanal, S.K. Syngas fermentation to biofuel: Evaluation of carbon monoxide mass transfer coefficient (kLa) in different reactor configurations. Biotechnol. Prog. 2010, 26, 1616–1621. [Google Scholar] [CrossRef]
- Yörük, Ö.; Zıraman, D.U.; Uysal, B.Z. Absorption of Sulfur Dioxide by Iron(II) Hydroxide Solution in a Multiplate Bubble Column under Magnetic Field. Chem. Eng. Technol. 2021, 44, 1336–1342. [Google Scholar] [CrossRef]
- Besagni, G.; Inzoli, F.; de Guido, G.; Pellegrini, L.A. Experimental investigation on the influence of ethanol on bubble column hydrodynamics. Chem. Eng. Res. Des. 2016, 112, 1–15. [Google Scholar] [CrossRef]
- Besagni, G.; Inzoli, F.; Ziegenhein, T. Two-Phase Bubble Columns: A Comprehensive Review. ChemEngineering 2018, 2, 13. [Google Scholar] [CrossRef]
- Kraume, M. Transportvorgänge in der Verfahrenstechnik; Springer: Berlin/Heidelberg, Germany, 2012. [Google Scholar]
- Kulkarni, A.A.; Joshi, J.B. Bubble Formation and Bubble Rise Velocity in Gas−Liquid Systems: A Review. Ind. Eng. Chem. Res. 2005, 44, 5873–5931. [Google Scholar] [CrossRef]
- Kougias, P.G.; Treu, L.; Benavente, D.P.; Boe, K.; Campanaro, S.; Angelidaki, I. Ex-situ biogas upgrading and enhancement in different reactor systems. Bioresour. Technol. 2017, 225, 429–437. [Google Scholar] [CrossRef]
- Bassani, I.; Kougias, P.G.; Treu, L.; Porté, H.; Campanaro, S.; Angelidaki, I. Optimization of hydrogen dispersion in thermophilic up-flow reactors for ex situ biogas upgrading. Bioresour. Technol. 2017, 234, 310–319. [Google Scholar] [CrossRef]
- Jensen, M.B.; Kofoed, M.V.W.; Fischer, K.; Voigt, N.V.; Agneessens, L.M.; Batstone, D.J.; Ottosen, L.D.M. Venturi-type injection system as a potential H2 mass transfer technology for full-scale in situ biomethanation. Appl. Energy 2018, 222, 840–846. [Google Scholar] [CrossRef]
- Ngu, V.; Fletcher, D.F.; Kavanagh, J.M.; Rafrafi, Y.; Dumas, C.; Morchain, J.; Cockx, A. H2 mass transfer—A key factor for efficient biological methanation: Comparison between pilot-scale experimental data, 1D and CFD models. Chem. Eng. Sci. 2023, 268, 118382. [Google Scholar] [CrossRef]
- Nada, S.A. Experimental Investigation and Empirical Correlations of Heat Transfer in Different Regimes of Air–Water Two-Phase Flow in a Horizontal Tube. J. Therm. Sci. Eng. Appl. 2017, 9, 021004. [Google Scholar] [CrossRef]
- Besagni, G.; Varallo, N.; Mereu, R. Computational Fluid Dynamics Modelling of Two-Phase Bubble Columns: A Comprehensive Review. Fluids 2023, 8, 91. [Google Scholar] [CrossRef]
- Mândrea, L.; Oprina, G.; Chihaia, O.; El-Leathey, L.-A.; Mirea, R. Theoretical and Experimental Study of Gas Bubbles Behavior. Int. J. Model. Optim. 2017, 7, 145–151. [Google Scholar] [CrossRef][Green Version]
- Lamm, M.; Jarboe, L. Chemical Engineering Separations: A Handbook for Students; Iowa State University Digital Press: Ames, IA, USA, 2020. [Google Scholar]
- Pourtousi, M.; Ganesan, P.; Sandaran, S.C.; Sahu, J.N. Effect of ring sparger diameters on hydrodynamics in bubble column: A numerical investigation. J. Taiwan Inst. Chem. Eng. 2016, 69, 14–24. [Google Scholar] [CrossRef]
- Kulkarni, A.V.; Badgandi, S.V.; Joshi, J.B. Design of ring and spider type spargers for bubble column reactor: Experimental measurements and CFD simulation of flow and weeping. Chem. Eng. Res. Des. 2009, 87, 1612–1630. [Google Scholar] [CrossRef]
- Kulkarni, A.V.; Joshi, J.B. Design and selection of sparger for bubble column reactor. Part I: Performance of different spargers. Chem. Eng. Res. Des. 2011, 89, 1972–1985. [Google Scholar] [CrossRef]
- Şal, S.; Gül, Ö.F.; Özdemir, M. The effect of sparger geometry on gas holdup and regime transition points in a bubble column equipped with perforated plate spargers. Chem. Eng. Process. Process Intensif. 2013, 70, 259–266. [Google Scholar] [CrossRef]
- Kantarci, N.; Borak, F.; Ulgen, K.O. Bubble column reactors. Process Biochem. 2005, 40, 2263–2283. [Google Scholar] [CrossRef]
- Sideman, S.; Hortaçsu, Ö.; Fulton, J.W. Mass Transfer in Gas-Liquid Contacting Systems. Ind. Eng. Chem. 1966, 58, 32–47. [Google Scholar] [CrossRef]
- González-Castaño, M.; Baena-Moreno, F.; De Miguel, J.C.N.; Miah, K.U.; Arroyo-Torralvo, F.; Ossenbrink, R.; Odriozola, J.A.; Benzinger, W.; Hensel, A.; Wenka, A.; et al. 3D-printed structured catalysts for CO2 methanation reaction: Advancing of gyroid-based geometries. Energy Convers. Manag. 2022, 258, 115464. [Google Scholar] [CrossRef]
- Capel, A.J.; Rimington, R.P.; Lewis, M.P.; Christie, S.D.R. 3D printing for chemical, pharmaceutical and biological applications. Nat. Rev. Chem. 2018, 2, 422–436. [Google Scholar] [CrossRef]
- Möller, F.; Seiler, T.; Lau, Y.M.; Weber, M.; Weber, M.; Hampel, U.; Schubert, M. Performance comparison between different sparger plate orifice patterns: Hydrodynamic investigation using ultrafast X-ray tomography. Chem. Eng. J. 2017, 316, 857–871. [Google Scholar] [CrossRef]
- Thorat, B.N.; Kulkarni, A.V.; Joshi, J.B. Design of Sieve Plate Spargers for Bubble Columns: Role of Weeping. Chem. Eng. Technol. 2001, 24, 815–828. [Google Scholar] [CrossRef]
- Schlüter, M. Bildung und Bewegung von Tropfen und Blasen in technischen Apparaten. In Handbuch Vakuumtechnik; Jousten, K., Ed.; Springer Fachmedien Wiesbaden: Wiesbaden, Germany, 2017; pp. 1–19. [Google Scholar] [CrossRef]
- Springer-Verlag GmbH. VDI-Wärmeatlas; Springer: Berlin/Heidelberg, Germany, 2013. [Google Scholar]
- Akita, K.; Yoshida, F. Bubble Size, Interfacial Area, and Liquid-Phase Mass Transfer Coefficient in Bubble Columns. Ind. Eng. Chem. Proc. Des. Dev. 1974, 13, 84–91. [Google Scholar] [CrossRef]
- Loimer, T.; Machu, G.; Schaflinger, U. Inviscid bubble formation on porous plates and sieve plates. Chem. Eng. Sci. 2004, 59, 809–818. [Google Scholar] [CrossRef]
- Besagni, G.; Brazzale, P.; Fiocca, A.; Inzoli, F. Estimation of bubble size distributions and shapes in two-phase bubble column using image analysis and optical probes. Flow Meas. Instrum. 2016, 52, 190–207. [Google Scholar] [CrossRef]
- Mouza, A.A. Design of bubble columns equipped with porous sparger. Mater. Today Proc. 2018, 5, 27572–27581. [Google Scholar] [CrossRef]
- Jha, A.; Raj Mohan, B.; Chakraborty, S.; Meikap, B.C. Studies on gas holdup in a bubble column using porous spargers with additives. Asia-Pac. J. Chem. Eng. 2008, 3, 417–424. [Google Scholar] [CrossRef]
- Akita, K.; Yoshida, F. Gas Holdup and Volumetric Mass Transfer Coefficient in Bubble Columns. Effects of Liquid Properties. Ind. Eng. Chem. Proc. Des. Dev. 1973, 12, 76–80. [Google Scholar] [CrossRef]
- Wilkinson, P.M.; Haringa, H.; van Dierendonck, L.L. Mass transfer and bubble size in a bubble column under pressure. Chem. Eng. Sci. 1994, 49, 1417–1427. [Google Scholar] [CrossRef]
- Jamialahmadi, M.; Müller-Steinhagen, H.; Sarrafi, A.; Smith, J.M. Studies of Gas Holdup in Bubble Column Reactors. Chem. Eng. Technol. 2000, 23, 919–921. [Google Scholar] [CrossRef]
- Kumar, A.; Degaleesan, T.E.; Laddha, G.S.; Hoelscher, H.E. Bubble swarm characteristics in bubble columns. Can. J. Chem. Eng. 1976, 54, 503–508. [Google Scholar] [CrossRef]
- Schindelin, J.; Arganda-Carreras, I.; Frise, E.; Kaynig, V.; Longair, M.; Pietzsch, T.; Preibisch, S.; Rueden, C.; Saalfeld, S.; Schmid, B.; et al. Fiji: An open-source platform for biological-image analysis. Nat. Methods 2012, 9, 676–682. [Google Scholar] [CrossRef]
Disclaimer/Publisher’s Note: The statements, opinions and data contained in all publications are solely those of the individual author(s) and contributor(s) and not of MDPI and/or the editor(s). MDPI and/or the editor(s) disclaim responsibility for any injury to people or property resulting from any ideas, methods, instructions or products referred to in the content. |
© 2025 by the authors. Licensee MDPI, Basel, Switzerland. This article is an open access article distributed under the terms and conditions of the Creative Commons Attribution (CC BY) license (https://creativecommons.org/licenses/by/4.0/).

