Abstract
Vaccination cold chains depend critically on maintaining temperatures within the 2–8 °C range, with phase-change materials (PCMs) like n-tetradecane offering substantial potential due to their high latent heat and optimal melting characteristics. Despite extensive research on PCM melting enhancement, strategies to extend melting duration and thermal stability remain underexplored. This pioneering numerical study investigates the impact of incorporating 5% glycerol additive in n-tetradecane, aiming to decelerate the melting rate and sustain the desired temperature range over prolonged periods. This study numerically assesses the effect of a 5% glycerol additive on n-tetradecane, revealing a substantial 20.6 h extension in safe temperature maintenance, from 123.3 h in pure n-tetradecane (T) to 143.9 h with the additive (T + G). Although T reaches full melting in 121.7 h, the air temperature inside the cold box breaches 8 °C only 1.6 h after; in contrast, T + G reaches this threshold 2.2 h before full melting, resulting in an effective extension of 20.6 h. Entropy analysis shows a delayed rise in T + G, indicating enhanced thermal stability, while temperature contours confirm T + G sustains cooling until day 6, a full day beyond T. These findings highlight glycerol’s potential to modulate thermal dynamics within PCM-based cold boxes, offering a cost-effective improvement in vaccine transport sustainability.
1. Introduction
The transportation of vaccines has become a pivotal aspect of global health, particularly in the wake of the COVID-19 pandemic. Vaccines are sensitive biological products that require strict temperature control throughout their journey from manufacturers to end users. The World Health Organization (WHO) emphasizes the importance of maintaining the cold chain to ensure vaccine efficacy, as deviations can lead to reduced potency or complete loss of effectiveness [1]. For instance, the Pfizer-BioNTech COVID-19 vaccine, once produced in Belgium, had to be shipped to various countries, including Indonesia. This journey typically involved refrigerated containers transported to major air cargo hubs like Changi Airport in Singapore before being flown to their final destination. The entire process could take up to five days, during which maintaining the required ultra-cold temperature was crucial. To ensure viability, phase-change materials (PCMs) are utilized for temperature regulation; however, these materials may require recharging at designated points along the route to maintain the necessary temperature throughout the journey [2].
As vaccine distribution increasingly operates on an intercontinental scale, logistical challenges—such as limited transport capacity and varying infrastructure—pose significant threats to timely and safe delivery. PCMs have emerged as a promising solution to enhance cold chain logistics for vaccines. These materials can absorb and release large amounts of thermal energy, effectively maintaining specific temperature ranges for extended periods. For example, TCP’s PC-21 solution can keep vaccines at ultra-cold temperatures for significantly longer durations than traditional methods like dry ice, which present safety hazards and logistical complications [3].
Recent advances in thermal insulation technologies, such as vacuum insulation panels (VIPs), also contribute significantly to cold chain efficiency. VIPs, widely recognized for their excellent adiabatic performance, have been explored in various applications, including cold chain containers, where they demonstrate remarkable thermal insulation properties [4]. Research has shown that the use of VIPs in multi-layer insulation systems, combined with advanced cooling technologies like semiconductor devices, can extend the duration of temperature control during transit [5]. Moreover, nano-aerogel composites used in VIP cores have been found to optimize thermal conductivity and enhance overall energy efficiency in cold chain systems [6]. These advancements underscore the potential of integrating innovative thermal management materials into vaccine logistics.
While extensive research has focused on accelerating PCM melting using passive techniques like fins and nanoparticles [7,8,9,10,11,12,13,14,15], and active methods such as vibrations and magnetic fields [16,17,18,19,20], limited efforts have been made to slow down the melting process.
The potential for extending the melting duration of PCM-lined containers could revolutionize vaccine transportation. This extension not only provides a buffer against unforeseen delays but also enhances the reliability of maintaining optimal temperatures during transit. By ensuring that vaccines remain within their required temperature range longer, we can significantly reduce the risk of wastage and improve overall vaccination rates globally [21].
This study presents a novel approach to extending the melting duration of PCMs, enabling vaccines to remain within their optimal temperature range for longer periods. By focusing on delaying the phase-change process, it introduces a unique perspective that could transform cold chain logistics and significantly enhance vaccine preservation during transportation. Unlike the existing literature, which primarily emphasizes accelerating PCM melting, this work explores the largely unexamined area of delaying PCM melting. Specifically, it investigates the impact of organic nanoparticles on pure PCMs, offering a fresh and innovative contribution to the field.
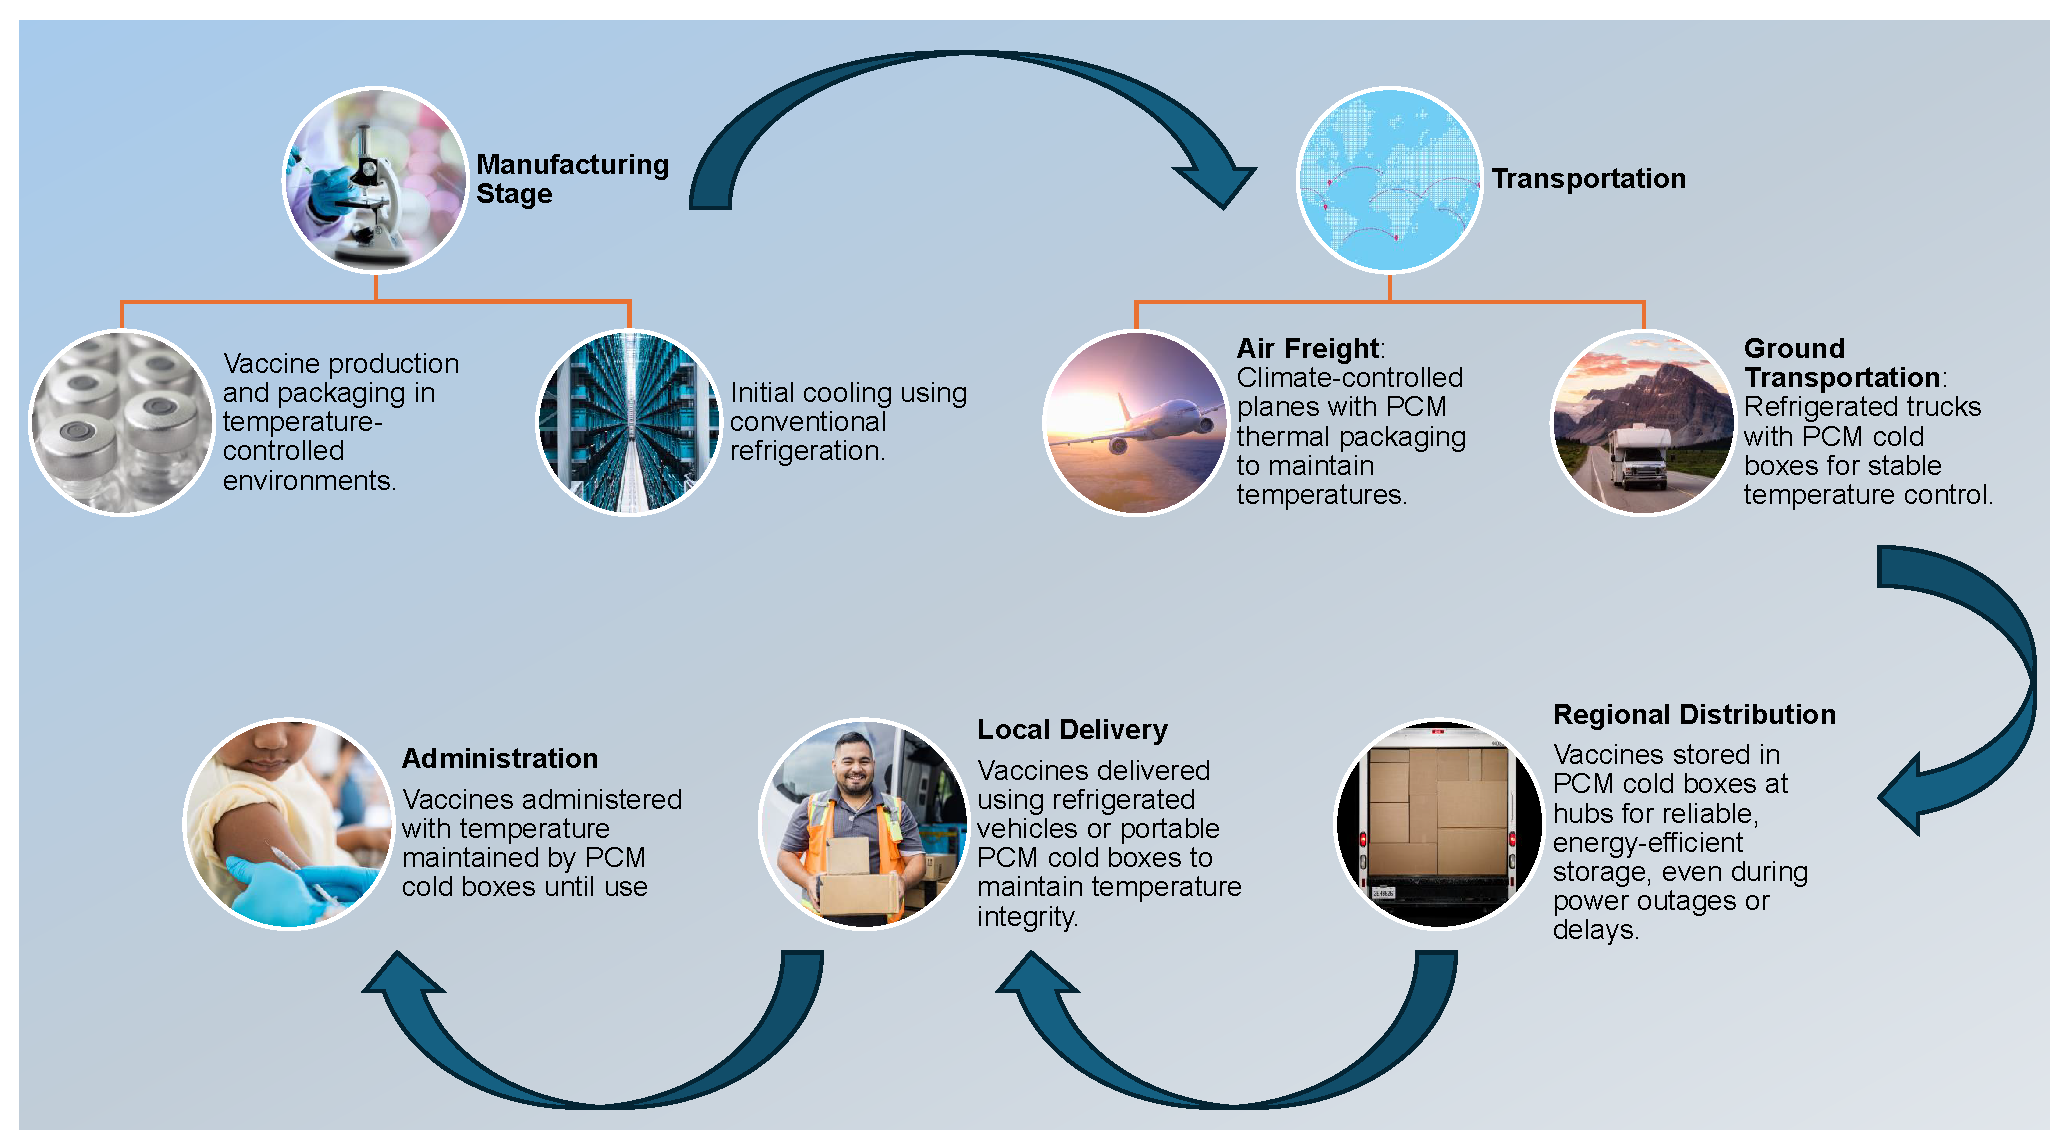
Figure 1 illustrates a comprehensive vaccine supply chain framework utilizing PCM technology for thermal regulation. This diagram delineates the critical stages of vaccine production, transportation, and administration, emphasizing the integration of PCM-lined containers to maintain the cold chain. Key components include initial refrigeration in temperature-controlled environments, air freight via climate-controlled aircraft, refrigerated ground transport with PCM cold boxes, regional distribution in energy-efficient hubs, and local delivery through temperature-maintained vehicles, ensuring optimal stability and efficacy throughout the entire logistics process.
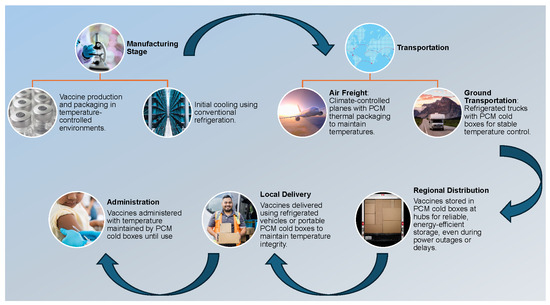
Figure 1.
A schematic of the vaccine cold chain shows PCM cold boxes ensuring temperature control, energy efficiency, and reliability from production to administration.
Moreover, as global vaccination efforts expand—particularly in low- and middle-income countries where infrastructure may be lacking—optimizing PCM technology becomes crucial. The ability to transport larger quantities of vaccines safely and effectively can facilitate equitable access to immunization, ultimately contributing to global health security. This paper explores advancements in PCM technology and its implications for the prolonged cooling of vaccines, highlighting its role in overcoming logistical barriers in vaccine distribution.
2. Identifying Suitable Additives
To optimize PCMs for vaccine transport, the possibility of the modification of their properties was explored to extend the melting time. An intriguing approach involved adding specific additives to decrease the thermal conductivity and/or increase the latent heat and specific heat capacity. This passive, cost-effective solution could effectively reduce the melting rate, providing a more sustainable method for maintaining stable temperatures during vaccine delivery.
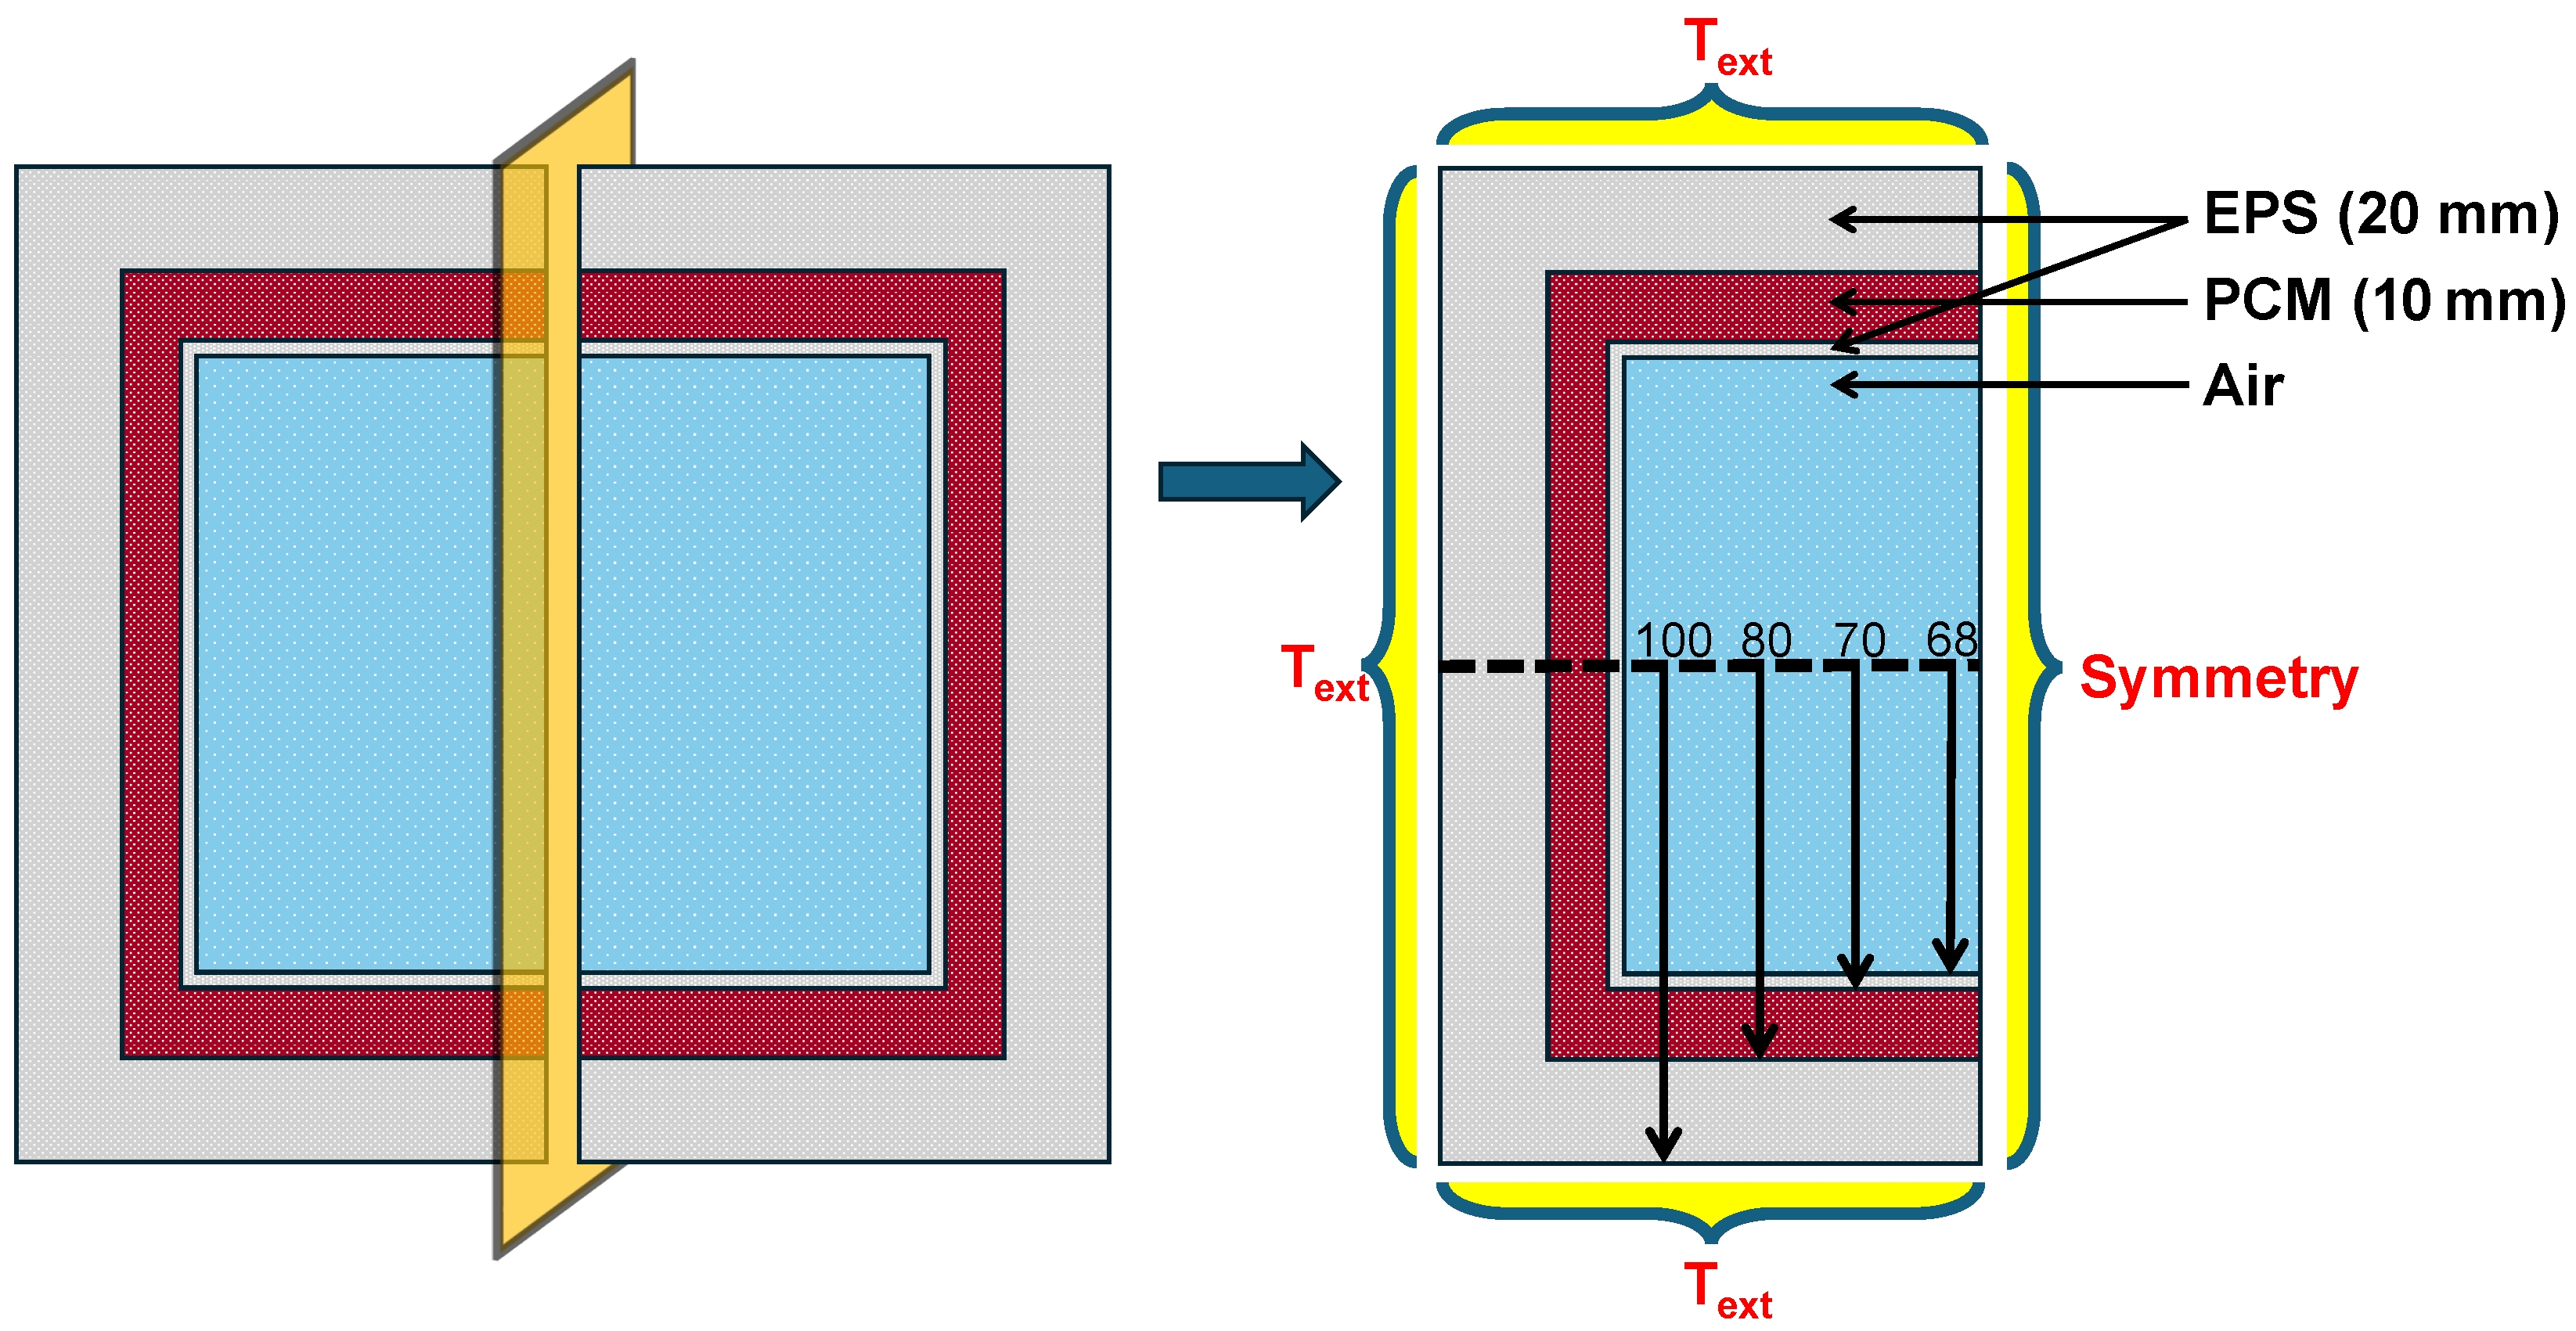
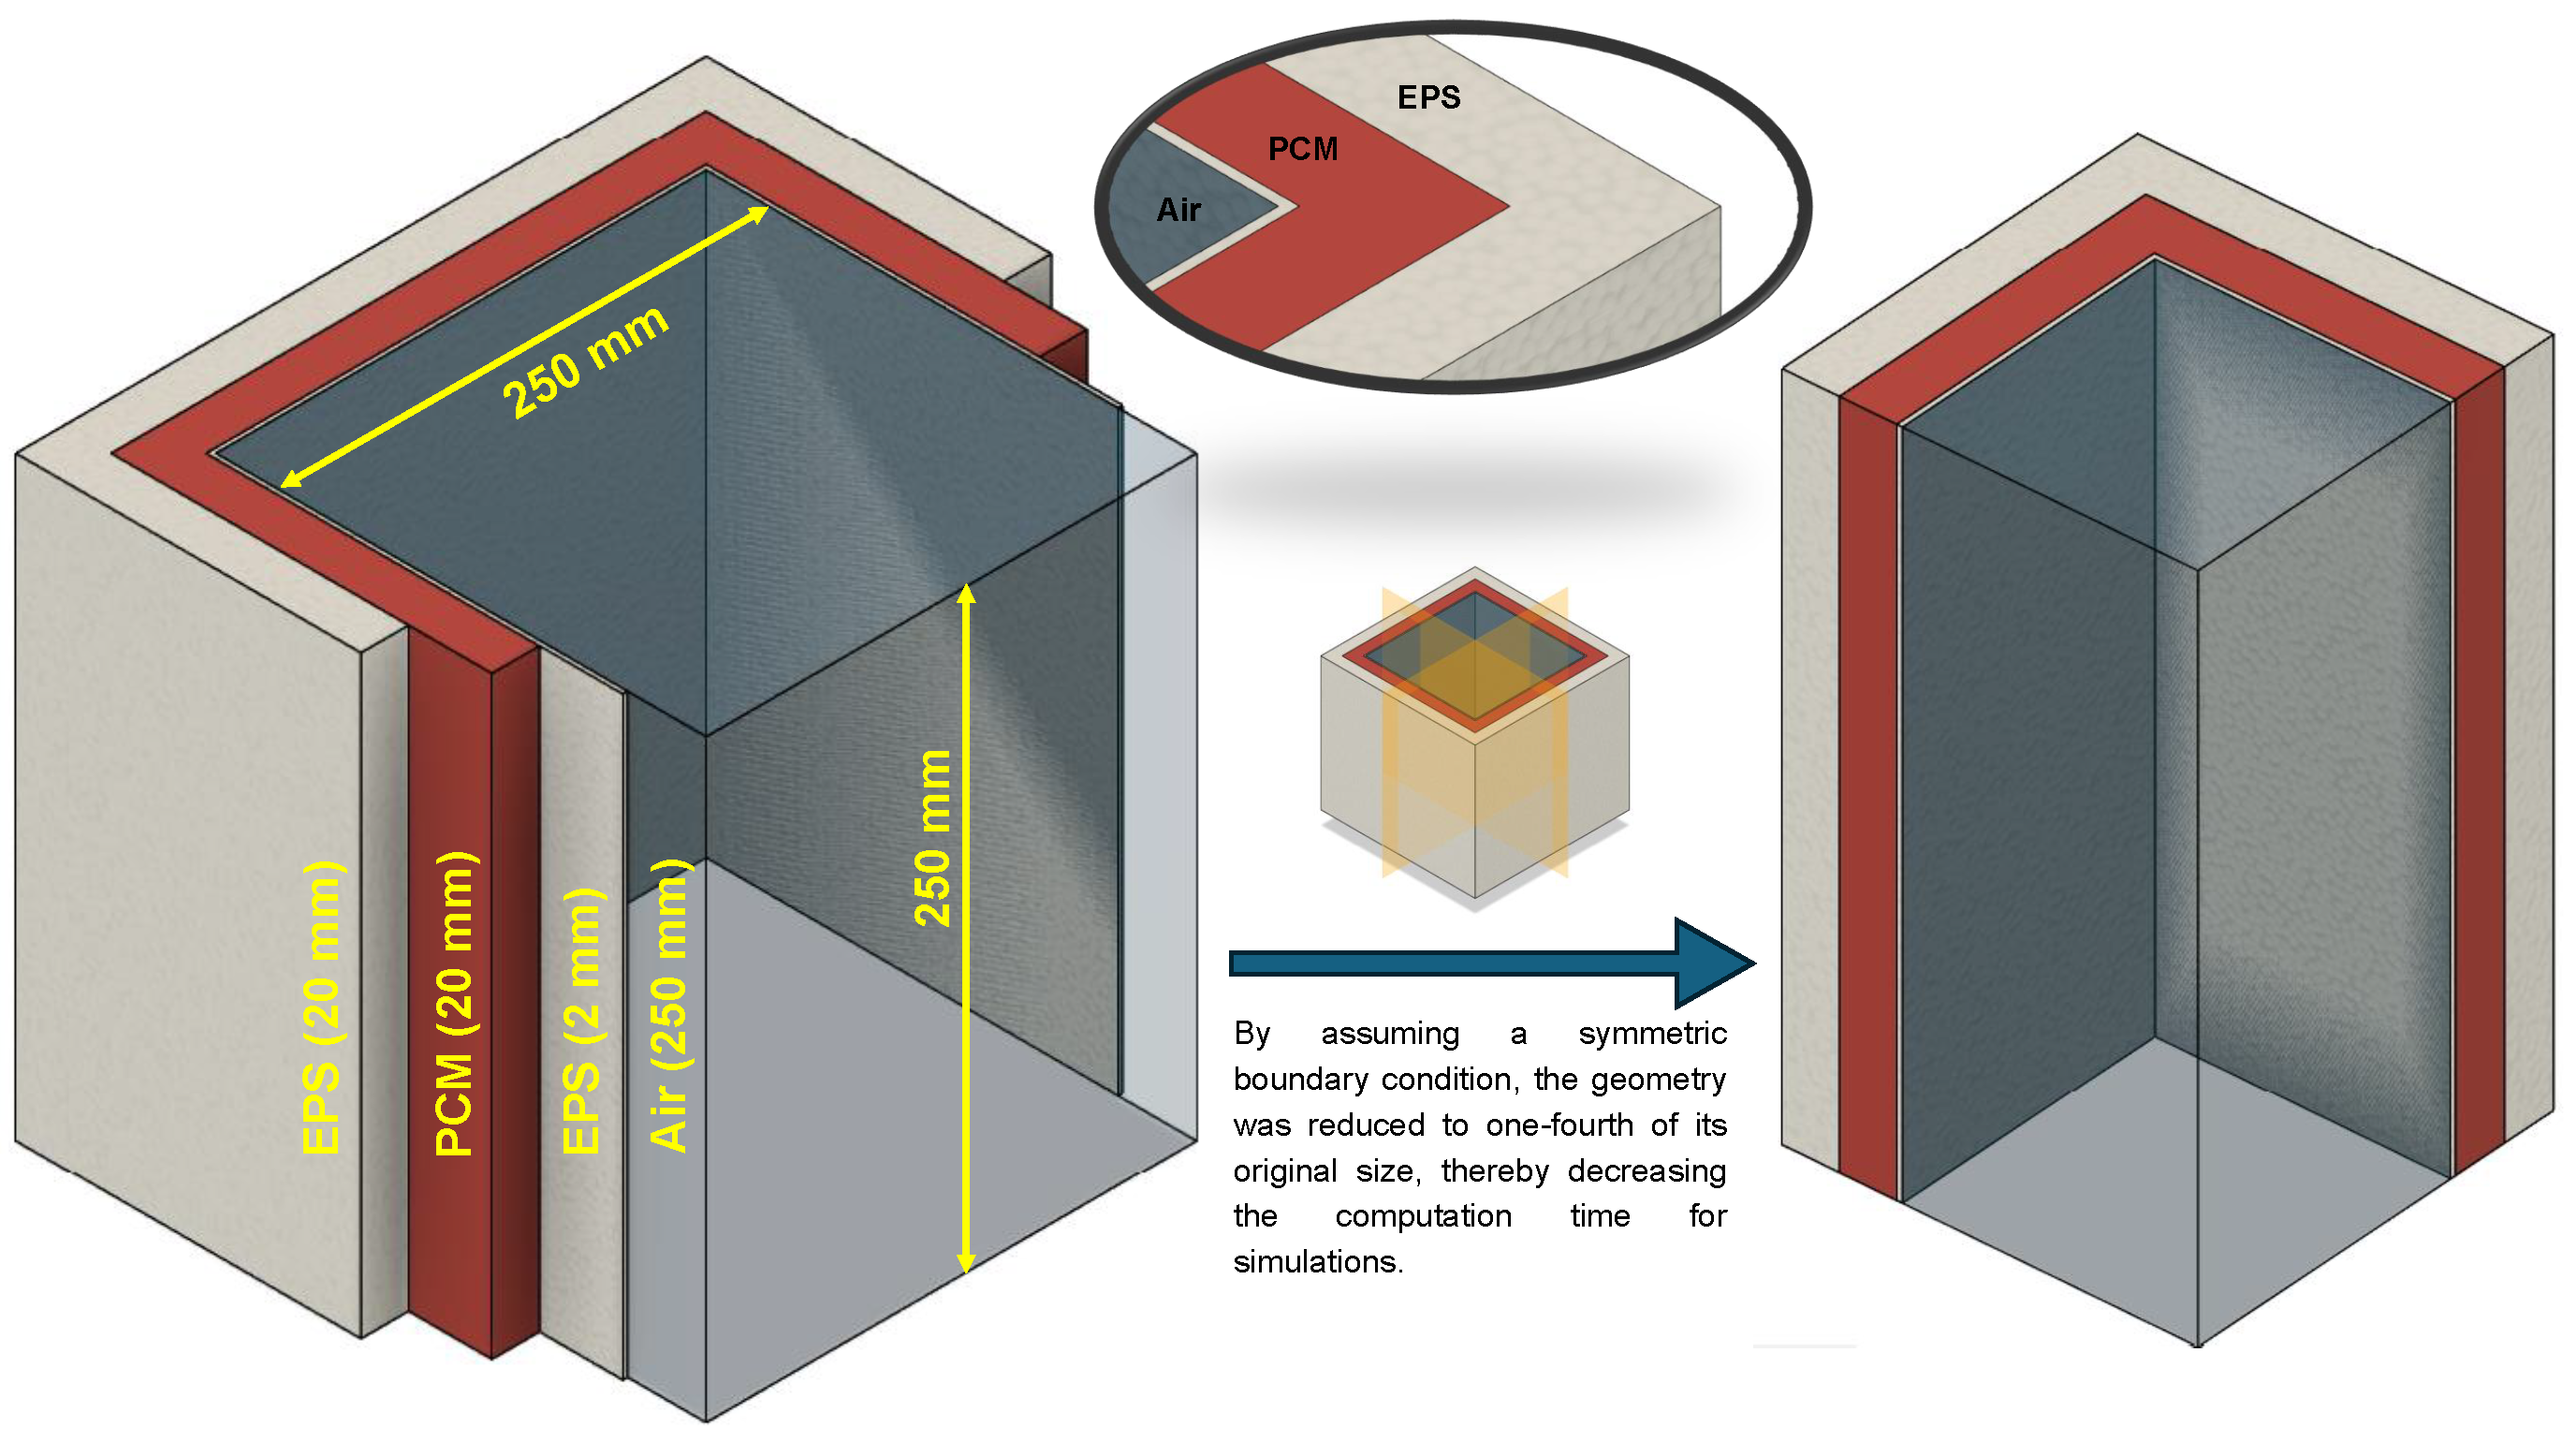
The search for additives aimed to identify materials that could increase the duration of the maintenance of temperature inside the cold box for vaccine delivery for longer duration. Simulations were conducted using ANSYS Fluent v 2022 with a mixture of 5% additive and 95% PCM to study the melting process and identify effective candidates for slowing melting. The simulations were conducted on a system equipped with 16 GB of RAM, 6 logical cores, and a memory speed of 3200 MT/s. The model used SP-50 as the PCM and was structured with a 2D geometry comprising an outer insulation layer (20 mm), a 10 mm SP-50 layer, an inner insulation layer (2 mm), and a central air cavity, as depicted in Figure 2. In this initial pilot study, the primary objective was to identify which additive effectively slows down the melting rate of the PCM. To reduce computation time, only one half of the geometry was simulated, assuming symmetry along the vertical plane passing through the center of the geometry.
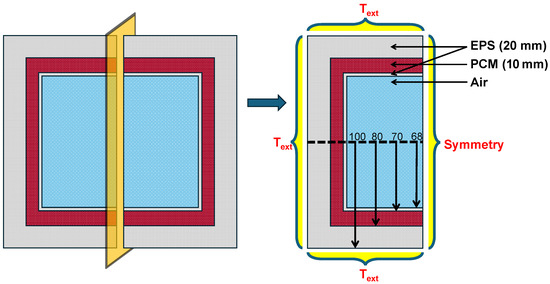
Figure 2.
Schematic and boundary conditions of the 2D geometry for the initial pilot study conducted to identify suitable additives for decelerating the melting of SP-50 PCM.
2.1. Mesh and Time Step Independence
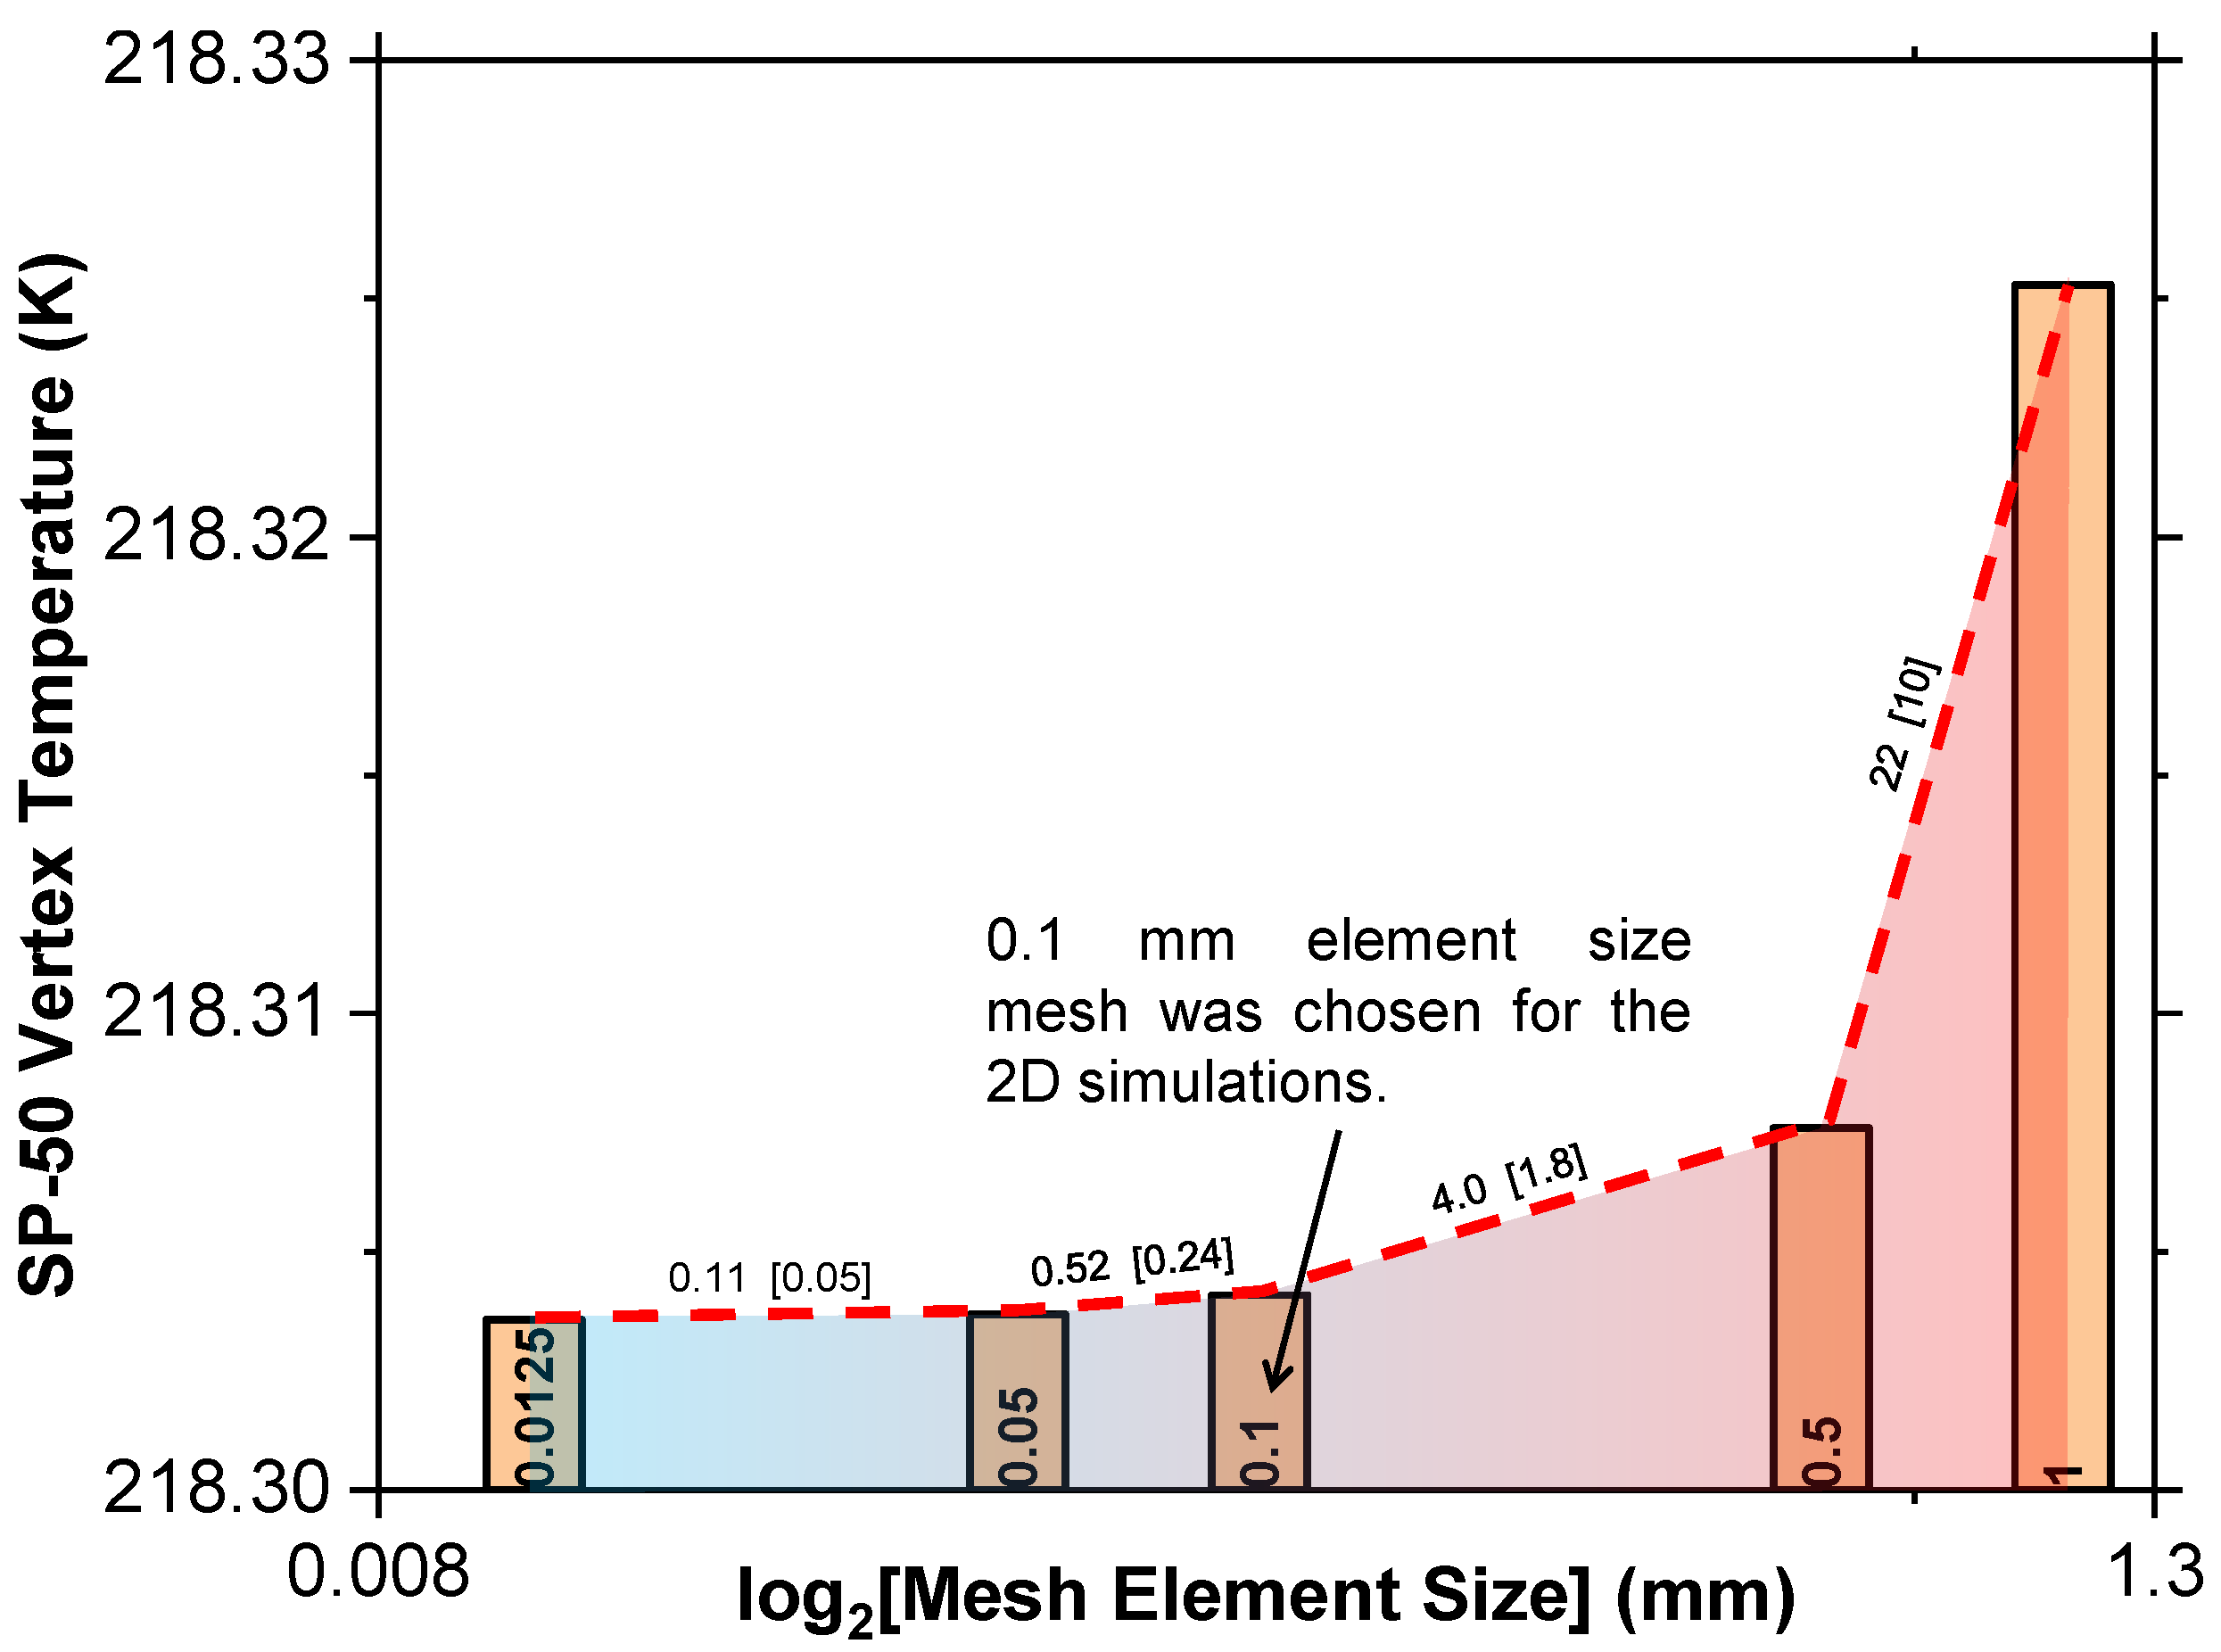
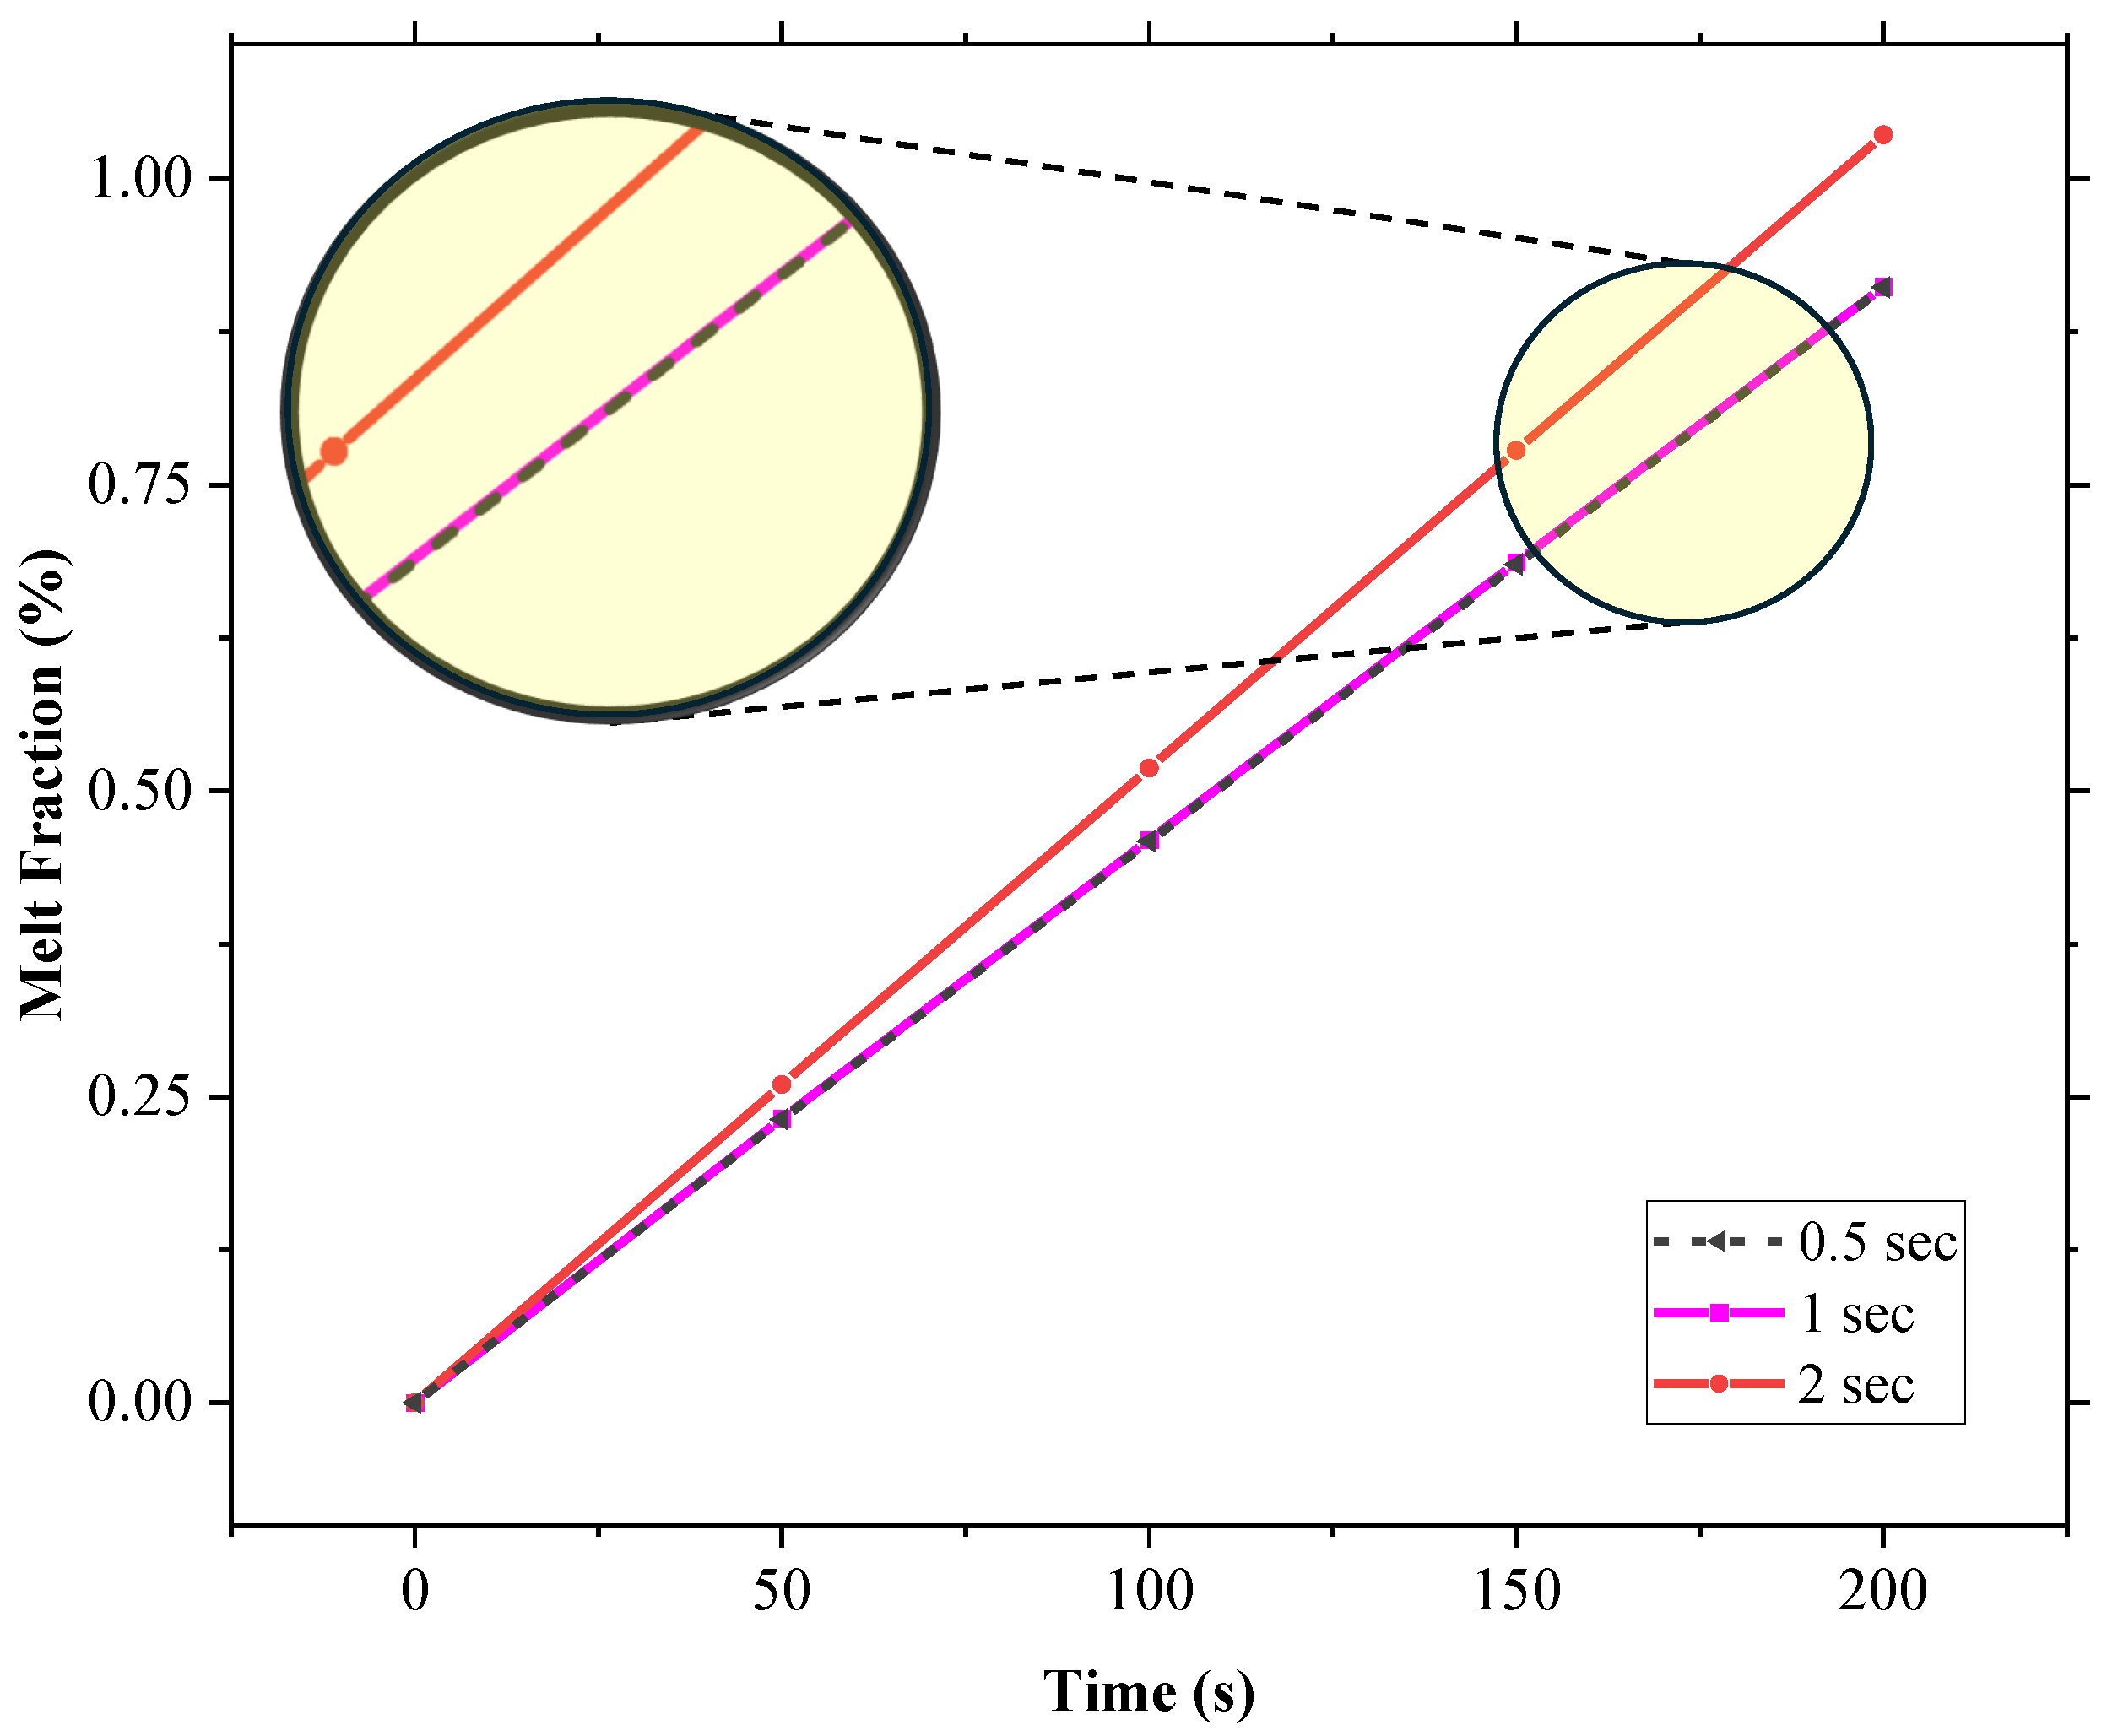
A mesh independence study tested element sizes from 0.01 mm to 1 mm, monitoring the temperature at the top left vertex of SP-50 after 15,000 s, as depicted in Figure 3. It was, therefore, concluded that a mesh size of 0.1 mm was optimal, and a time step independence analysis found a 1 s time step as appropriate for the initial conditions, as shown in Figure 4.

Figure 3.
Mesh independence test for the 2D geometry utilized in this study.
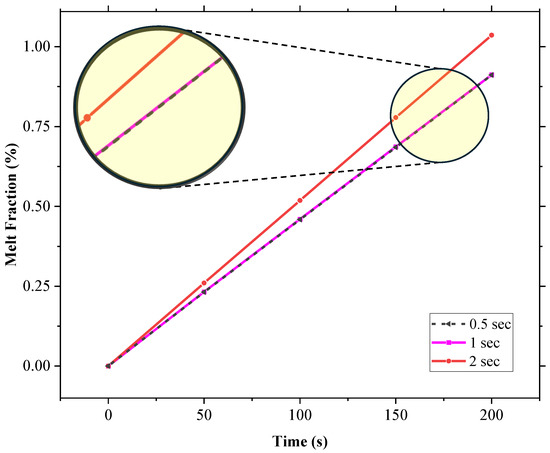
Figure 4.
Time step independence test for the 2D geometry utilized in this study.
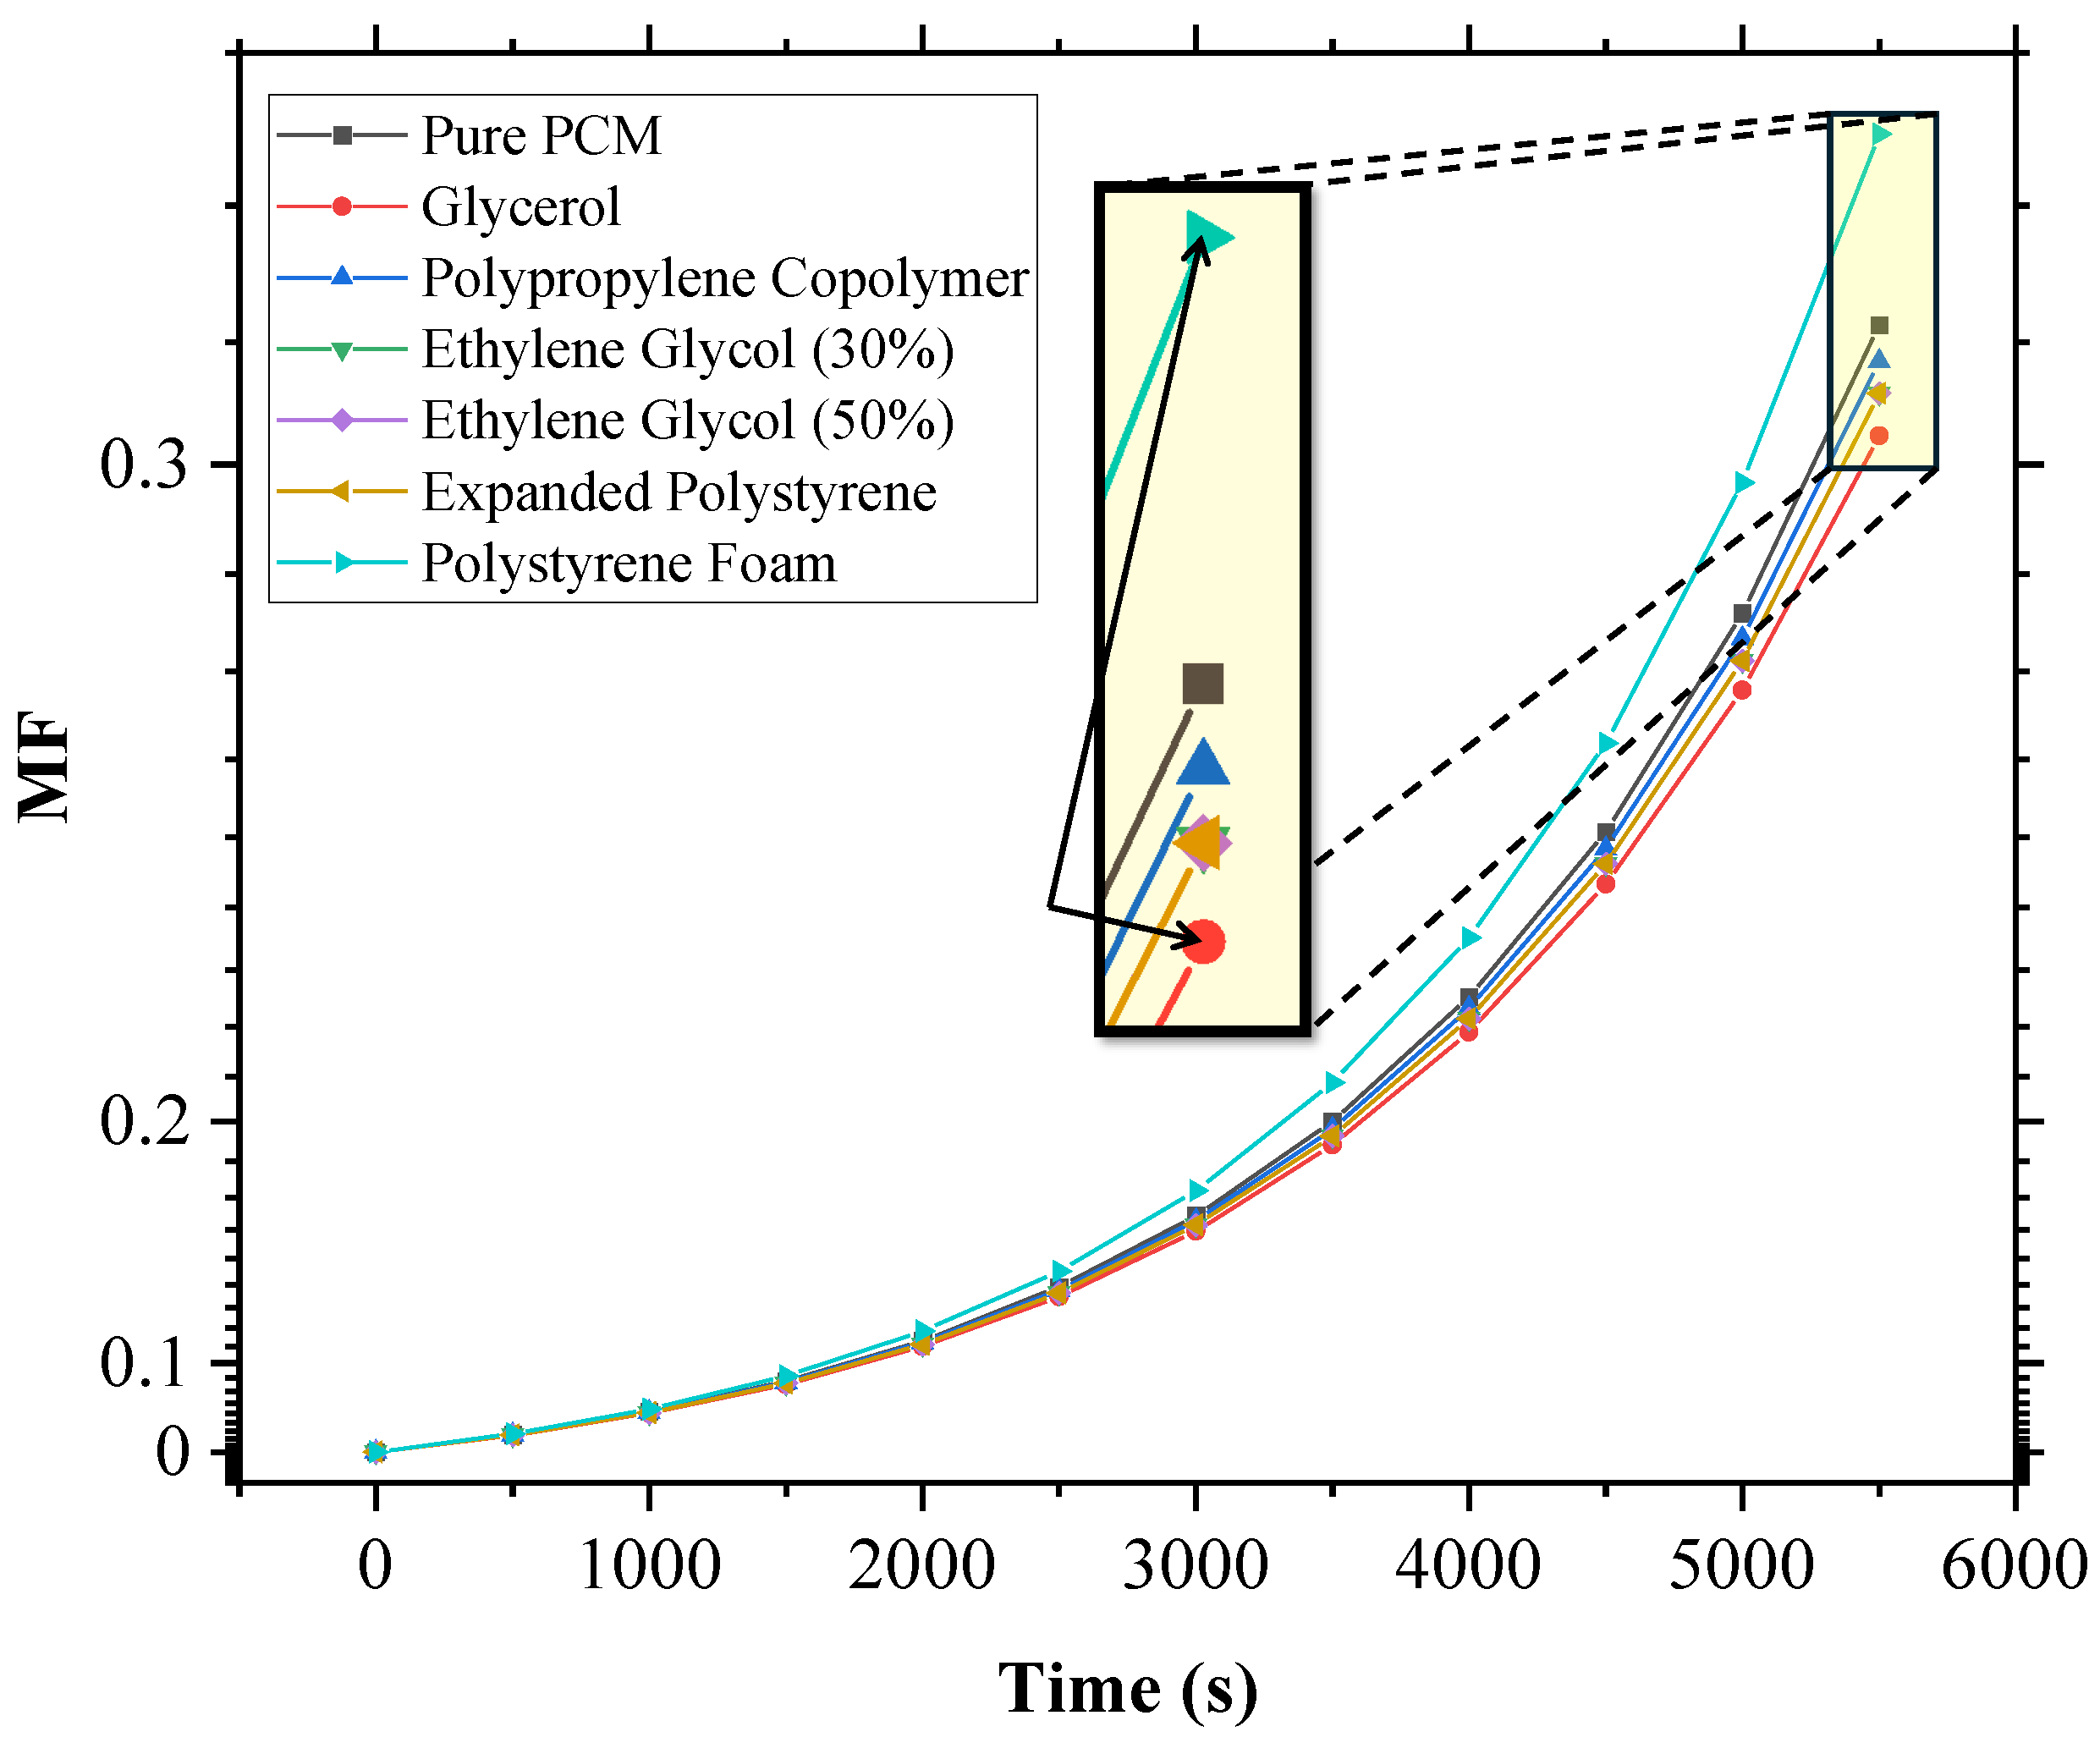
With the parameters optimized, various additives were tested at a 5% volume fraction—polypropylene co-polymer, ethylene glycol (30% and 50%), glycerol, expanded polystyrene (EPS), and polystyrene foam, whose properties are taken from Table 1.

Table 1.
Thermal properties of additives [22].
The melting performance was compared for SP-50 and SP-50 with additives, with the properties of SP-50 sourced from Ray et al. [23]. These specific additives were chosen due to their low thermal conductivity. As the focus was on deriving qualitative insights rather than quantitative data, harsher boundary conditions were deliberately employed. With an initial temperature of −55 °C, the external temperature () was set to 350 K, coupled with natural convection characterized by a heat transfer coefficient of h = 8.5 W/m2·K. These conditions were imposed for rapid melting, allowing for a faster evaluation of the additives and their relative impact on PCM performance.
The MF versus time plot for SP-50, with all the additives at a 5% volume fraction concentration, was plotted (Figure 5) and analyzed, and it was found that glycerol performed the best, as its MF vs. time curve was the lowest, indicating the greatest reduction in melting speed. The performance ranking of the additives, in terms of their effectiveness at reducing melting speed, was observed to be as follows: glycerol > expanded polystyrene ≈ ethylene glycol (30%) ≈ ethylene glycol (50%) > polypropylene co-polymer. Interestingly, polystyrene foam had a counterproductive effect, accelerating the melting process faster than pure SP-50.

Figure 5.
Melt fraction (MF) vs. time plot for SP-50 and its 5% additive mixtures under harsh conditions (350 K, h = 8.5 W/m2·K), providing qualitative insights into additive performance. SP-50 properties from Ray et al. [23].
To further study the performance of glycerol in reducing the melting speed of the PCM, refined simulations under better ambient conditions ( 0 °C, h = 8.5 W/m2·K and the same initial temperature of −55 °C) were conducted.
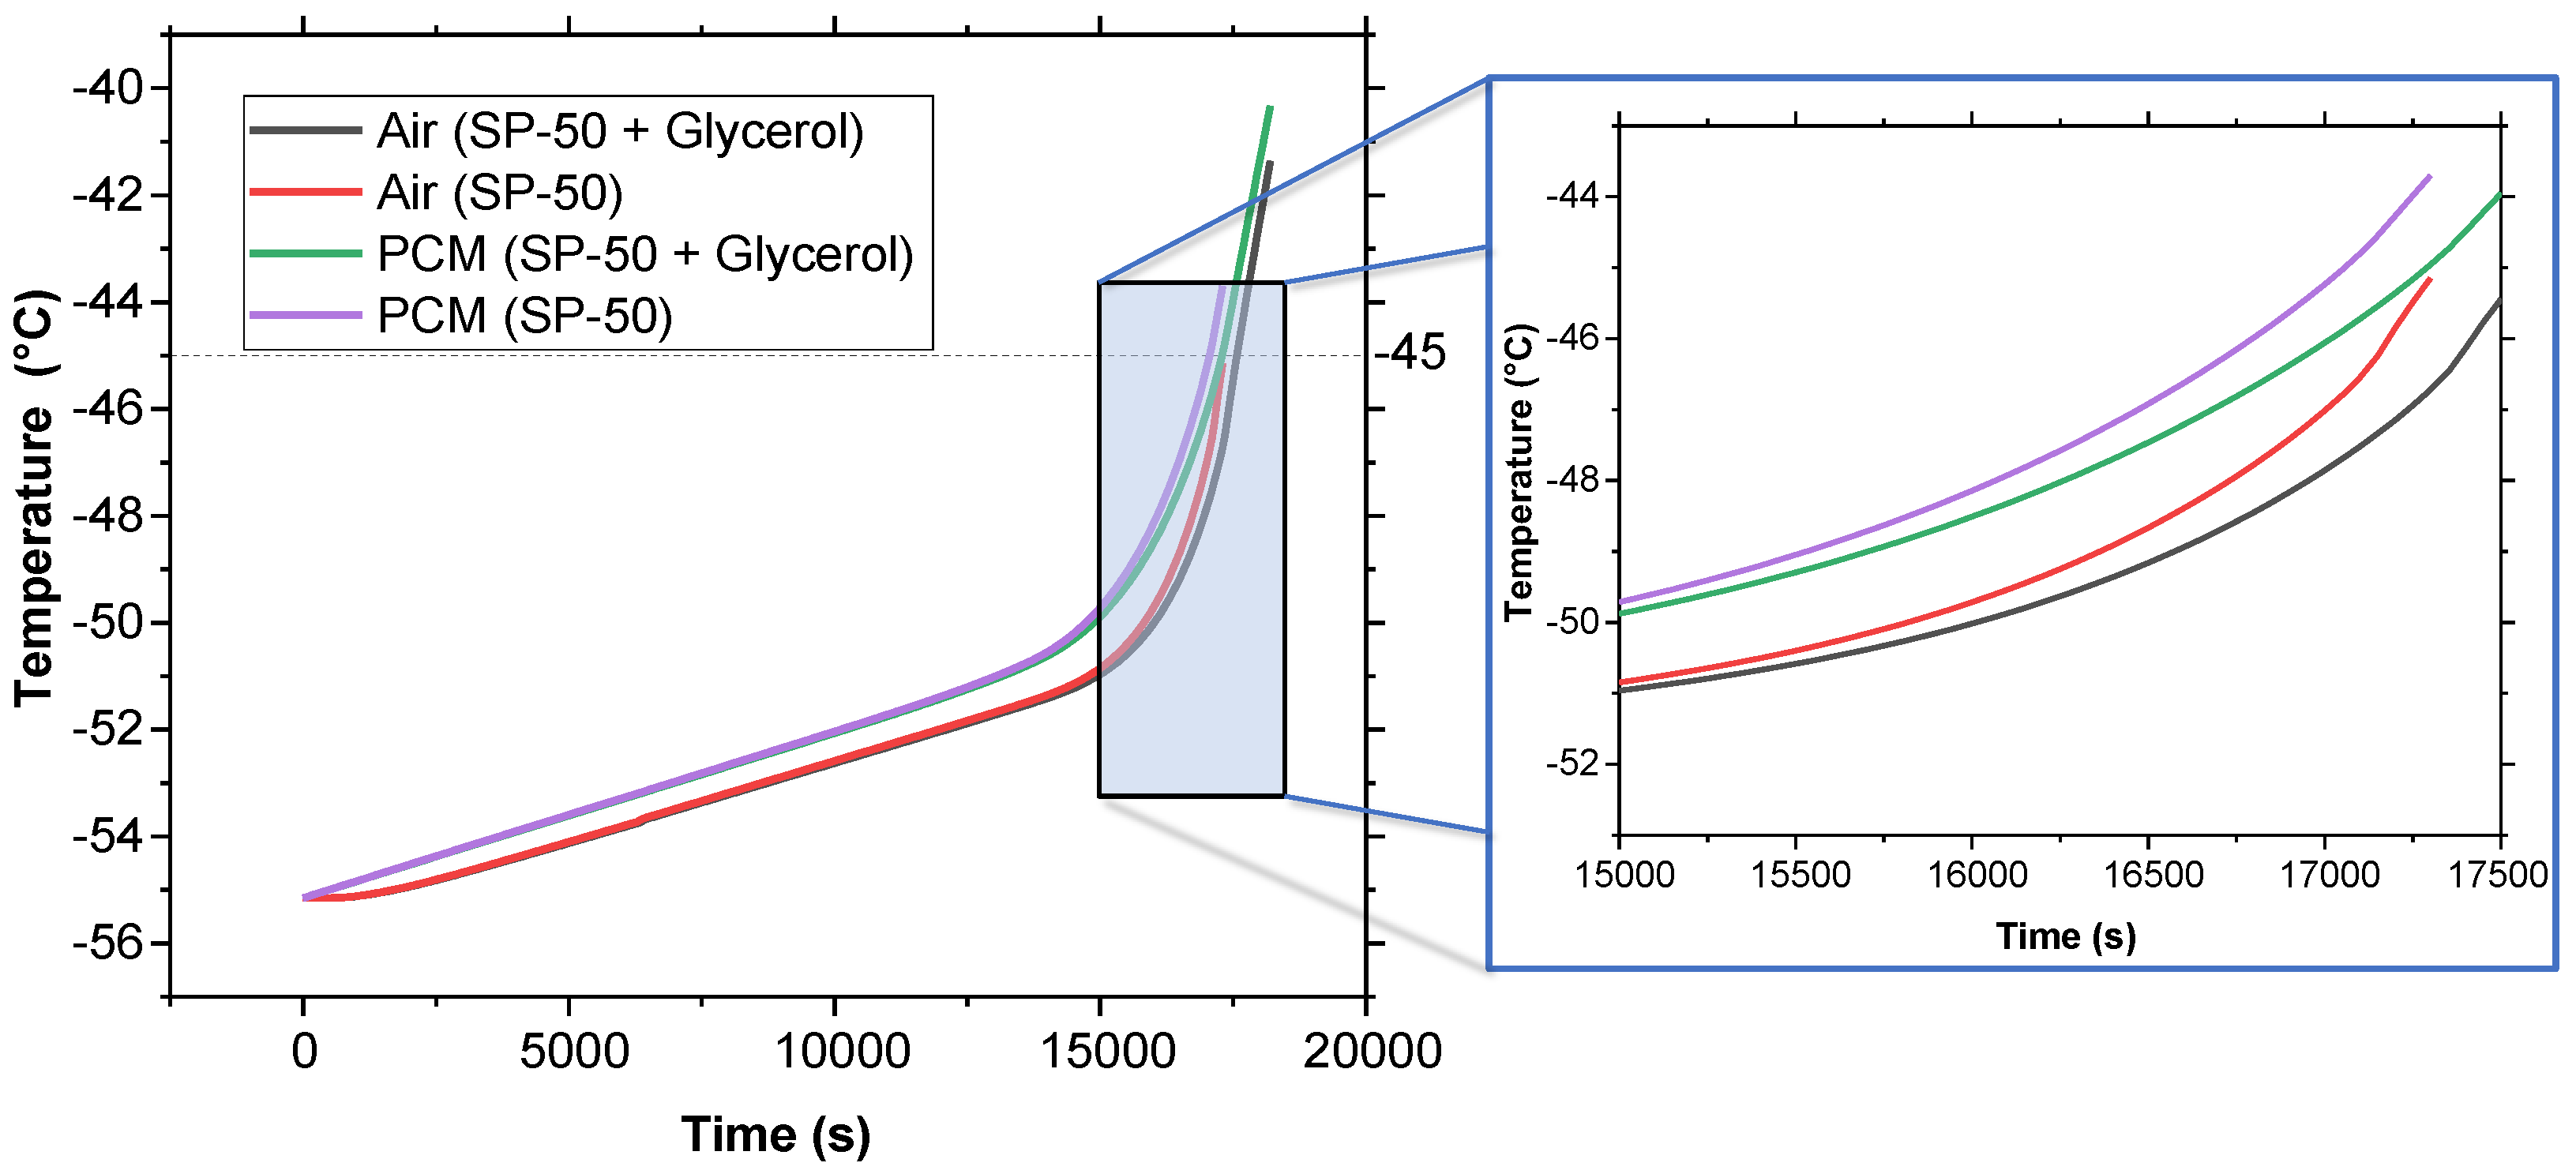
2.2. Initial Results with SP-50
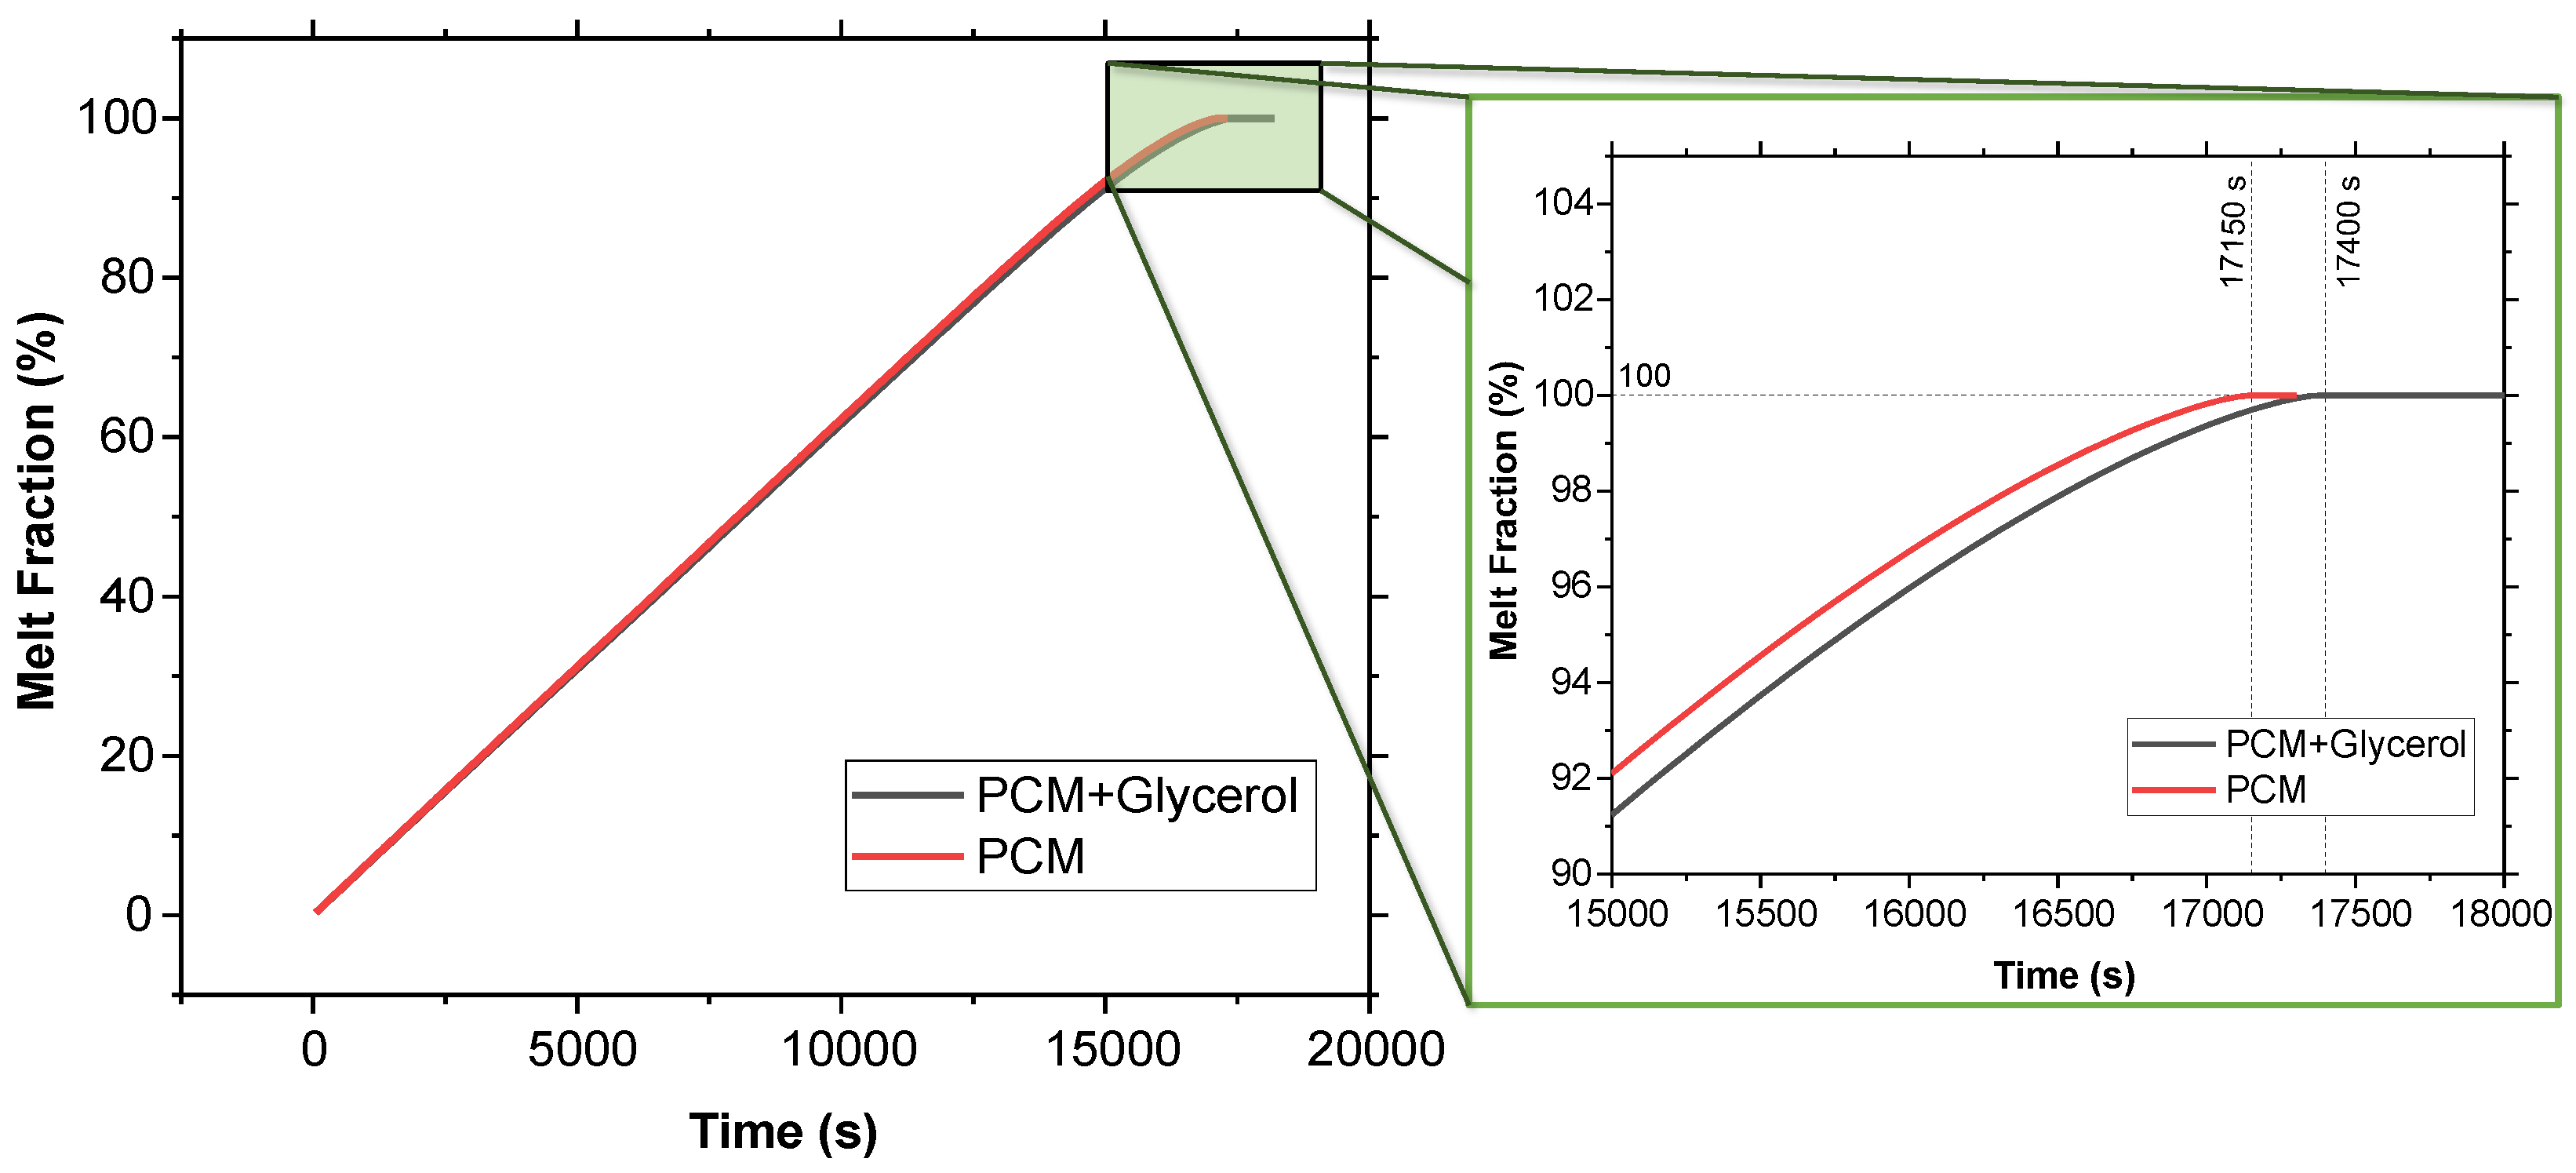
Figure 6 presents the melt fraction (MF) vs. time curve for the melting of pure SP-50 compared to SP-50 with a 5% volume fraction of glycerol added. Additionally, Figure 7 illustrates the temperature vs. time curve for both cases within the PCM domain, as well as the air cavity located inside the PCM domain (refer to Figure 2). The simulation results show that SP-50 melted completely in 17,150 s, while SP-50 mixed with 5% volume fraction of glycerol took slightly longer, melting in 17,400 s. This indicates that the improvement provided by the addition of glycerol was unsatisfactory. The increase in melting time—only 250 s above the base case of 17,150 s—was minimal. The 250 s increment over 17,150 s due to the addition of glycerol suggests that even if the results were simply linearly interpolated, for a typical 120 h vaccine transport duration, we would only gain about 1.75 h of extended cooling time—a marginal improvement at best. Despite these underwhelming results, glycerol was tested again with 3D geometry and higher external temperature conditions.
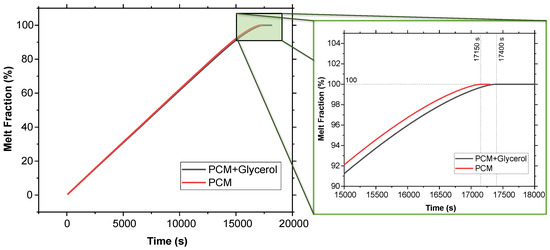
Figure 6.
Melt fraction vs. time comparison between SP-50 and SP-50 + 5% volume fraction of glycerol using 2D geometry.

Figure 7.
Temperature vs. time comparison between SP-50 and SP-50 + 5% volume fraction of glycerol using 2D geometry.
3. Methods
3.1. Numerical Formulation
Computational simulations were conducted utilizing the pressure-based model due to its compatibility with the melting and solidification processes in ANSYS Fluent v 2022. Transient simulations were performed to accurately depict temporal changes. The SIMPLE pressure–velocity coupling method was used, alongside the PRESTO! pressure solver, and a second-order upwind scheme was employed for the precise calculation of momentum and energy equations. The under-relaxation factors for the pressure correction, density, body forces, momentum, liquid fraction, and thermal energy were specified as 0.3, 1, 1, 0.7, 0.9, and 0.95, respectively. Convergence criteria were established at for the continuity and momentum equations, and at for the energy equation.
The numerical simulation of PCM melting dynamics, both with and without additives, was based on the following fundamental assumptions:
- Isotropic and Homogeneous Medium: The PCM matrix is assumed to be isotropic and homogeneous, neglecting microscale variations in density, viscosity, or composition due to their minimal influence under steady-state and transient conditions with a homogeneous distribution of the additives (if present) in the PCM domain.
- Negligible Volumetric Expansion: Volumetric changes during the phase transition are assumed to be inconsequential due to the limited expansion or contraction of the PCM, rendering their impact negligible within the temporal resolution of the computational domain.
- Omission of Radiative Heat Transfer: Radiative heat transfer mechanisms are disregarded, as conduction is the primary mode of heat transfer within the PCM due to its low thermal diffusivity.
- Laminar Flow Assumption: Flow within the PCM is modeled as a closed system with negligible kinetic energy, assuming laminar flow due to a low Reynolds number.
- Absence of Internal Heat Generation: Internal heat generation is assumed to be absent within the PCM matrix, as there are no volumetric or chemical heat sources.
- Air Instead of Vaccines: The PCM box is assumed to contain air instead of vaccines for a conservative analysis; as air heats faster, it yields a more cautious temperature reading.
3.2. Mathematical Model
In taking into account the assumptions mentioned above, the following equations were used: [24]
- Continuity:
- Momentum:
- Energy:
In the equations, denotes the density of the fluid; and w represent the velocity components in the x, y, and z directions, respectively; t indicates time; P signifies the pressure within the fluid; c denotes the specific heat capacity; T represents the temperature; and k refers to the thermal conductivity of the fluid.
To calculate the properties of ‘PCM + additives’, the following equations are utilized [25,26]:
- Density:
- Specific Heat Capacity:
- Thermal Conductivity:
- Melting point:
- Latent Heat:
where is the volume fraction, is the density, k is the thermal conductivity, T is the temperature, L is the melting heat, and R is the gas constant, R = 8.314 J/(mol·K).
4. Three-Dimensional Model Formulation
After the initial tests, glycerol was re-evaluated under smaller temperature gradients to simulate actual vaccine storage conditions (2–8 °C), and n-tetradecane was chosen as the new PCM instead of SP-50 due to its favorable melting point (5–6 °C) for vaccine transport, high latent heat of fusion, and use in prior studies [27,28,29]. The thermophysical properties of n-tetradecane (T), glycerol, and a mixture containing 5% glycerol (T + G) are provided in Table 2.
Table 2.
Thermophysical properties of n-tetradecane (T), glycerol, and the mixture of 5% volume fraction of glycerol to n-tetradecane (T + G) [22,30,31].
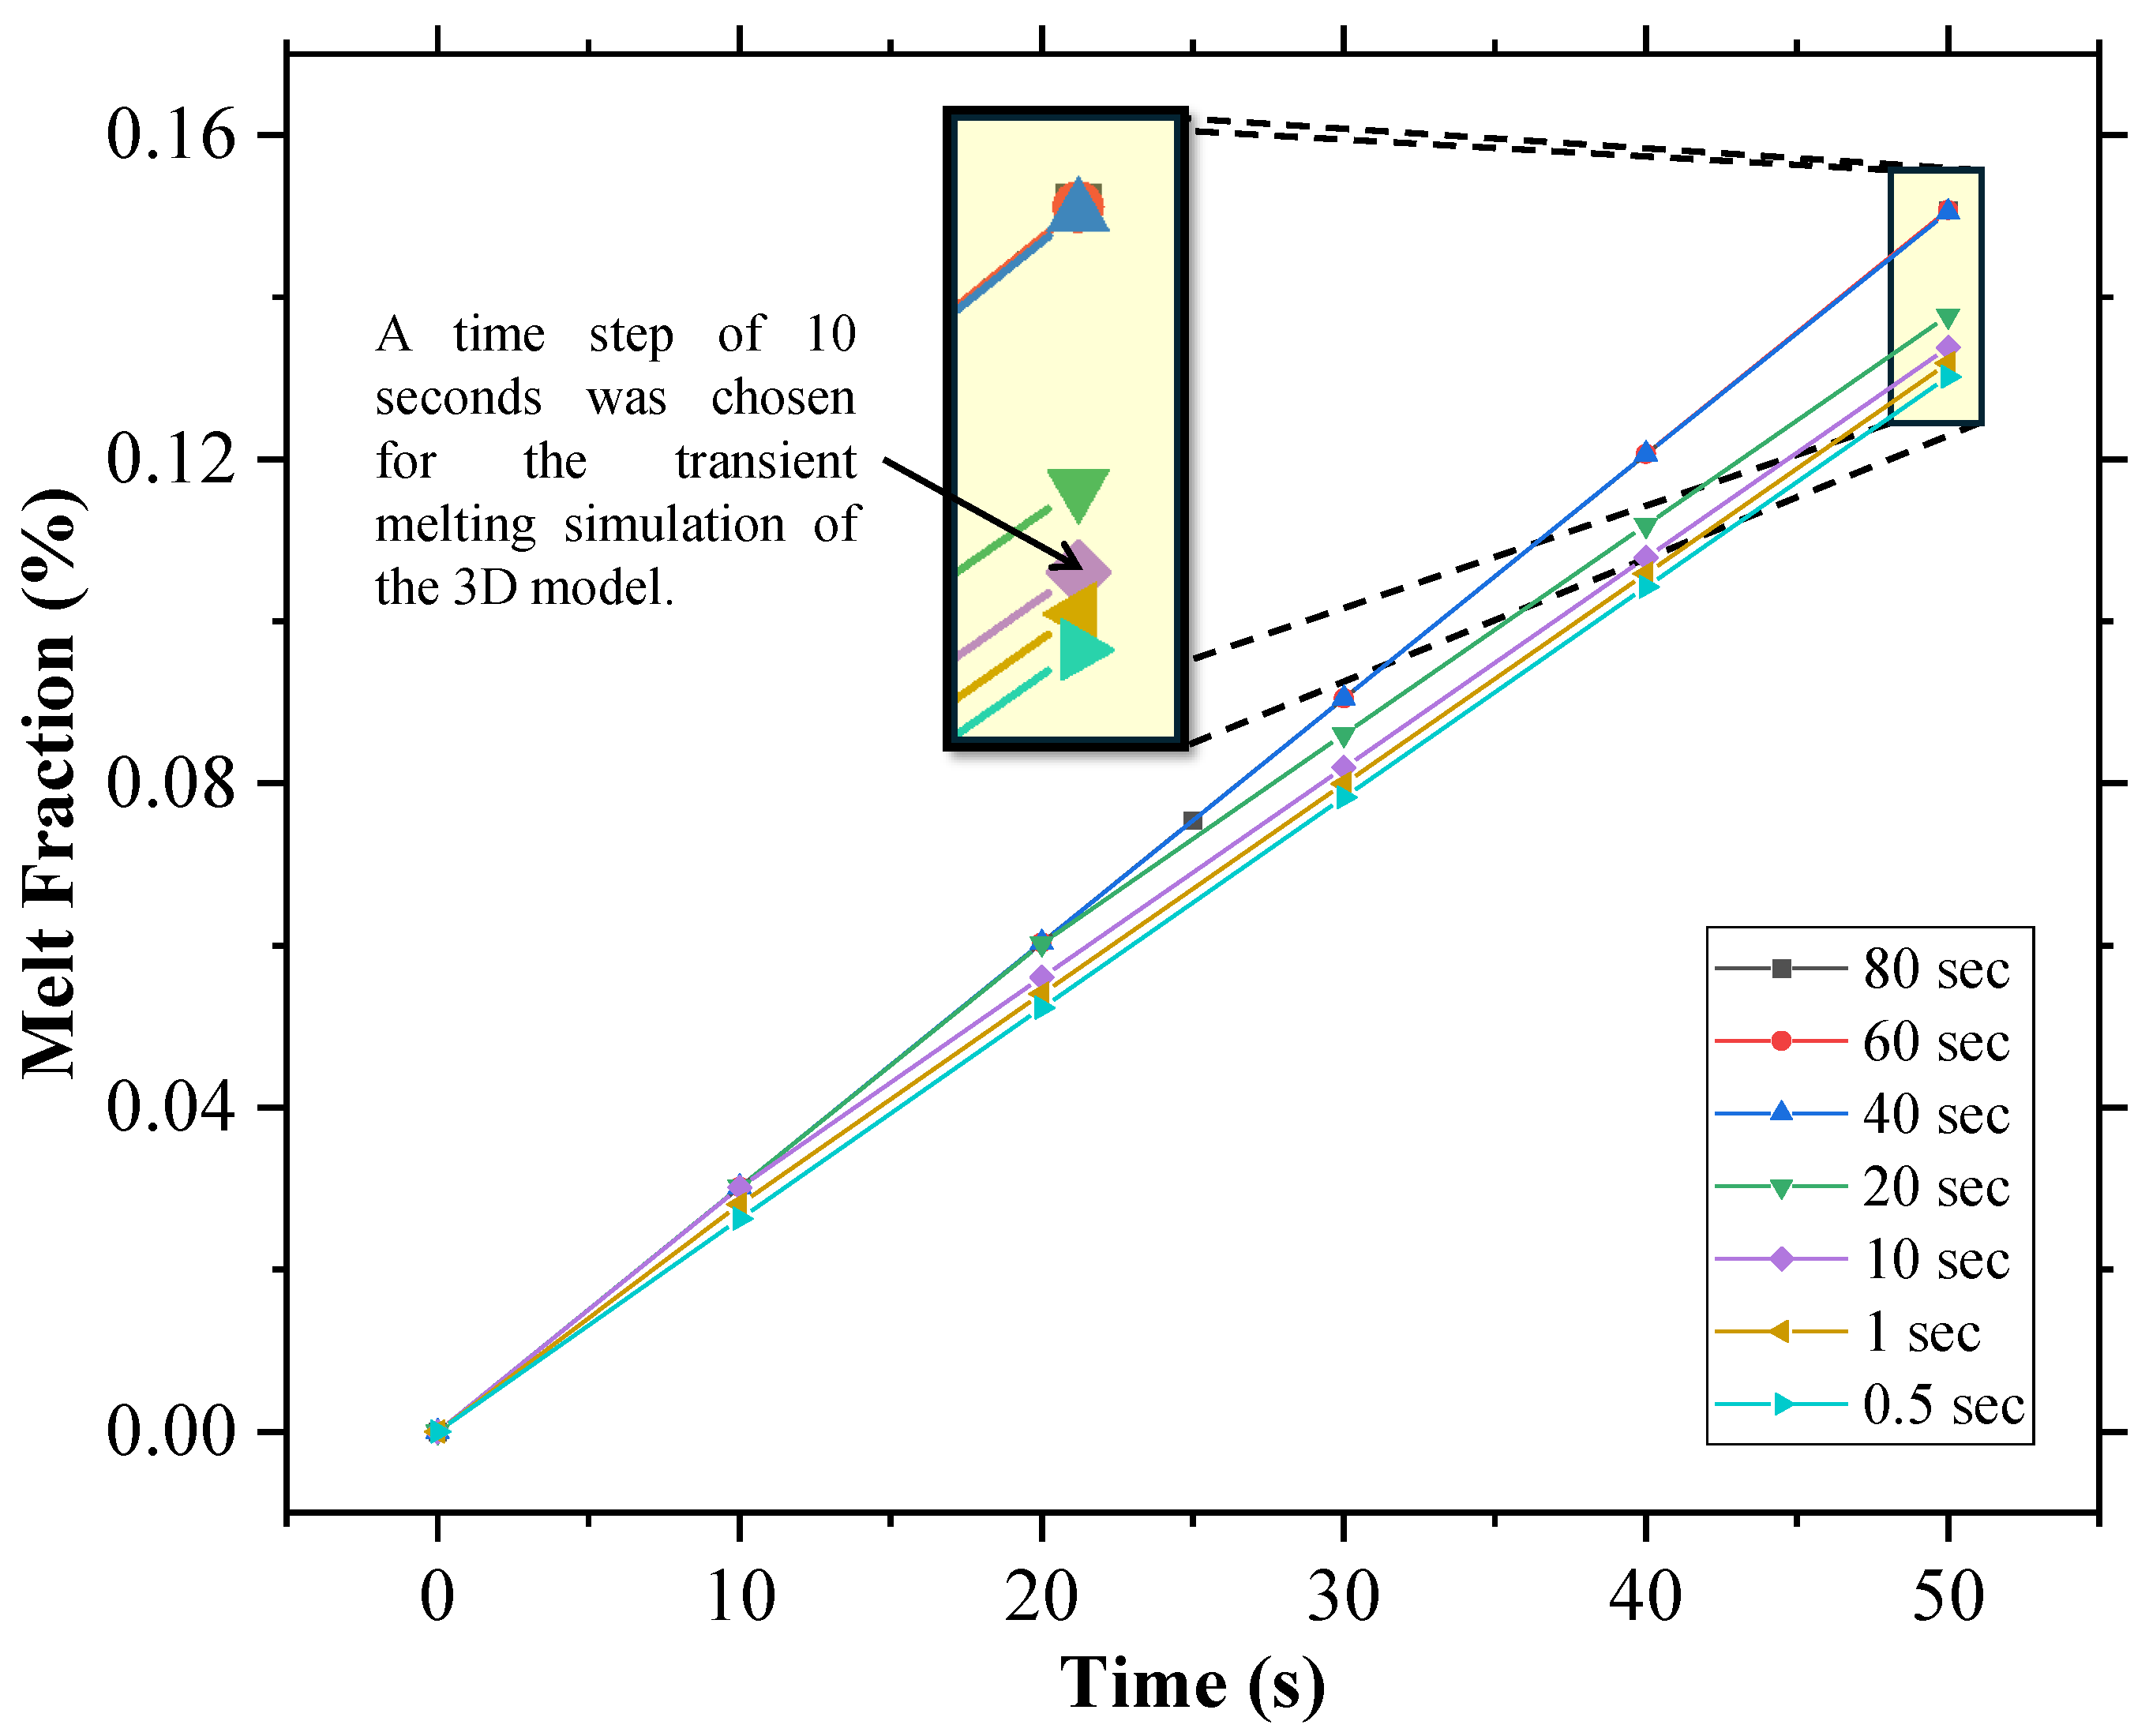
A 3D geometry (see Figure 8) was utilized, with an external temperature of 10 °C and a time step of 10 s (validated through time step independence analysis (see Figure 9) and grid convergence index (GCI), discussed in Section 4.2). Under these conditions, glycerol’s performance was promising, as discussed in detail in the subsequent sections. Similar geometries have also been used in the literature previously [32].

Figure 8.
Schematic of the 3D cold box geometry (one-fourth section used in the model to reduce computation time). Note: Dimensions mentioned in parenthesis represent thickness.
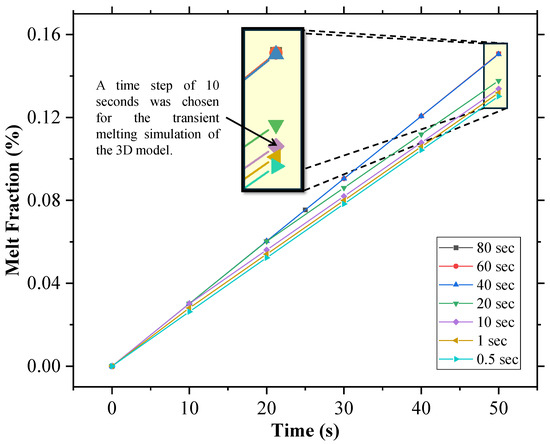
Figure 9.
Time step independence analysis for the 3D geometry of the cold box.
4.1. Initial and Boundary Conditions
Equations (1)–(5) utilize the following initial and boundary conditions:
- The cold box is subjected to an external environment with a temperature of 10 °C across all walls.
- The air contained within the box is maintained at a lower temperature of 2 °C from t = 0.
- The system is subjected to a forced convection current from outside characterized by a heat transfer coefficient of h = 8.5 .
4.2. Grid Convergence Index (GCI)
To strenghten our numerical model, a GCI analysis was performed following the guidelines recommended by ASME [33] to assess the accuracy of the numerical solution and ensure grid independence. It relies on the discretization error estimation method known as Richardson extrapolation (RE). For the accurate estimation of discretization errors, the solution must be within the asymptotic range. The RE method requires the exact solution, which is often unavailable in most practical applications [33]. Despite this limitation, the method remains widely adopted in contemporary research and was originally introduced by Richardson in the early 20th century [34,35]. It quantifies the sensitivity of the solution to further mesh refinement and provides an indication of how close the solution is to the asymptotic range. A smaller GCI value suggests that the solution is closer to achieving asymptotic convergence [36].
A representative mesh size is calculated as follows: [37]
where represents the volume of the ith cell, and N denotes the total number of cells in the computational domain. Three distinct mesh sizes (, where 1, 2, and 3 denote fine, medium, and coarse meshes, respectively) were selected, with a refinement factor (r) of 2. Simulations were then performed for variable , which represents the MF here. Typically, r should exceed 1.3, a value determined through practical experience. The refinement should be conducted systematically based on the refinement factor r, even when dealing with an unstructured grid. The refinement factor can be calculated by
Following this, an apparent order of accuracy (p) was defined:
Here, = − and = −. The convergence behavior based on the ratio of errors is as follows: Monotonic convergence occurs when , while oscillatory convergence happens for . indicates oscillatory divergence, and signals monotonic divergence. The grid in this case is made up of uniformly sized rectangular cells with no cell sizes approaching 0. So, the next step is to calculate the error estimates.
For the approximate relative error,
For the extrapolated relative error,
Finally, for the fine grid convergence index,
Here, 1.25 is the factor of safety. The is characterized by the percentage numerical error, with no iterative or rounding errors. The medium grid with 27,306 elements yielded a GCI of 0.34%, demonstrating that the numerical solution exhibits minimal discretization error.
The ratio indicates a decrease in error as the mesh is refined, confirming that the results are converging as expected. The apparent order of convergence also suggests moderate convergence behavior. These findings confirm that the grid refinement successfully minimized numerical errors and the solution was sufficiently accurate using the medium grid for the present study. These findings are presented in Table 3.
Table 3.
Grid convergence table for .
4.3. Validation
The present study was validated using the experimental and computational study on constrained melting of PCM in a spherical cavity in [38]. As shown in Figure 10, the MF vs. time results of both the experimental and numerical data from [38], as well as the numerical results from Sheikholeslami et al. [39], have been plotted.
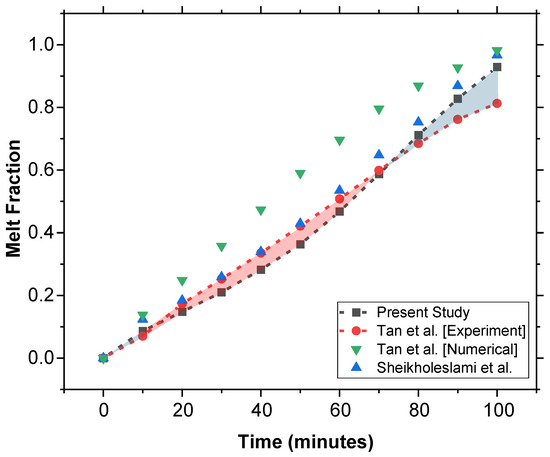
Figure 10.
Comparative validation of the model using experimental data from Tan et al. [38] along with a comparison of numerical models proposed in [38,39].
Our numerical model shows better agreement compared to the numerical model of Tan et al. [38]. This improvement in our results highlights the accuracy of our model in predicting the phase change behavior of PCM and thus validates our approach.
5. Discussion
5.1. Melting Behavior of n-Tetradecane and n-Tetradecane with Glycerol
Pure n-tetradecane (T) and n-tetradecane with 5% glycerol (T + G) were heated from an initial temperature of 2 °C to observe their melting behavior under external heat. The melt fraction (MF) versus time curve (Figure 11) shows that T fully melts in 121.7 h, while T + G takes 146.1 h, providing an extension of 24.4 h.
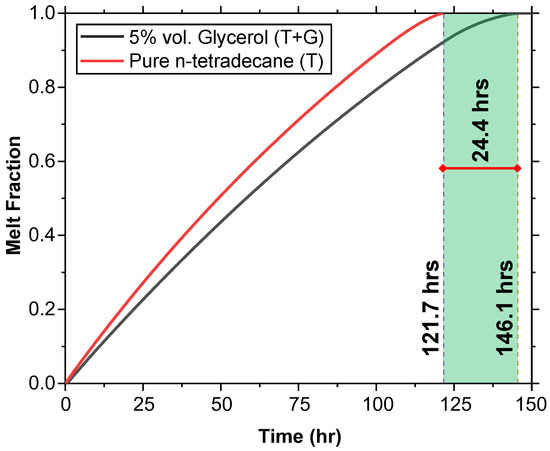
Figure 11.
Melting behavior comparison between T and T + G at an initial temperature of 2 °C. The melt fraction versus time curve shows that T fully melts in 121.7 h, while T + G extends the melt time by 24.4 h, melting in 146.1 h.
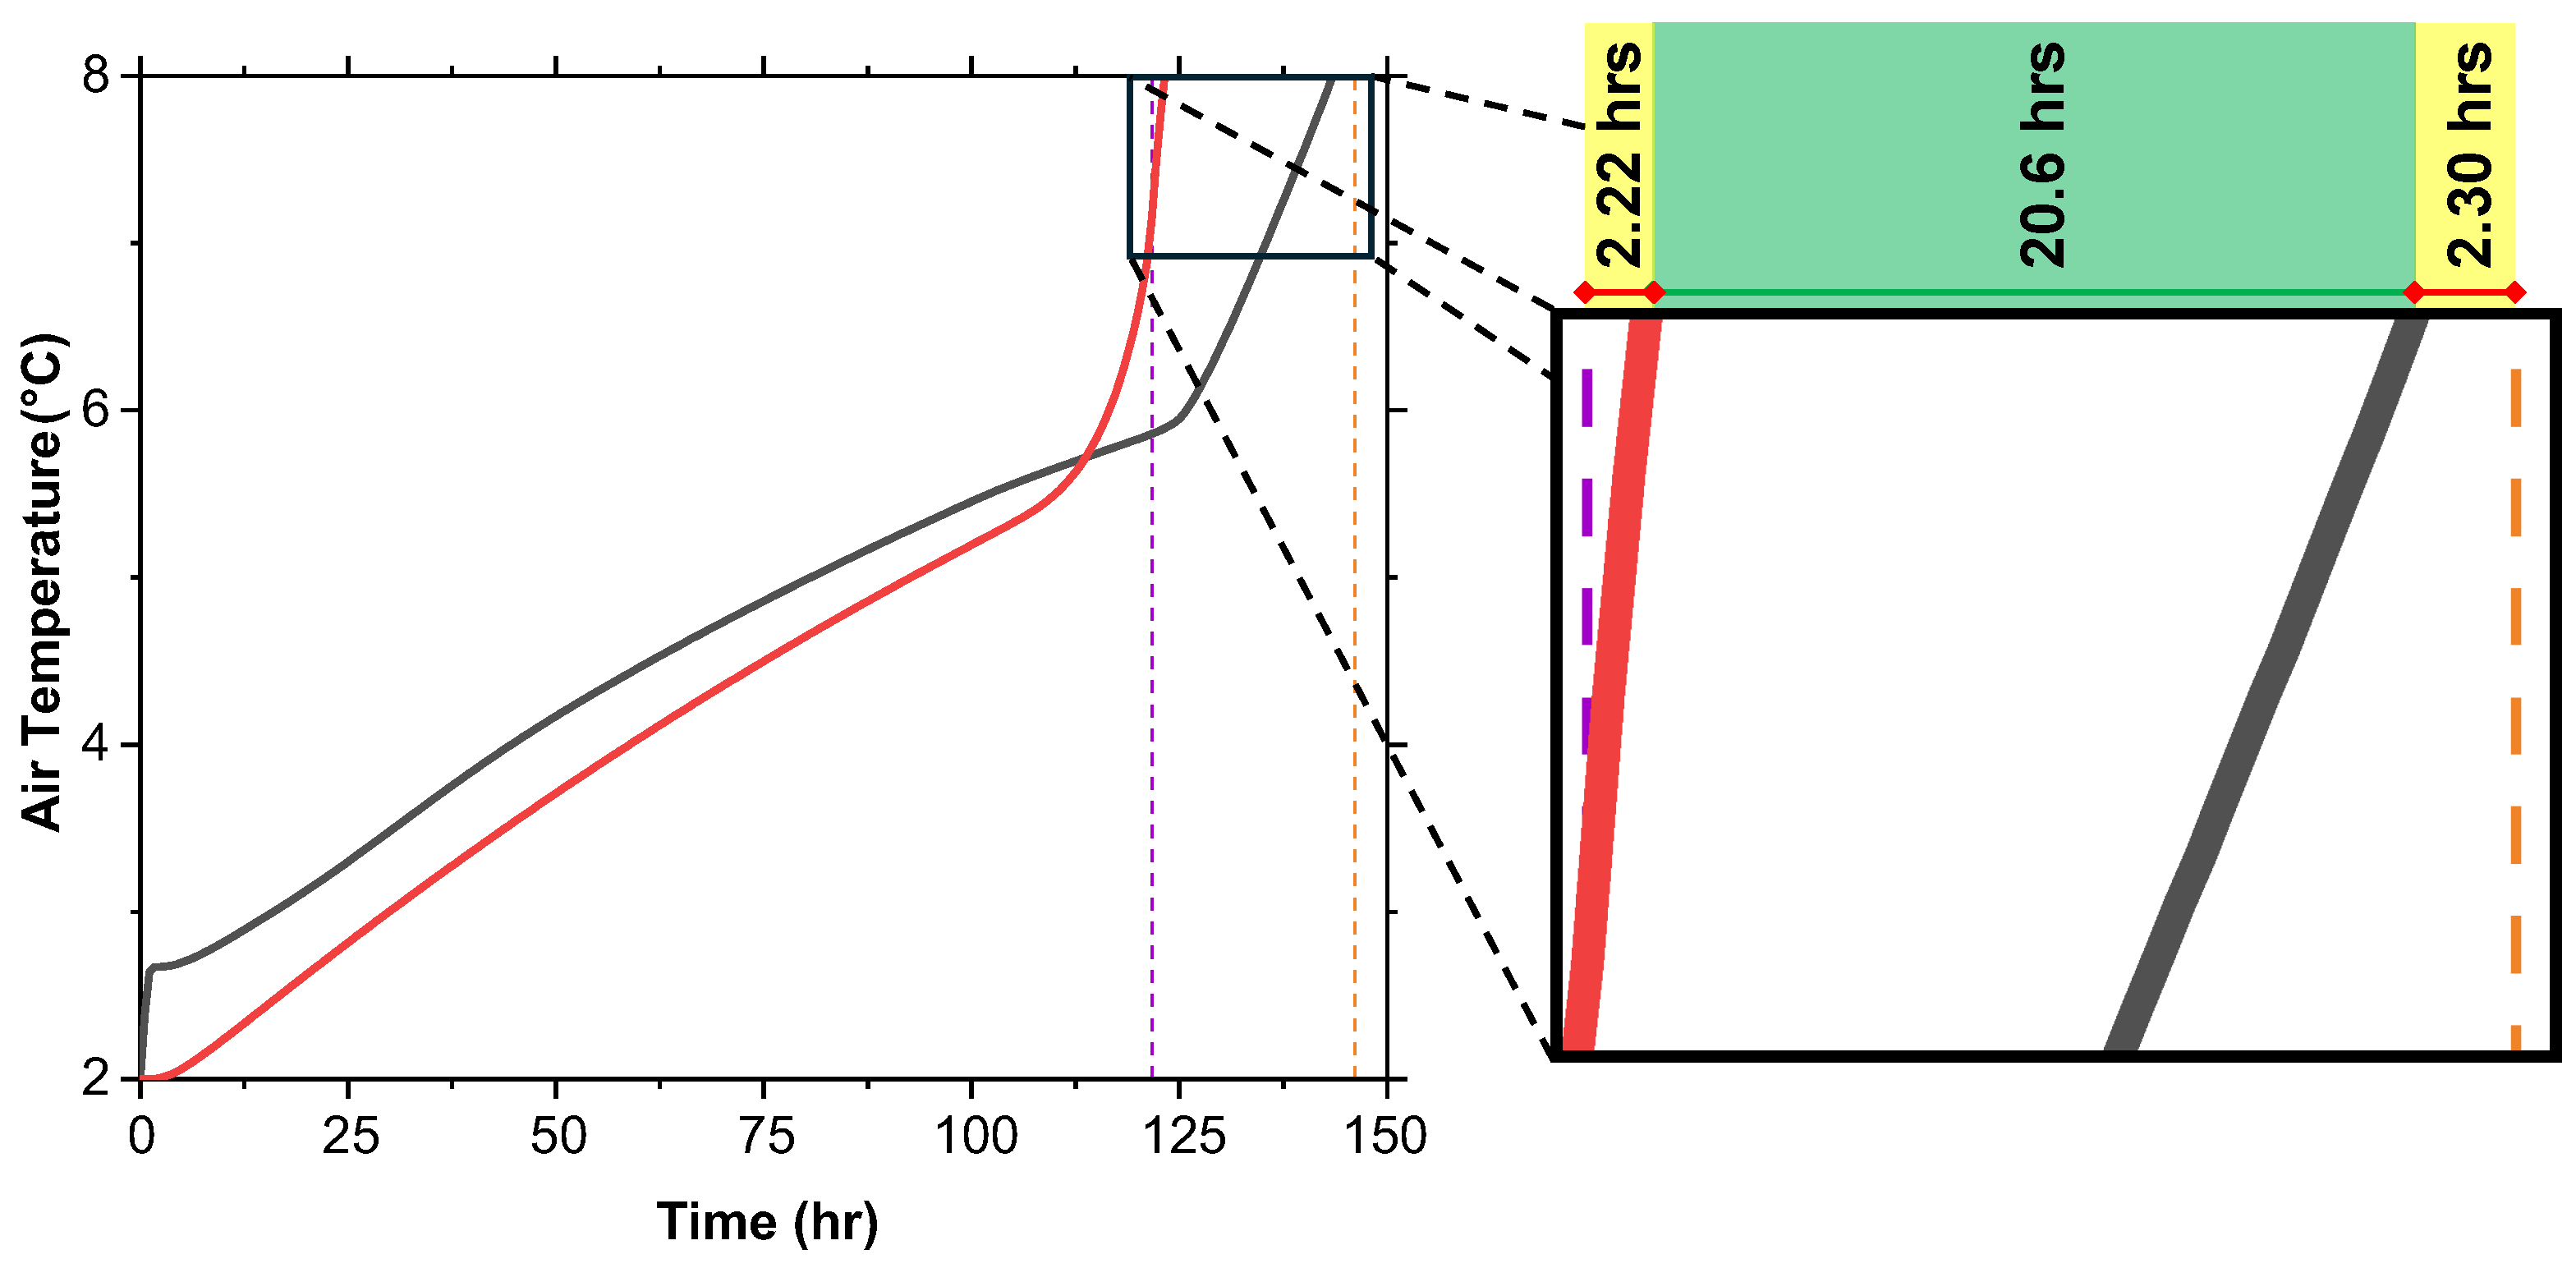
5.2. Internal Air Temperature and True Extension of Cooling
Although the MF reaching 100% does not guarantee the preservation of vaccine efficacy, the internal air temperature offers a more accurate measure of temperature control within the cold box. The average air temperature during the melting process is shown in Figure 12. It was observed that for T, the internal air temperature reaches the critical 8 °C threshold 1.6 h after the MF reaches 100%. For T + G, the air temperature reaches 8 °C approximately 2.2 h before the MF reaches 100%. Therefore, the true extension provided by T + G is approximately 20.6 h, not the full 24.4 h indicated by the MF.

Figure 12.
Internal air temperature versus time for T and T + G at initial 2 °C shows T + G maintaining below 8 °C longer, extending temperature control by 20.6 h.
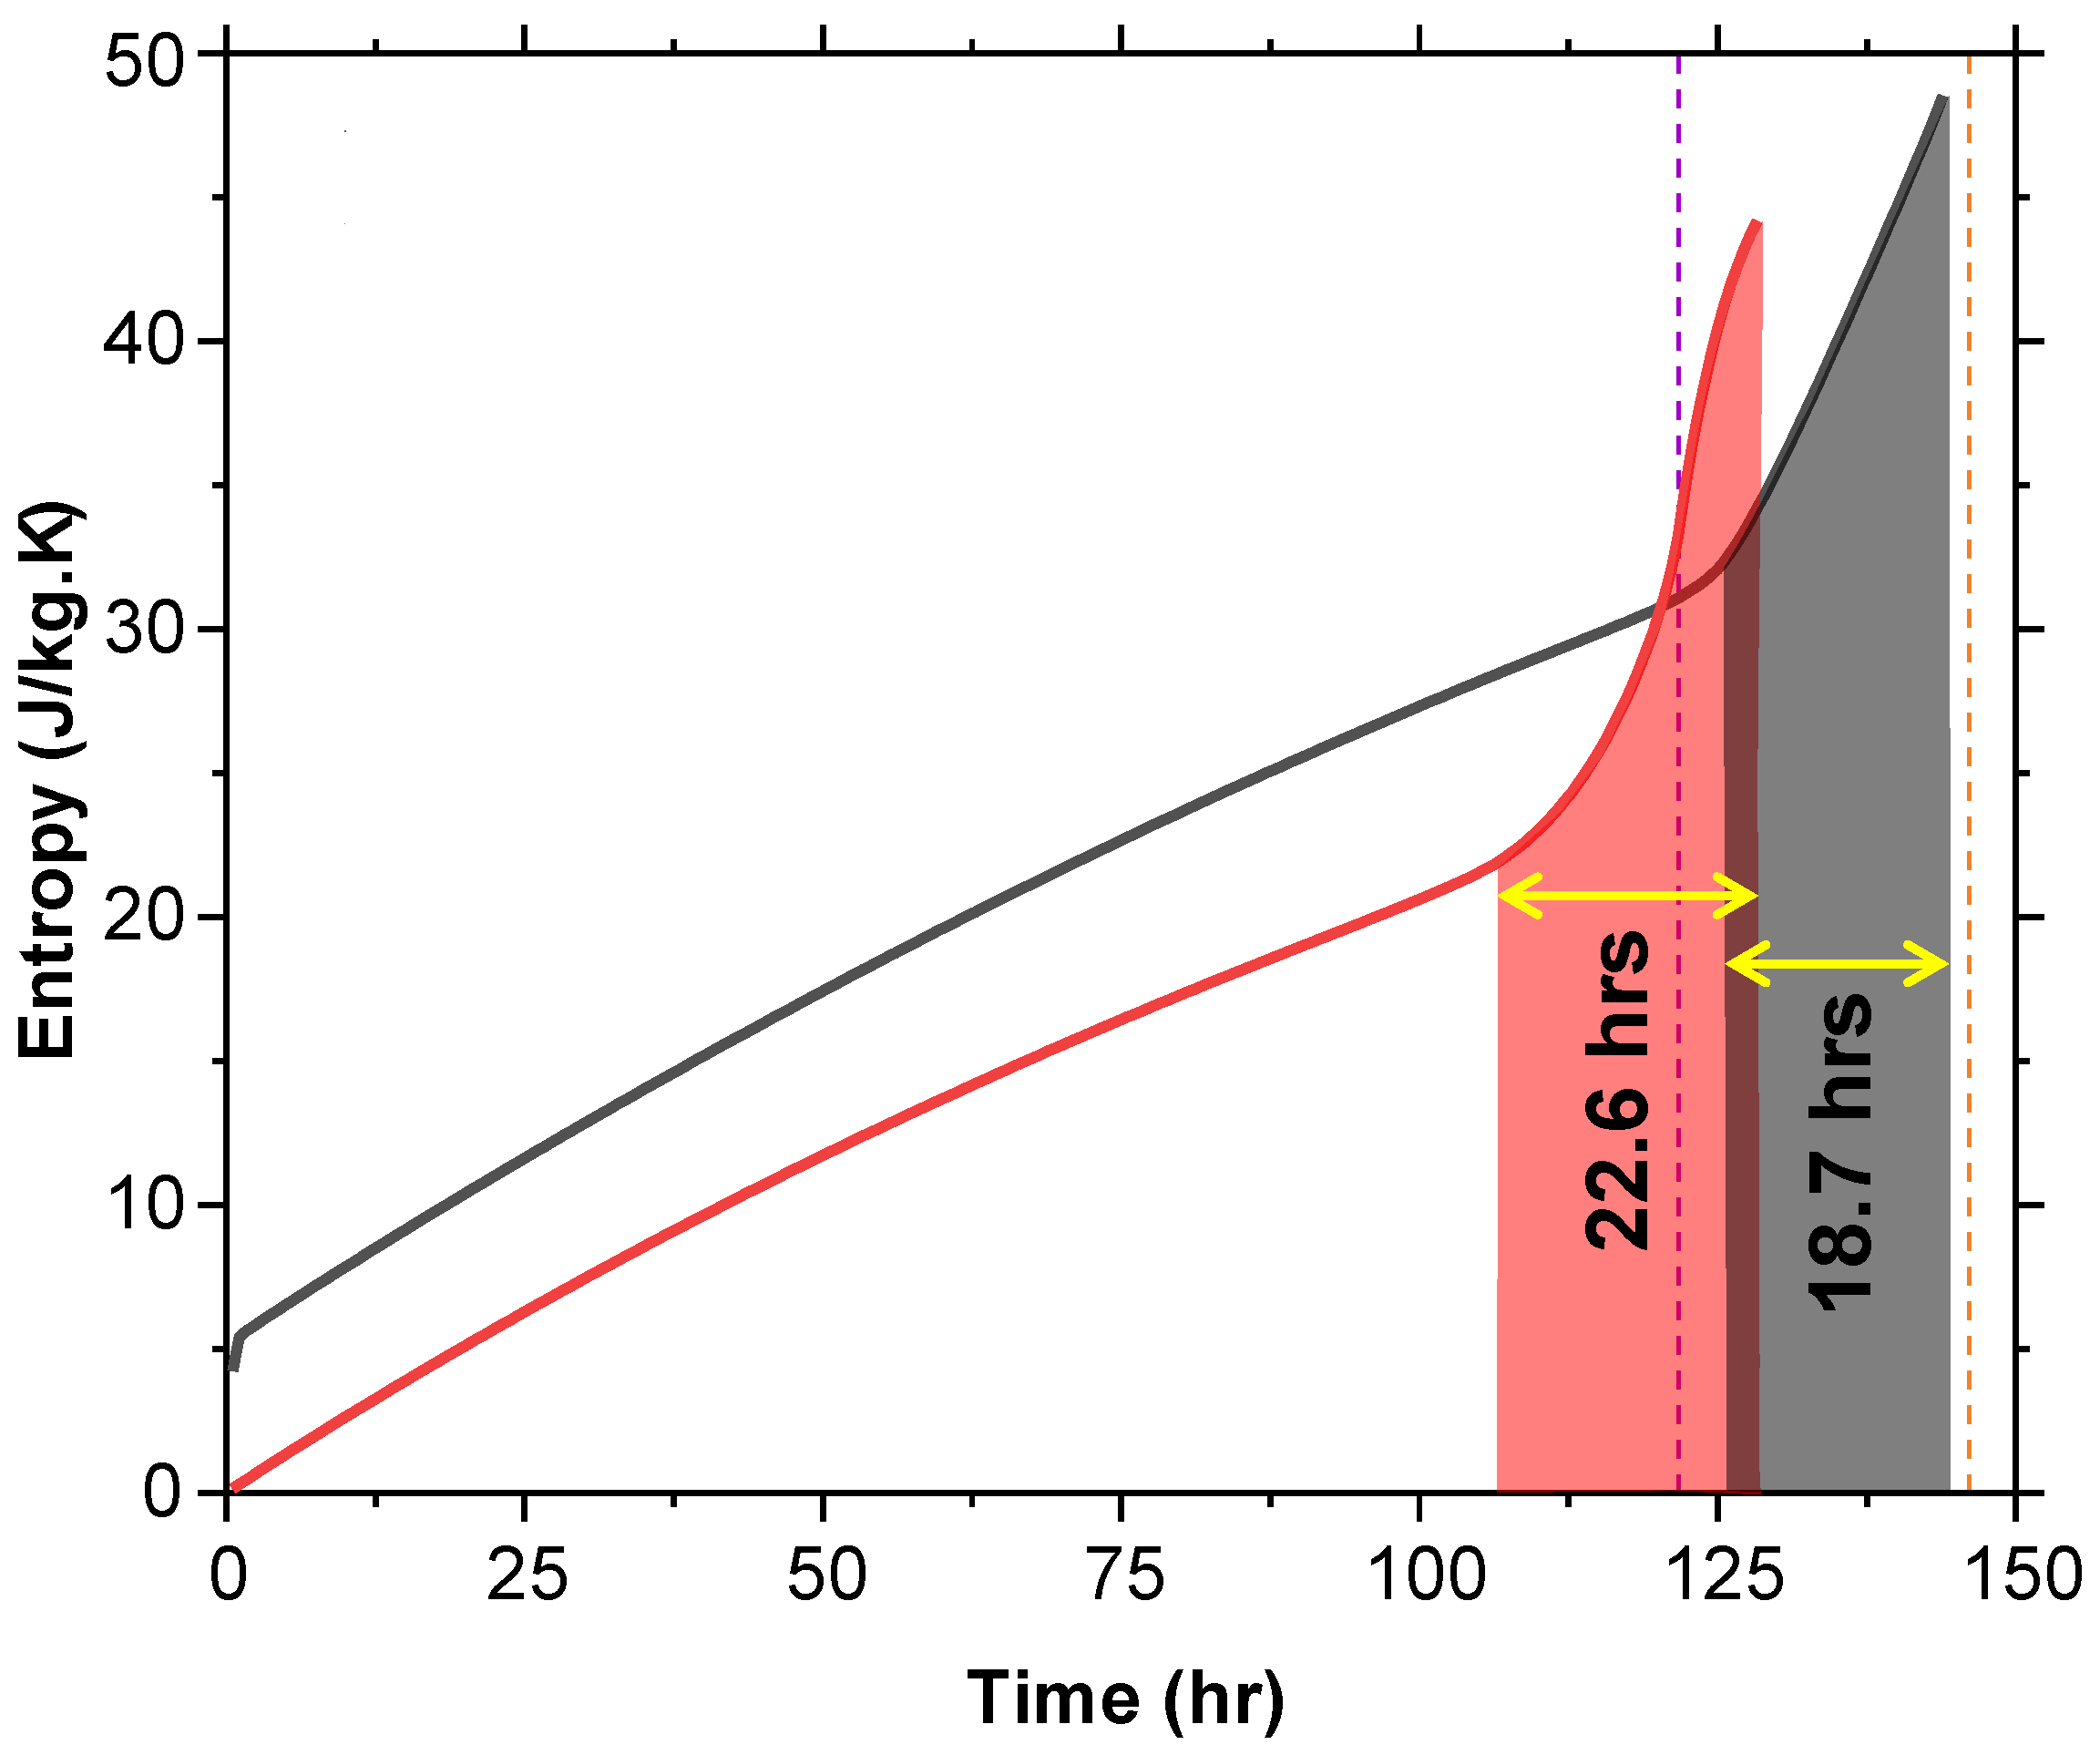
5.3. Entropy Analysis
Entropy, a measure of molecular disorder, was analyzed over time (Figure 13). Initially, T + G has a higher entropy value, starting 4.1 J/kg·K above T at time zero. This initial disorder is due to the 5% glycerol content. As melting progresses, entropy increases steadily, with a steep rise observed as the system approaches 100% MF or when the air temperature nears 8 °C. For T, the steep rise in entropy begins approximately 22.6 h before the air temperature reaches 8 °C, whereas for T + G, this rise occurs around 18.7 h before reaching the same threshold. The nearly 4-h difference suggests that glycerol delays the onset of the rapid entropy increase, effectively extending the duration of thermal stability in T + G.
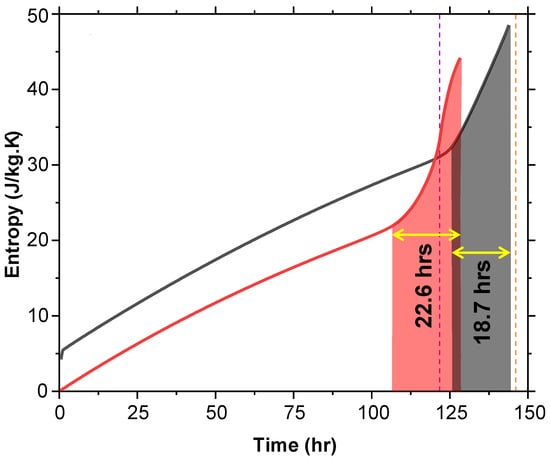
Figure 13.
Entropy versus time for T and T + G at 2 °C shows T + G starting with higher entropy due to glycerol and delaying the rapid rise before reaching 8 °C.
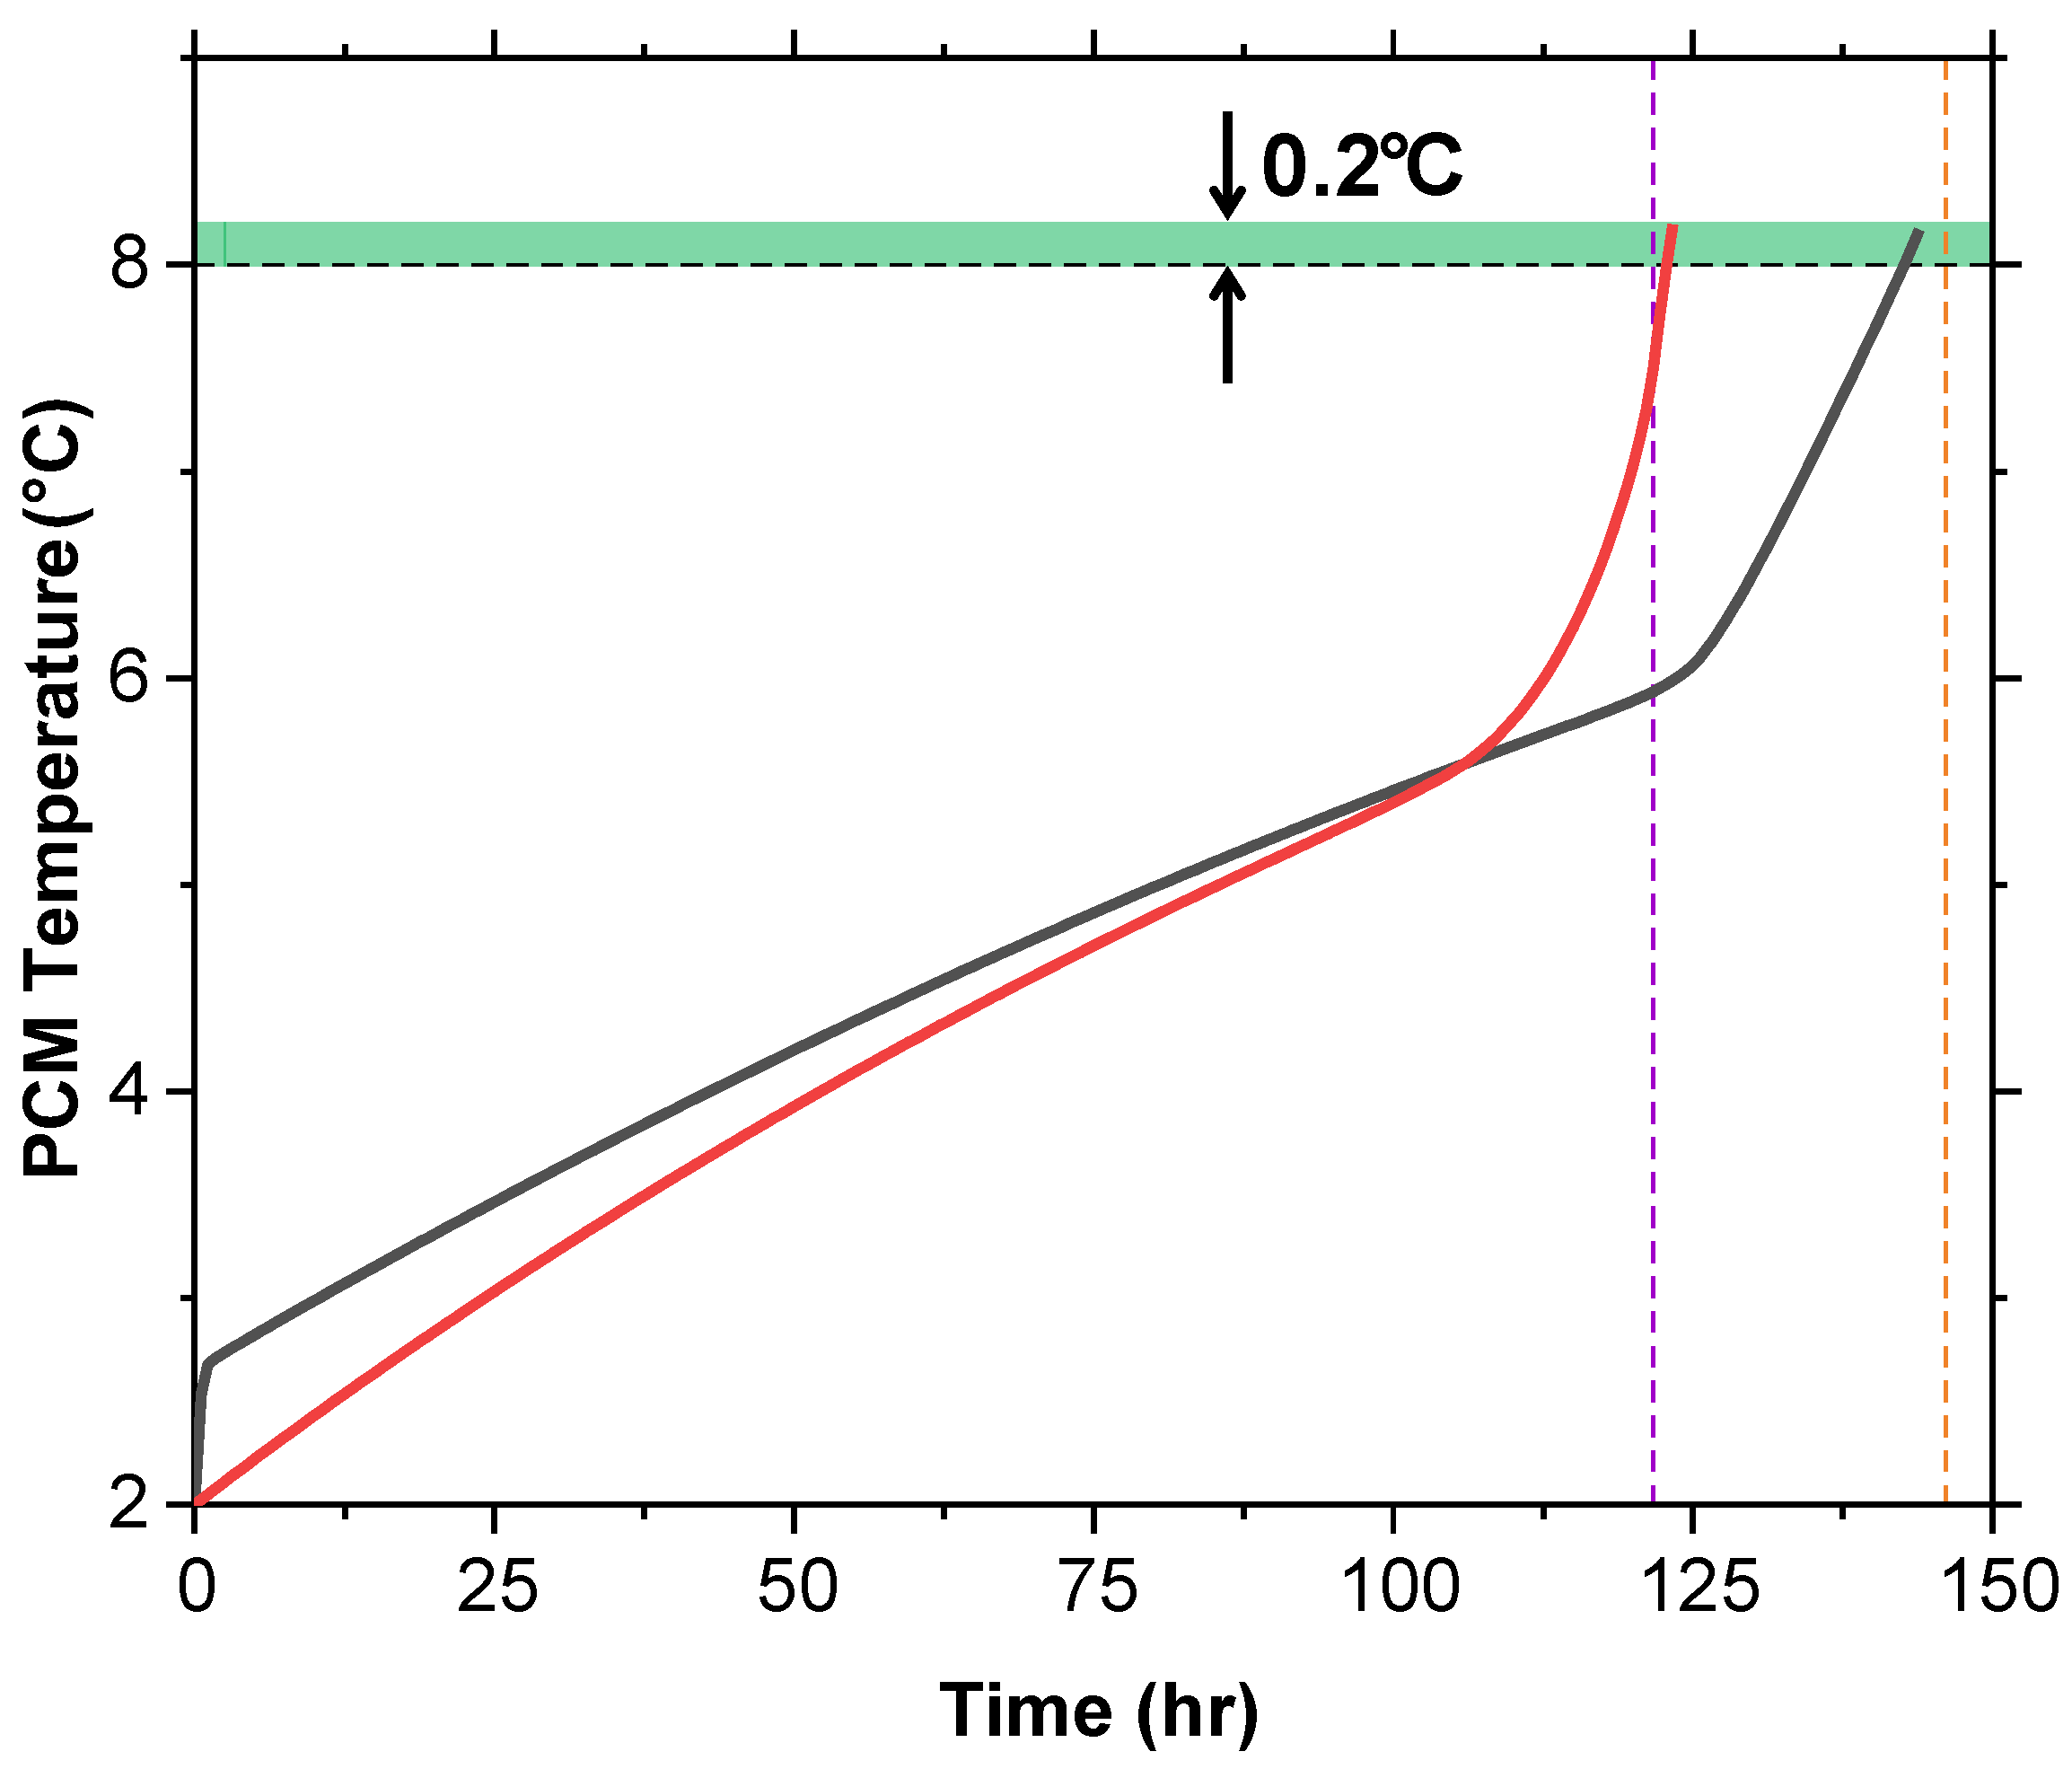
5.4. Temperature Dynamics of the PCM Domain
The average temperature of the PCM domain was plotted against time during the melting process (Figure 14). Both T and T + G slightly exceed 8 °C by around 0.2 °C before the internal air temperature catches up. This is due to the PCM being on the exterior of the cold box, absorbing more heat from the surroundings than the internal air cavity.

Figure 14.
PCM temperature versus time for T and T + G at 2 °C shows both slightly exceeding 8 °C (0.2 °C) before the air temperature aligns, due to faster exterior heat absorption.
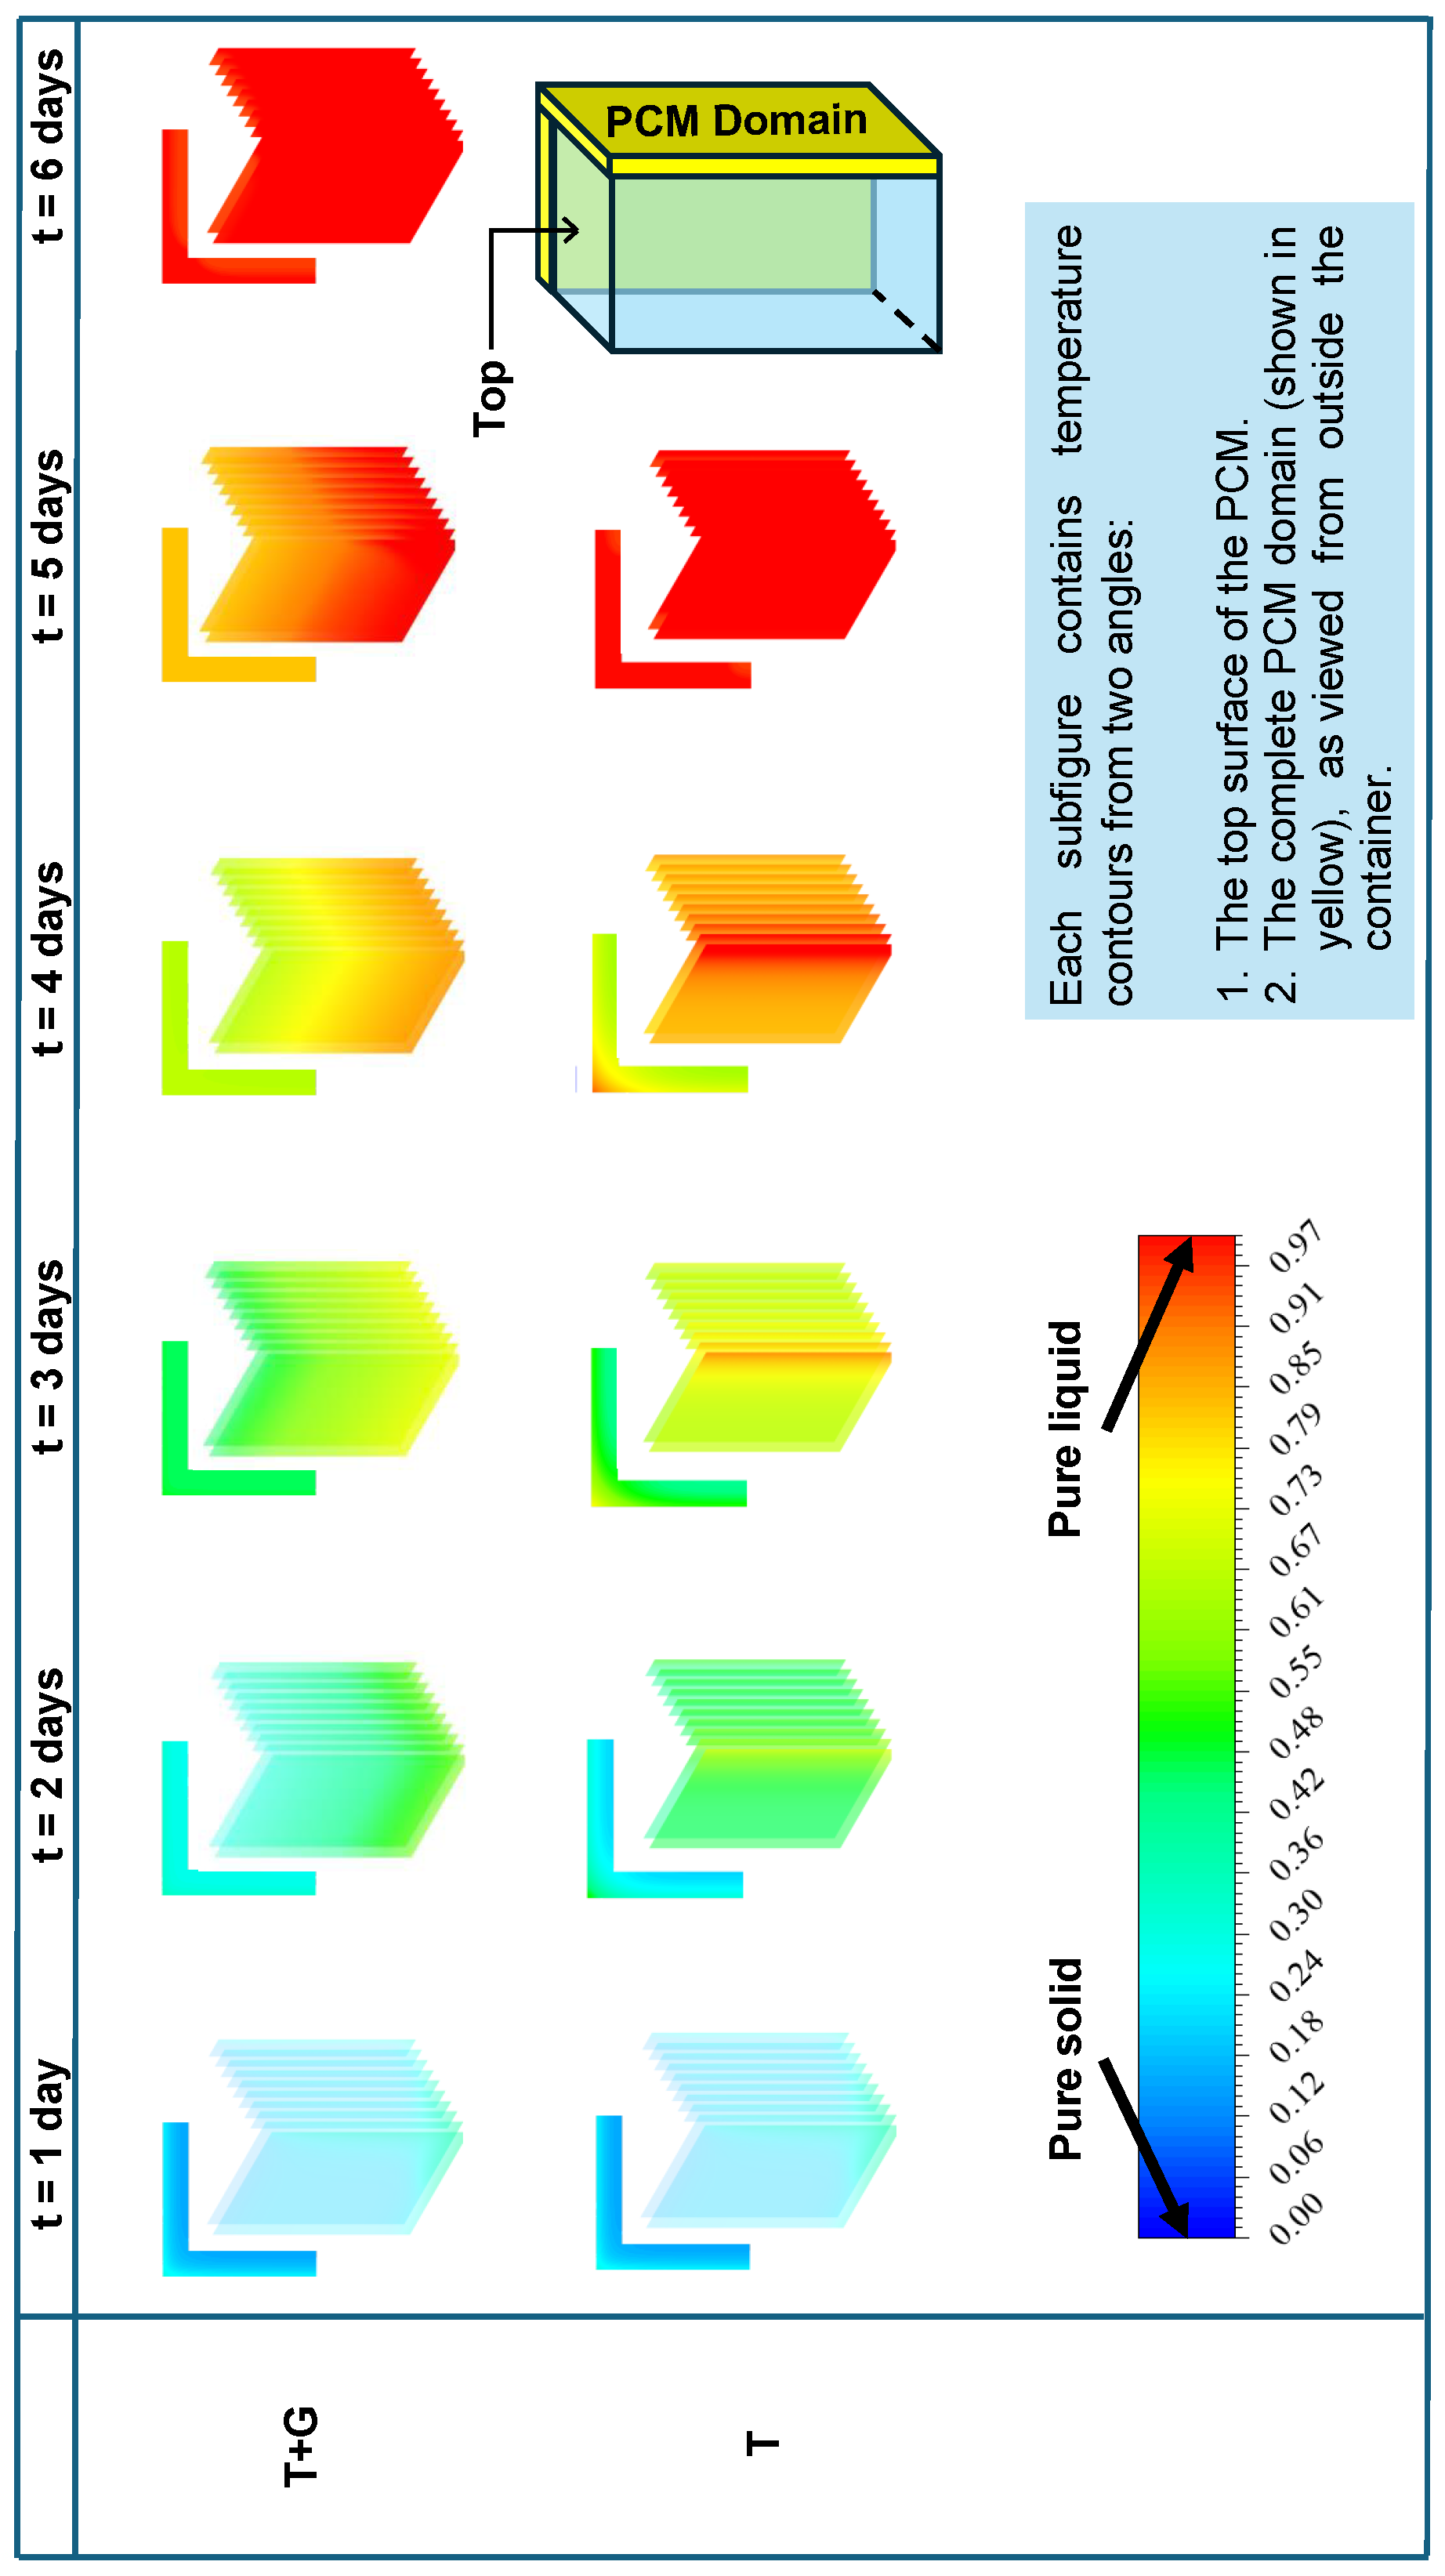
5.5. Temperature Contours of the Cold Box
Figure 15 presents the temperature contours at the end of each day for both the T and T + G cases. To reduce computation time, a quarter geometry was employed for the 3D model. The contours are shown from two perspectives: the top adiabatic surface and the external side of the PCM domain. The results indicate that T reaches complete melting by the end of day 5, whereas T + G continues to sustain cooling until the end of day 6.
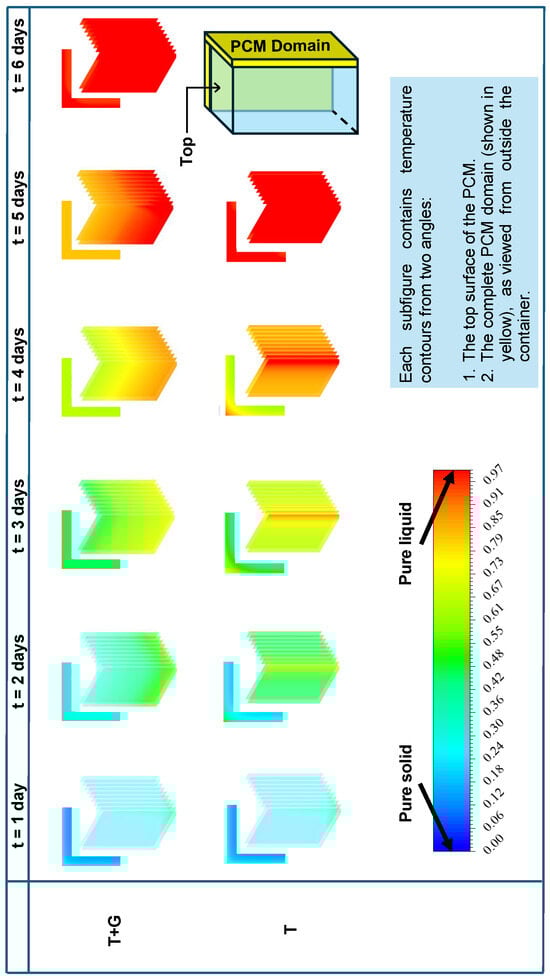
Figure 15.
Temperature contours for T and T + G in the 3D cold box show that T reaches 8 °C faster, while T + G extends temperature stability, benefiting vaccine preservation.
5.6. Potential Limitations of Glycerol as an Additive
While our study primarily focuses on the thermal performance improvements achieved with glycerol as an additive in n-tetradecane, we acknowledge the importance of addressing its broader implications for practical implementation. Below, we discuss key considerations:
(a) Cost–Benefit Analysis: Glycerol is an economically viable and widely available substance, often produced as a byproduct of biodiesel production. However, the long-term economic feasibility, particularly for large-scale applications in cold chain logistics, warrants further exploration.
(b) Feasibility of Large-Scale Production: With global production exceeding 5 million metric tons annually, glycerol is readily available for industrial applications. Nevertheless, challenges such as transportation, storage, and integration into PCM systems on a large scale need additional study.
(c) Long-Term Effects on Thermophysical Properties: Additives like glycerol may influence the thermophysical properties of PCMs over multiple thermal cycles, including latent heat, thermal conductivity, and phase-change behavior. While glycerol’s chemical stability is well established, further investigations using techniques such as differential scanning calorimetry (DSC) and thermal cycling experiments are essential to assess potential phase separation or degradation over extended usage cycles.
Addressing these aspects in future research will enhance the practical applicability of glycerol-enhanced PCMs and facilitate their integration into sustainable vaccine transport systems.
5.7. Long-Term Stability of the PCM–Additive Mixture
The current study focuses on the immediate thermal and melting behavior of the PCM–additive mixture. However, assessing its performance over multiple melting and solidification cycles is critical for practical applicability. To explore this, the following analyses can be considered for future work:
(a) Cyclic Thermal Stability Tests: The PCM (pure and with 5% glycerol additive) can be subjected to repeated thermal cycles simulating real-world conditions. Critical properties such as melting point, solidification point, latent heat, and thermal conductivity can be monitored over 50–100 cycles.
(b) Chemical Stability Assessment: Potential chemical degradation or phase separation could be evaluated using techniques like Fourier transform infrared spectroscopy (FTIR) and differential scanning calorimetry (DSC) to detect changes in chemical composition or latent heat.
(c) Performance Analysis Post Cycling: The melting duration, temperature maintenance, and entropy behavior could be reassessed after multiple cycles to determine if the additive retains its efficacy over time.
(d) Comparison with Baseline PCM: The long-term stability of the PCM with glycerol could be compared to that of the pure PCM to identify any adverse effects introduced by the additive.
These supplementary investigations could provide valuable insights into the additive’s long-term reliability, enhancing the practical relevance of this study. Although beyond the scope of the current work, these aspects could form a key focus of future research.
5.8. Regulatory Compliance of Glycerol-Modified PCM
The glycerol-modified PCM is designed to align with established regulatory guidelines to ensure adherence to health and safety standards:
(a) World Health Organization (WHO) Guidelines: The WHO’s Vaccine Storage and Handling Toolkit emphasizes maintaining recommended temperature ranges to preserve vaccine efficacy. The glycerol-modified PCM is engineered to maintain these temperature ranges during transportation. (https://www.cdc.gov/vaccines/hcp/admin/storage/toolkit/storage-handling-toolkit.pdf (CDC Toolkit) accessed on 25 January 2025).
(b) U.S. Food and Drug Administration (FDA) Recommendations: Glycerol is classified as Generally Recognized as Safe (GRAS) by the FDA, indicating its suitability for applications related to human health. (https://www.fda.gov/food/gras-notice-inventory/recently-published-gras-notices-and-fda-letters (FDA GRAS Notice Inventory) accessed on 25 January 2025).
(c) International Air Transport Association (IATA) Regulations: The PCM complies with the IATA Temperature Control Regulations (TCR), which provide comprehensive requirements for the transportation of temperature-sensitive healthcare products. This ensures the integrity of vaccines during air transport. (https://www.iata.org/en/publications/manuals/temperature-control-regulations/ (IATA TCR) accessed on 25 January 2025).
In adhering to these guidelines, the glycerol-modified PCM complies with current regulatory frameworks and maintains the highest standards of health and safety for vaccine transportation.
6. Conclusions
- In n-tetradecane, 5% glycerol extends the melting time and improves the temperature regulation for vaccine delivery.
- Glycerol increases cooling time by 20.6 h, maintaining the 2–8 °C range.
- Initial tests showed polystyrene foam as the least effective additive, while glycerol slowed melting the most.
- Glycerol’s effect on SP-50 at 0 °C showed minimal improvement.
- In 3D model tests with n-tetradecane at 10 °C, glycerol extended the melt time by 24.4 h, prolonging inner temperature maintenance by 20.6 h.
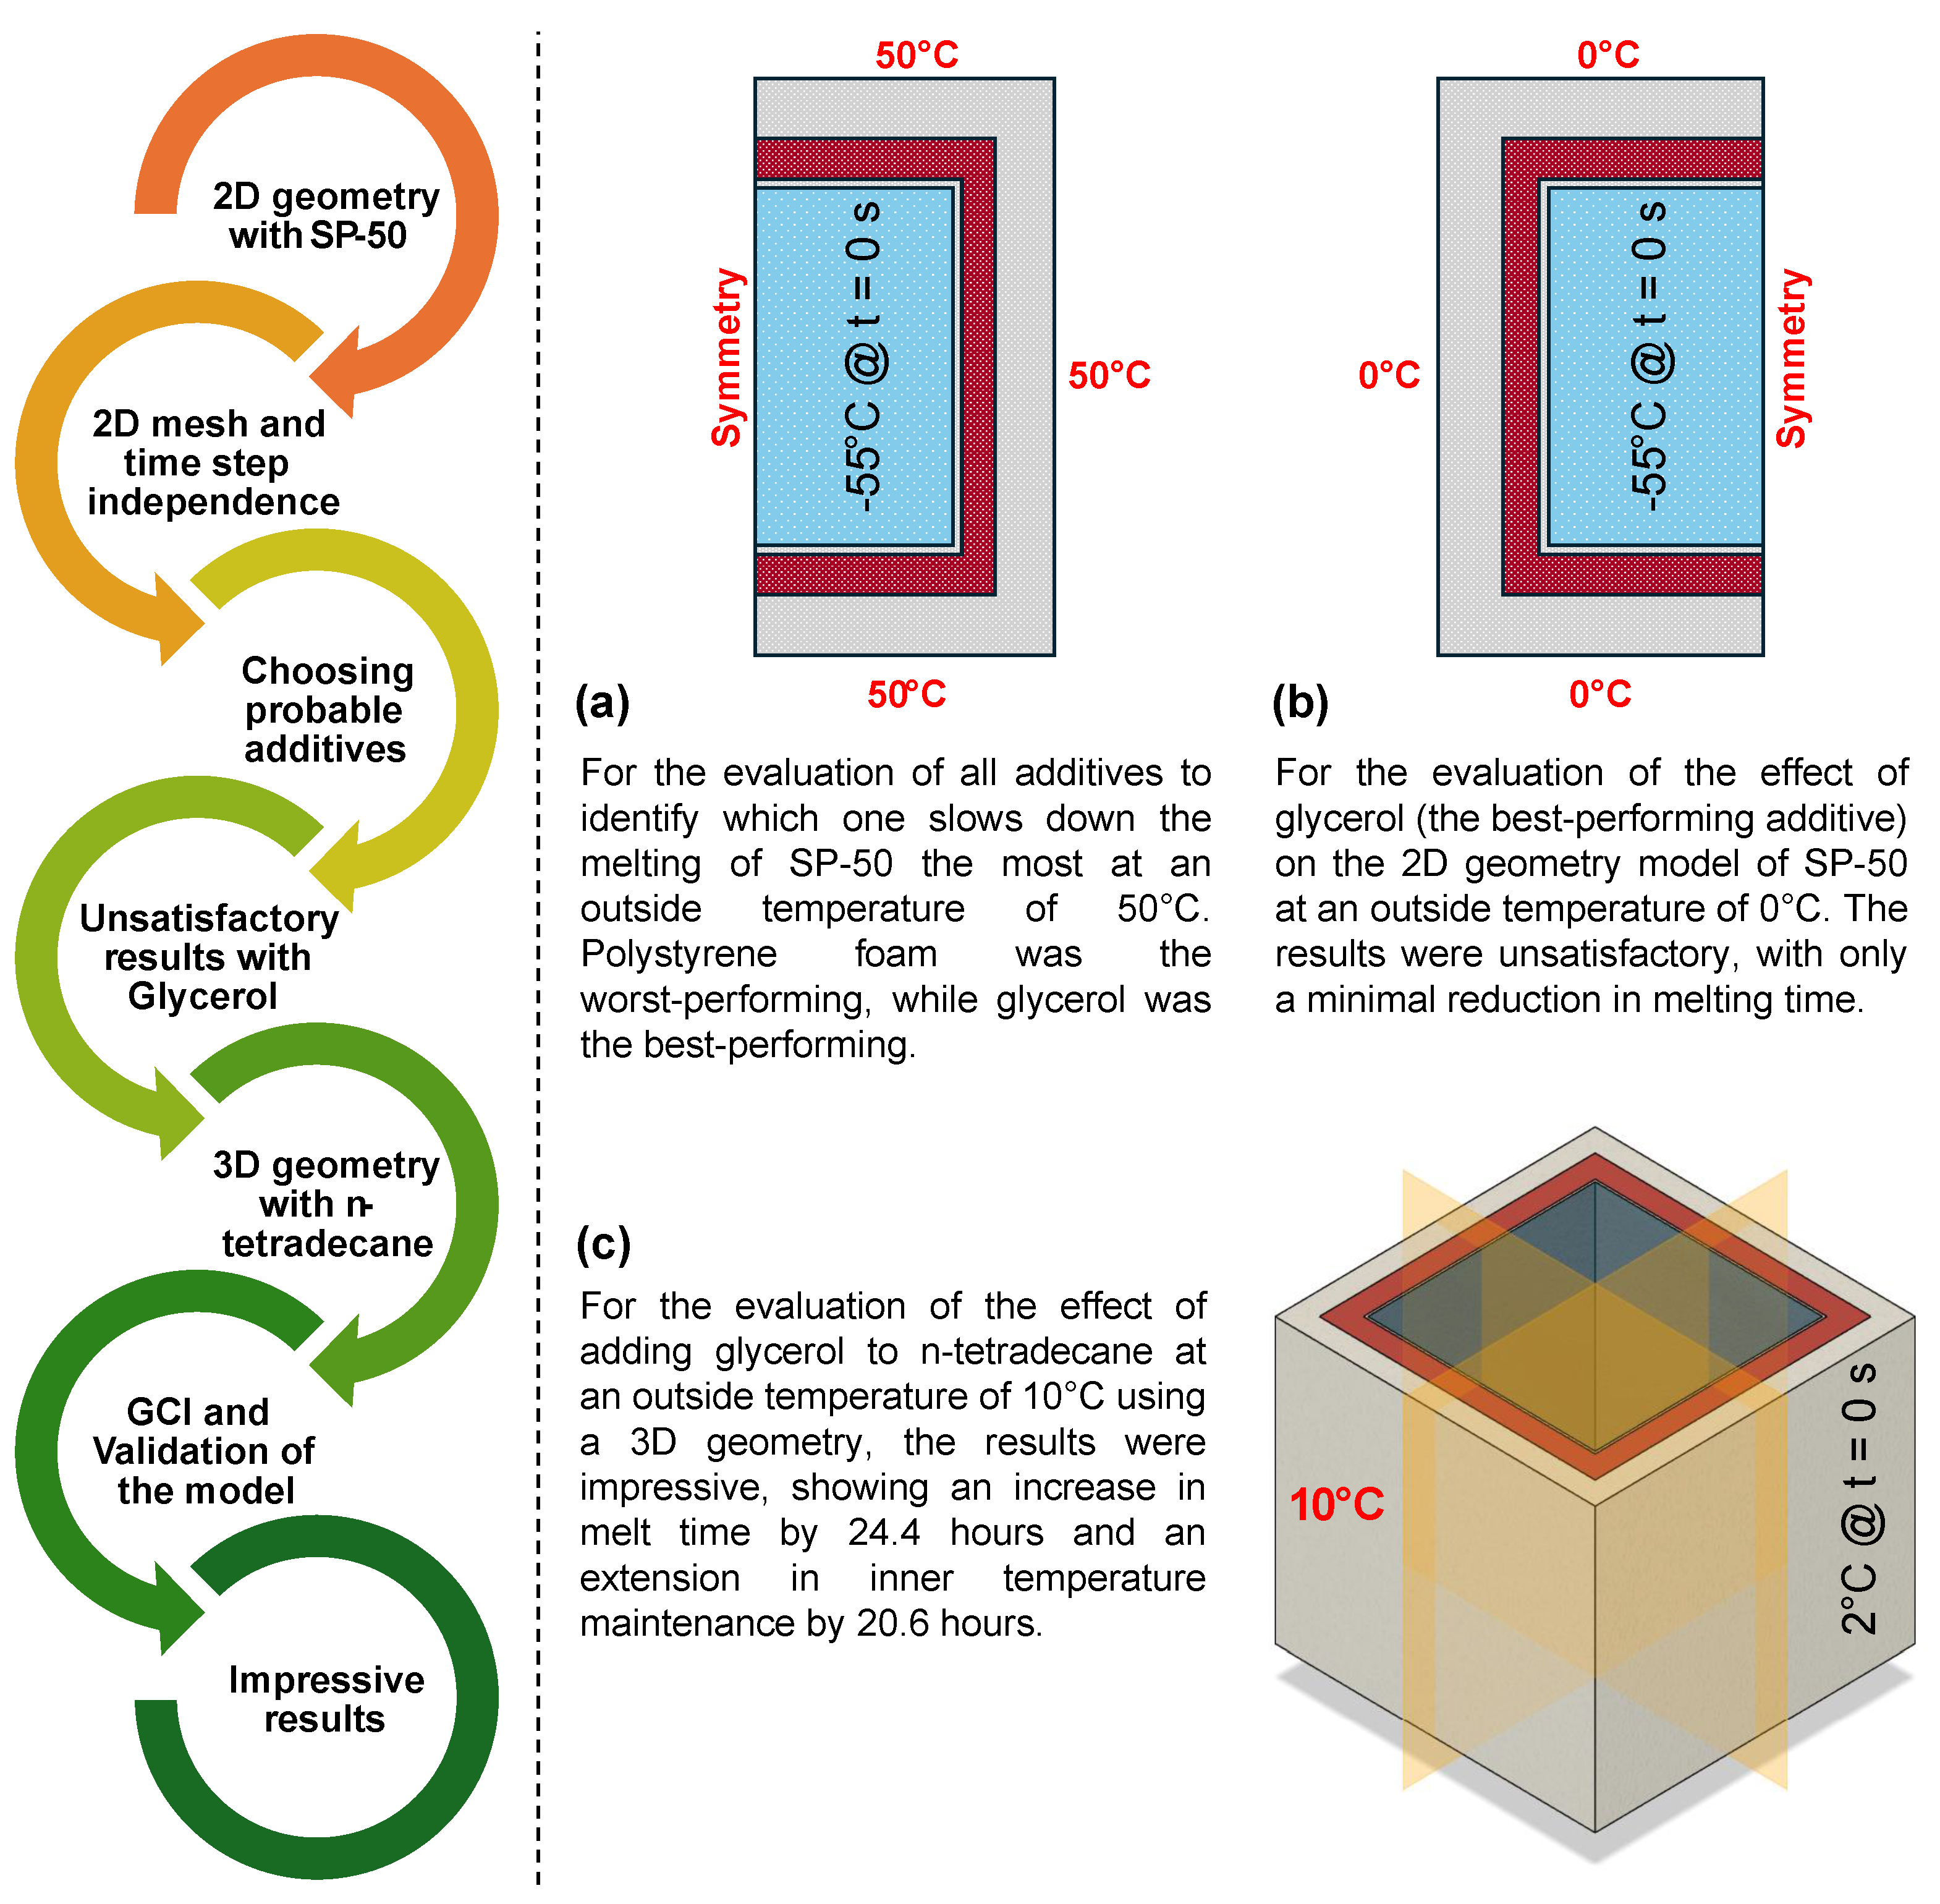
- Figure 16 outlines the step-by-step process of this study.
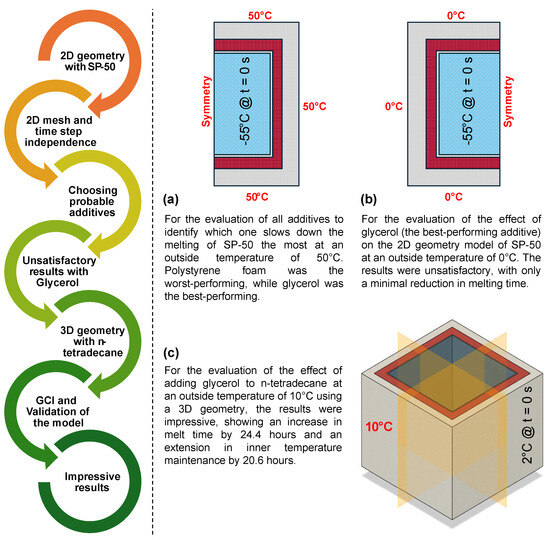 Figure 16. Flowchart of the study approach: (a) Additive performance was tested at 50 °C, with glycerol identified as the best. (b) At 0 °C, glycerol showed minimal effect on melt duration. (c) In 3D geometry with n-tetradecane, glycerol significantly extended melt time and temperature maintenance, validated by GCI analysis and experimental data.
Author Contributions
T.B.: conceptualization, methodology, software, validation, formal analysis, investigation, data curation, and writing—original draft. N.J.: software, formal analysis, investigation, data curation, and writing—original draft. E.Y.K.N.: resources, writing—review and editing, supervision, and project administration. All authors have read and agreed to the published version of the manuscript.
Funding
This research received no external funding.
Data Availability Statement
The original data presented in the study are openly available in Zenodo at https://zenodo.org/records/14001106.
Conflicts of Interest
The authors declare no conflicts of interest.
Abbreviations
The following abbreviations are used in this manuscript.
| Nomenclature | |
| Specific Heat Capacity (J/kg·K) | |
| Approximate Relative Error | |
| Extrapolated Relative Error | |
| Factor of Safety | |
| Fine Grid Convergence Index | |
| Characteristic Cell Size | |
| h | Heat Transfer Coefficient (W/m2·K) |
| Thermal Conductivity of mixture (W/m·K) | |
| Thermal Conductivity of additive (W/m·K) | |
| Thermal Conductivity of PCM (W/m·K) | |
| Melting Heat (J/kg) | |
| Melt Fraction | |
| N | Total Number of Cells |
| P | Pressure (Pa) |
| p | Apparent Order of Convergence |
| r | Refinement Factor |
| R | Universal Gas Constant (J/mol·K) |
| External Temperature (°C) | |
| Melting Point (°C) | |
| t | Time (s) |
| Velocity in the x, y, and z direction, respectively (m/s) | |
| Greek Symbols | |
| Solution of the ith Grid | |
| Value of Extrapolated from Different Grids | |
| Volume of ith Cell | |
| Volume Fraction | |
| Abbreviations | |
| Expanded Polystyrene | |
| Grid Convergence Index | |
| Phase-Change Material | |
| Richardson Extrapolation | |
| T | n-Tetradecane |
| n-Tetradecane + Glycerol | |
| Ratio of Relative Errors | |
References
- World Health Organization (WHO). Vaccines and Immunization; World Health Organization: Geneva, Switzerland, 2021. [Google Scholar]
- Federal Aviation Administration (FAA). Vaccine Transport and Distribution; U.S. Department of Transportation: Washington, DC, USA, 2022.
- Zhou, X.; Xu, X.; Huang, J. Adaptive multi-temperature control for transport and storage containers enabled by phase-change materials. Nat. Commun. 2023, 14, 5449. [Google Scholar] [CrossRef] [PubMed]
- Yan, X.; Kan, A.; Chen, Z.; Hei, Y.; Chen, H.; Wu, W. A promising approach of caved vacuum insulation panel and investigation on its thermal bridge effect. Int. Commun. Heat Mass Transf. 2023, 148, 107086. [Google Scholar] [CrossRef]
- Kan, A.; Yu, L.; Chen, Z.; Li, Y.; Tian, Z. Application of Vacuum Insulation Panel and Semiconductor Freezer in Cold Chain Portable Container. ES Energy Environ. 2023, 19, 814. [Google Scholar] [CrossRef]
- Kan, A.; Zhang, Q.; Chen, Z.; Zhang, J.; Wang, K.; Cao, D. Novel prediction of thermal conductivities for nano-aerogel and its composites as vacuum insulation panel core. Int. J. Therm. Sci. 2023, 189, 108277. [Google Scholar] [CrossRef]
- Mahdi, J.M.; Nsofor, E.C. Melting enhancement in triplex-tube latent heat energy storage system using nanoparticles-metal foam combination. Appl. Energy 2017, 191, 22–34. [Google Scholar] [CrossRef]
- Williams, J.D.; Peterson, G. A review of thermal property enhancements of low-temperature nano-enhanced phase change materials. Nanomaterials 2021, 11, 2578. [Google Scholar] [CrossRef]
- Al-Mudhafar, A.H.; Nowakowski, A.F.; Nicolleau, F.C. Enhancing the thermal performance of PCM in a shell and tube latent heat energy storage system by utilizing innovative fins. Energy Rep. 2021, 7, 120–126. [Google Scholar] [CrossRef]
- Mousavi, S.; Siavashi, M.; Heyhat, M.M. Numerical melting performance analysis of a cylindrical thermal energy storage unit using nano-enhanced PCM and multiple horizontal fins. Numer. Heat Transf. Part A Appl. 2019, 75, 560–577. [Google Scholar] [CrossRef]
- Sciacovelli, A.; Gagliardi, F.; Verda, V. Maximization of performance of a PCM latent heat storage system with innovative fins. Appl. Energy 2015, 137, 707–715. [Google Scholar] [CrossRef]
- Nakhchi, M.; Esfahani, J. Improving the melting performance of PCM thermal energy storage with novel stepped fins. J. Energy Storage 2020, 30, 101424. [Google Scholar] [CrossRef]
- Said, Z.; Pandey, A.K. Nano Enhanced Phase Change Materials: Preparation, Properties and Applications; Springer Nature: Berlin, Germany, 2023. [Google Scholar]
- Amidu, M.A.; Ali, M.; Alkaabi, A.K.; Addad, Y. A critical assessment of nanoparticles enhanced phase change materials (NePCMs) for latent heat energy storage applications. Sci. Rep. 2023, 13, 7829. [Google Scholar] [CrossRef]
- Huang, M.; Eames, P.; Norton, B. Thermal regulation of building-integrated photovoltaics using phase change materials. Int. J. Heat Mass Transf. 2004, 47, 2715–2733. [Google Scholar] [CrossRef]
- Al Omari, S.; Ghazal, A.; Elnajjar, E.; Qureshi, Z. Vibration-enhanced direct contact heat exchange using gallium as a solid phase change material. Int. Commun. Heat Mass Transf. 2021, 120, 104990. [Google Scholar] [CrossRef]
- Zhou, G.; Zhu, M.; Xiang, Y. Effect of percussion vibration on solidification of supercooled salt hydrate PCM in thermal storage unit. Renew. Energy 2018, 126, 537–544. [Google Scholar] [CrossRef]
- Sheikholeslami, M.; Mahian, O. Enhancement of PCM solidification using inorganic nanoparticles and an external magnetic field with application in energy storage systems. J. Clean. Prod. 2019, 215, 963–977. [Google Scholar] [CrossRef]
- Fan, Y.; Yu, M.; Zhang, C.; Jiang, L.; Zhang, X.; Zhao, Y. Melting performance enhancement of phase change material with magnetic particles under rotating magnetic field. J. Energy Storage 2021, 38, 102540. [Google Scholar] [CrossRef]
- Izadi, M.; Hajjar, A.; Alshehri, H.M.; Sheremet, M.; Galal, A.M. Charging process of a partially heated trapezoidal thermal energy storage filled by nano-enhanced PCM using controlable uniform magnetic field. Int. Commun. Heat Mass Transf. 2022, 138, 106349. [Google Scholar] [CrossRef]
- National Center for Biotechnology Information (NCBI). Global Vaccine Distribution and Cold Chain Logistics; National Institutes of Health: Bethesda, MD, USA, 2021.
- Thermtest Inc. Thermal Conductivity Materials Database. Available online: https://www.thermtest.com/thermal-conductivity-database (accessed on 25 January 2025).
- Ray, A.K.; Singh, S.; Rakshit, D. Comparative study of cooling performance for portable cold storage box using phase change medium. Therm. Sci. Eng. Prog. 2022, 27, 101146. [Google Scholar] [CrossRef]
- Abu-Hamdeh, N.H.; Akbal, Ö.; Öztop, H.F.; Abusorrah, A.M.; Bayoumi, M.M. A three-dimensional computational analysis of ellipsoidal radiator with phase change. Int. J. Numer. Methods Heat Fluid Flow 2021, 31, 2072–2087. [Google Scholar] [CrossRef]
- Stovall, T.K.; Arimilli, R. Transient Thermal Analysis of Three Fast-Charging Latent Heat Storage Configurations for a Space-Based Power System; Technical Report ORNL/TM-10782; Oak Ridge National Laboratory: Oak Ridge, TN, USA; Department of Mechanical Engineering, University of Tennessee: Knoxville, TN, USA, 1988.
- Yinping, Z.; Yuehong, S.; Xinshi, G. Prediction of the melting temperature and the fusion heat of (quasi-) eutectic PCM. J. China Univ. Sci. Technol. 1995, 25, 474–478. [Google Scholar]
- Chang, Y.; Sun, Z. Synthesis and thermal properties of n-tetradecane phase change microcapsules for cold storage. J. Energy Storage 2022, 52, 104959. [Google Scholar] [CrossRef]
- Fang, G.; Li, H.; Yang, F.; Liu, X.; Wu, S. Preparation and characterization of nano-encapsulated n-tetradecane as phase change material for thermal energy storage. Chem. Eng. J. 2009, 153, 217–221. [Google Scholar] [CrossRef]
- Wu, S.; Fang, G.; Chen, Z. Discharging characteristics modeling of cool thermal energy storage system with coil pipes using n-tetradecane as phase change material. Appl. Therm. Eng. 2012, 37, 336–343. [Google Scholar] [CrossRef]
- Cleaning Institute. Cleaning Institute Resources. Available online: https://www.cleaninginstitute.org/ (accessed on 25 January 2025).
- ChemicalBook. Chemical Properties and Safety Information. Available online: https://www.chemicalbook.com (accessed on 25 January 2025).
- Bhatt, T.; Baser, M.; Tyagi, A.; Ng, E.Y.K. CRYOMOVE: Cold chain real-time management of vaccine delivery using PCM and deep learning. Appl. Therm. Eng. 2024, 255, 123962. [Google Scholar] [CrossRef]
- Baker, N.; Kelly, G.; O’Sullivan, P.D. A grid convergence index study of mesh style effect on the accuracy of the numerical results for an indoor airflow profile. Int. J. Vent. 2020, 19, 300–314. [Google Scholar] [CrossRef]
- Richardson, L.F., IX. The approximate arithmetical solution by finite differences of physical problems involving differential equations, with an application to the stresses in a masonry dam. Philos. Trans. R. Soc. London. Ser. A Contain. Pap. A Math. Phys. Character 1911, 210, 307–357. [Google Scholar]
- Richardson, L.F.; Gaunt, J.A., VIII. The deferred approach to the limit. Philos. Trans. R. Soc. London. Ser. A Contain. Pap. A Math. Phys. Character 1927, 226, 299–361. [Google Scholar]
- Slater, J.W. Examining spatial (grid) convergence. In NPARC Alliance CFD Verification and Validation 470 Web Site; NASA Glenn Research Center: Cleveland, OH, USA, 2017. [Google Scholar]
- Celik, I.B.; Ghia, U.; Roache, P.J.; Freitas, C.J. Procedure for estimation and reporting of uncertainty due to discretization in CFD applications. J. Fluids Eng.-Trans. ASME 2008, 130, 078001. [Google Scholar] [CrossRef]
- Tan, F.; Hosseinizadeh, S.; Khodadadi, J.; Fan, L. Experimental and computational study of constrained melting of phase change materials (PCM) inside a spherical capsule. Int. J. Heat Mass Transf. 2009, 52, 3464–3472. [Google Scholar] [CrossRef]
- Sheikholeslami, M.; Jafaryar, M.; Shafee, A.; Babazadeh, H. Acceleration of discharge process of clean energy storage unit with insertion of porous foam considering nanoparticle enhanced paraffin. J. Clean. Prod. 2020, 261, 121206. [Google Scholar] [CrossRef]


Disclaimer/Publisher’s Note: The statements, opinions and data contained in all publications are solely those of the individual author(s) and contributor(s) and not of MDPI and/or the editor(s). MDPI and/or the editor(s) disclaim responsibility for any injury to people or property resulting from any ideas, methods, instructions or products referred to in the content. |
© 2025 by the authors. Licensee MDPI, Basel, Switzerland. This article is an open access article distributed under the terms and conditions of the Creative Commons Attribution (CC BY) license (https://creativecommons.org/licenses/by/4.0/).