Article

Transonic Aerodynamic Performance Analysis of a CRM Joined-Wing Configuration †

School of Engineering, University of the West of England, Bristol BS16 1QY, UK
*
Author to whom correspondence should be addressed.
This paper is an extended version of our paper published in Hanman, P.; Yao, Y.; Bouferrouk, A. Aerodynamics of a CRM Joined-Wing Configuration at Transonic Speeds. In Proceedings of the 57th 3AF International Conference on Applied Aerodynamics, Bordeaux, France, 29–31 March 2023.
Fluids 2025, 10(2), 27; https://doi.org/10.3390/fluids10020027
Submission received: 6 November 2024 / Revised: 10 January 2025 / Accepted: 23 January 2025 / Published: 25 January 2025
(This article belongs to the Special Issue Drag Reduction in Turbulent Flows, 2nd Edition)

Abstract

:
This study examines the aerodynamic performance of a joined-wing (JW) aircraft design based on the NASA Common Research Model (CRM), aiming to assess its potential for efficient commercial transport or cargo aircraft at transonic speed (Mach 0.85). The CRM wing, optimised for transonic flight, was transformed into a JW design featuring a high-aspect-ratio main wing. An initial parametric study using the vortex lattice minimum drag panel method identified viable designs. The selected JW configuration, comprising front and rear wings joined by a vertical fin, was analysed using ANSYS Fluent to understand flow interactions and aerodynamic performance. At an angle of attack (AoA) of −1°, the JW design achieved a peak lift-to-drag ratio (L/D) of 17.45, close to the CRM’s peak L/D of 19.64 at 2°, demonstrating competitive efficiency. The JW’s L/D exceeded the CRM’s between AoA −3° and 0.8°, but the CRM performed better above 0.8°, with differences decreasing at a higher AoA. Based on induced drag alone, the JW outperformed the CRM across AoA −3° to 8°, but flow complications restricted its L/D advantage to a small, low AoA range. A strong shock on the vertical fin’s inboard side due to high incoming flow speed delayed shock formation on the main wing near the joint. Optimising the vertical fin shape slightly improved L/D, suggesting potential for further enhancements or that other design factors significantly affect JW performance. This study provides insights into JW aerodynamics at transonic speeds, revealing its potential benefits and challenges compared to the CRM design.

1. Introduction

With the increasing demand to reduce fuel consumption and emissions, aircraft manufacturers are progressively challenging the conventional cantilever wing design. Key questions that have arisen include whether the aerodynamic and engine efficiency limits of current designs have been reached, whether further research on these configurations will yield diminishing returns, and whether unconventional configurations might offer superior returns on research and investment.
Among the leading unconventional aircraft design concepts under consideration by major manufacturers are Boeing’s Transonic Truss-Braced Wing (TTWB) and Airbus’s Blended-Wing Body (BWB) concepts [1,2,3,4,5]. These designs are primarily driven by the need to reduce CO2 emissions through optimised aerodynamic shaping and structural efficiency. A shared feature of both concepts is the employment of high-aspect-ratio wings to minimise induced drag during the cruise phase of flight.
However, the TTWB and BWB concepts are not the only configurations aimed at reducing induced drag during the cruise. Additional concepts, such as the box wing (BW) (also known as a PrandtlPlane [6]) and joined-wing (JW) configurations also focus on increasing the overall wing aspect ratio by utilising two high-aspect-ratio wings to replace the conventional main wing and horizontal tail configuration [7,8,9]. A comparison of these planforms (Figure 1) reveals that the primary difference between the two concepts lies in the location where the aft wing meets the main front wing. In the BW configuration, the aft wing joins the main wing at its tip, forming a “box” shape when viewed from the front, whereas in the joined-wing configuration, the aft wing joins further inboard along the wingspan with a pronounced anhedral, allowing it to connect to the upper surface of the main wing.
Previous aerodynamic analyses of joined and box wings have primarily involved low-fidelity CFD simulations conducted at lower Mach numbers, such as those described in [6,11,12,13,14,15,16,17,18]. These studies, while useful, are limited by the low-fidelity methods’ ability to accurately resolve flow physics, with exception to [14] which utilises a Detached Eddy Simulation (DES) model. Additionally, most of these simulations were aimed at developing JW UAV concepts rather than full-scale commercial aircraft. For instance, the study just mentioned, [14], explored a High Altitude, Long-Endurance (HALE) drone concept with a blended joining section, employing numerical simulations at Mach 0.4–0.6 using the COBALT flow solver in conjunction with a mixture of Reynolds-Averaged Navier–Stokes (RANS) and DES models. The study identified significant viscous effects around the joint at higher angles of attack when compared to inviscid flow analysis, as seen in pressure coefficient comparisons, resulting in a notable reduction in sectional lift. Additionally, a weak oblique shock wave was observed at a 12-degree angle of attack and Mach 0.6 on the trailing edge of the aft wing, near the joint region. While the joint design in [14] differs from the one presented in the current work, similar observations will be conducted to determine whether the joint introduces significant flow effects for a commercial aircraft JW design. It should also be noted that the study in [14] focused primarily on establishing a foundation for further aerodynamic and structural analyses of the concept by computing aerodynamic loads on the structure and presenting local pressure coefficient plots rather than overall lift, drag, or aerodynamic efficiency results.
In the context of transport aircraft, current research has primarily focused on the conceptual design of a JW commercial aircraft rather than detailed CFD simulations. For example, Vortex Lattice Methods (VLMs) such as Athena Vortex Lattice (AVL) and the MATLAB-based Tornado have been employed at low Mach numbers to assist in the conceptual design of a medium-range commercial aircraft [19].
While CFD analysis of the BW concept has enjoyed a fair amount of attention through several CFD studies conducted at high Mach numbers (0.7–0.85) for commercial-style aircraft [12,20,21], the numerical analysis of the JW concept remains an open area for further research. Despite the differences between the JW and BW concepts, their high-aspect-ratio multiplane nature and joining sections allow for some analogies. Notably, in the BW configuration, an increase in surface Mach number, followed by a sharp decrease, has been observed at the vertical juncture where the horizontal main wing transitions to a vertical fin, suggesting the presence of a shock wave due to the joining section at M = 0.78 [12,22]. This is also highlighted by the authors by an increase in drag on the configuration, greater than that of the baseline A320 wing. Given that the joining section of the JW concept is located further inboard (compared to the BW), the possibility of a shock wave at this location should be considered and analysed if observed. However, little is known about the efficiency of these configurations when compared to a reference design such as the NASA Common Research Model (CRM).
Additional research performed on the JW concept includes the study by Smith and Stonum [13] on aerodynamic stability analysis using a 1:6 scale model of three joined-wing research aircraft in the NASA Ames wind tunnel at Mach 0.35, with a Reynolds number of 1 × 10 6 . While the conclusions focus on the lateral and longitudinal directional stability of the models, basic aerodynamic performance can also be assessed through viewing the multitude of figures presented in the final report. From the longitudinal stability analysis (CL and CD plots), JW-1 produces a maximum L/D ratio of approximately 21 between 0 and 2° AoA. Smith and Stonum [13] also note that the cruise lift coefficient of 0.45 was achieved at −3° AoA, which would produce an L/D of approximately 15. This is also a case study at subsonic cruise conditions, indicating that compressible effects are either not present, or are negligible.
Moreover, there is limited comparison of the JW to a reference aircraft using high-fidelity CFD analysis, and even more limited is the analysis of the flow field surrounding the vertical juncture. As a result, a knowledge gap exists regarding the aerodynamic properties of the JW design at transonic conditions typical of modern commercial aircraft, where shock waves could emerge and interact with adjacent wings. High-fidelity CFD methods are needed to explore these phenomena.
The purpose of this study is two-fold: first, to establish a design framework for a tailless JW concept based on CRM with the aim to produce a design with overall better performance efficiency, and second, to investigate the aerodynamic performance, flow, and shock wave characteristics of the JW design at transonic speeds using CFD simulations. Specifically, the study will focus on examining the flow features around the main and rear wings, as well as around the joint location. The investigation will be conducted using high-fidelity CFD methods and will compare the flow and shock structures of the JW design with those of the CRM [23], which serves as a benchmark for a highly efficient transonic aircraft. The investigations will be conducted at a Reynolds number of 5 million and a Mach number of 0.85, in alignment with the baseline NASA CRM’s wind tunnel tests [24]. This study will demonstrate how the JW design is developed based on the CRM configuration and will evaluate whether its higher aspect ratio offers any drag reduction benefits, both for total and induced drag. The aerodynamic performance of the main and rear wings of the JW design will be assessed both independently and jointly to determine individual wing performance as well as the combined performance. Furthermore, the JW design will be compared with the baseline CRM configuration. A simple optimisation of the vertical joint will also be performed to explore its impact on overall performance.

2. Materials and Methods

For this study, the CFD solver ANSYS Fluent (Version 2022 R1) was used to calculate the aerodynamic performance and assess the shock characteristics of each of the geometries at transonic conditions. The primary investigative geometries were designed using a simple adaption of the CRM planform, followed by an initial parametric study focused on the minimum vortex drag coefficient CDv. For the purposes of the discussion, the vortex drag coefficient CDv is the same as the induced drag coefficient CDi [25].

2.1. JW Design Methodology

The initial JW design methodology involved a simple adaptation of the CRM wing planform to fit into a JW shape. For the sake of aerodynamic similarity in this initial phase, the total planform area of the CRM (wing + tail) of 464.515 m2 was kept as a constant value to be transferred over to the JW design, which consists of a front main wing and a rear wing joined together by a vertical junction, with the rear wing replacing the need for a horizontal tail. The CRM’s design CL of 0.5 at Mach 0.85 was also retained for the JW concept. A parametric study developed multiple JW planforms over the variable ranges (see Table 1), with the purpose of identifying a JW planform that produces the lowest value of CDv for a given design CL of 0.5 at Mach 0.85.
The vortex lattice minimum drag (VLMD) panel code [25], used for the initial JW design, takes a wing planform (here, that of CRM) and a design CL as inputs and returns it as output (in this case, they are the twist and camber distributions) needed to meet the predefined design CL, along with a predicted drag coefficient CDv value equivalent to a lift-induced drag coefficient. Through multiple iterations of the parametric study, certain geometric features were kept as a constant between the CRM and the JW designs (e.g., dihedral angle, taper ratio, and quarter-chord sweep angle).

2.2. JW Geometries

Three main geometries are used in the present study; the conventional CRM wing–body configuration, the CRM wing and tail configuration without the fuselage (baseline), and the JW design (the JW63a); see Table 2 for full details of each configuration. The CRM wing–body configuration was used purely for validation purposes due to the vast array of experimental data available [24,26]. A general overview of the CRM wing–tail configuration (baseline) and the CRM-derived JW planform is seen in Figure 2.
The front and rear wings of the JW geometries were generated by mapping the VLMD design outcomes (both twist and camber) onto the CRM thickness distributions for an initial design, as previously outlined [27].
The cross-section of the vertical joint fin between the two wings, as shown in Figure 2c, is made from a symmetric aerofoil (NACA 0008) stack, lofted onto the tip of the rear wing to create the joint. One key purpose of this study is to investigate the aerodynamic effects of the joint fin on the main and rear wings and the shock characteristics associated with it. The vertical fin is 1 m in height and begins at 0.11 x/c (here, x and c are the local chordwise coordinate and chord length, respectively) from the leading-edge of the main wing section and finished at the trailing edge. The fin is also in alignment with the incoming flow direction. The JW’s rear wing uses the same thickness to chord distributions as the CRM tail wing, which is noted to be a symmetrical aerofoil with a root thickness to chord of 10% to a tip thickness to chord of 8%, resulting in the choice of the NACA 0008 aerofoil for the vertical fin.

2.3. Computational Domain and Mesh Generation

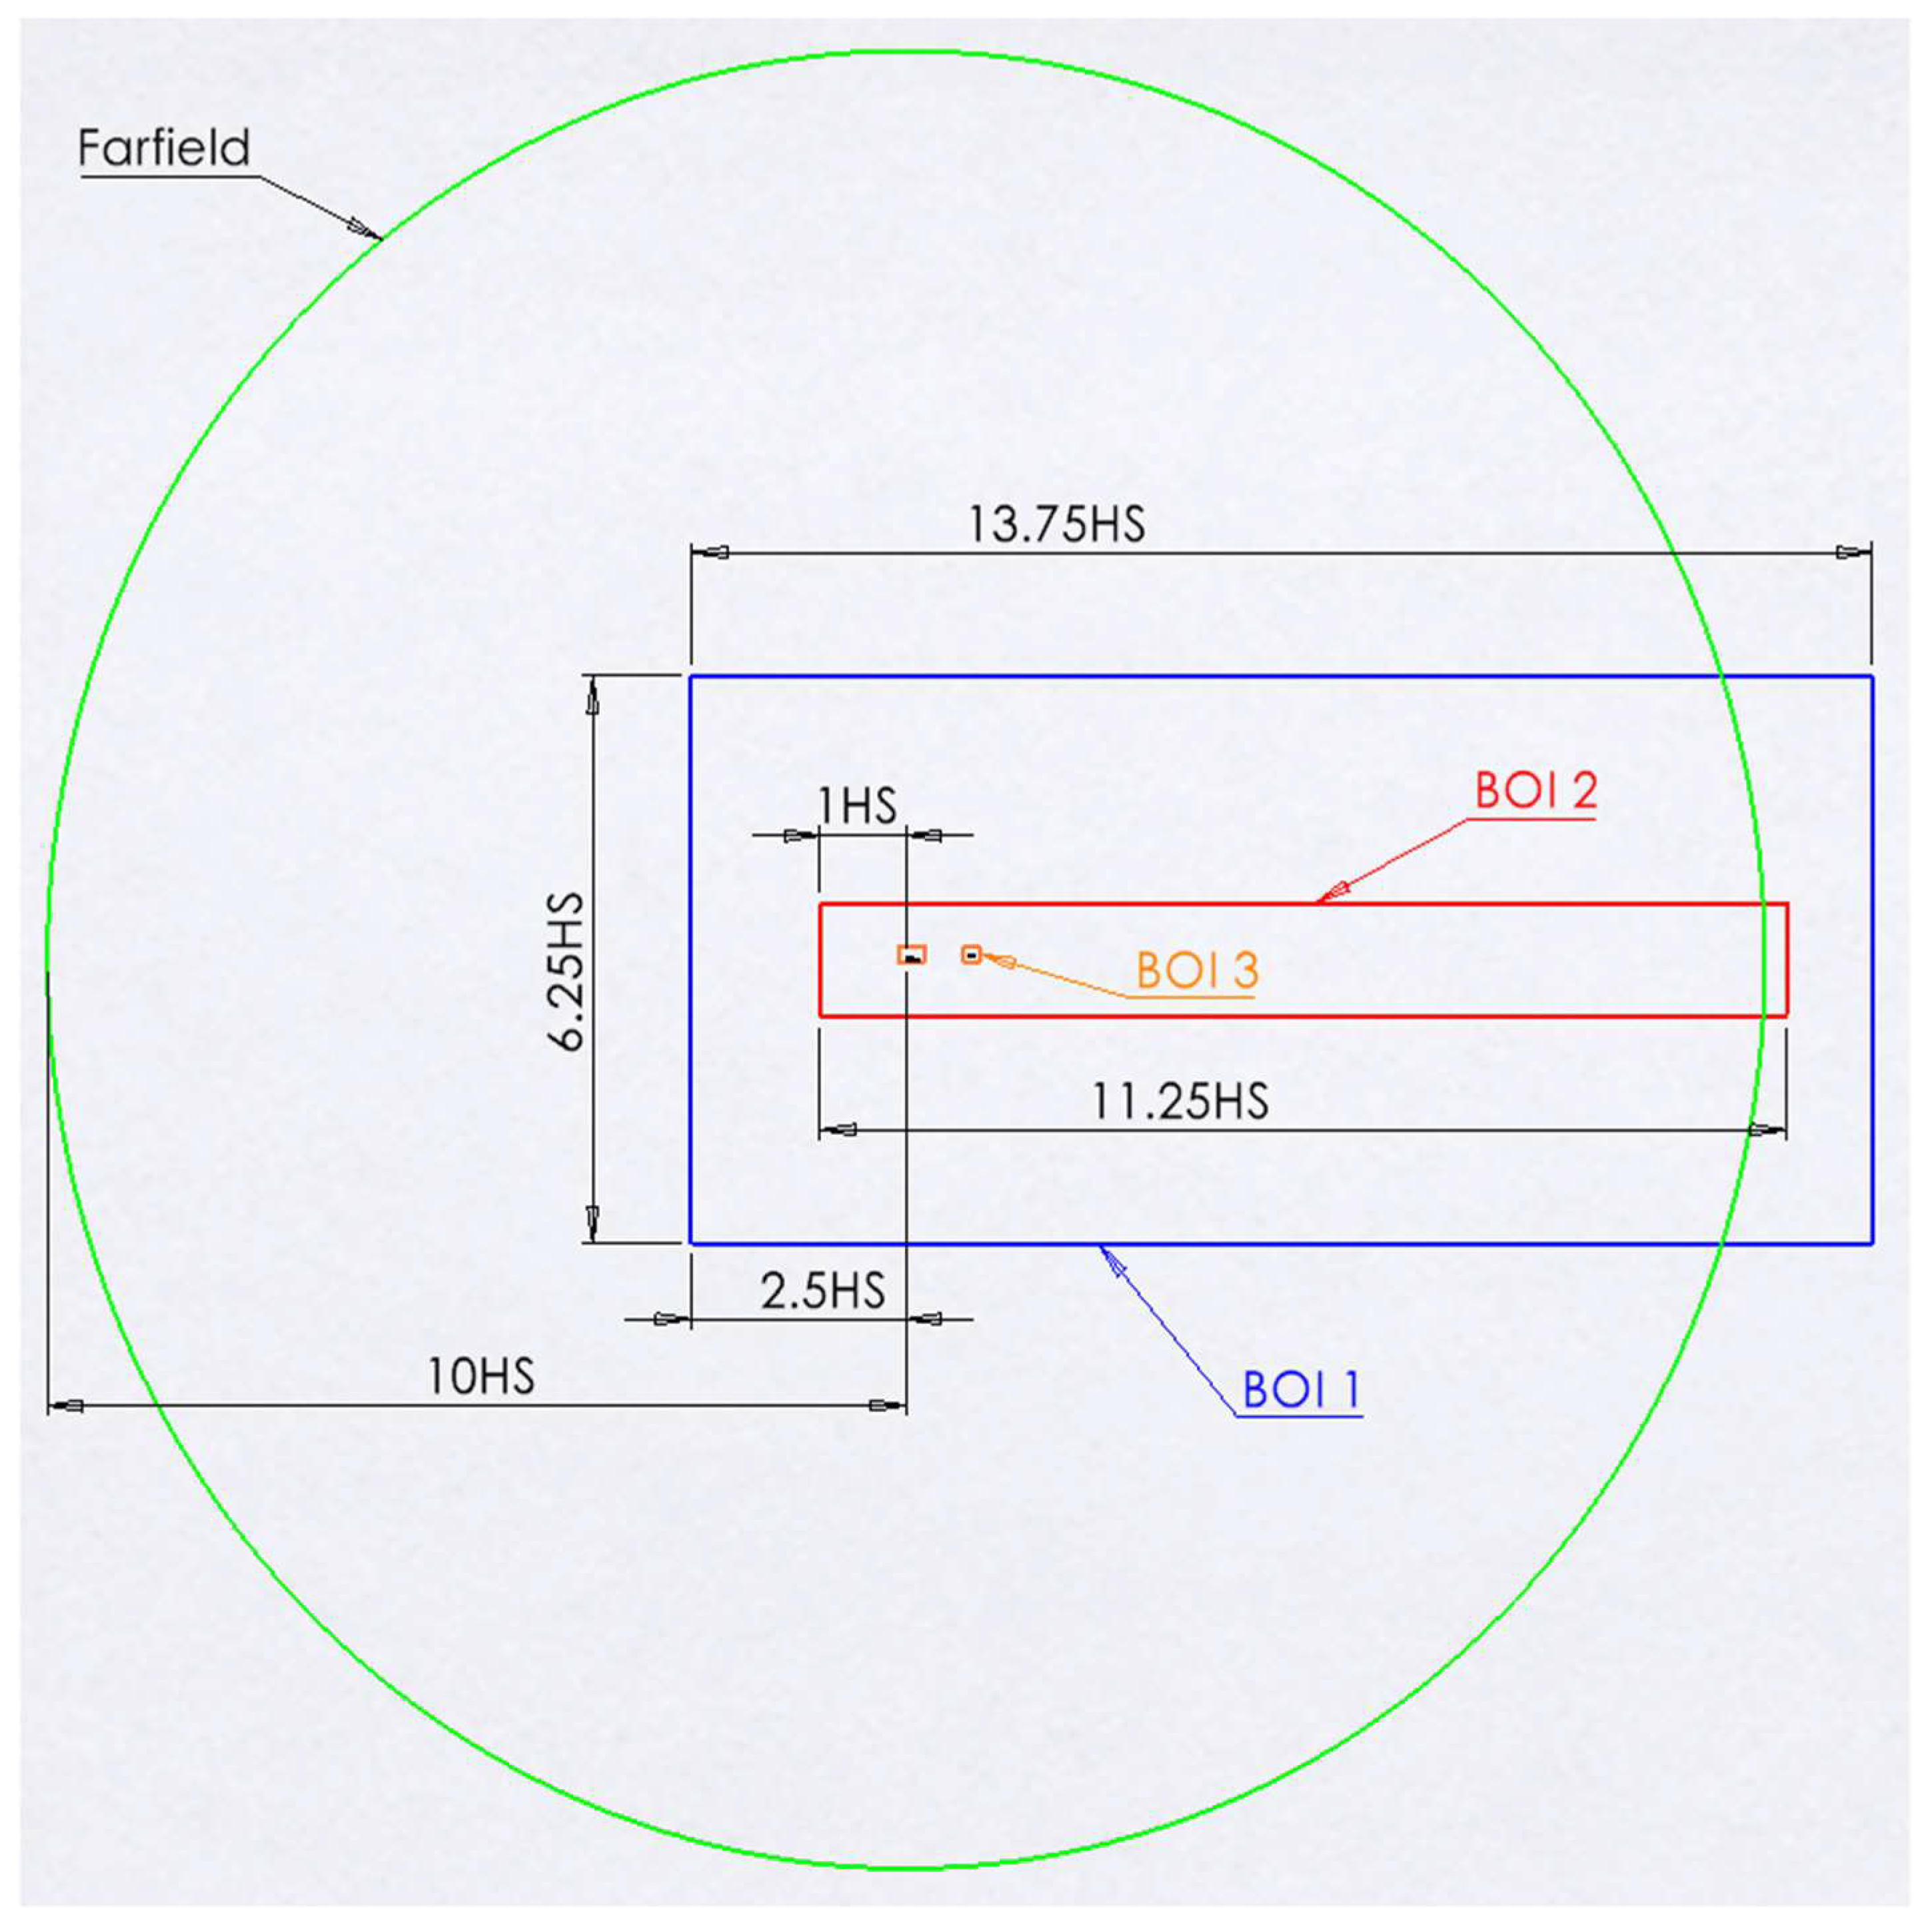
A typical flow domain used for the mesh and simulation is shown in Figure 3 (here, showing the JW63a configuration, where HS refers to Half Span and BOI refers to Body of Influence, respectively). A semi-spherical domain was chosen due to the ease of altering the flow angle [28], with a far-field inlet boundary that was set up with a flow Mach number of 0.85, an operating pressure of 5072.49 Pascal, and an inlet temperature of 322.04 Kelvin, resulting in an operating Reynolds number of 5 million, based on the mean aerodynamic chord of the wing (7 m). Turbulence settings were kept as default (i.e., 5% turbulence intensity and a turbulent viscosity ratio (ratio between turbulent and laminar viscosity) of 10), and the incoming flow angle altered using Cartesian coordinates as required for each angle of attack.
Mesh generation was completed using the Fluent meshing tool, ensuring a similar nodal distribution and mesh resolution across all geometries studied. The resulting mesh for the JW geometry consisted of approximately 14 million elements. A hybrid poly–hexacore meshing approach was employed, which generated unstructured polyhedral elements at domain interfaces (such as the far-field boundary, symmetry plane, and wall interfaces) and structured hexacore (cubic) elements in the interior regions, with a 2-cell buffer zone adjacent to the solid wall boundaries. This hybrid structured–unstructured mesh offers the advantage of faster mesh generation compared to a fully structured mesh, while also reducing computational time without compromising solution accuracy [29]. Additionally, this mesh generation type was selected to mitigate edge-sizing issues encountered with ANSYS meshing along the leading edge of the main wing for the CRM configuration, which were identified in earlier stages when using unstructured tetrahedral meshing.
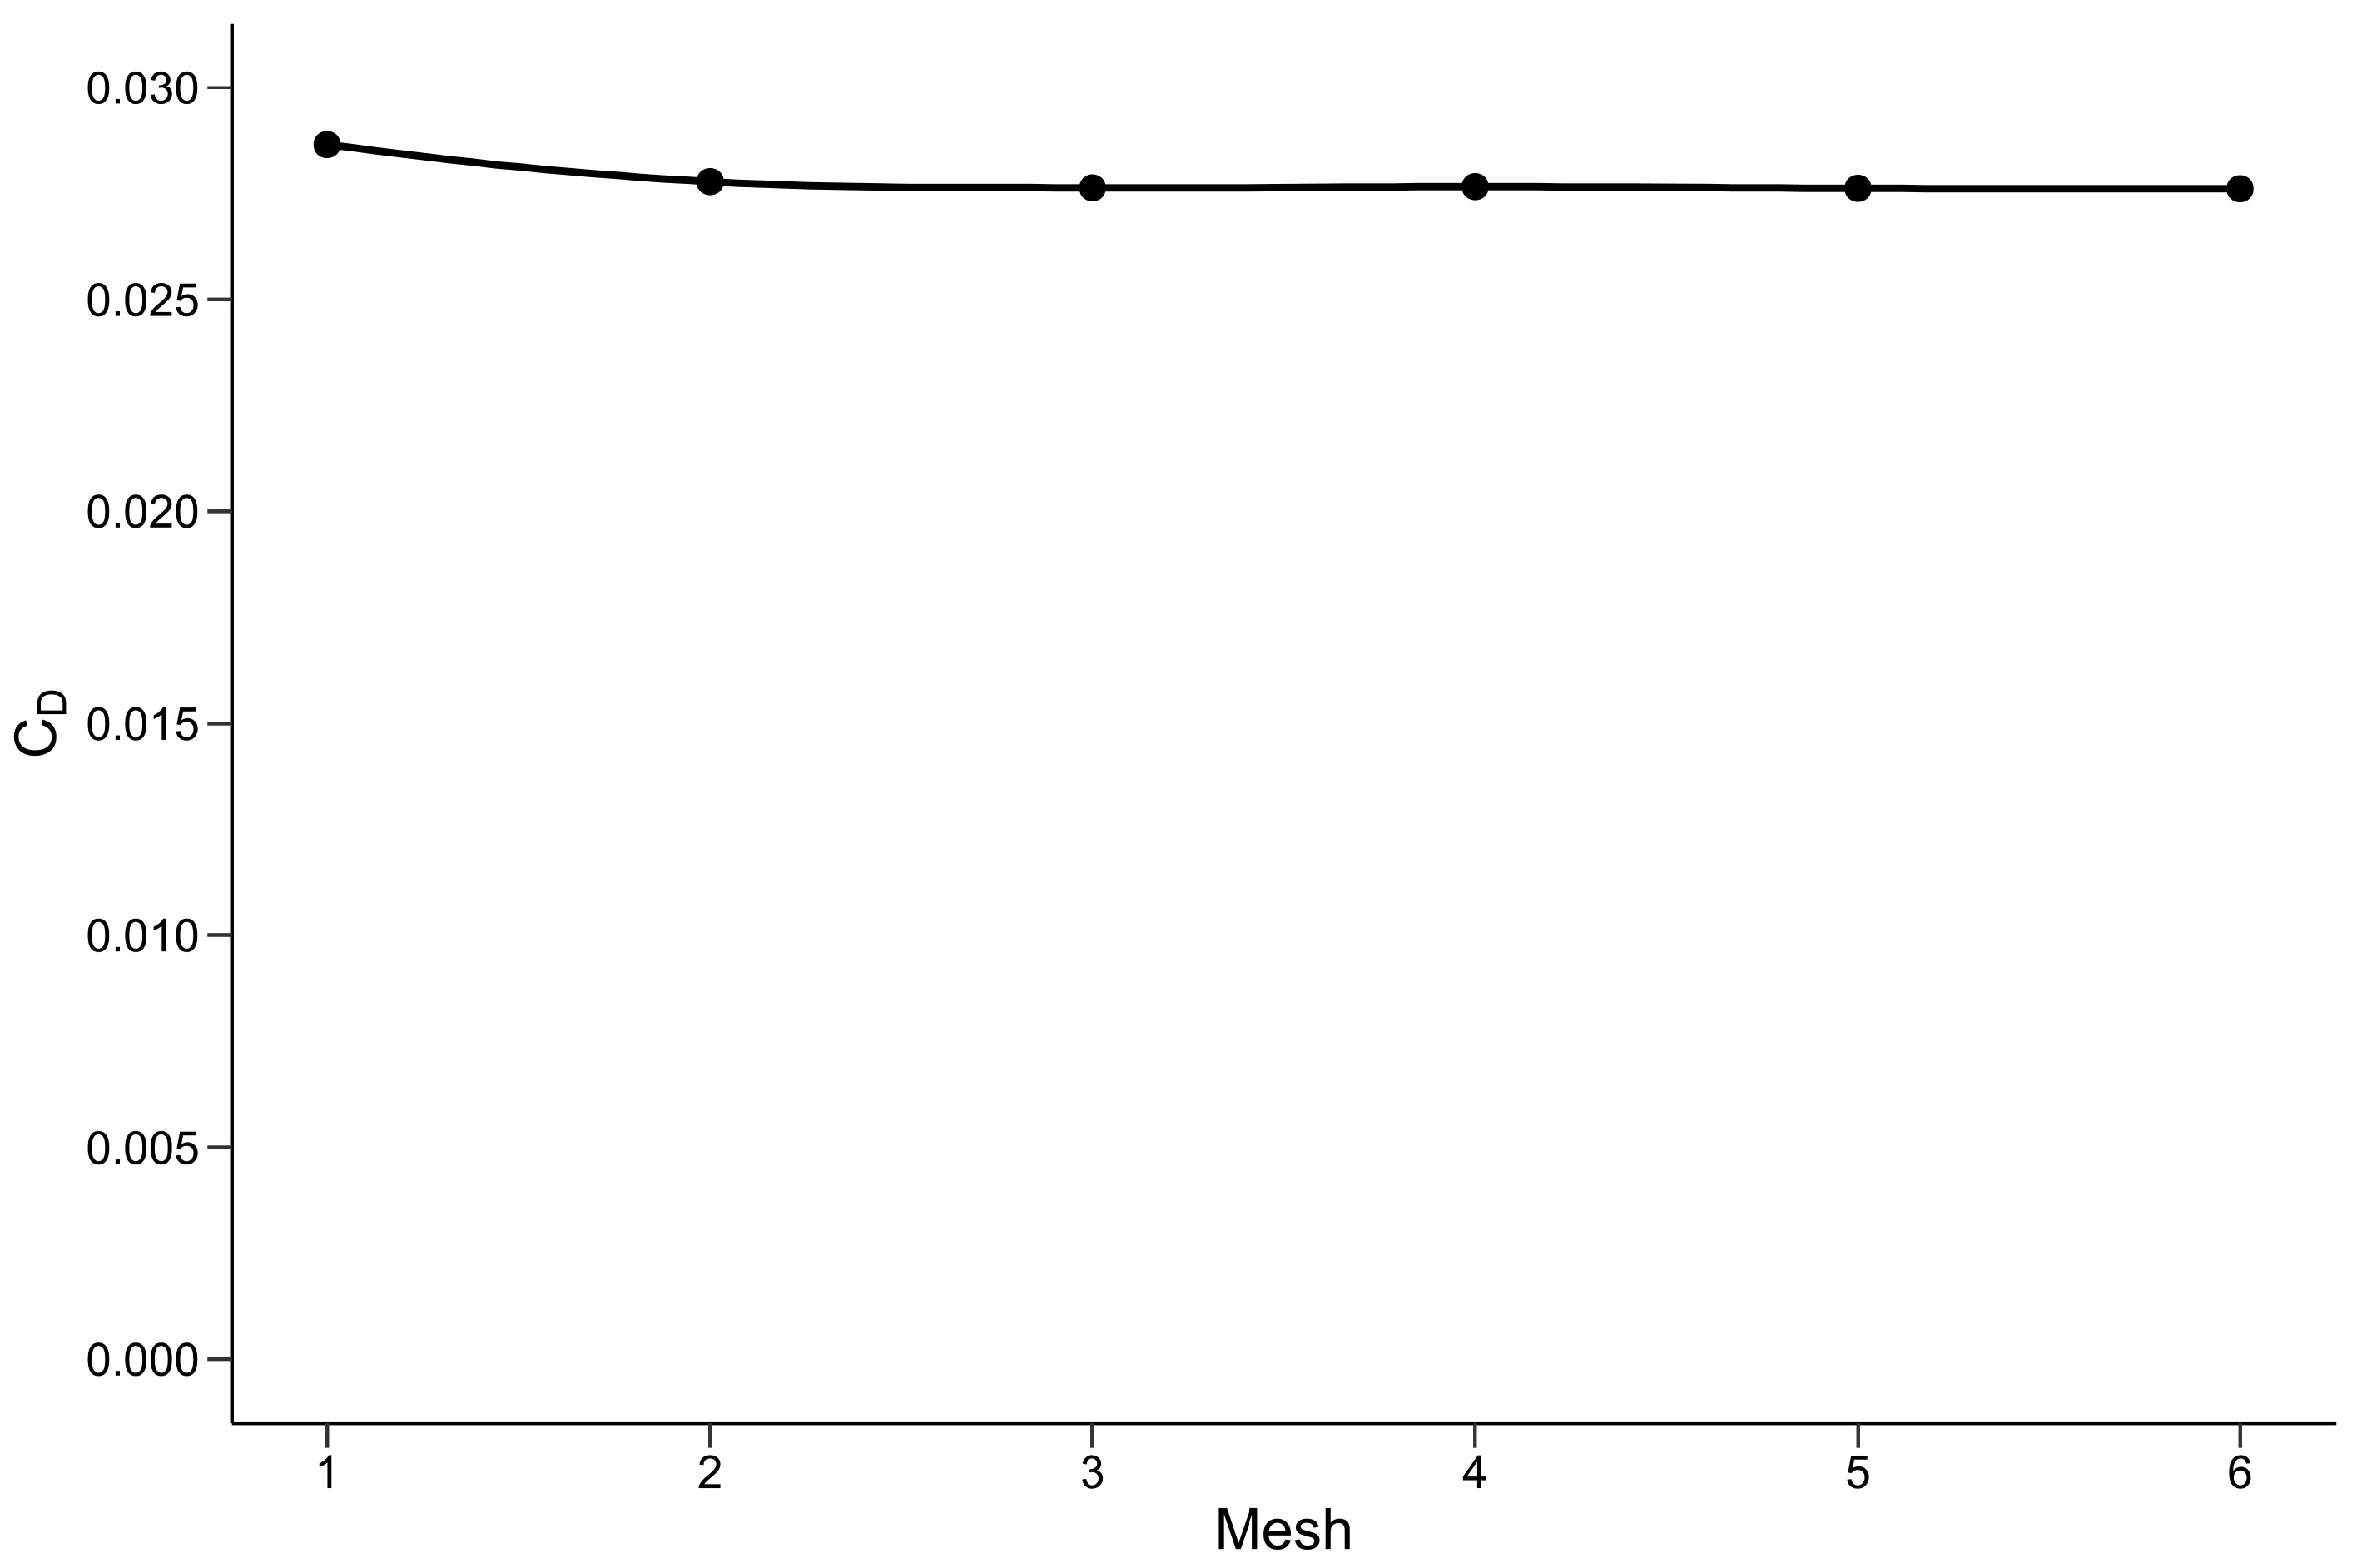
An inflation layer approach was employed to model the boundary layer near the surface using quad elements with progressively finer cell sizes closer to the surfaces of both wings and the joint. Figure 4 illustrates the overall polyhedral mesh elements in the domain (a) and the poly–hexacore transition (b), highlighting how the hexacore mesh evolves from the surface mesh to the volume mesh. The initial boundary layer height was determined based on the test conditions, targeting a y+ value of approximately 1 on the wing surfaces. This approach resulted in a first layer thickness of 3 × 10⁻⁵ m from the wall, with 22 layers and a growth rate of 1.4, achieving an overall boundary layer height of 0.101 m. A mesh independence study was performed to determine the optimal fidelity of the mesh, the results of which can be seen in Figure 5.
Overall, the maximum difference between the first mesh and the final mesh was 3.70%, with CD settling to 0.026. Table 3 shows the number of elements associated with each level of mesh.
The final mesh chosen was mesh 4, as convergence was achieved at this point. This was also partially driven by computational and time limitations at the higher mesh counts. An example of the final mesh settings is provided in Table 4 for the JW63a geometry.

2.3.1. CFD Solver

CFD study was performed using ANSYS Fluent (Version 2022 R1), using a pressure-based coupled algorithm flow solver. Additionally, all simulations utilised the k-ω SST (Shear Stress Transport) turbulence model as it is suited for transonic flows, often characterised by shocks and separated flow regions [30]. Due to the complexity in flow physics introduced by the vertical joint, the simulations were set up using pseudo-transient settings to relax the resolution of small-scale transient flow features that would appear in the flow solution. An initial length scale was set based on the MAC of the main wing, with a time scale factor of 5 (default) used to set the global time-step used in a pseudo-transient steady-state solution [31]. If instability in either of the monitored values of lift or drag persisted after the initial phase of iterations, then the length scale was reduced to a length equal to the chord of the main wing tip and the time scale factor adjusted in accordance with Equation (1) [29].
t u = 0.3 L s c a l e M A X U b c , U d o m a i n
where t u is the fixed time-step, the velocity U b c is the maximum of the arithmetic average of the velocity at the domain boundary faces, and U d o m a i n is the arithmetic average of the velocity over the cells in the domain [32].
All geometries were simulated with a MAC Reynolds number of 5 million at M = 0.85 and at a range of angles of attack (AoA) from −3 to 8 degrees, to provide lift and drag coefficient results in accordance with the test conditions for the CRM wing–tail configuration [25]. However, there was an exception regarding the CRM wing–body geometry, which would only be run at 2.5 degrees to provide validation data for the pressure coefficient CP. In addition, the primary results of the JW configurations, including the flow analysis of the joint location, were performed at 2.5 degrees AoA only.

2.3.2. Validation of Numerical Approach

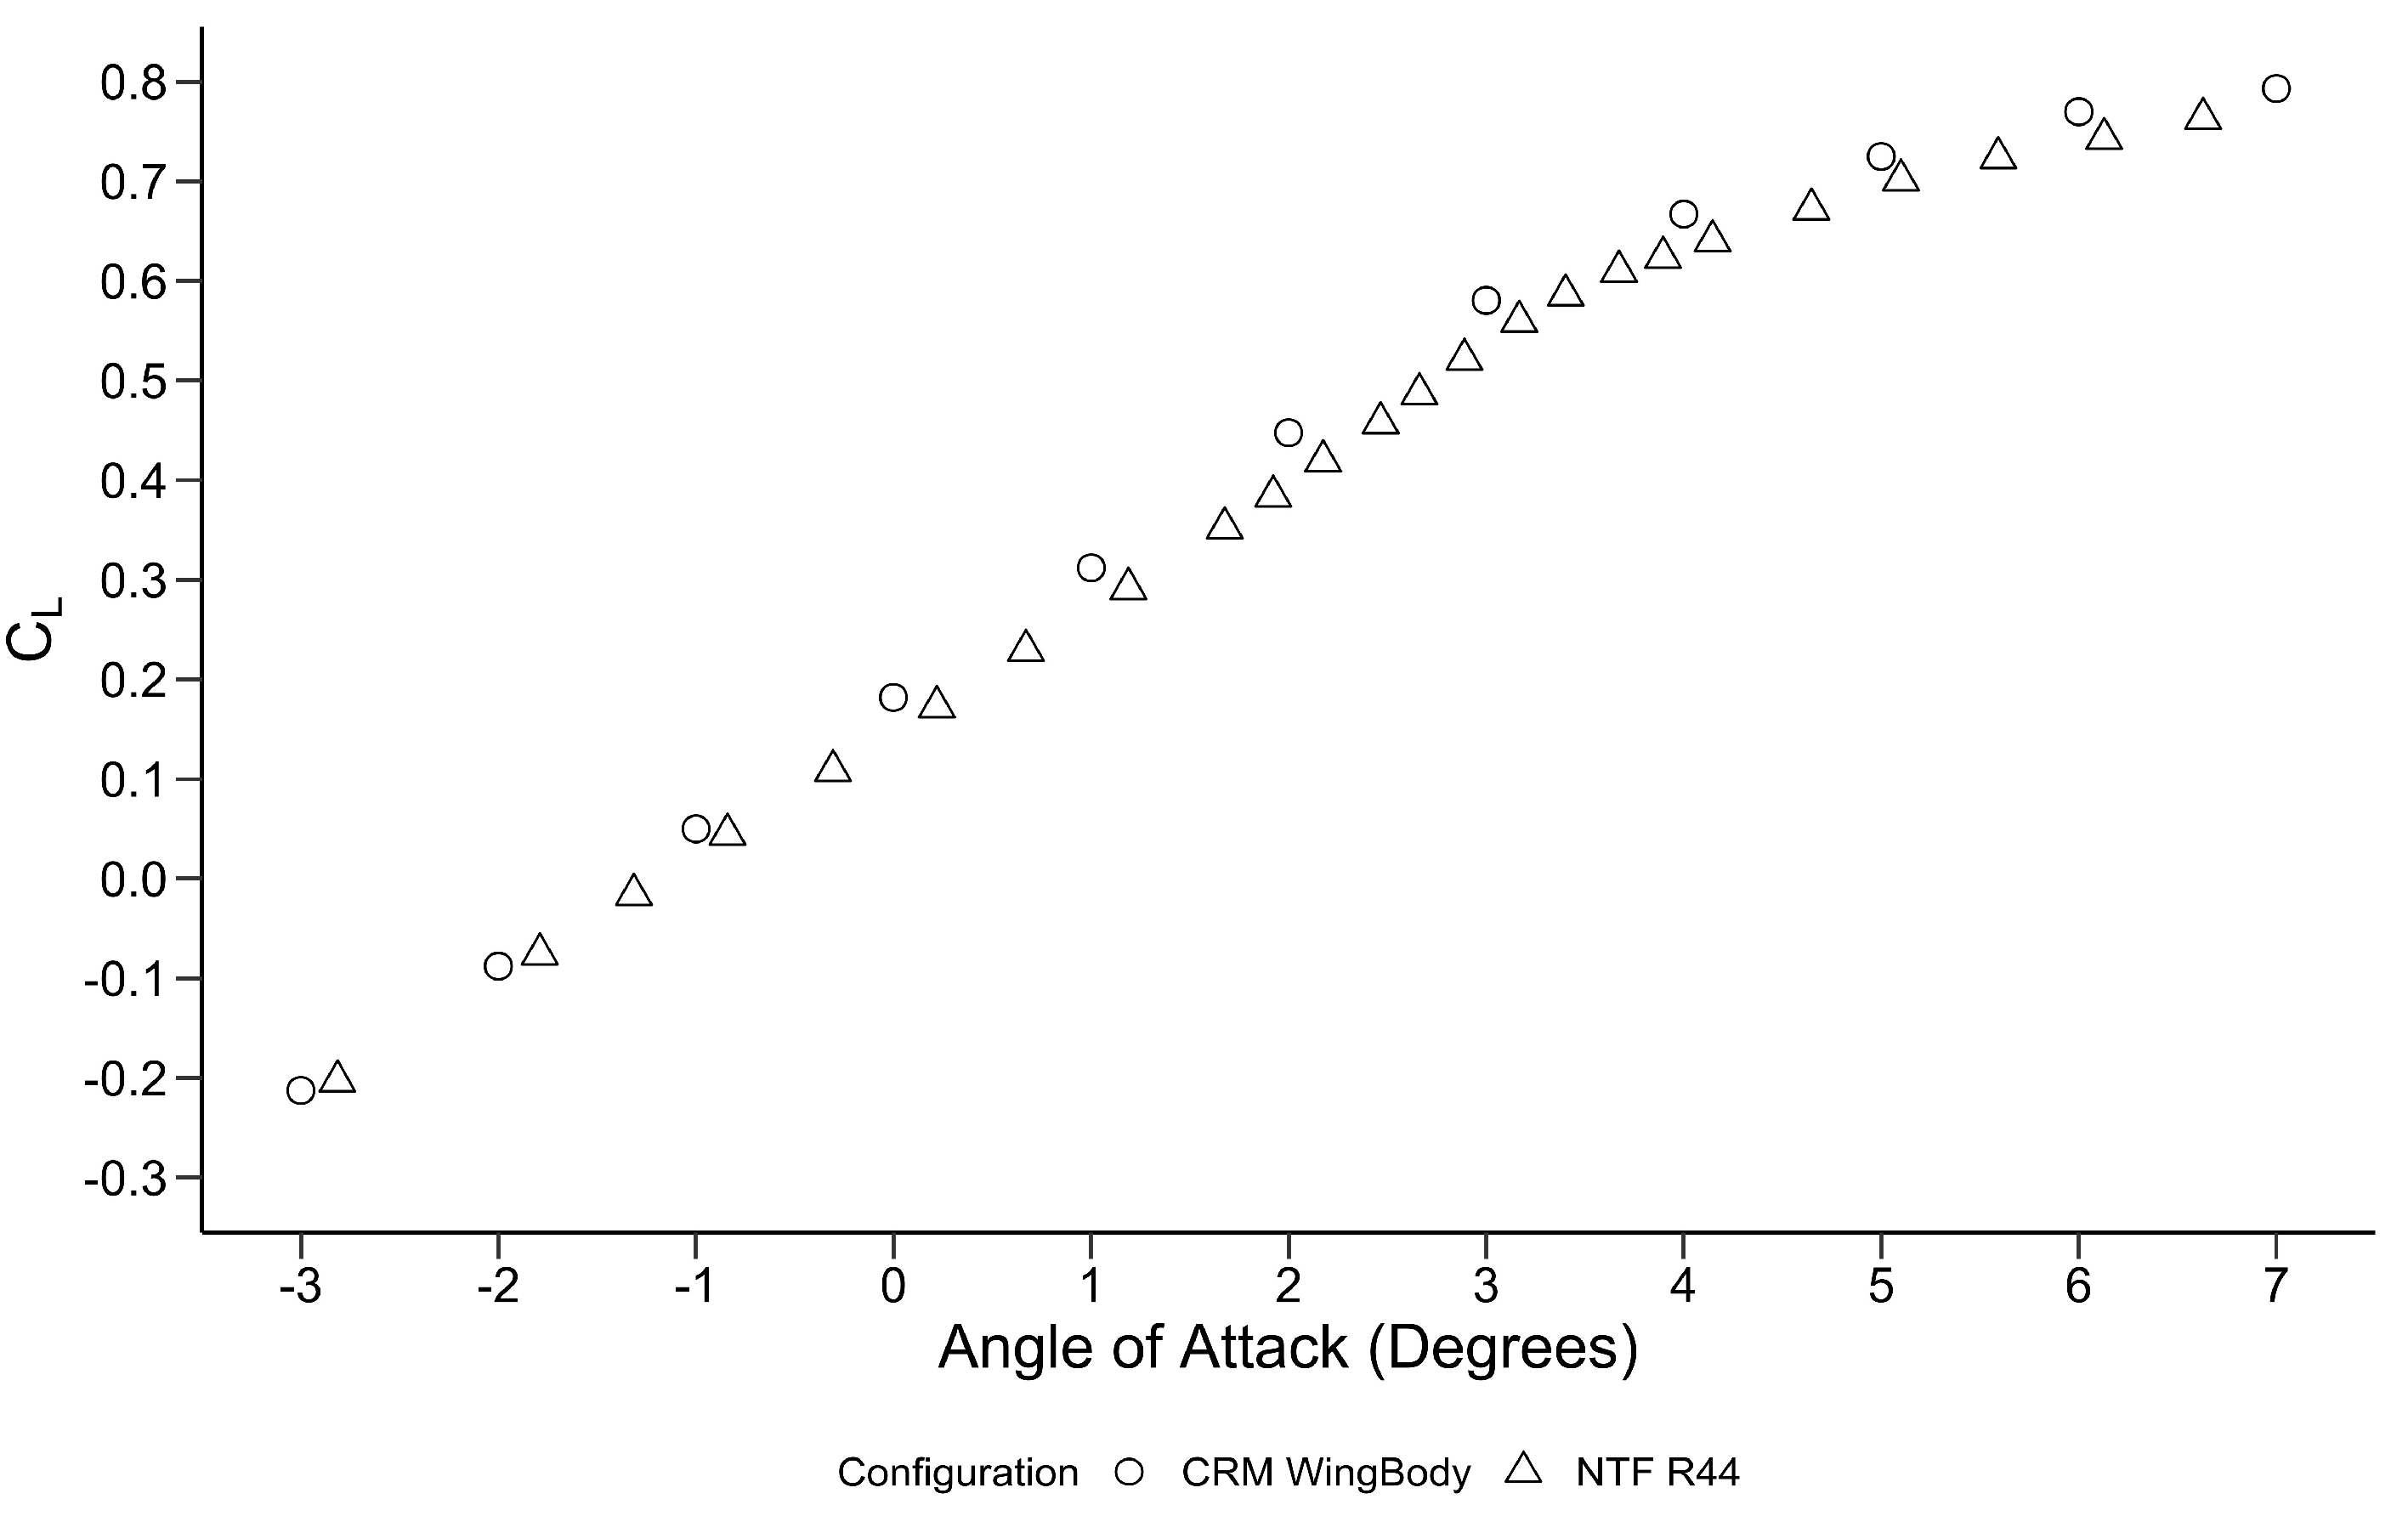
Validation of the numerical approach at transonic speeds was performed against the available experimental data for the CRM wing–body configuration [24]. A scale model of the CRM wing–body configuration was tested in the NASA National Transonic Facility (NTF) at Mach 0.85, resulting in an operating Reynolds number of 5 million (referred to in the results as NTF R44). These conditions were maintained consistently as the model was pitched through a range of angles of attack (−3 to 8 degrees) to generate a lift curve. Additionally, the CRM design point, with a lift coefficient CL of 0.5 achieved at 2.5 degrees during experimentation, was simulated using CFD to validate the local lift effects on the main wing in terms of pressure coefficient. The geometry used for simulations was the full-scale wing–body CAD geometry, as given by the 4th drag prediction workshop [33]. The lift coefficient and drag coefficient results, as plotted in Figure 6 and Figure 7, show good agreement with experimental data across all angles of attack, with an average difference between the experimental and numerical results of just 0.08% for CL and 1.3% for CD. Figure 8 presents the simulated pressure coefficient distributions along the span of the main wing for the wing–body CRM geometry at 2.5 degrees and Mach 0.85, compared to the experimental results [24] (data set R44). The simulated results correlate well with the experimental data, displaying similar discrepancies to those reported in other CFD validation studies on the CRM [28], particularly the higher suction near the wing tip observed in the simulations, although the previous studies did not provide an explanation for these discrepancies.
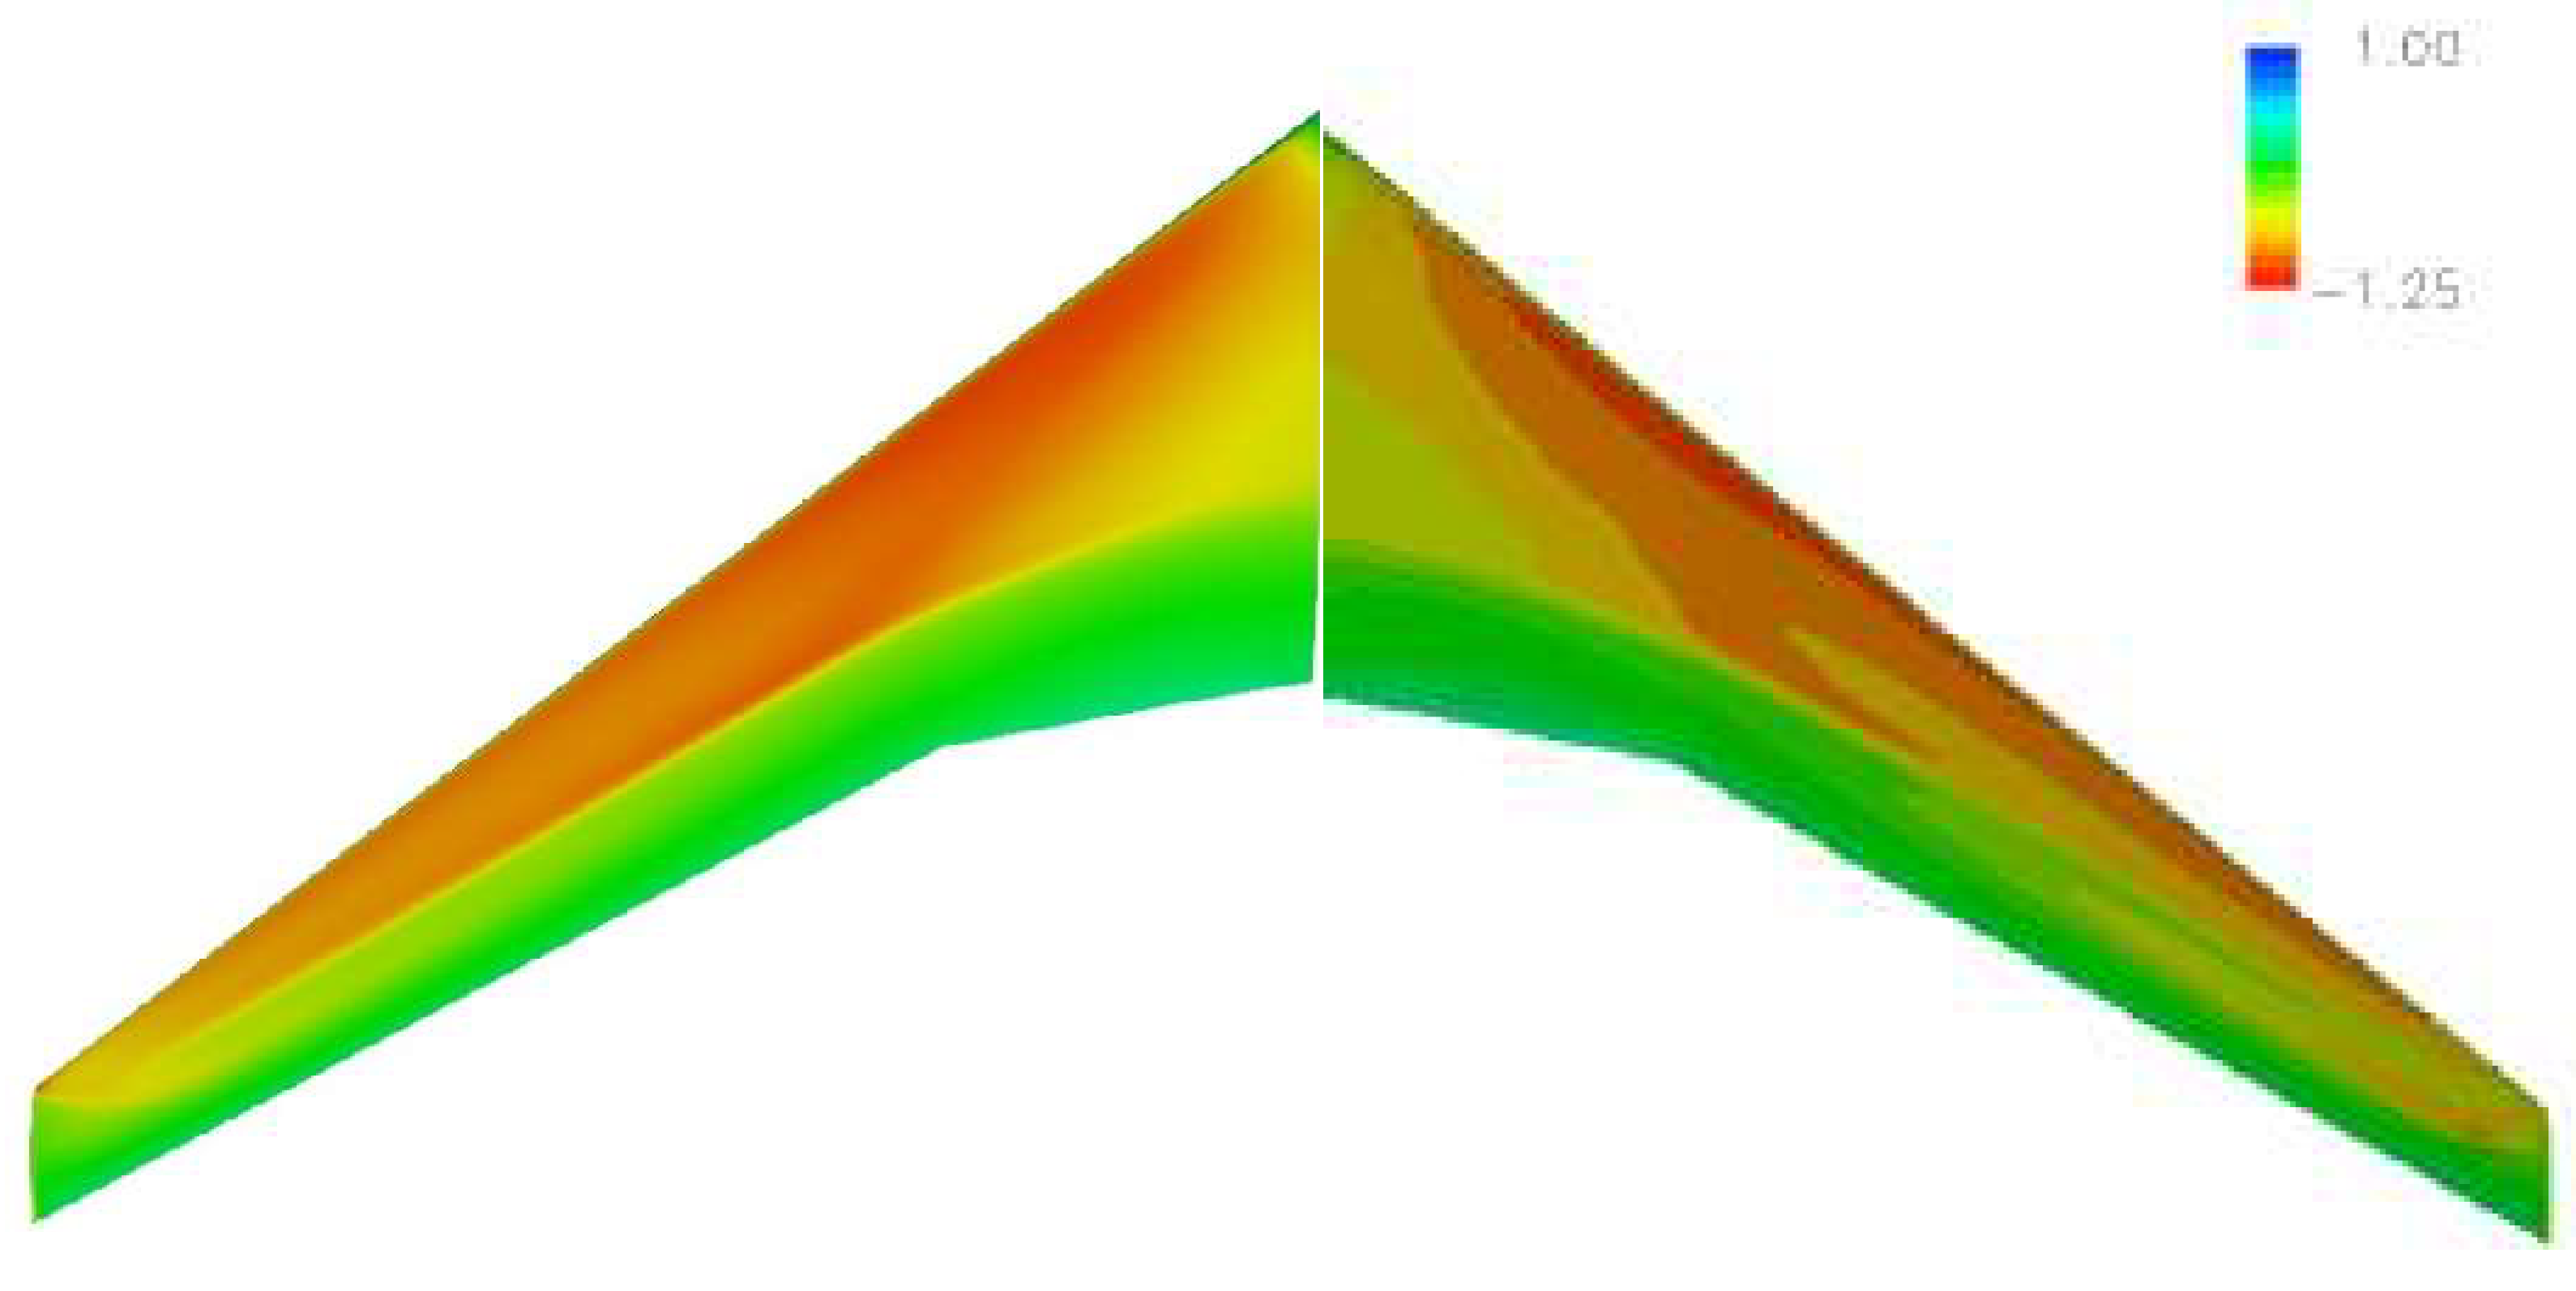
Furthermore, the pressure coefficient contours from current CFD (as shown in Figure 9) exhibit reasonable correlation with other numerically computed pressure contours [23] for CRM at M = 0.85 and α = 2.5°. Based on the validation results, it can be concluded that the CFD method used was appropriate for this study.

3. Transonic Flow Results for JW Configurations and Discussions

Once validation of the CFD approach was established, the focus next was on the aerodynamic performance and flow characteristics associated with JW configuration at transonic speeds (M = 0.85).

3.1. Initial Joined–Wing Configuration (JW63a)

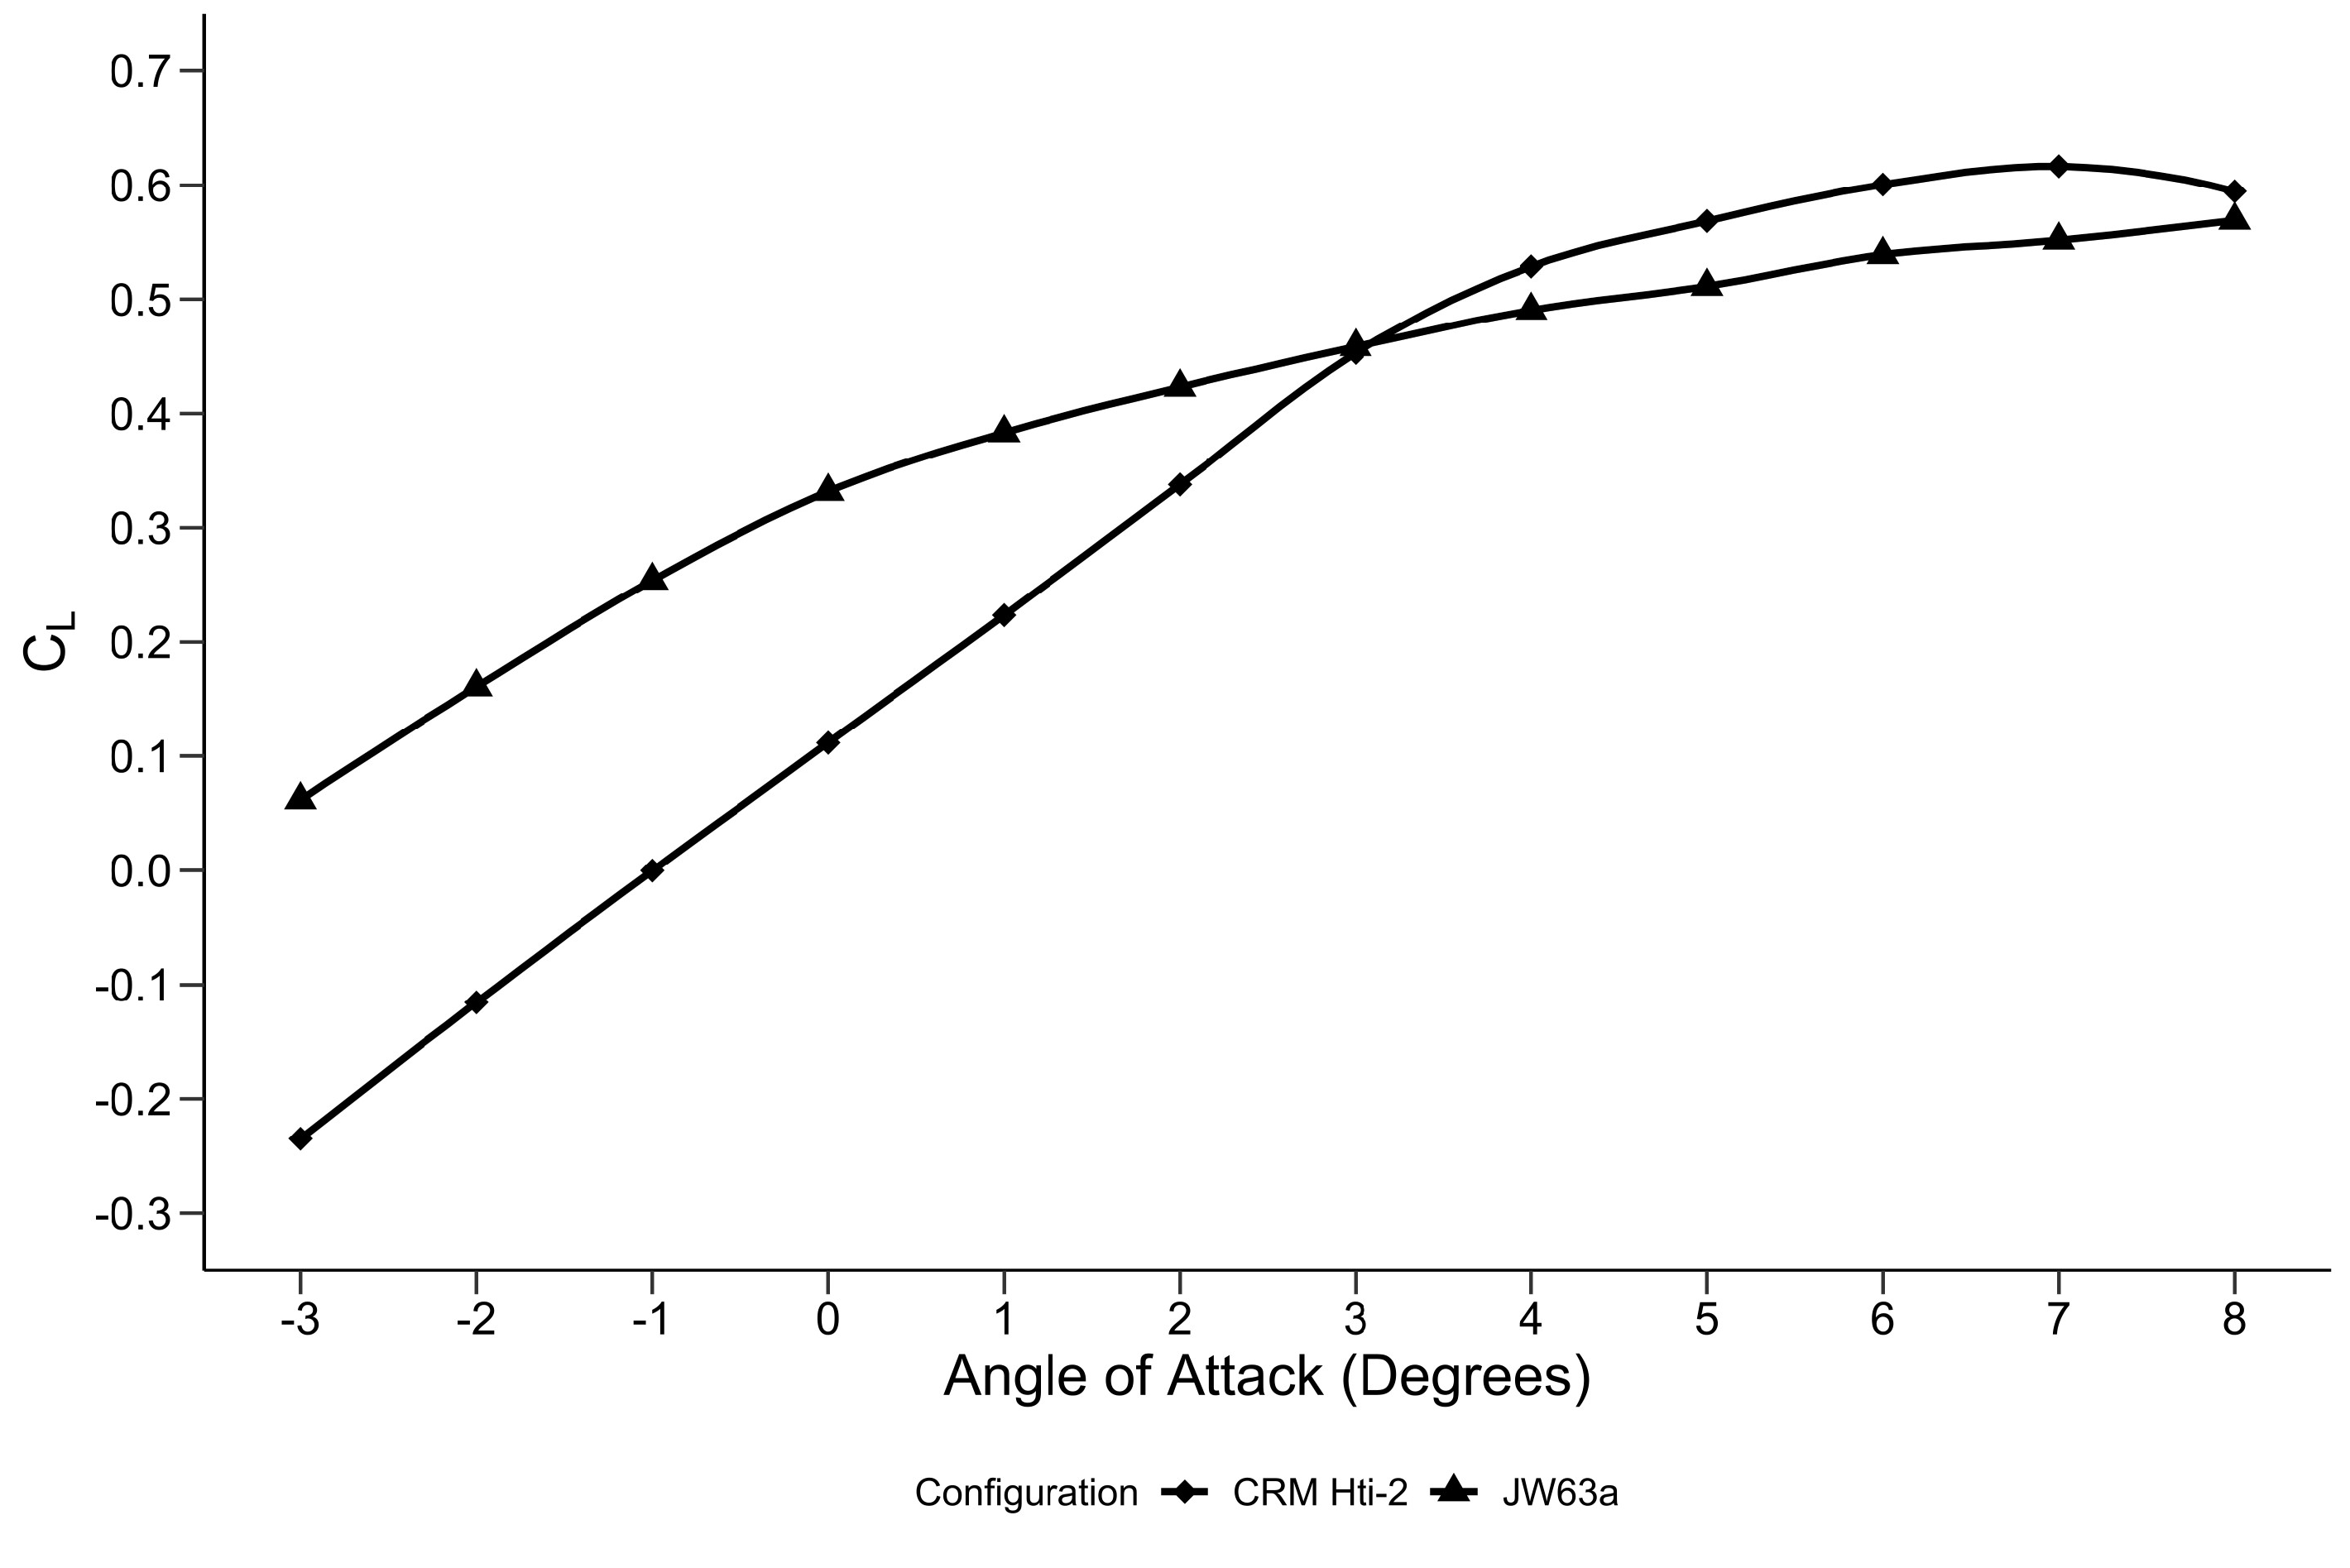
The JW63a configuration was investigated for aerodynamic characteristics at transonic conditions (M = 0.85) and compared with the baseline CRM wing with its Hti-2 tail configuration. An investigation of the flow characteristics around the joint was also performed to see how the joint may affect the main front wing. Figure 10 and Figure 11 compare, respectively, the variation in lift and drag coefficient data against the AoA between the JW63a and the CRM baseline wing–tail configuration. Figure 10 shows that the JW63a produces a greater lift coefficient compared to CRM at lower angles (below 3 degrees), while Figure 11 shows that the overall drag coefficient for the JW63a was greater than the CRM configuration, aside from very low angles (below −1 degrees).
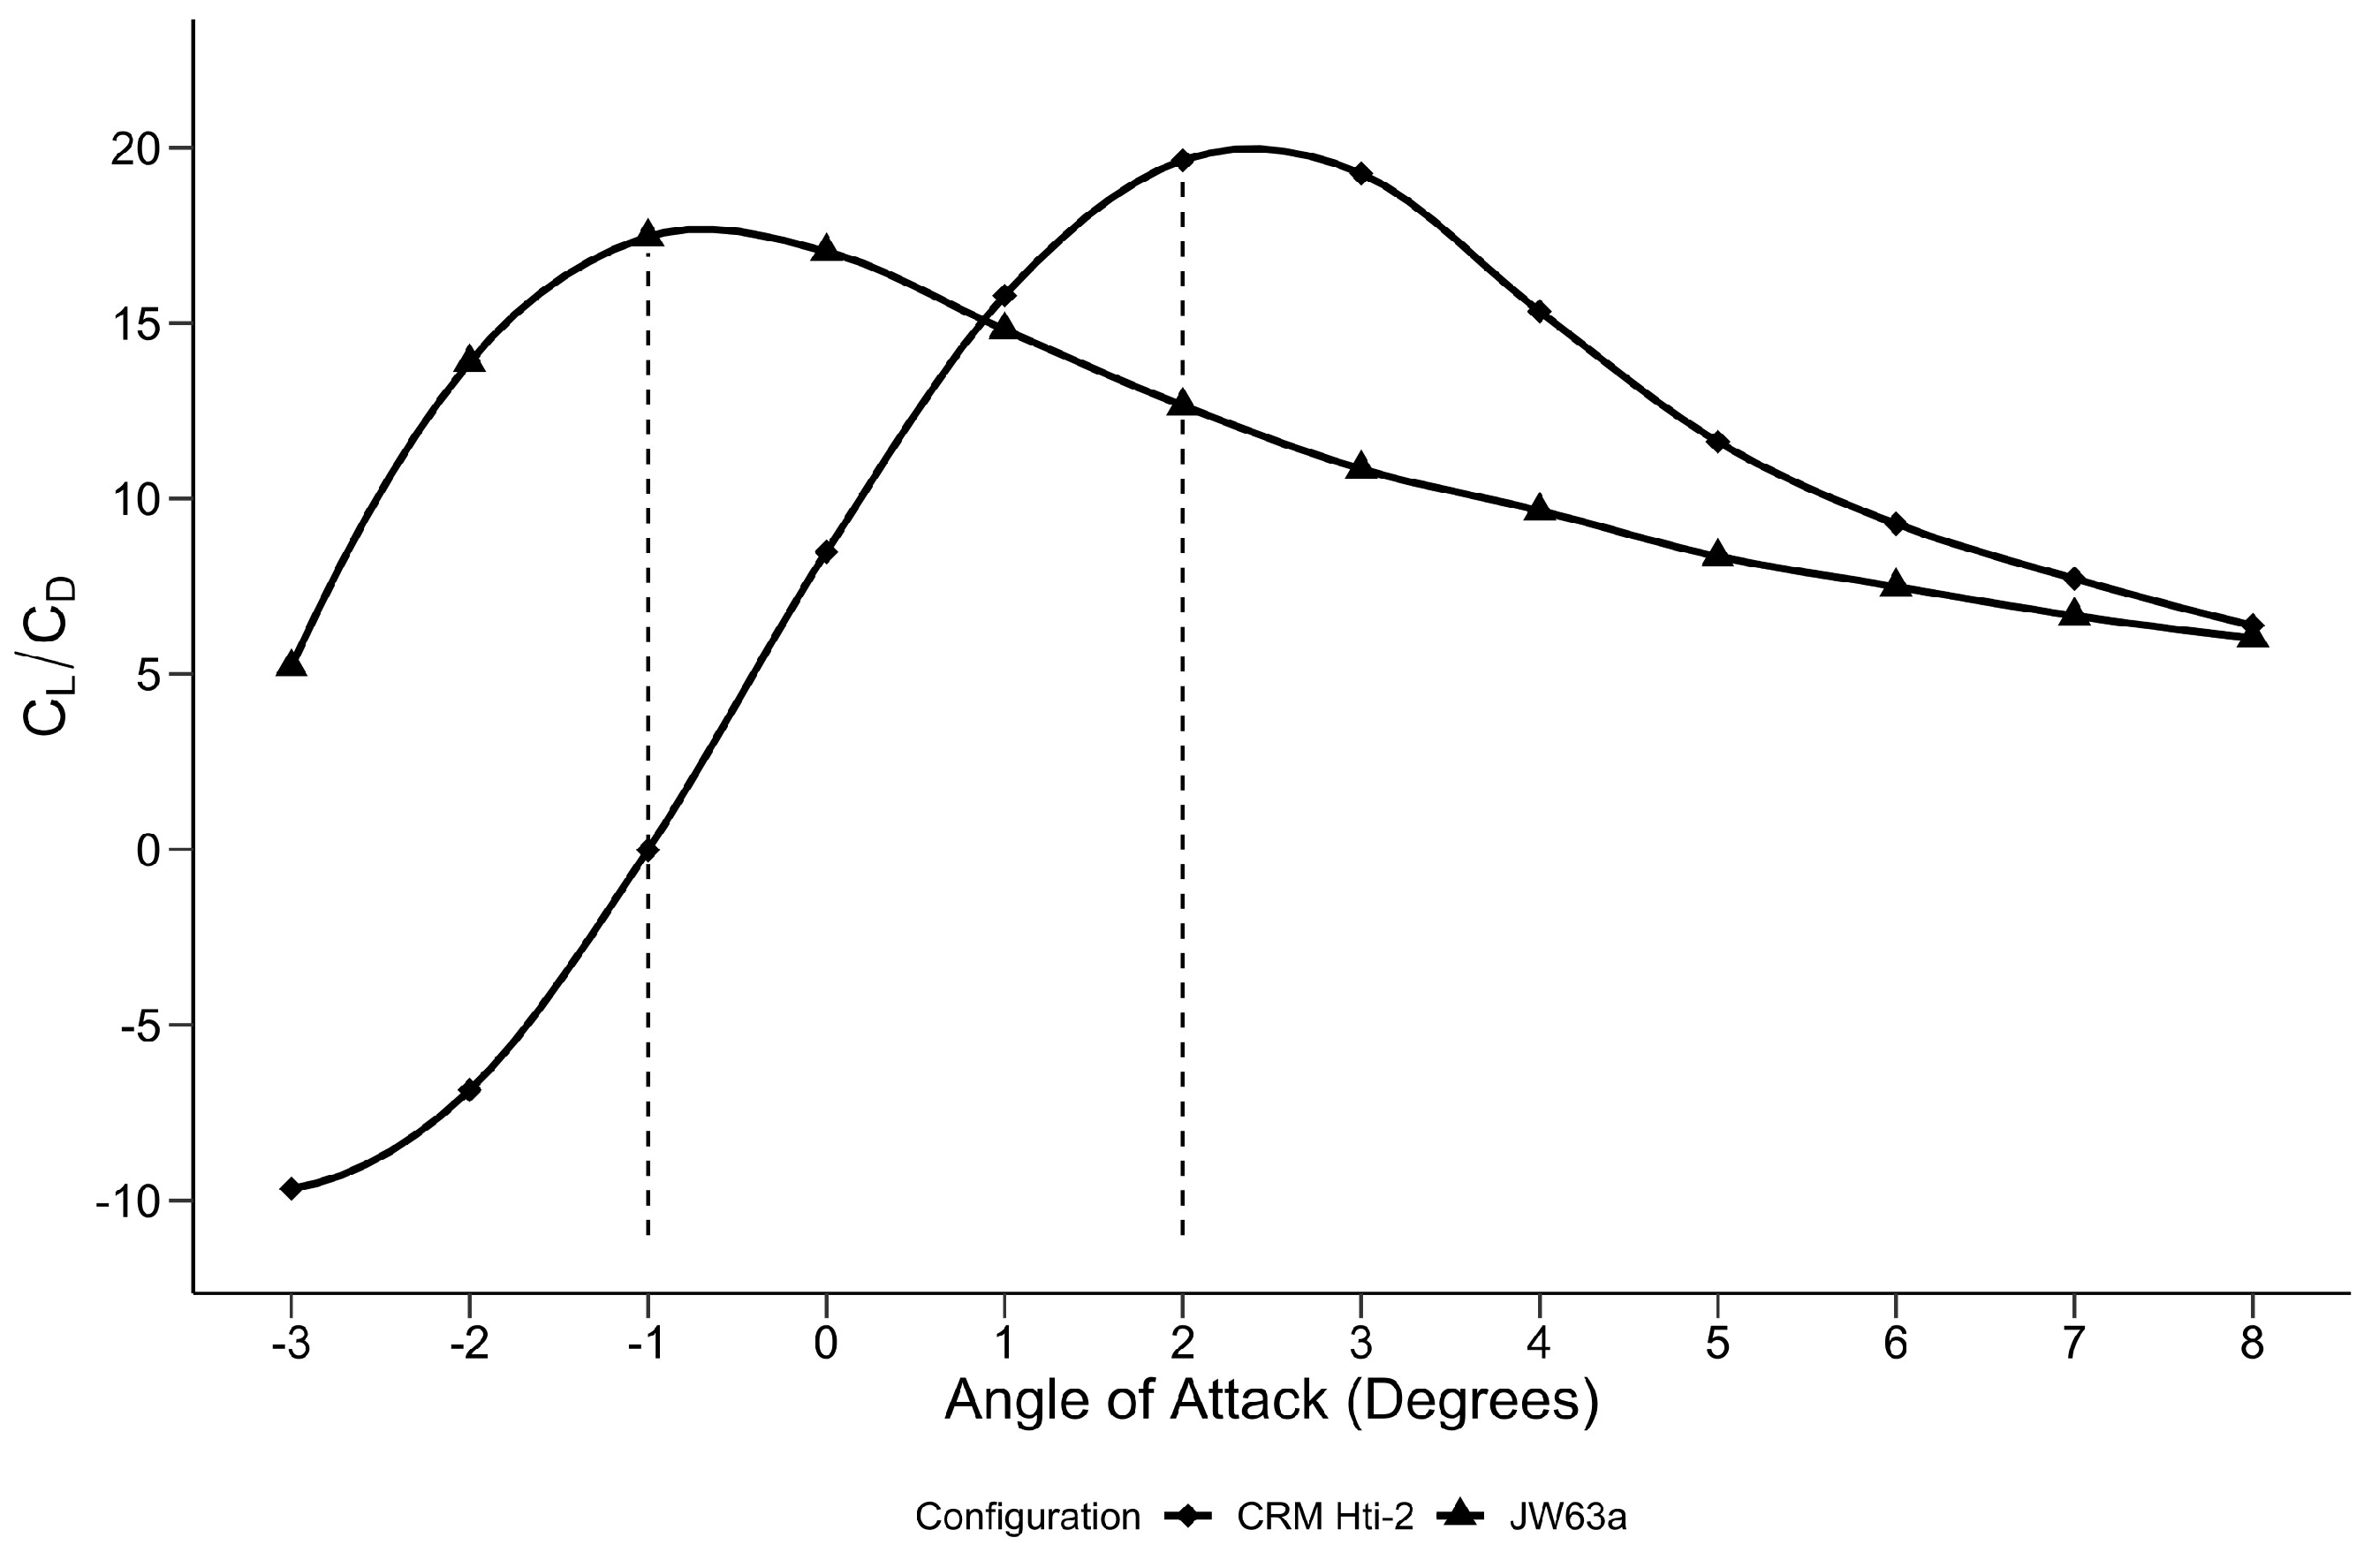
Moreover, as depicted in Figure 12, the lift-to-drag ratio (CL/CD) for each configuration was plotted against the angle of attack (AoA). Both configurations show an initial increase in lift-to-drag ratio with the AoA, reaching a peak value before starting to decrease at higher angles. However, this does not occur at similar angles of attack between the configurations. Beyond an AoA of 6°, the lift-to-drag ratio of the two configurations becomes quite similar. It is seen that for an AoA between −3° and 0.8°, the L/D of the JW63a is higher than that of the CRM. The JW63a configuration achieves a peak L/D ratio of 17.45 at an angle of attack of −1 degree, which, while 11.15% lower, is still comparable to the CRM configuration’s peak L/D of 19.64 at 2 degrees AoA from the CFD results. This comparison highlights the JW63a’s competitive aerodynamic efficiency, particularly at low AoA, despite the CRM configuration demonstrating superior performance beyond an AoA of 0.8°. In practical terms, a JW configuration at M = 0.85 must fly at low AoA (−1 ° to 1 ° ) to maintain a high lift-to-drag ratios. The results in Figure 11 also show that a JW design can realistically cruise at 0 AoA with an L/D of about 17, at which point the CRM’s L/D is only about 8.
Since the two configurations have the same wet area, one could assume that they have the same skin friction drag (due to the same Reynolds number). Therefore, it is reasonable to suggest that the superior overall L/D performance of the CRM beyond an AoA of 0.8° is linked to lower pressure drag (due to no flow separation) and lower wave drag (due to weak shock waves) compared with much higher values for the JW concept. This can be seen in Figure 13 comparing the pressure drag coefficients of both the CRM and JW63a. Note that the JW63a produces a greater CDp for all angles except −3°. For this reason, we will investigate the flow behaviour of the JW63a concept, including the effects of the vertical joint on flow separation and shock wave structures, and attempt to understand their impact on the overall performance of the JW configuration.
C D i = C L 2 π e A R
Conversely, the calculated induced drag coefficient CDi values for the JW main wing at different AoAs are shown in Figure 14. CDi is calculated using Equation (2); note that parameter ‘e’ is taken as 0.8 (see, e.g., [34]) and AR is defined for the whole JW configuration, therefore using an average AR of 22.21 (see Table 2). For the CRM configuration, the separate values of CDi are summated for this figure. Compared with CRM, JW63a produces a decrease in CDi of 39% at 1 degree, 75% at 2 degrees, and 100% at 3 degrees, respectively, further increasing to over 100% for the higher angles. Given the same ‘e’, this trend was expected since the JW63a has a much higher AR compared with CRM, despite producing higher CL values for an AoA up to 3 ° . Conversely, CRM matches, or produces a marginally lower, CDi only at lower angles of attack compared to JW63a. The findings in Figure 14 demonstrate that if the JW63a and CRM configurations are solely compared on the basis of their CDi, then the JW concept shows a superior performance. However, this may be misleading because Figure 10 shows that in terms of total drag, the baseline CRM has lower drag over most of the AoA range (−1 ° to 8 ° ) compared with JW63a.
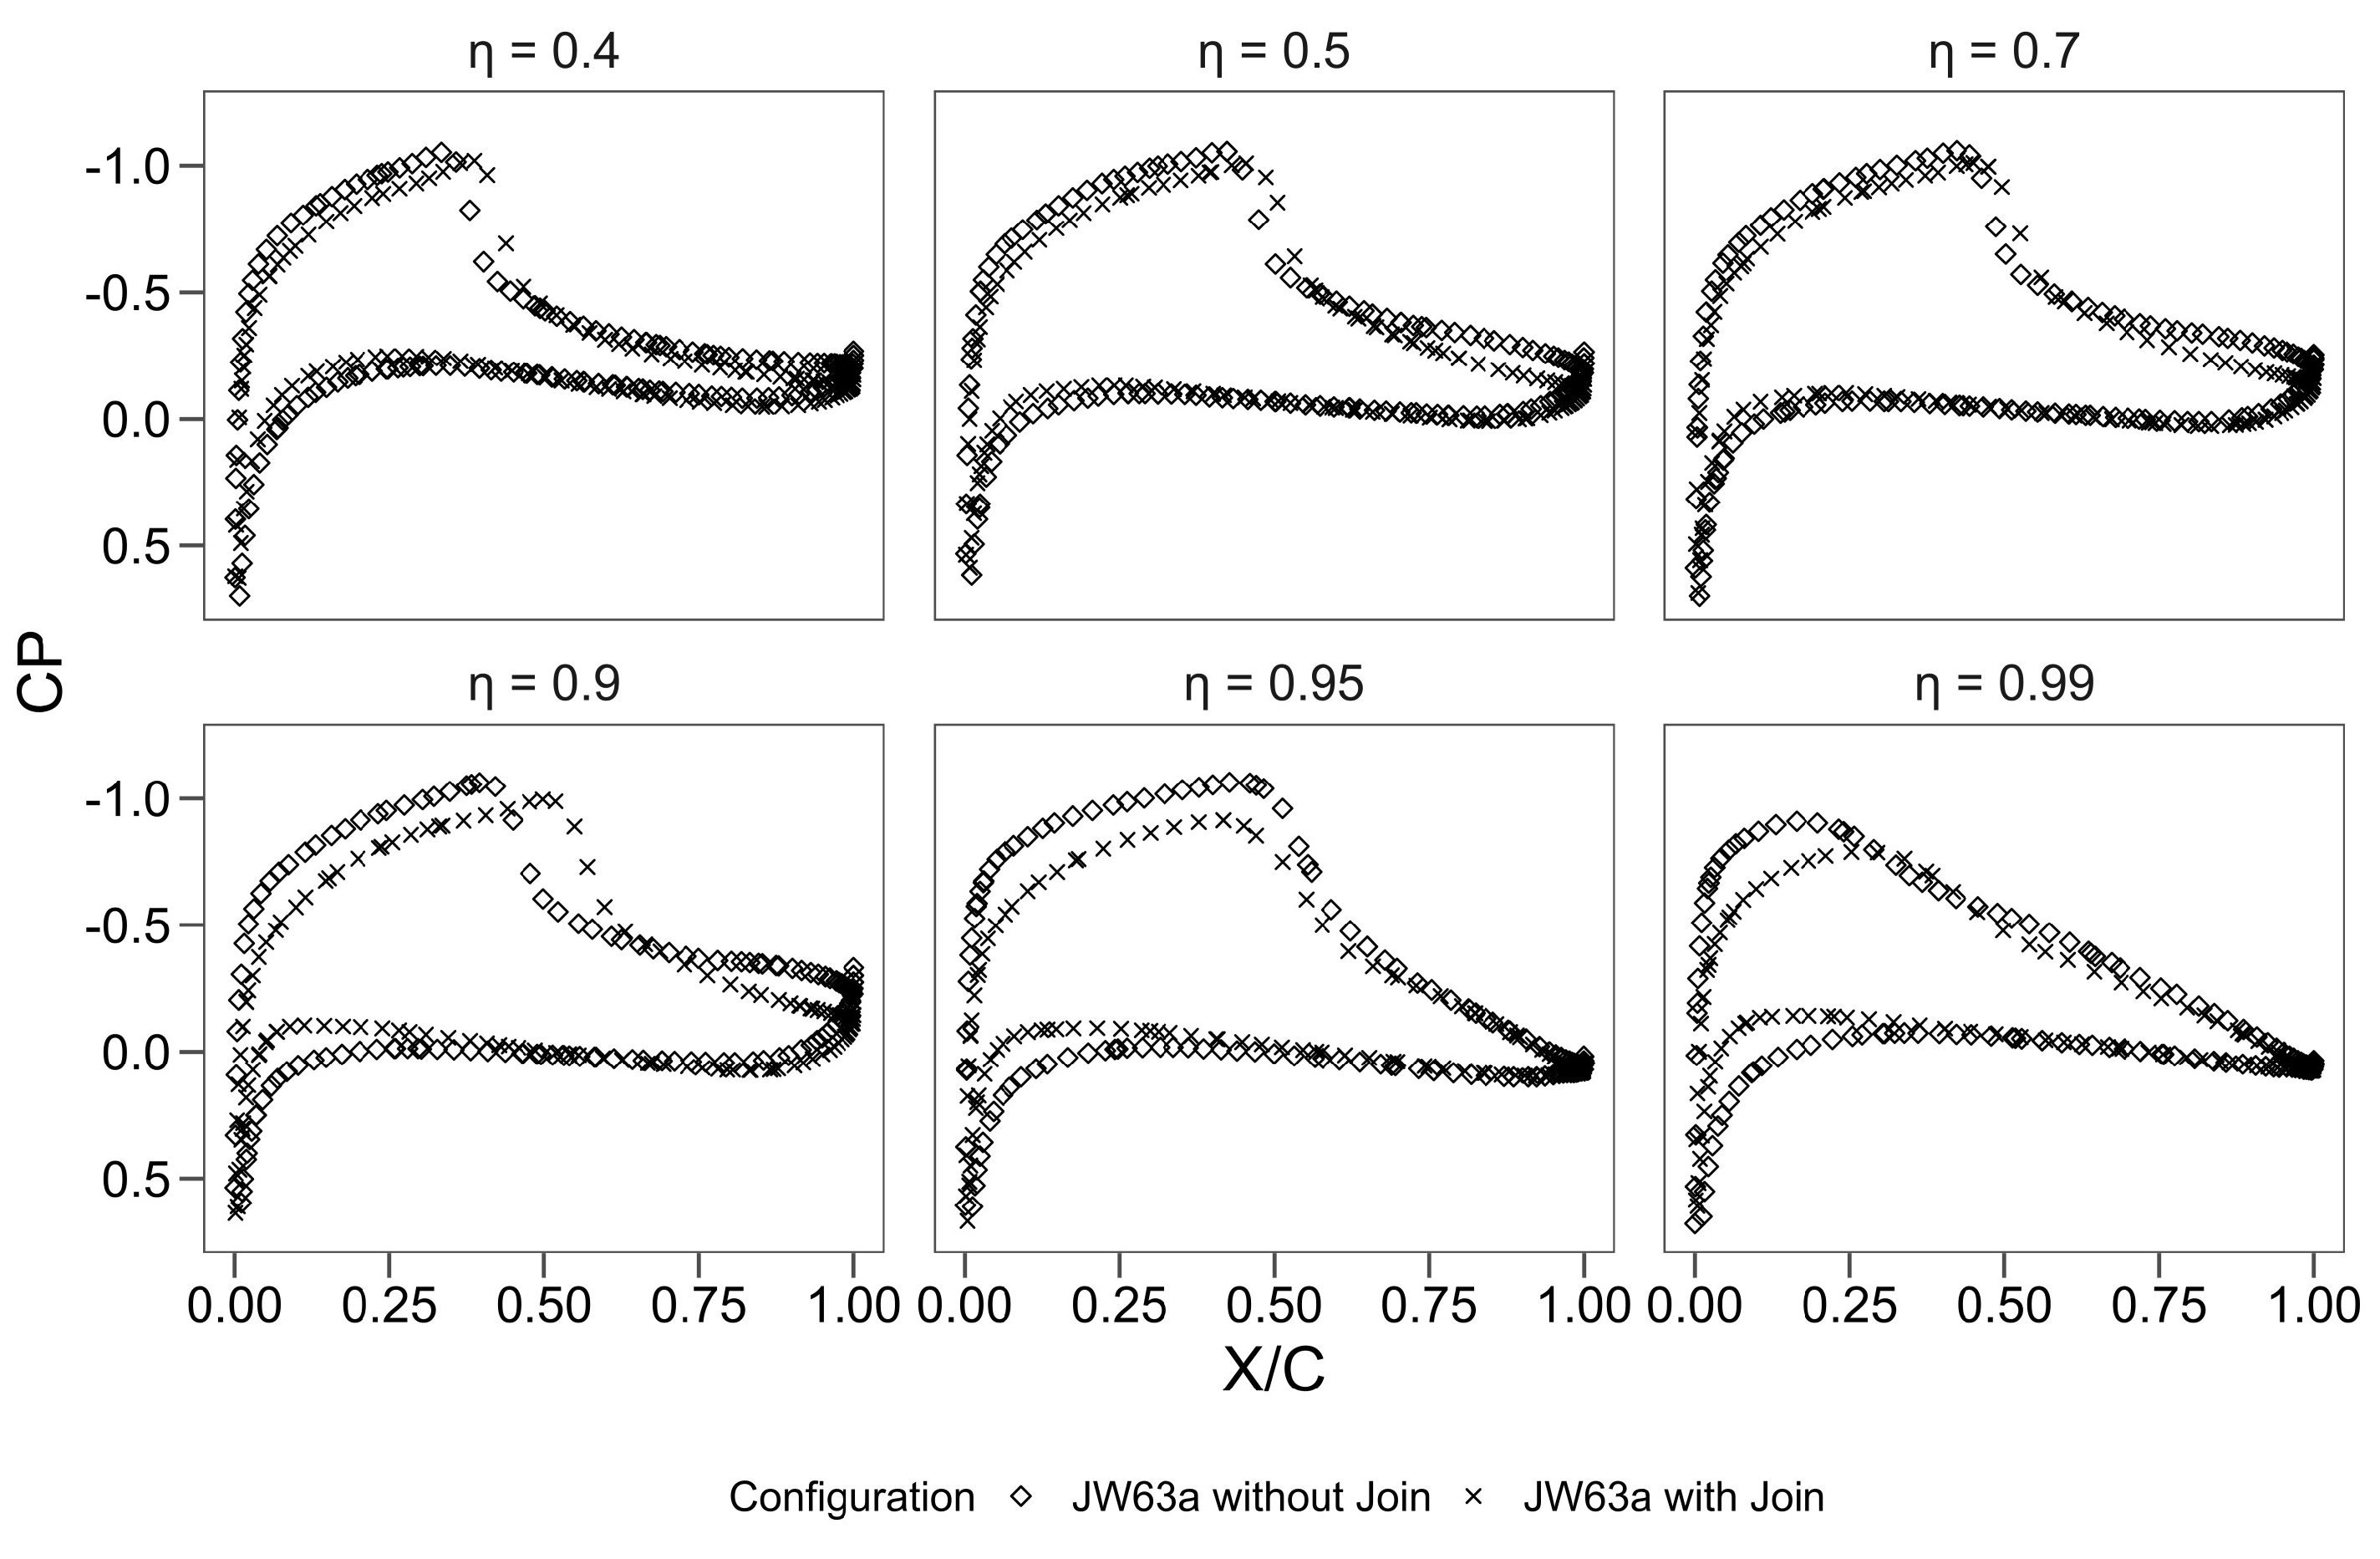
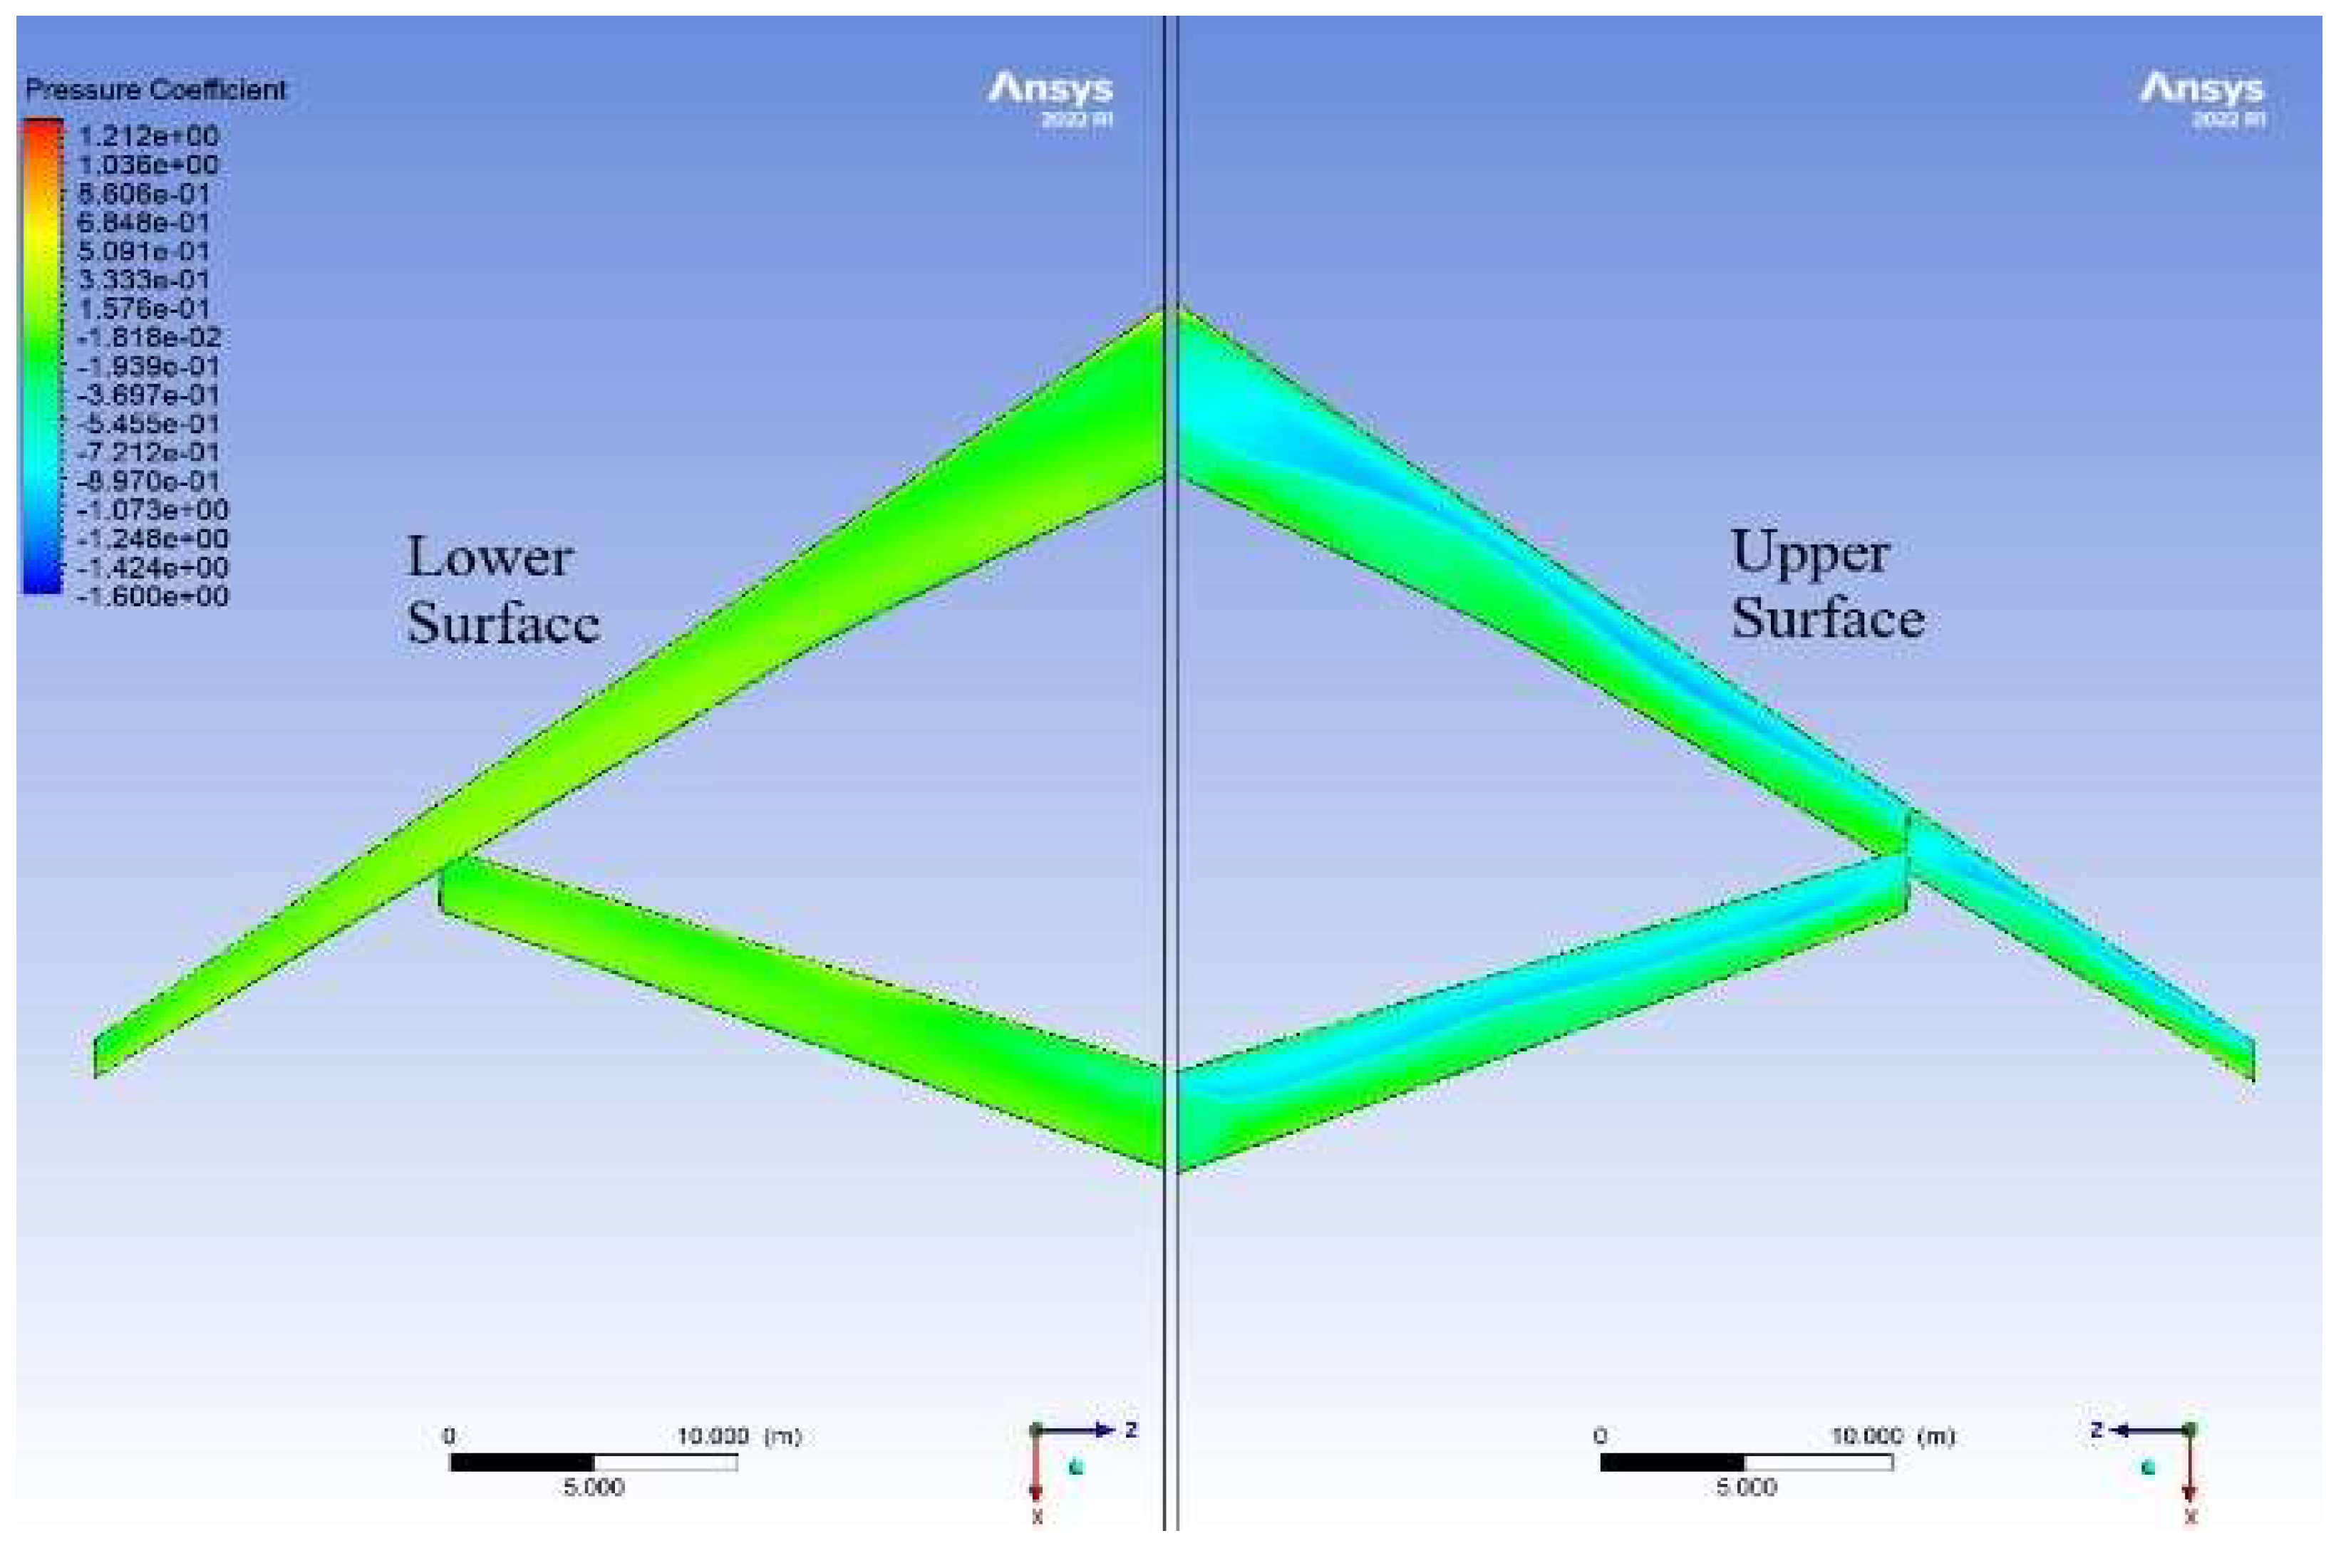
Figure 15 shows comparisons of the CP distribution along the span of the JW’s main wing with and without the joint, while Figure 16 compares the CP distributions along the span of the aft wing, with and without the joint at 2.5° AoA. The joint is located at η = 0.7 along the span, where η is the non-dimensional wingspan station and is an independent value for each of the lifting surfaces. The sudden jumps in pressure seen in the CP graphs along the span are indicative of aerofoil designs with a noticeable shock. The shock line along the span is also visualised in the CP contours of Figure 17 and Figure 18, respectively.
From Figure 15, the CP distributions for the front wing remain the same along the span for both wings for span locations up to η = 0.603. It is noticed that the shock location moves back and forth along the span, e.g., moving progressively backward (closer to the leading edge) as η increases up to η = 0.397. A slight difference starts to occur from η = 0.603; however, and at η = 0.727, the largest difference is seen between the two wings, with the shock location moving further towards the trailing edge (at about x/c = 0.625) for the wing with the joint. The shock location for the wing with the joint then moves back to a chord location of about x/c = 0.25, slightly behind that of the wing without the joint, at a span location of η = 0.846. After this point, the CP distribution between the two wings becomes almost the same again. It is clear from Figure 15 that the largest differences occur in the vicinity of the vertical joint, indicating the possible impact of the joint on the local flow characteristics. The Cp plot at η = 0.727 with the greatest difference due to the joint shows a delay in the shock formation along the chord, similar to that produced by a supercritical aerofoil, or that of a fuselage–wing junction [35].
From Figure 16, the Cp distributions are similar between the two wings, including a fairly constant shock location (at about x/c = 0.40) and a slightly lower local CP from the wing with the joint due to difference in CP near the trailing edge. Differences, however, start to occur closer to the wing tip from η = 0.9 onwards. At η = 0.9, the shock wave location for the wing with the joint is pushed backward to about x/c = 0.52, compared with x/c = 0.40 for the wing without the join. One also notices that the shock’s strength is weakened as it approaches the wing tip for both wings. Figure 16 shows that the greatest difference is seen towards the tip of the rear wing, whereby the Cp is clearly affected by the presence of the vertical fin, seemingly decreasing, and delaying the point of maximum suction at the tip. Similarly, the CP on the lower surface of the aft wing is impacted by the presence of the join as the locations near the tip region. The CP is generally lower on the lower surface between x/c = 0 and x/c = 0.25 for η = 0.9 onwards. Again, just like the case for the front wing, it is clear that the presence of the vertical joint seems to affect the local flow characteristics of the rear wing, particularly in its vicinity.
Figure 17 shows that while the upper surfaces of the front and rear wings have a clear shock wave line along most of the span, the lower surfaces do not seem to experience any visible shock structures, or at best very weak shocks. The joint only seems to affect the upper surfaces of the front and rear wings.
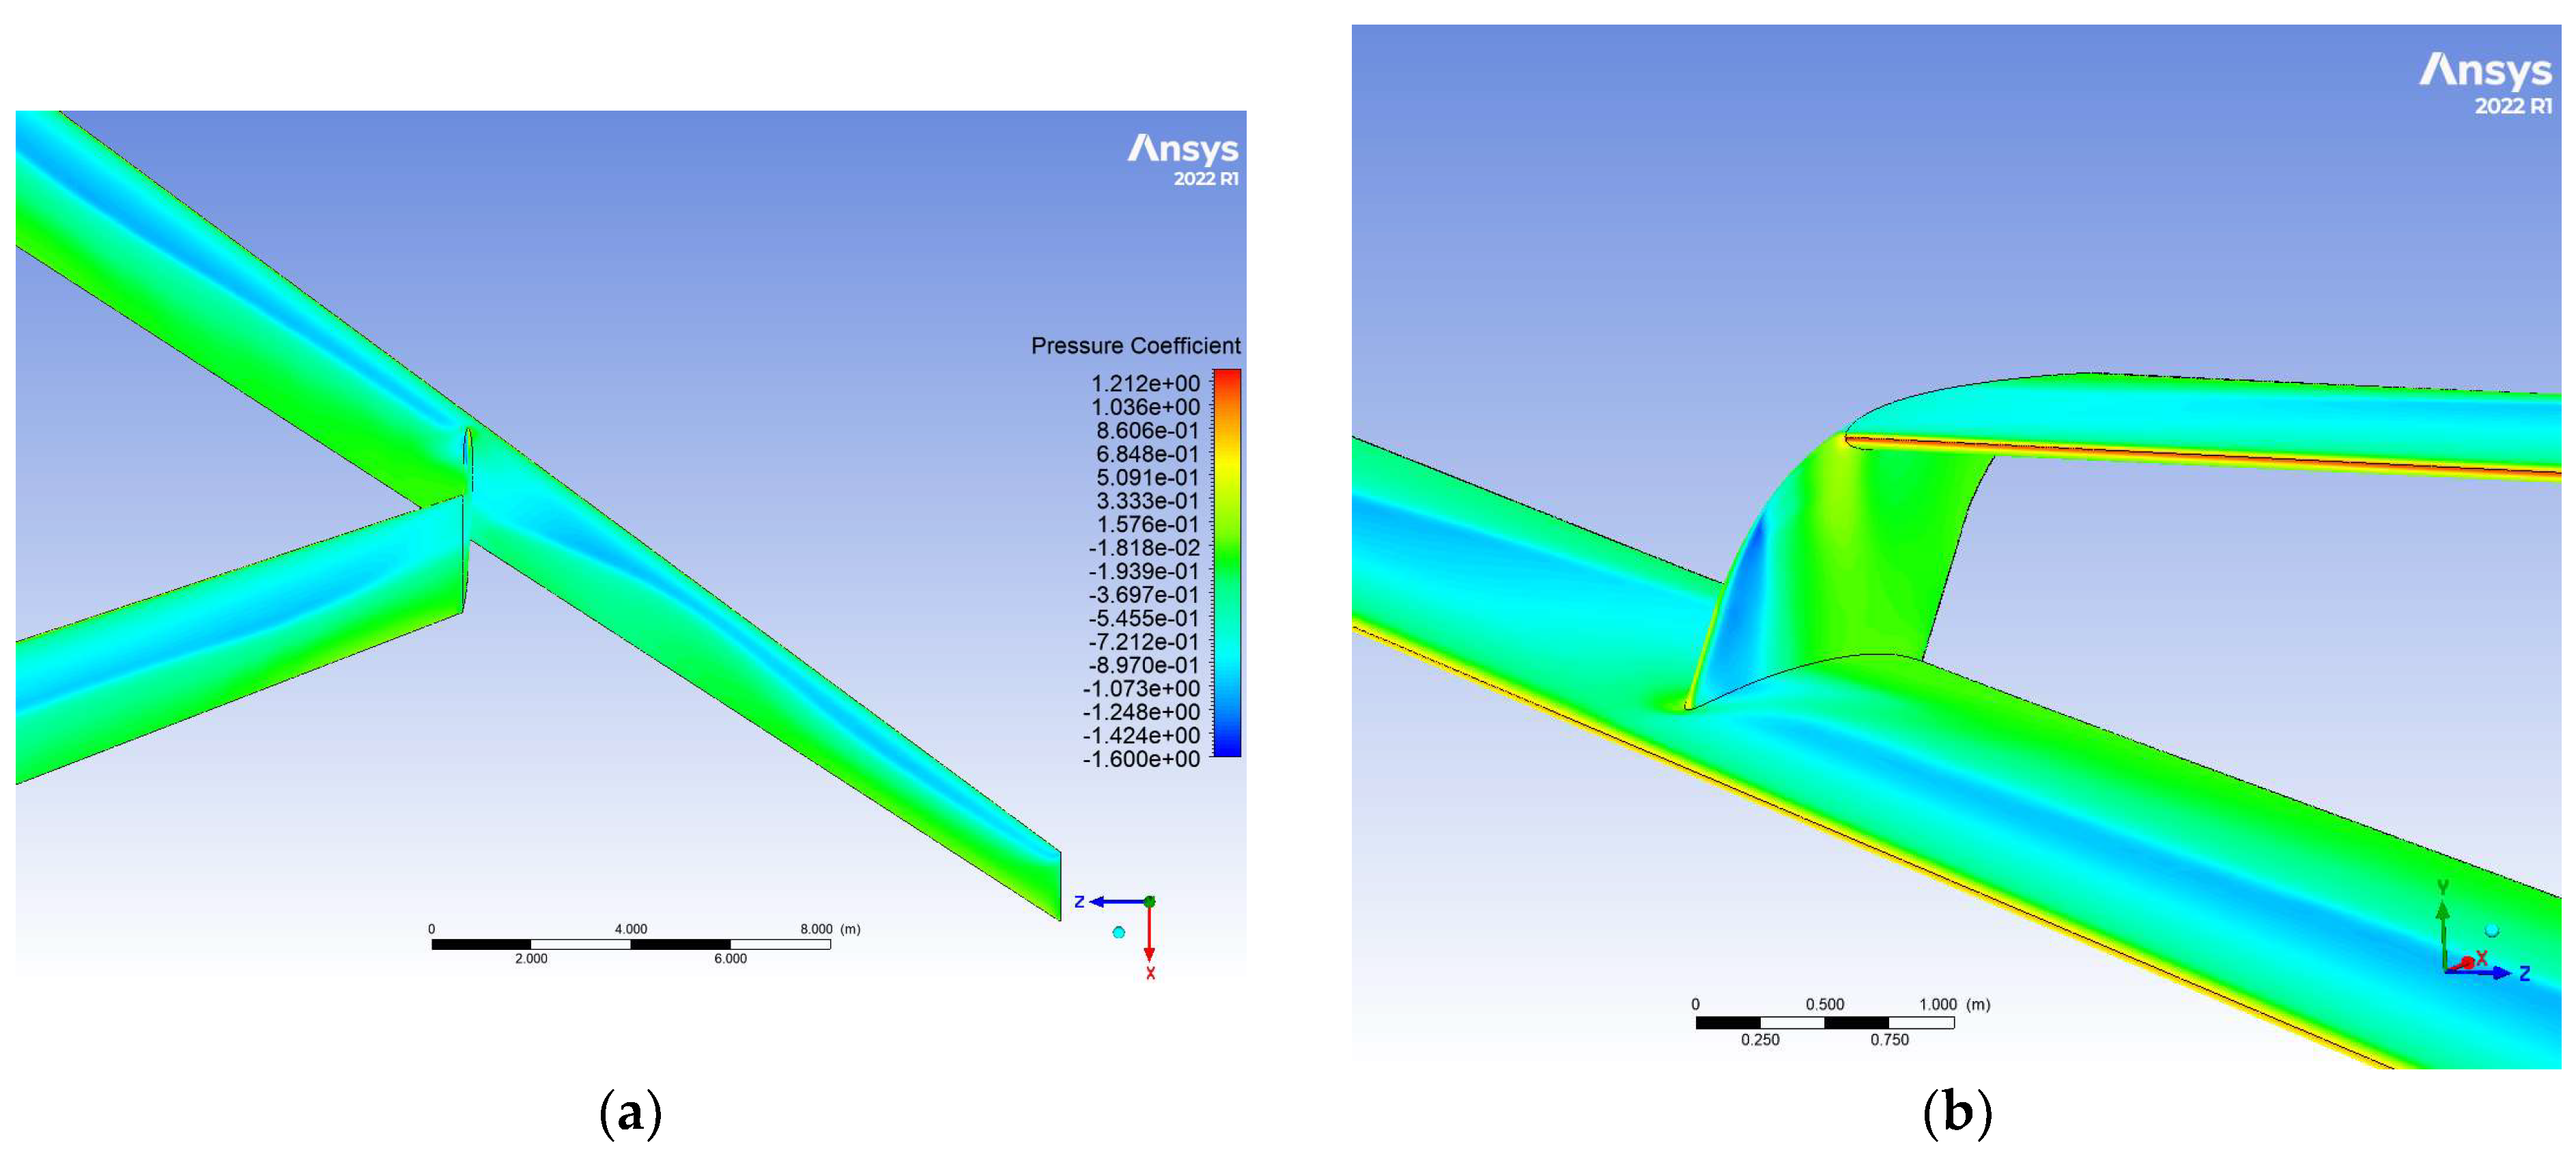
Figure 18 shows a close-up view of the Cp contours in the vicinity of the wing junction on the upper surface of the main wing.
From Figure 18 and the Cp plot comparison at η = 0.727 in Figure 15, we can see that the flow has greater attachment beyond the attachment point of the junction, as well as a reduction in the shock strength experienced at that point along the span, as evidenced by the delay in the increase in Cp along the chord. Furthermore, it shows an inboard shock propagating from the leading edge of the vertical fin. Note that this shock is only present on the inboard side of the vertical fin, leading to a suggestion that this may be due to outwash from the wing sweep, creating a compression point on the inboard side of the leading edge of the vertical fin and resulting in a shock wave on the vertical fin. It should also be noted that the shock formed on the vertical junction is stronger than the shock seen on the main or rear wing. This is similar to the effects seen on the inboard side of the vertical juncture of the box wing concept, as previously mentioned in the literature review [12].
Figure 19 shows a close-up view of wall shear vectors and streamlines near the joint, revealing patterns consistent with flow separation [36]. The wall shear vectors originating from this region of flow circulation (Figure 19a) exit the circulation zone and travel spanwise along the mid-chord of the main wing, along the line of shock seen previously in Figure 17. This is also seen similarly by the flow streamlines in Figure 19c, exiting the region of separation and flowing along the span of the main wing. This pattern is also evident in Figure 16 and Figure 17, where the CP contours on the outboard side of the wing junction resemble those seen towards the root of the main wing. This behaviour suggests that the presence of the vertical fin may be beneficial for local lift generation on the main wing regardless of the flow separation region, as it promotes reattachment of the airflow caused by the junction. Further support for this is provided in Figure 15 (η = 0.727), which shows a delay in shock formation just outboard of the vertical fin (where the initial shock occurs at x/c ~ 0.3 for the main wing as a single entity, as opposed to the addition of the joint where the shock forms at x/c ~ 0.6). The delayed shock and improved flow attachment likely contribute to enhanced aerodynamic performance in the region near the junction. A previous study on a PrandtlPlane transport aircraft [6] highlighted a similar effect at the wing–fuselage junction at transonic speeds, with the aerodynamic issues mitigated by adding a fillet around the junction. This approach could potentially benefit this isolated joint design as well as reduce the flow separation at the trailing edge while retaining the flow reattachment. Additionally, flow interference at the vertical tip joint of the PrandtlPlane shows a similarity to the effects observed on the inboard side of the vertical fin of the JW63a design.
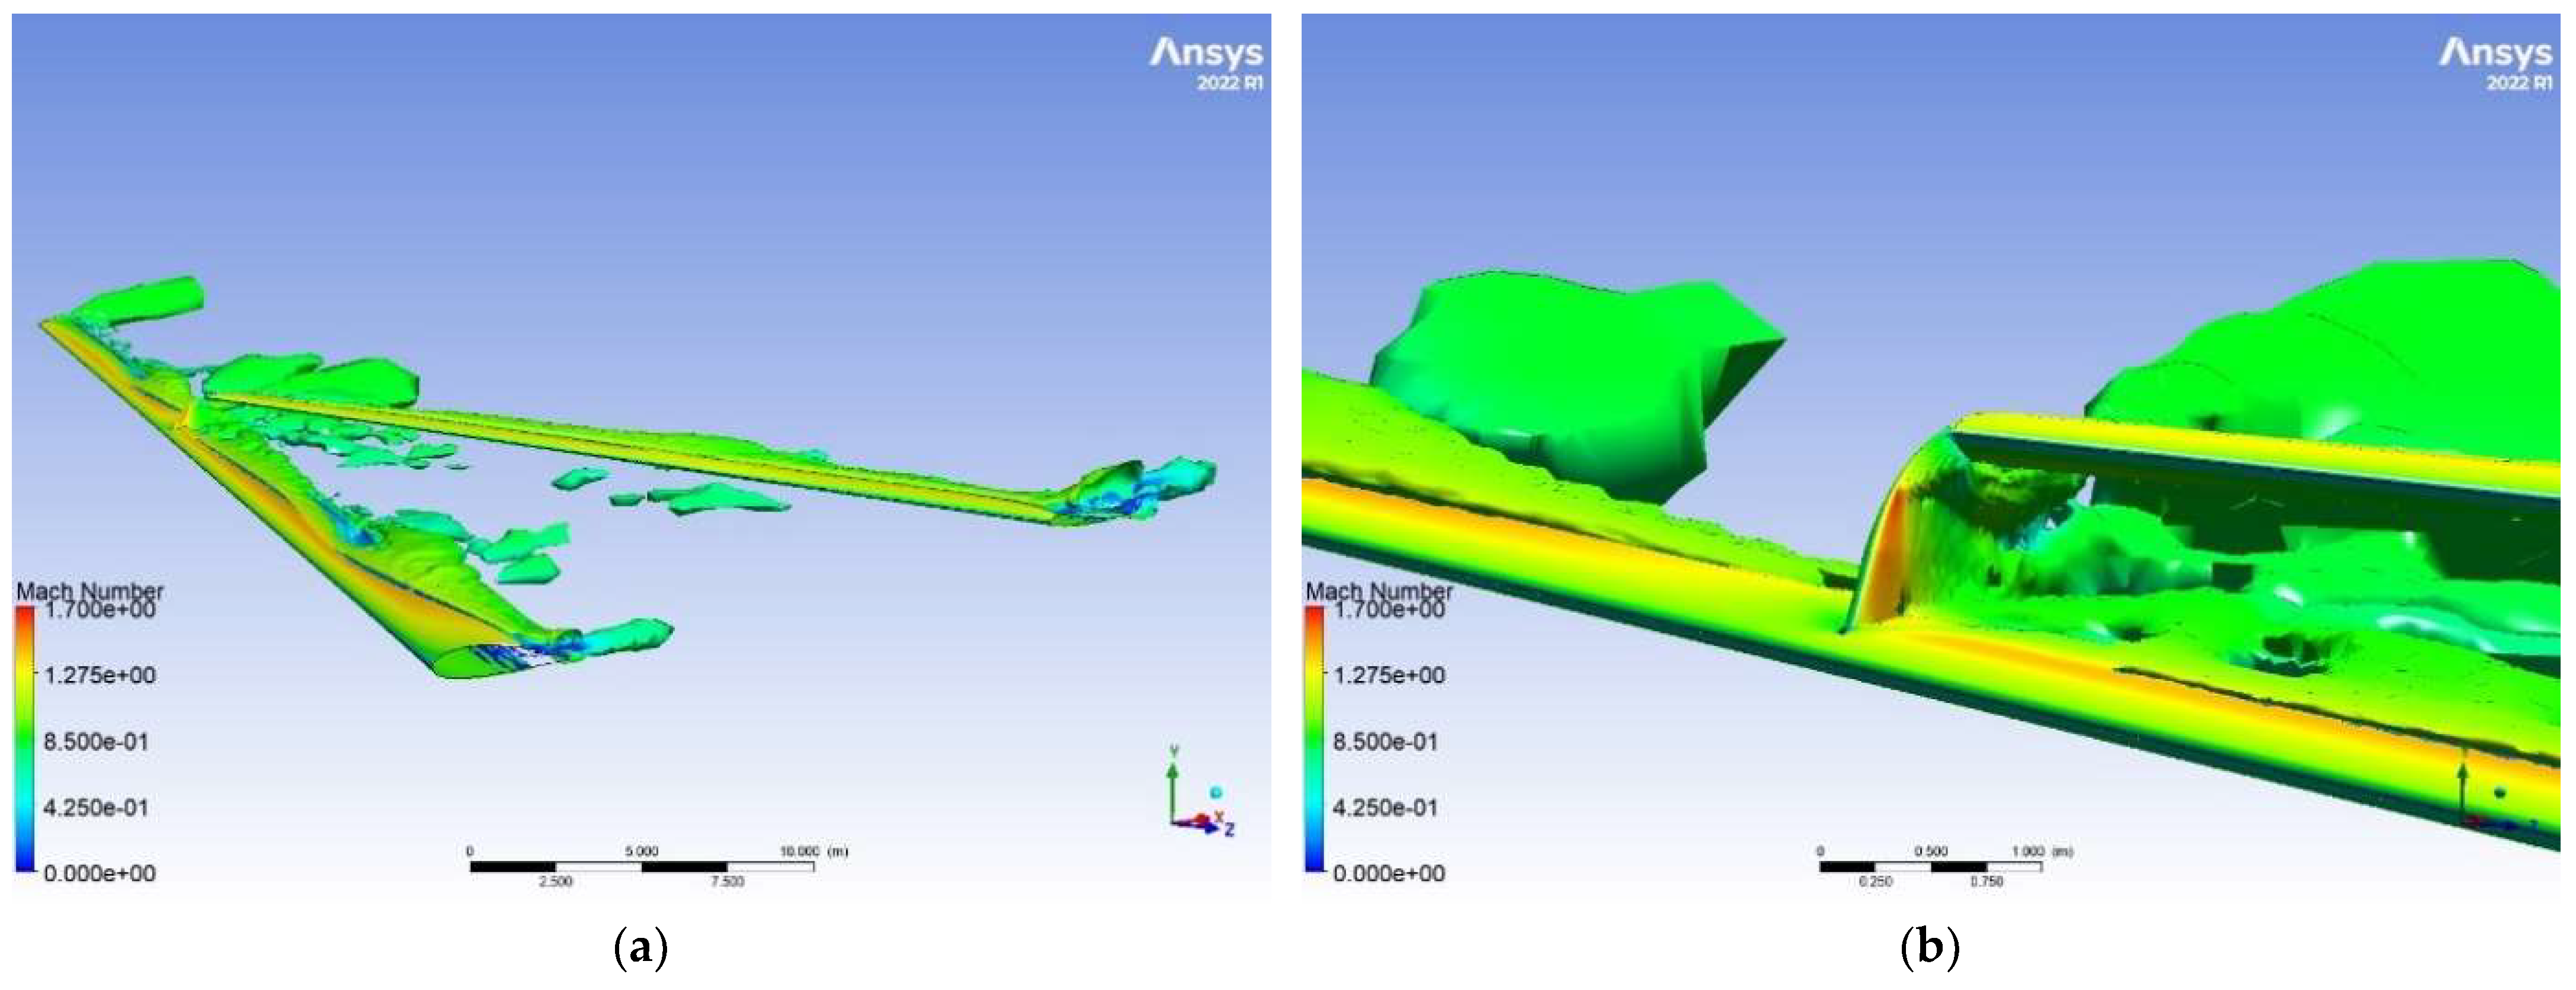
Figure 20 shows a vortex core region applied onto the JW63a configuration using Q-criterion. The iso-surface is then coloured by Mach number to highlight the Mach areas and the associated flow characteristics. As can be seen, the JW configuration produces a large vortex at the joint location. Further optimisation of the main wing would reduce this inboard vortex on the main wing and potentially isolate the instances of larger generated vortices at the main wing tip and vertical fin junction. It can also be noted that the main wing tip vortex is unaffected by the presence of the joint. This was concluded by comparing against the main wing simulated on its own. This is also reflected in the reduction in the differences in Cp between the two configurations at the wing tip, as previously seen in Figure 15 and Figure 16 (see, e.g., C P graphs for η = 0.95 and η = 0.99 ).
Further examination of the vortex core regions (Figure 20b) shows that the trailing edge flow interaction between the vertical fin and the main wing is a significant cause of wake vortices. This may be influenced by the sharp junction at the trailing edges and may benefit from a filleted junction, or from careful redesigning of the vertical fin. Given the observed strong shock forming on the vertical joint, it is possible that such a strong shock would cause the boundary layer to separate and therefore increase pressure drag. A different design of this joint may mitigate this effect or even nullify any drag penalty incurred by the vertical fin due to the leading edge shock. The stronger shock produced by the junction means that there is a significant acceleration of flow over the leading edge of the vertical fin, potentially due to the transonic flow conditions close to Mach 1, the incidence of the shock wave on the main wing, and the transversal flow from the main wing. This initial design may therefore require further investigation to determine the nature of this flow acceleration and if there are any mitigating factors that can be implemented for it, as shown next.

3.2. Vertical Fin Optimisation—Variant 2 (v2)

Once the simulations were completed for the initial JW63a variant, a singular shock on the inboard side of the vertical fin was observed, as previously discussed. Upon closer inspection of the flow streamlines above the joint location on the individual wing, an angle change in the Z-direction of the flow of approximately 10 degrees was observed. This change in flow direction produced a local angle of attack vertically along the fin, thereby generating strong inboard shock. Therefore, the vertical fin was altered by applying a twist angle of 10 degrees to the joint (i.e., leading edge pointing towards the wing tip) to account for this local flow angle (Figure 21) and was analysed again for the JW63a planform for changes in overall L/D, including pressure distributions and the presence of the inboard shock.
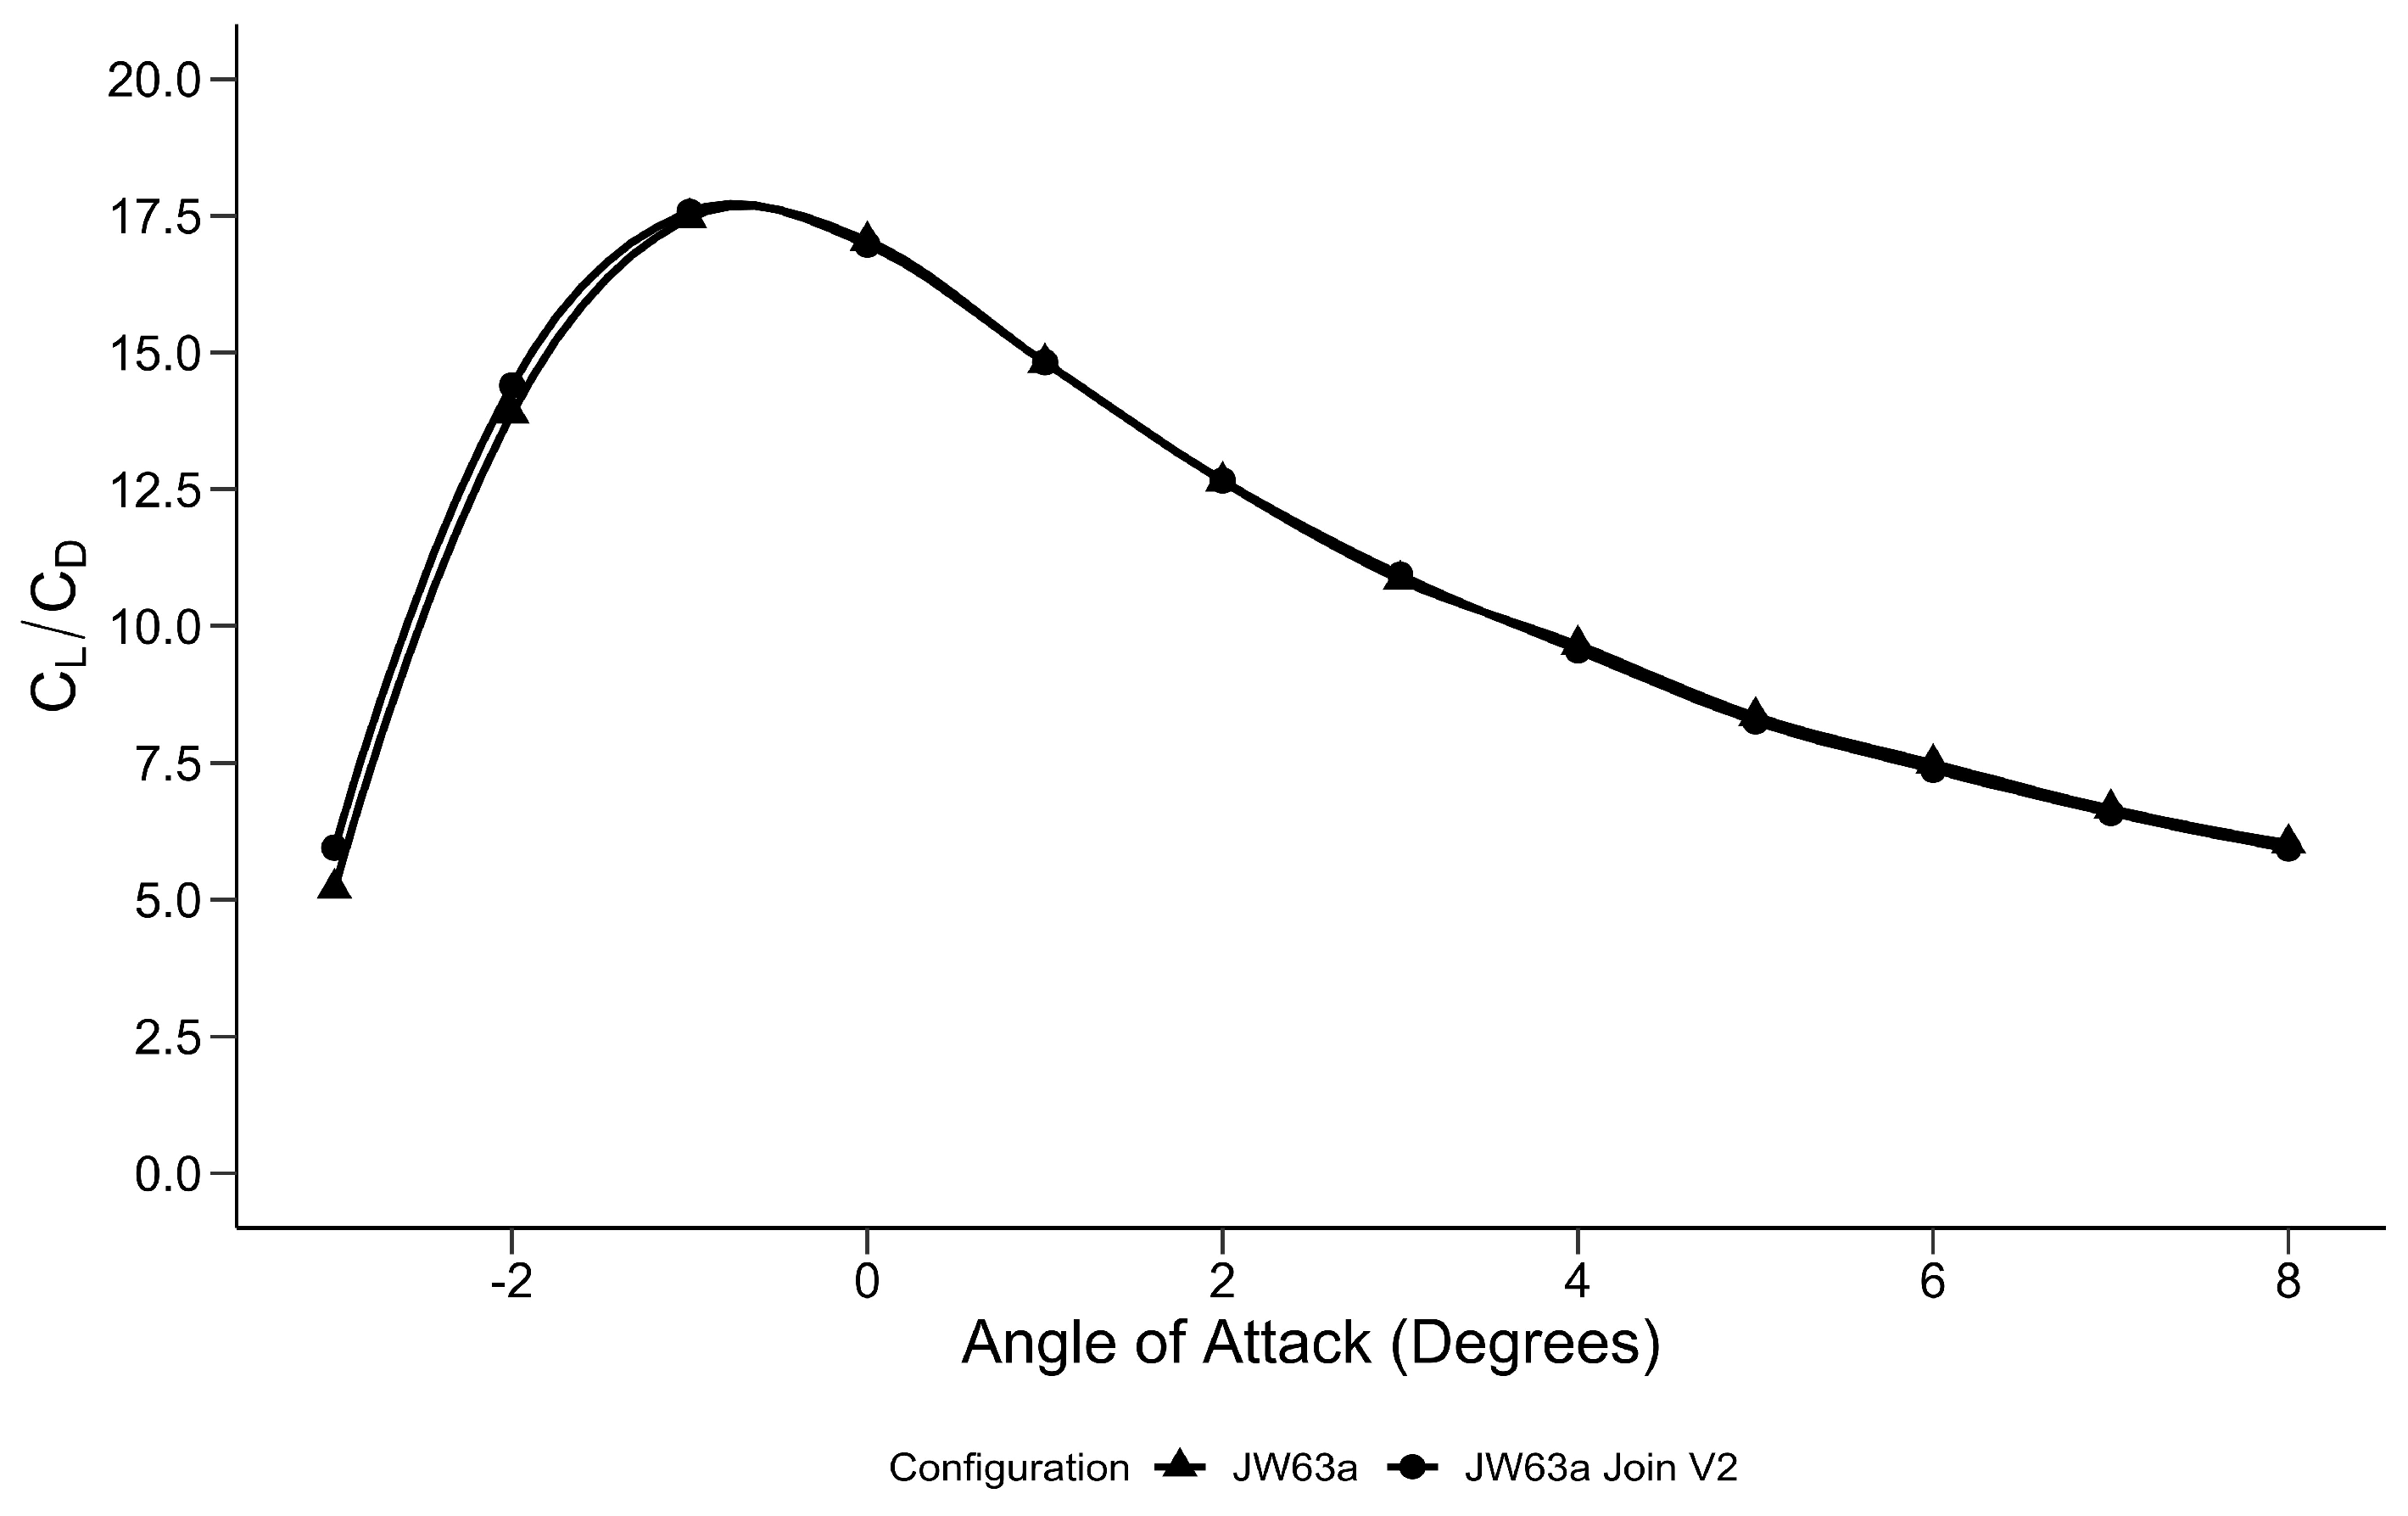
The lift and drag comparisons to the original JW63a configuration are combined and presented in Figure 22 as the lift-to-drag ratio against the AoA. As can be seen, the alteration in the joint does not produce any significant effect on the overall lift and drag of the JW configuration. As Figure 22 shows, however, this effect is more pronounced at lower angles of attack, resulting in a slightly larger L/D ratio for the new design of 13.28% at −3 degrees, quickly reducing to a small difference of 0.0421% at 1 degree. This is likely due to the reduction in the inboard shock seen on the initial design iteration due to the reduction in local geometry angle relative to the incoming flow in the freestream direction. This would reduce the shock wave drag generated from this component and reduce the size of the flow separation region that occurs. This may also reduce the flow separation effect previously noted in Figure 19. However, further analysis of this area for variant 2 is required to conclusively determine the cause.
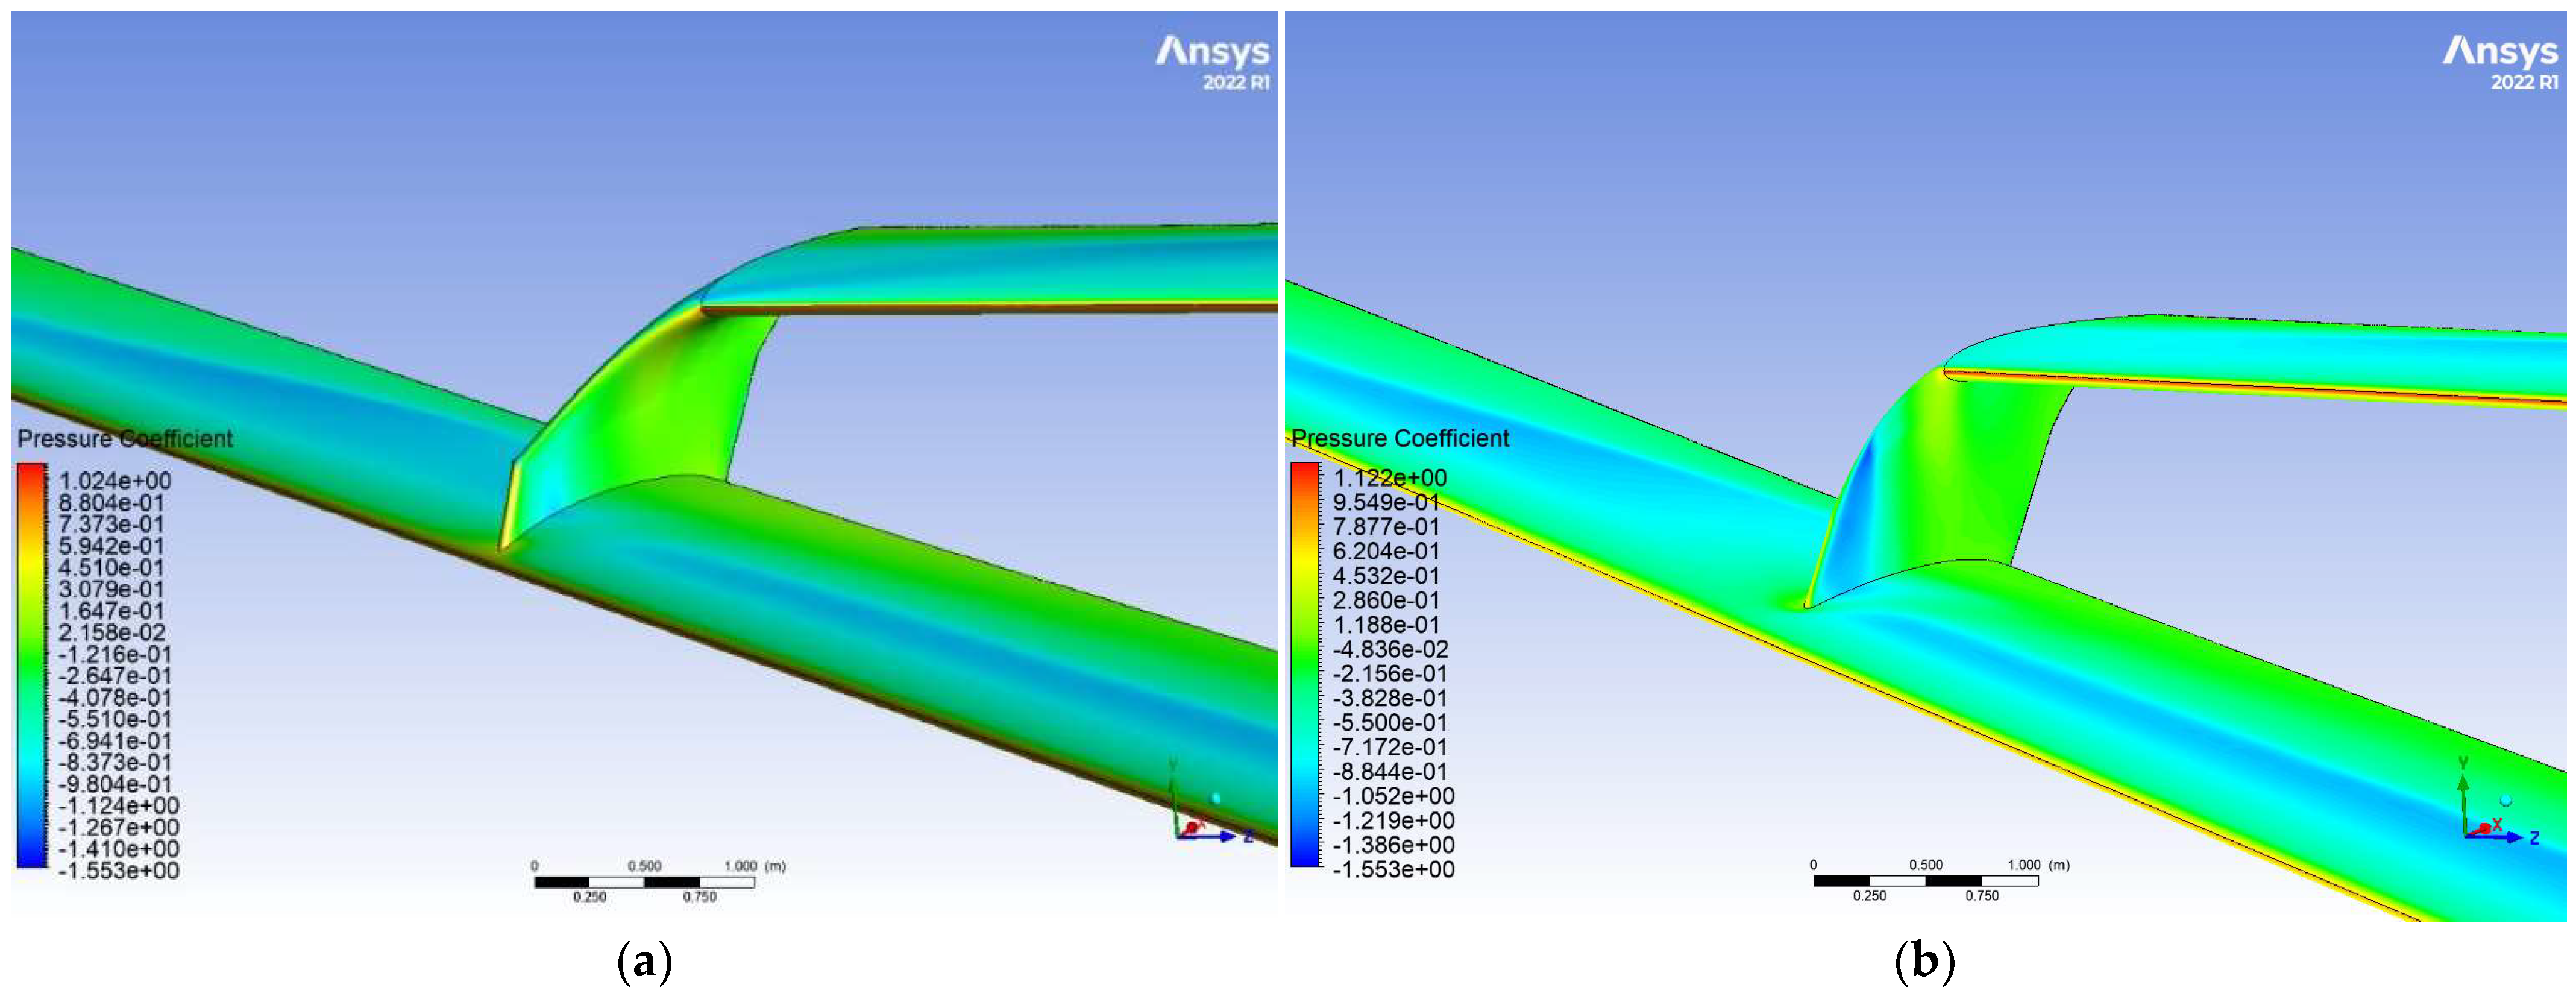
Figure 23 shows the pressure coefficient contours on variant 2 of the joint at 2.5° AoA. As can be seen, the shock significantly reduced on the inboard side of the vertical fin compared to variant 1 (Figure 23b), since the sharp gradient change in the contour along the leading edge of the vertical fin is no longer present in Figure 23a. The smoother transition of pressure along the leading edge of the vertical fin suggests a reduction in shock intensity. Additionally, the more uniform pressure distribution along the JW connection likely contributes to better overall flow attachment and pressure recovery, supporting the improvement in L/D observed in the second design iteration.
Figure 24 shows the resulting pressure coefficient plots along the JW’s main wingspan at 2.5 degrees, considering the two vertical fin joint designs. As can be seen, the pressure coefficients for both variants remain largely identical along the span of the main wing, with the only discrepancy appearing at η = 0.727, whereby the variant 2 joint suction along the centre of the chord appears to be stronger and at a flatter gradient than the variant 1 joint counterpart. Comparing the L/D plot in Figure 22, at lower angles, the variant 2 joint shows a slight improvement in L/D ratio compared to the variant 1 design. While this also exists at lower angles of attack, where the CP comparison is performed at 2.5 degrees, this increase in L/D may be attributed to the increase in suction (i.e., higher lift) seen immediately outboard of the variant 2 design. Combined with a potential overall shock drag decrease from the reduction in the shock strength initially noticed on the inboard side of the vertical joint, this suggests that variant 2 may experience more favourable aerodynamic characteristics under these conditions. The stronger suction effect in the outboard region (η = 0.727) likely contributes to better pressure recovery, reducing form drag and possibly delaying flow separation. It should be noted, however, that the effect of reducing the strong shock does not appear to be as present in the CP plots at η < 0.603, and this may be due to the measured sections being far away enough from the affected region that it is negligible. As a result, variant 2 shows slight aerodynamic benefits, particularly at low angles of attack.

4. Conclusions

This study presented a conceptual design together with a numerical investigation of a JW design derived from the NASA CRM configuration, with an emphasis on its aerodynamic performance at transonic speeds (M = 0.85). The JW configuration, featuring a vertical fin joint between the main and rear wings, was developed through a parametric study using the low-fidelity panel code VLMD. Within this initial framework, the baseline CRM and the developed JW configuration had the same design, C L of 0.5, and the same total surface area. The final design was then analysed using high-fidelity pseudo-transient CFD simulations (via Ansys Fluent) to validate the numerical approach and to analyse the flow and shock characteristics associated with the JW design.
Following validation of the numerical approach, the analysis revealed that the JW configuration achieved a maximum lift-to-drag ratio (L/D) of 17.45 at an angle of attack of −1 degree. In comparison, the CRM wing–tail configuration demonstrated a higher maximum L/D of 19.64 at 2 degrees AoA. This indicates that while the CRM configuration offers superior aerodynamic efficiency at its optimal angle of attack, the JW design also performs competitively, particularly at lower angles of attack (−1 ° to 1 ° ) where its unique aerodynamic characteristics are more pronounced.
One of the significant findings was the reduction in induced drag for the JW configuration compared to the CRM baseline design. The lower induced drag suggests that the JW design indeed has the potential to improve overall aerodynamic efficiency, especially in cruise conditions where drag reduction is critical. However, this advantage is offset by the flow complications introduced by the vertical fin, particularly flow separation and the strong shock observed on its inboard side. The shock itself may have contributed to boundary layer separation and increased vortex strength, which would negatively impact not only the overall aerodynamic efficiency but also the stability and control of the aircraft. Adjusting the incidence angle of the vertical fin by 10 degrees (variant 2) was found to reduce the shock strength but also resulted in an increase in both the lift and drag of the isolated component, highlighting the need for a careful trade-off in design optimisation.
The study also identified significant flow separation on the outboard trailing edge of the vertical fin, akin to that seen in fuselage–wing junctions. This flow separation could be mitigated through design modifications such as refining the trailing edge or incorporating flow control surfaces, which may help reduce aerodynamic losses in this region.
While the JW design showed promising aerodynamic characteristics, particularly in terms of reduced induced drag and competitive L/D ratios at a low AoA, further optimisation is necessary to fully realise its potential. Future research should focus on enhancing the JW configuration by reducing shock drag and flow separation on the main wing, possibly through the application of supercritical aerofoils. Additionally, investigating the off-design performance at lower Mach numbers, representative of commercial flight speeds, could provide valuable insights into the robustness of the JW design across various speed regimes and thus improve the applicability of the concept to a wider range of aircraft.
The impact of integrating a fuselage into the JW configuration also requires further exploration. Given that the fuselage has been shown to reduce overall L/D performance in the CRM configuration, it is essential to assess whether the JW design can maintain its aerodynamic advantages when combined with a fuselage. This integration will also bring stability characteristics into sharper focus, necessitating detailed studies to ensure that the JW configuration is not only efficient but also stable and controllable under practical operational conditions.
In conclusion, while the JW configuration presents a viable alternative to conventional aircraft designs, offering reduced induced drag and competitive L/D performance, it also introduces unique aerodynamic challenges. Addressing these challenges through further research and design refinement is crucial to unlocking the full potential of the JW design for commercial aircraft applications. The insights gained from this study contribute to understanding the behaviour of JW configurations at transonic speeds, providing a solid foundation for future advancements of this innovative aerodynamic concept.

Author Contributions

Conceptualization, P.H., Y.Y. and A.B.; methodology, P.H.; software, P.H.; validation, P.H.; formal analysis P.H.; investigation, P.H.; resources, Y.Y. and A.B.; data curation, P.H.; writing—original draft preparation, P.H.; writing—review and editing, Y.Y. and A.B.; visualisation, P.H.; supervision, Y.Y. and A.B.; project administration, Y.Y. and A.B.; funding acquisition, Y.Y. All authors have read and agreed to the published version of the manuscript.

Funding

This research received no external funding.

Data Availability Statement

The data presented in this study are available on request from the corresponding author.

Acknowledgments

The first author gratefully acknowledges the studentship funding received from the Engineering Modelling and Simulation Research Group, University of the West of England, Bristol, UK. The authors acknowledge the use of ChatGPT 4o (Open AI, https://chat.openai.com) for language improvement purposes only. The first author also acknowledges the 57th 3AF International Conference AERO2023 for the opportunity to present the initial work. The first author also acknowledges Raj Nangia for their invaluable contribution to the early stages of this work.

Conflicts of Interest

The authors declare no conflicts of interest; the funders had no role in the design of the study, in the collection, analyses, or interpretation of data, in the writing of the manuscript, or in the decision to publish the results.

References

  1. Kapania, R.K.; Schetz, J.A.; Durham, F.D.; Malik, W.; Segee, M.C.; Gupta, R. Multidisciplinary Design Optimization and Cruise Mach Number Study of Truss-Braced Wing Aircraft. 2018. Available online: https://www.researchgate.net/publication/330364934_Multidisciplinary_Design_Optimization_and_Cruise_Mach_Number_Study_of_Truss-Braced_Wing_Aircraft (accessed on 5 November 2024).
  2. Maldonado, D.; Hunter, C.; Housman, J.A.; Viken, S.A.; Piotrowski, M.G.H.; McMillin, S.N.; Kiris, C.C.; Milholen, W.E. Improvements in Simulating a Mach 0.80 Transonic Truss-Braced Wing Configuration using the Spalart-Allmaras and k-ω SST Turbulence Models. In Proceedings of the AIAA Scitech 2021 Forum, Virtual, 11–15 & 19–21 January 2021; pp. 1–31. [Google Scholar] [CrossRef]
  3. Harrison, N.A.; Beyar, M.D.; Dickey, E.D.; Hoffman, K.; Gatlin, G.M.; Viken, S.A. Development of an efficient mach=0.80 transonic truss-braced wing aircraft. In Proceedings of the AIAA Scitech 2020 Forum, Orlando, FL, USA, 6–10 January 2020; pp. 1–14. [Google Scholar] [CrossRef]
  4. Weil Brenner, M.; Trepanier, J.; Tribes, C.; Petro, E. Conceptual Design Framework for Blended Wing Body Aircraft. In Proceedings of the 12th AIAA Aviation Technology, Integration, and Operations (ATIO) Conference and 14th AIAA/ISSMO Multidisciplinary Analysis and Optimization Conference, Indianapolis, Indiana, 17–19 September 2012. [Google Scholar] [CrossRef]
  5. Trac-pho, J. Conceptual Design of a Blended Wing Body Airliner; San José State University: San Jose, CA, USA, 2022. [Google Scholar]
  6. Cipolla, V.; Frediani, A.; Abu Salem, K.; Binante, V.; Rizzo, E.; Maganzi, M. Preliminary transonic CFD analyses of a PrandtlPlane transport aircraft. Transp. Res. Procedia 2018, 29, 82–91. [Google Scholar] [CrossRef]
  7. Prandtl, L. Induced Drag of Multiplanes. In Technische Berichte; 1924; Volume III, no. 7. Available online: https://ntrs.nasa.gov/citations/19930080964 (accessed on 5 November 2024).
  8. Munk, M. The Minimum Induced Drag of Aerofoils; TR121; 1923. Available online: https://ntrs.nasa.gov/citations/19930091456 (accessed on 5 November 2024).
  9. Wolkovitch, J. The joined wing—An overview. J. Aircr. 1986, 23, 161–178. [Google Scholar] [CrossRef]
  10. Jemitola, P.O.; Fielding, J.P. Box wing aircraft conceptual design. In Proceedings of the 28th Congress International Council of the Aeronautical Sciences 2012, ICAS 2012, Brisbane, Australia, 23–28 September 2012; Volume 1, pp. 570–579. [Google Scholar]
  11. Djojodihardjo, H.; Foong, K.E. Conceptual Design and Aerodynamic Study of Joined-Wing Business Jet Aircraft. 2014. Available online: https://www.researchgate.net/publication/254862073_Conceptual_Design_and_Aerodynamic_Study_of_Joined-Wing_Business_Jet_Aircraft (accessed on 5 November 2024).
  12. Sahana, D.S.; Aabid, A. CFD Analysis of Box Wing Configuration. Int. J. Sci. Res. 2016, 5, 706–709. [Google Scholar] [CrossRef]
  13. Smith, S.C.; Stonum, R.K. Experimental Aerodynamic Characteristics of a Joined-Wing Research Aircraft Configuration. Nasa Technol. Memo. 1989. Available online: https://ntrs.nasa.gov/api/citations/19890014914/downloads/19890014914.pdf (accessed on 5 November 2024).
  14. Sivaji, R. Aerodynamic Analysis of the Joined-Wing Configuration of a High-Altitude, Long Endurance (HALE) Aircraft; University of Cincinnati: Cincinnati, OH, USA, 2004. [Google Scholar]
  15. Jemitola, P.; Okonkwo, P. Review of Structural Issues in the Design of a Box Wing Aircraft. J. Aerosp. Eng. Mech. Open Access 2019, 3, 161–166. [Google Scholar]
  16. Galinski, C.; Dziubinski, A.; Surmacz, K.A.; Dziubiński, A.; Kuprianowicz, S.; Surmacz, K.A.; Galiński, C.; Zółtak, J. The joined wing scaled demonstrator results of CFD. In Proceedings of the 29th Congress Internation Council of the Aeronautical Science ICAS 2014, St. Petersburg, Russia, 7–12 September 2014. [Google Scholar]
  17. Jemitola, P.O. Conceptual Design and Optimization Methodology for Box Wing Aircraft; 2012. Available online: https://dspace.lib.cranfield.ac.uk/items/9e23ac4d-1212-4cd2-9305-97f9e34a4d0f (accessed on 5 November 2024).
  18. Cavallaro, R.; Demasi, L. Challenges, Ideas, and Innovations of Joined-Wing Configurations: A Concept from the Past, an Opportunity for the Future. Prog. Aerosp. Sci. 2016, 87, 1–93. [Google Scholar] [CrossRef]
  19. Nangia, R.K.; Palmer, M.E.; Point, T.W.; Hyde, L.; Cooper, P.J.E. Aerodynamic—Efficient Configurations & Structural Design Challenges Arising—Joined Wings & Oblique Wings. In Proceedings of the RAeS/CEAS European Air & Space Conference, Manchester, UK, 26–29 October 2009; pp. 26–29. [Google Scholar]
  20. Kaparos, P.; Papadopoulos, C.; Yakinthos, K. Conceptual design methodology of a box wing aircraft: A novel commercial airliner. Proc. Inst. Mech. Eng. Part G J. Aerosp. Eng. 2018, 232, 2651–2662. [Google Scholar] [CrossRef]
  21. Khalid, A.; Kumar, P. Aerodynamic Optimization of Box Wing—A Case Study. Int. J. Aviat. Aeronaut. Aerosp. 2014, 1. [Google Scholar] [CrossRef]
  22. Khan, F. Preliminary Aerodynamic Investigation of Box-Wing Configurations Using Low Fidelity Codes. Master’s Thesis, Luleå University of Technology, Luleå, Sweden, 2010; pp. 313–327. [Google Scholar]
  23. Vassberg, J.; Dehaan, M.; Rivers, M.; Wahls, R. Development of a Common Research Model for Applied CFD Validation Studies. In Proceedings of the 26th AIAA Applied Aerodynamics Conference, Honolulu, HI, USA, 18–21 August 2008; p. 6919. [Google Scholar] [CrossRef]
  24. Rivers, M.B.; Dittberner, A. Experimental Investigations of the NASA Common Research Model. J. Aircr. 2014, 51, 1183–1193. [Google Scholar] [CrossRef]
  25. Lamar, E. A Vortex-Lattice for of the Mean Method Shapes Drag Trimmed Minimum Vortex with Minimum Vortex Drag; Hampton: Memphis, TN, USA, 1976. [Google Scholar]
  26. Rivers, M.; Hunter, C. Support System Effects on the NASA Common Research Model. In Proceedings of the 50th AIAA Aerospace Sciences Meeting including the New Horizons Forum and Aerospace Exposition, Nashville, Tennessee, 9–12 January 2012. [Google Scholar] [CrossRef]
  27. Hanman, P.; Yao, Y.; Bouferrouk, A. Aerodynamics of a CRM Joined-Wing Configuration at Transonic Speeds. In Proceedings of the 57th 3AF International Conference on Applied Aerodynamics, Bordeaux, France, 29–31 March 2023. [Google Scholar]
  28. Scalabrin, L.C.; de Souza, R.F. Grid assessment using the NASA common research model (CRM) wind tunnel data. In Proceedings of the 51st AIAA Aerospace Sciences Meeting including the New Horizons Forum and Aerospace Exposition, Grapevine, TX, USA, 7–10 January 2013; pp. 1–18. [Google Scholar] [CrossRef]
  29. Krishna, Z.; Gandhar, P.; Balasubramanyam; Varghese, A.; ANSYS Inc.; Zore, K.; Sasanapuri, B.; Parkhi, G.; Varghese, A. Ansys mosaic poly-hexcore mesh for high-lift aircraft configuration. In Proceedings of the 21st AeSI Annual CFD Symposium, Bangalore, India, 8–9 August 2019; pp. 1–11. [Google Scholar]
  30. ANSYS Inc. Ansys Fluent User’s Guide, 2022R1; ANSYS Inc.: Canonsburg, PA, USA, 2022. [Google Scholar]
  31. Ansys Inc. ANSYS Fluent Tutorial Guide; ANSYS Inc.: Canonsburg, PA, USA, 2021. [Google Scholar]
  32. ANSYS FLUENT 13 User’s Guide Ansys Fluent Theory Guide; ANSYS Inc.: Canonsburg, PA, USA, 2013; Volume 15317, pp. 724–746.
  33. Morrison, J.H. 4th AIAA CFD Drag Prediction Workshop. 2009. Available online: https://aiaa-dpw.larc.nasa.gov/Workshop4/ (accessed on 5 November 2024).
  34. Raymer, D. Aircraft Design: A Conceptual Approach, 2nd ed.; American Institute of Aeronautics and Astronautics: Reston, VA, USA, 1992; ISBN 0930403517. [Google Scholar]
  35. Hue, D.; Chanzy, Q.; Landier, S. DPW-6: Drag Analyses and Increments Using Different Geometries of the Common Research Model Airliner. J. Aircr. 2018, 55, 1509–1521. [Google Scholar] [CrossRef]
  36. Zilliac, G.; Pulliam, T.; Rivers, M.; Zerr, J.; Delgado, M.; Halcomb, N.; Lee, H. A Comparison of the Measured and Computed Skin Friction Distribution on the Common Research Model. In Proceedings of the 49th AIAA Aerospace Sciences Meeting including the New Horizons Forum and Aerospace Exposition, Orlando, FL, USA, 4–7 January 2011. [Google Scholar] [CrossRef]
Figure 1. A comparison between (a) the joined-wing concept [10] and (b) the box wing concept [10].
Fluids 10 00027 g001
Figure 2. CRM and JW planforms (not to scale): (a) CRM wing and tail (baseline), (b) JW front and rear wings, (c) close-up view of the vertical joint for JW design (the JW63a).
Fluids 10 00027 g002
Figure 3. Computational domain sketch.
Fluids 10 00027 g003
Figure 4. The computational mesh: (a) overall mesh distributions, (b) 2D close-up view of boundary layer mesh transition to inviscid mesh.
Fluids 10 00027 g004
Figure 5. CD plot of mesh independence study.
Fluids 10 00027 g005
Figure 6. CRM CL validation results for wing–body configuration ( R e = 5 × 10 6 ).
Fluids 10 00027 g006
Figure 7. CRM CD validation results for wing–body configuration R e = 5 × 10 6 .
Fluids 10 00027 g007
Figure 8. Simulated pressure coefficient distributions versus experimental data for wing–body CRM at different spanwise locations, at M = 0.85 and α = 2.5°.
Fluids 10 00027 g008
Figure 9. Numerical CP contours for CRM wing–body configuration (with fuselage excluded from the image) at M = 0.85 and α = 2.5°: current CFD (left), OVERFLOW CFD results (right) from [23].
Fluids 10 00027 g009
Figure 10. CL variations with AoA for JW63a and baseline CRM wing–tail configuration at M = 0.85.
Fluids 10 00027 g010
Figure 11. CD variations with AoA for JW63a and baseline CRM wing–tail configuration at M = 0.85.
Fluids 10 00027 g011
Figure 12. L/D variations with AoA for JW63a configuration and baseline CRM wing at M = 0.85. Two dashed lines show maximum L/D ratio for each configuration.
Fluids 10 00027 g012
Figure 13. Pressure drag coefficient comparison between CRM and JW63a.
Fluids 10 00027 g013
Figure 14. CDi comparison between the CRM wing–tail configuration and JW63a at M = 0.85.
Fluids 10 00027 g014
Figure 15. Cp distributions at multiple span locations along the JW main wing with and without the joint.
Fluids 10 00027 g015
Figure 16. Cp distributions at multiple span locations of the JW aft wing with and without the joint.
Fluids 10 00027 g016
Figure 17. Cp contours on upper and lower surfaces of JW design.
Fluids 10 00027 g017
Figure 18. Cp contours on the JW design: (a) upper surfaces towards the outboard wing section, (b) in the vicinity of the vertical fin.
Fluids 10 00027 g018
Figure 19. (a) Wall shear surface streamlines, (b) close-up of wall shear on trailing edge of the joint, (c) flow streamlines around the joint, with a close-up of the trailing edge region inset.
Fluids 10 00027 g019aFluids 10 00027 g019b
Figure 20. Vortex core region at the vertical joint location with Mach number colouring for the JW63a configuration: (a) general view, (b) closeup view near the joint.
Fluids 10 00027 g020
Figure 21. Variant 2 of the vertical joint location, compared with variant 1: (a) initial joint shape (variant 1), (b) front view of new joint, (c) top view of new joint.
Fluids 10 00027 g021
Figure 22. Lift-to-drag ratio against angle of attack for vertical fin alteration.
Fluids 10 00027 g022
Figure 23. Pressure coefficient contour at AoA = 2.5 ° on (a) variant 2 joint, (b) variant 1 joint.
Fluids 10 00027 g023
Figure 24. CP plots along the main wing for the two JW designs variant 1 and variant 2 at AoA = 2.5 ° .
Fluids 10 00027 g024
Table 1. Parametric study variables for JW design.
VariableRange
Half Span (m)29.38–40
Root Chord (m)6–9
Join Location (η)0.4–0.9
Tail Height (Above Main Wing Root) (m)2.027–13.739
Table 2. JW and CRM geometry parameters.
JW63a Main WingJW63a Rear WingCRM Main WingCRM Horizontal Tail
Half Span (m)402829.3810.668
Root Chord (m)73.9413.493.94
Vert. Height of aft Root (m)N/A2.027N/A2.027
Dihedral (Degrees)74.92177.857
Taper Ratio0.20.60.20.6
Joint Location (% Span)0.7N/AN/AN/A
AR22.2117.7894.9
Sweep Angle (Degrees)35−183537
Table 3. Number of elements per mesh.
MeshNo. Elements (Million)
12.2
24
36
415
522
635
Table 4. Mesh settings for JW63a.
ParameterValue
Global Max Volume Size16.384 m
Body of Influence 1 Volume Size5 m
Body of Influence 2 Volume Size1 m
Body of Influence 3 Volume Size0.1 m
Wing Face Size0.1 m
Edge Sizing0.01 m
First Layer Inflation Height 3 × 10 5   m
Number of Cells for Boundary layer22
Number of Elements13,447,407
Disclaimer/Publisher’s Note: The statements, opinions and data contained in all publications are solely those of the individual author(s) and contributor(s) and not of MDPI and/or the editor(s). MDPI and/or the editor(s) disclaim responsibility for any injury to people or property resulting from any ideas, methods, instructions or products referred to in the content.