Article

Numerical and Parametric Investigation of the Influence of Rectangular and Elliptical Phase Change Material Geometries on the Thermal Performance of a Ground-Air Heat Exchanger

by
Giovanni Antonio Vielma Vivas
1,
Zurisaday Colonico Reyes
1,
Andre Luis Razera
2,
Luiz Alberto Oliveira Rocha
1,2,
Elizaldo Domingues dos Santos
1,2,
Ruth da Silva Brum
3 and
Liércio André Isoldi
1,2,*
1
Graduate Program in Computational Modeling, Federal University of Rio Grande—FURG, Rio Grande 96203-900, RS, Brazil
2
School of Engineering, Federal University of Rio Grande—FURG, Rio Grande 96203-900, RS, Brazil
3
Graduate Program in Mathematical Modeling, Federal University of Pelotas—UFPel, Capao do Leao 96160-000, RS, Brazil
*
Author to whom correspondence should be addressed.
Fluids 2025, 10(12), 311; https://doi.org/10.3390/fluids10120311
Submission received: 27 September 2025 / Revised: 20 November 2025 / Accepted: 22 November 2025 / Published: 28 November 2025
(This article belongs to the Special Issue Computational Fluid Dynamics Applied to Transport Phenomena)

Abstract

This study evaluates the impact of integrating Phase Change Materials (PCMs) in the efficiency of Ground-Air Heat Exchangers (GAHEs). A three-dimensional computational model for the GAHE system with an integrated annular PCM (GAHE-PCM) was implemented in ANSYS Fluent using the Finite Volume Method, accounting for the meteorological conditions and ground properties of Viamão, Brazil. A parametric evaluation with fifteen rectangular and fifteen elliptical PCM container configurations were analyzed by varying their geometric ratios. Results indicate that the inclusion of PCM may enhance the yearly thermal potential as high as 69.31% in heating and 27.92% in cooling. Geometries, such as square or circular cross-sections, maximize heat exchange with the airflow, whereas elongated shapes reduce PCM efficiency. Furthermore, placing most of the PCM in deeper, thermally stable soil layers reduces the overall performance. For near-optimal designs, the differences between rectangular and elliptical containers are minimal, providing flexibility for system implementation.

1. Introduction

According to IEA [1], in 2024 total energy-related CO 2 emissions increased by 0.8%, reaching an all-time high of 37.8 Gt, contributing to record atmospheric C O 2 levels of 422.5 ppm, representing an increase of about 3 ppm from 2023 and 50% compared with pre-industrial reference values. During the same period, global electricity demand grew by 4.3%, compared to 2.5% in 2023. This represents a relative increase of 72% and highlights a significant acceleration in global electricity consumption growth. Almost 60% of this rise was attributed to the built environment sector, with a growth of more than 600 TWh (5%), driven mainly by higher demand for air conditioning, associated with extreme heatwaves in countries such as China and India [1]. This context reinforces the need to research and implement passive and highly efficient solutions, including Ground-Air Heat Exchanger (GAHE) devices, capable of cutting energy requirements for space cooling and heating and, consequently, lowering greenhouse gas emissions [2,3,4,5].
The GAHE operates by employing the soil as a heat supplier or absorber, with air acting as the carrier for thermal transfer. Conventionally, in a GAHE, outdoor air is driven through underground pipes, dissipating or absorbing heat to the adjacent ground [6,7,8]. Owing to its high thermal inertia and insulation characteristics, the soil acts as a substantial storage medium for incident solar radiation absorbed at the surface, undergoing successive cycles of heat storage and discharge to the surroundings. Consequently, the near-surface soil strata exhibit moderated and more uniform thermal behavior in contrast with the outdoor climate, i.e., cooler conditions in summer and warmer ones in winter [9,10]. Soil thermal behavior can be mathematically described by a sinusoidal relation governed by temporal and spatial depth variables [10,11,12]. With increasing depth, the amplitude of this temperature oscillation diminishes until a nearly constant value is reached, enabling the GAHE to provide effective cooling or heating of the ambient air [9,13].
However, despite the intrinsic thermal stability of the ground, the performance of GAHE systems is highly dependent on the thermo-physical characteristics of the surrounding soil. Extensive research has shown that soil type, thermal conductivity, and moisture content exert a decisive influence on the cooling and heating potential of GAHEs [14,15,16]. In particular, the thermal conductivity of soil can be substantially enhanced by increasing its water content [17,18], which explains why water-retaining or thermally enhanced soils, such as sand–bentonite mixtures, promote faster heat diffusion toward deeper layers and mitigate local thermal saturation around the buried duct [16,19,20,21]. Consequently, these soils generally support higher heat-exchange rates and more stable long-term operation compared with dry or low-conductivity soils, which tend to saturate more rapidly and exhibit significant performance degradation under continuous operation [14,22].
Although improving soil moisture through water impregnation effectively increases thermal conductivity and enhances system performance, Agrawal et al. [20] emphasize that maintaining elevated moisture levels is not always practical: it can be costly, requires periodic replenishment due to moisture migration, and may be unsuitable in regions with limited water availability. Similarly, Mathur et al. [22,23] indicate that intermittent operation is another effective strategy to reduce heat accumulation around the pipe, particularly in soils with low thermal conductivity. However, the implementation of intermittent cycles is often constrained by building ventilation requirements or by operational schedules that demand continuous airflow. Moreover, as with moisture-enhancement strategies, intermittent operation alone cannot always prevent long-term thermal saturation under extended periods of elevated thermal load. These limitations underscore the need for alternative thermal-buffering mechanisms capable of mitigating long-term ground saturation [24].
In response to these challenges, a promising approach involves integrating Phase Change Materials (PCMs) into the system. PCMs store and release substantial quantities of latent heat when undergoing solid–liquid phase transitions [25]. The unique thermal properties of PCMs can be effectively harnessed to enhance the efficiency of a wide range of products and processes [26]. Due to their versatility, PCMs have been increasingly employed in diverse thermal energy storage applications, including integration into building walls to enhance thermal performance [27,28], improving the efficiency of residential solar water heating systems [29,30], use in portable electronic components [31,32], and incorporation into temperature-regulating textiles [33,34].
In this context, various configurations of GAHEs coupled with PCMs (GAHE-PCM), in both horizontal and vertical layouts, have been proposed, demonstrating significant improvements in the system’s thermal performance [24,25,35,36,37,38,39,40,41,42,43,44,45,46]. For instance, Zhou et al. [35] integrated an annular PCM around the duct of a horizontal GAHE, achieving an increase of approximately 20% in cooling capacity, whereas Zhou et al. [24] showed that incorporating a cylindrical PCM module positioned within the duct core enhanced this capacity by up to 39%, highlighting the need to optimize both container geometry and operating strategy. Subsequent studies stressed the relevance of matching the PCM transition temperature to the mean airflow temperature [36], as well as implementing intermittent operation strategies to mitigate soil thermal saturation [37].
In vertical GAHE systems (VGAHE), incorporating annular or cylindrical PCM at the duct outlet has been shown to increase the average cooling capacity and reduce temperature fluctuations by up to 35% [38,39]. Moreover, multivariable optimization of PCM parameters (such as melting temperature, latent heat, and thickness) plays a decisive role in maximizing system performance [40].
Other approaches have included combining GAHEs with secondary heat exchangers equipped with PCM-filled fins [41] and integrating PCM directly into the conditioned space [25], resulting in the maintenance of comfortable indoor temperatures (T < 26.5 °C). Recent studies have shown that incorporating PCM can reduce the required duct length in GAHE systems [42,43] and that placing the PCM at the system outlet is more efficient than at the inlet [44]. Furthermore, it has been demonstrated that hollow or multilayer configurations can substantially enhance both the cooling potential and the coefficient of performance (COP) of the configuration [43,45,46].
All studies reported in the literature to date on horizontally arranged GAHE–PCM systems, in which the PCM was placed around the air duct [35,36,43], employed circular annular configurations without exploring alternative geometries that could influence heat transfer. The physical relevance of examining noncircular configurations, such as elliptical or rectangular sections, lies in the fact that, in these containers, the PCM may be closer to the duct in some regions and farther away in others. This spatial variation modifies the heat conduction paths during the air–PCM–soil thermal exchange, potentially affecting the system’s transient thermal response even when the air–PCM contact area remains constant. To the best of the authors’ knowledge, no previous numerical or experimental study has investigated such noncircular PCM geometries in GAHE configurations.
Therefore, the present study introduces geometric variations beyond the conventional circular form, addressing a clear gap in the existing literature. Building upon the works of Vielma et al. [42] and Vielma et al. [44], a three-dimensional computational model was developed in ANSYS Fluent (Version 2024 R2) and adapted to the meteorological and geotechnical conditions of Viamão, Brazil. In addition to bridging this gap, the study provides new scientific insights into how PCM container geometry affects heat transfer and thermal energy utilization, while paving the way for the design of more compact and efficient GAHE systems. This approach broadens the applicability of GAHE–PCM technology to regions with limited land availability or high urban density, underscoring its importance in reducing global energy consumption.

2. Materials and Methods

In this section, the methodology employed in the present study is described in detail. First, the mathematical modeling approach used to represent the fluid mechanics and heat transfer phenomena in the system is presented, including the governing equations. Subsequently, the computational modeling framework is outlined, detailing the computational domain, the thermophysical properties of the materials, and the initial and boundary conditions applied. Various preliminary geometric configurations of the PCM containers are also considered, and a specific case study is defined to demonstrate the application of the proposed methodology. This comprehensive description provides the necessary foundation for understanding the problem under study and interpreting the results presented in later sections.

2.1. Mathematical Modeling

To obtain the time-dependent temperature field in the ground, the energy balance equation is resolved [47,48]:
T t = α s 2 T x i 2 ( i = 1 , 2 , 3 ) ,
where T is the ground temperature [K], t is the time [s], α s is the ground thermal diffusivity [m/s2], and x i (i = 1, 2, 3) indicates the position along the three spatial axes [m].
To describe the unsteady, incompressible, and turbulent regime of airflow within the pipe, the governing conservation equations for mass, momentum, and energy in their time-averaged form are given by the following [47,48,49,50,51]:
v i ¯ x i = 0 ( i = 1 , 2 , 3 ) ,
v i ¯ t + v i ¯ v j ¯ x j = 1 ρ ¯ p ¯ x j δ i j + x j ν a v i ¯ x j + v j ¯ x i τ i j ( i , j = 1 , 2 , 3 ) ,
T ¯ t + v j ¯ T ¯ x j = x j α a T ¯ x j q j ( i = 1 , 2 , 3 ) ,
where the overline denotes time-averaged quantities, v 1 , v 2 , and v 3 are velocity components along the Cartesian axes [m/s], ρ is the air density [kg/m3], p is the pressure [Pa], δ i j is the Kronecker delta, ν a is the air kinematic viscosity [m2/s], and α a is the air thermal diffusivity [m/s2]. The additional terms τ i j [m2/s2] and q j [m·K/s] generated by the averaging of the momentum and energy balance equations require closure models, and can be written as follows [49,50]:
τ i j = v i v j ¯ ,
q j = v j T ¯ ,
where the superscript (′) represents the instantaneous fluctuating part of the variable.
The Reynolds-averaged Navier–Stokes (RANS) κ ε model, defined through two additional transport equations [49,50], is used to address the closure problem. For incompressible flows, the closure expressions appearing in Equations (5) and (6) are expressed as follows [49,50]:
τ i j = ν t v i ¯ x j + v j ¯ x i 2 3 κ δ i j ,
q j = α t T ¯ x j ,
in which ν t and α t are specified as follows [49,50]:
ν t = C μ κ 2 ϵ ,
α t = ν t P r t .
The turbulent kinetic energy ( κ ) [m2/s2] and turbulent dissipation ( ϵ ) [m2/s3] are described, respectively, by the following [49,50]:
κ t + v j ¯ κ x j = τ i j v i ¯ x j + x j ν a + ν t σ κ κ x j ϵ ,
ϵ t + v j ¯ ϵ x j = x j ν a + ν t σ ϵ ϵ x j + C ϵ 1 ϵ κ τ i j v i ¯ x j C ϵ 2 ϵ 2 κ ,
where C μ = 0.09, C ϵ 1 = 1.44, C ϵ 2 = 1.92, and P r t = 1.0.
With respect to the GAHE–PCM mathematical model, it is necessary to additionally solve the energy equation that governs the phase transition in the PCM. This work examined the non-isothermal phase transformation of the PCM using the equivalent heat capacity technique within the numerical model. This approach treats the phase change as a conduction-only process, representing the PCM’s latent heat as sensible heat across a small range around the transition temperature, characterized by its peak value. The state change process is formulated as follows [24,35]:
ρ PCM ( c e q T ) t = k PCM 2 T x i 2 ( i = 1 , 2 , 3 ) ,
where ρ PCM is the PCM density [kg/m3], and k PCM is the PCM thermal conductivity [W/m·K]. Assuming a triangular profile, the equivalent specific heat is defined in the energy equation for the Phase Change Material (PCM) [24,35]:
c e q = c p 1 if T T 1 c p 1 + c p 2 2 + 2 ( T T 1 ) ( T 2 T 1 ) ( T p T 1 ) L if T 1 < T T p , c p 1 + c p 2 2 + 2 ( T T 2 ) ( T 2 T 1 ) ( T p T 2 ) L if T p < T < T 2 , c p 2 if T T 2
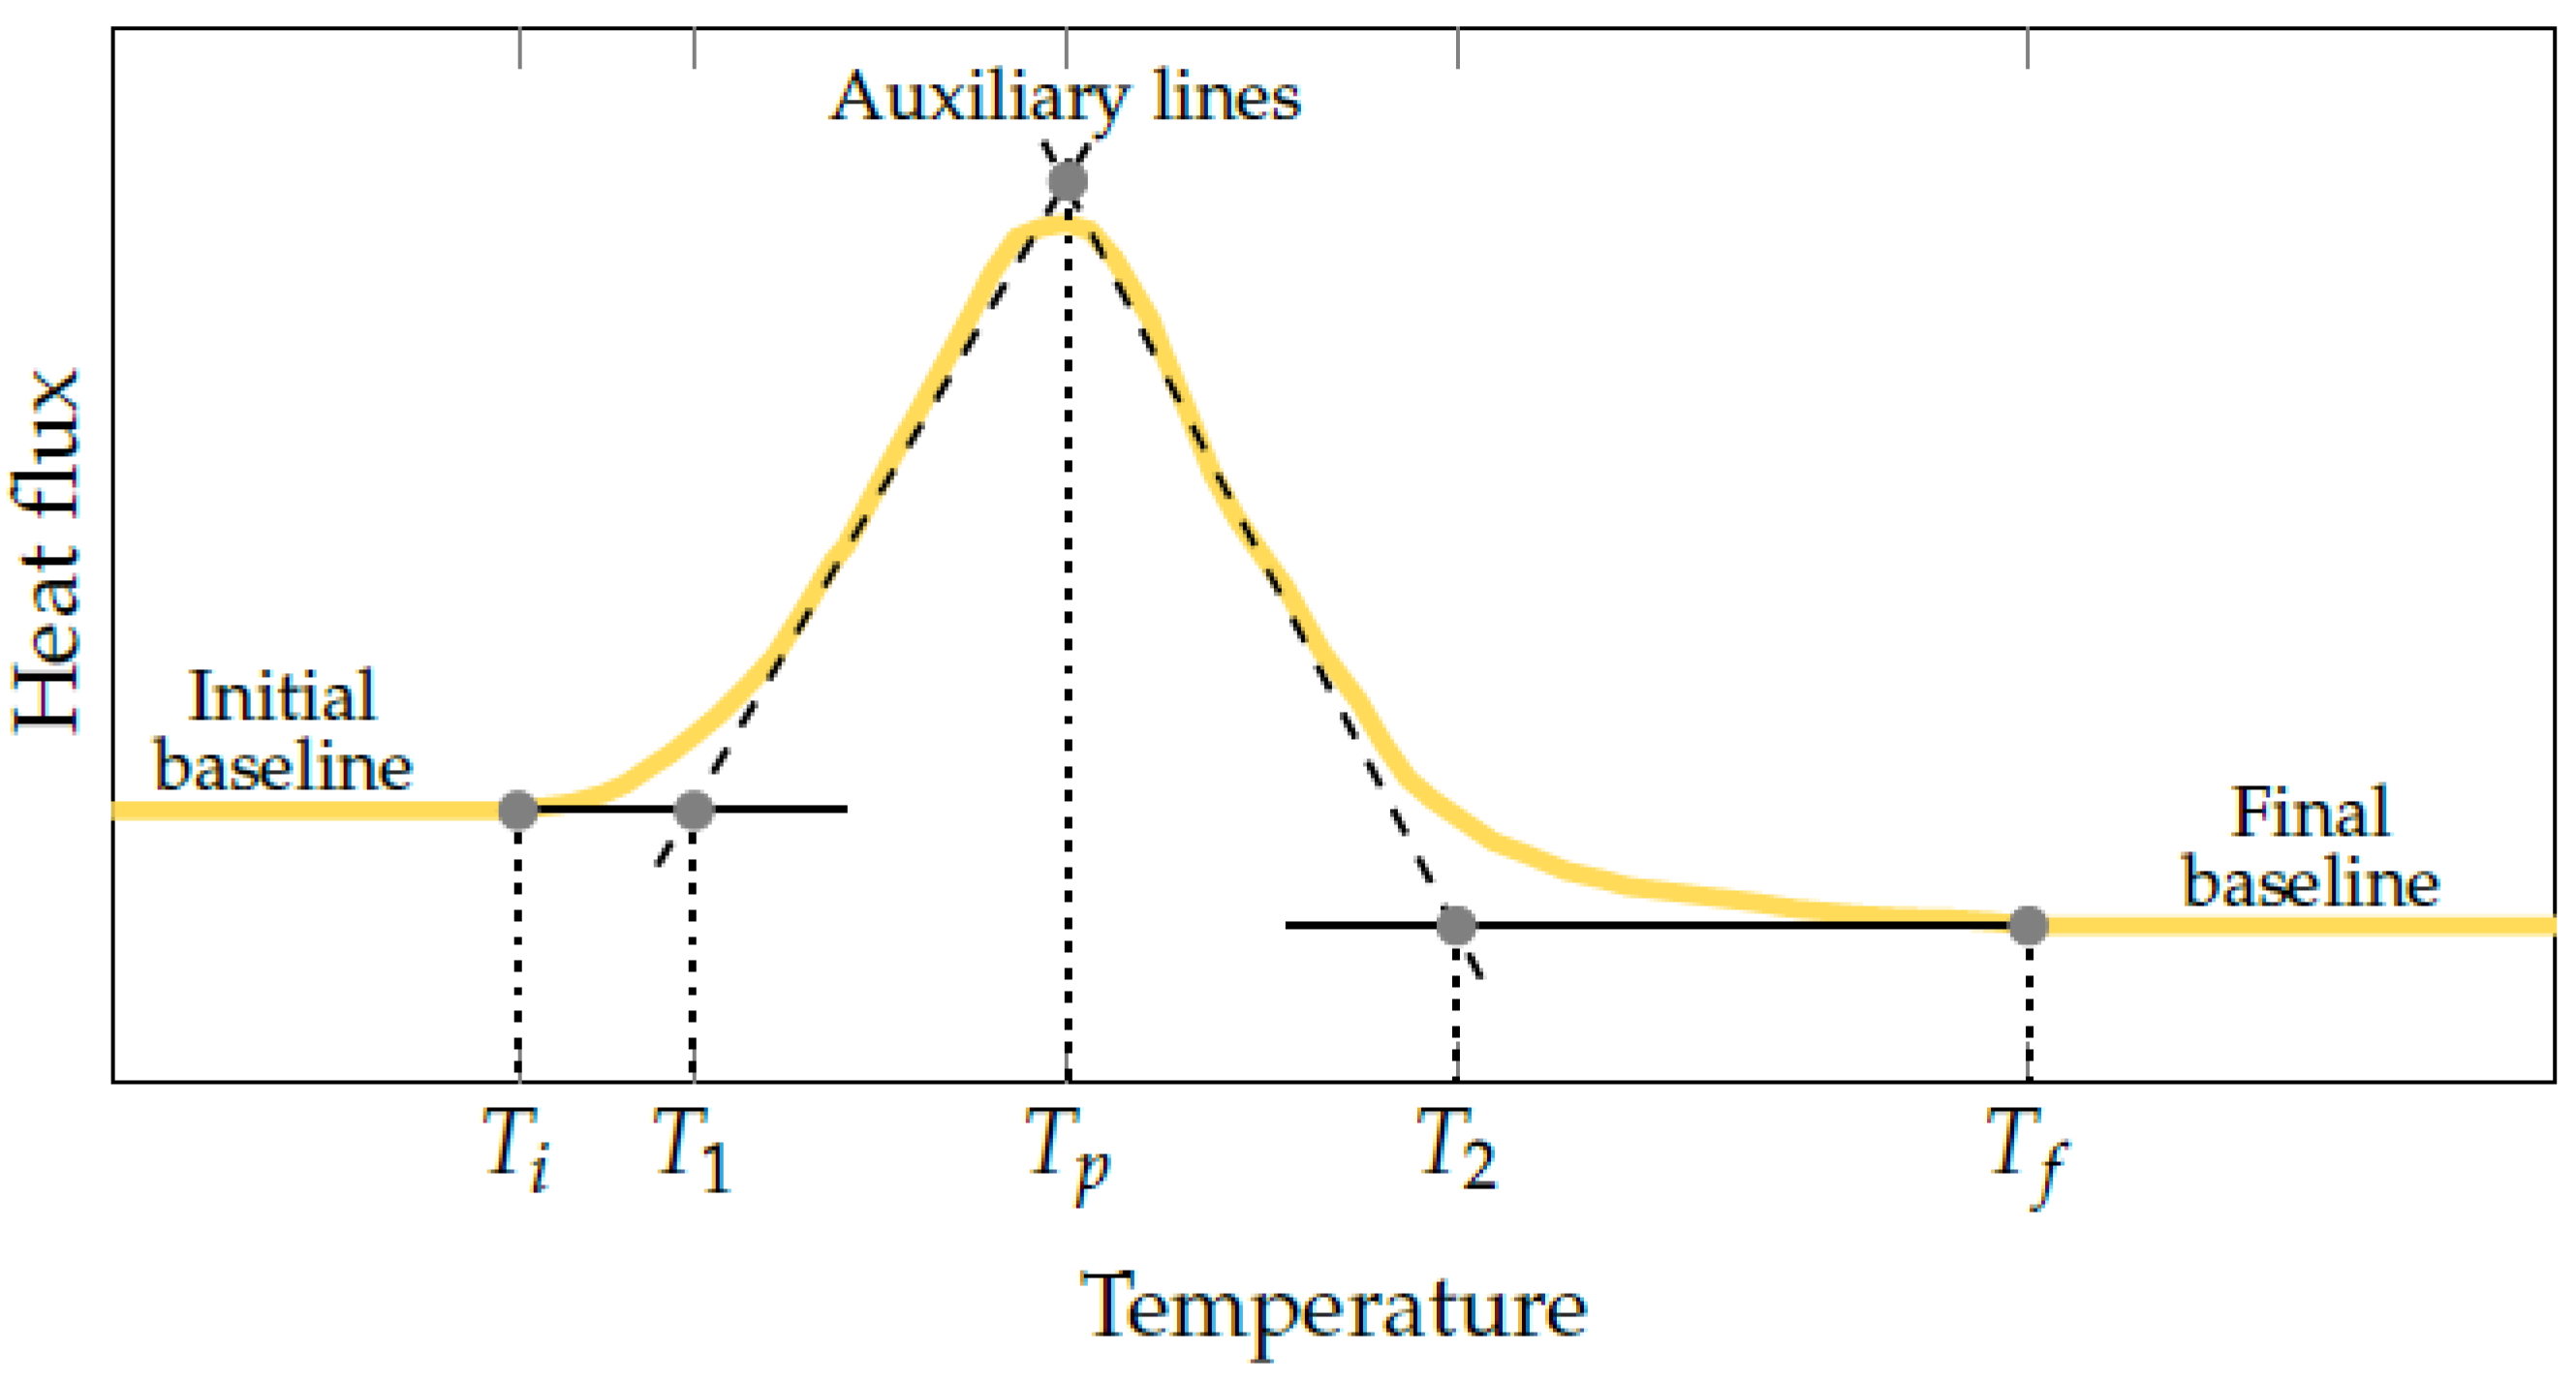
In Equation (14), c p 1 and c p 2 denote the PCM specific heat [J/kg·K] before and after melting, respectively; L is the PCM latent heat of fusion [J/kg]; T 1 [K] and T 2 [K] represent the extrapolated onset and end temperatures of the phase transition, respectively; and T p [K] denotes the peak temperature.

Performance Indicator

The thermal performance of the GAHE-PCM is assessed through the thermal potential (TP), defined as the average temperature difference between the inlet and outlet air of the device. Accordingly, the expression for TP is given by the following [7]:
TP = 1 n i = 1 n T o u t i ( t ) T i n i ( t ) ,
where T o u t i ( t ) and T i n i ( t ) represent, respectively, the outlet and inlet air temperatures of the GAHE at time t, evaluated over a total of n recorded data points.

2.2. Computational Modeling

2.2.1. Computational Domain

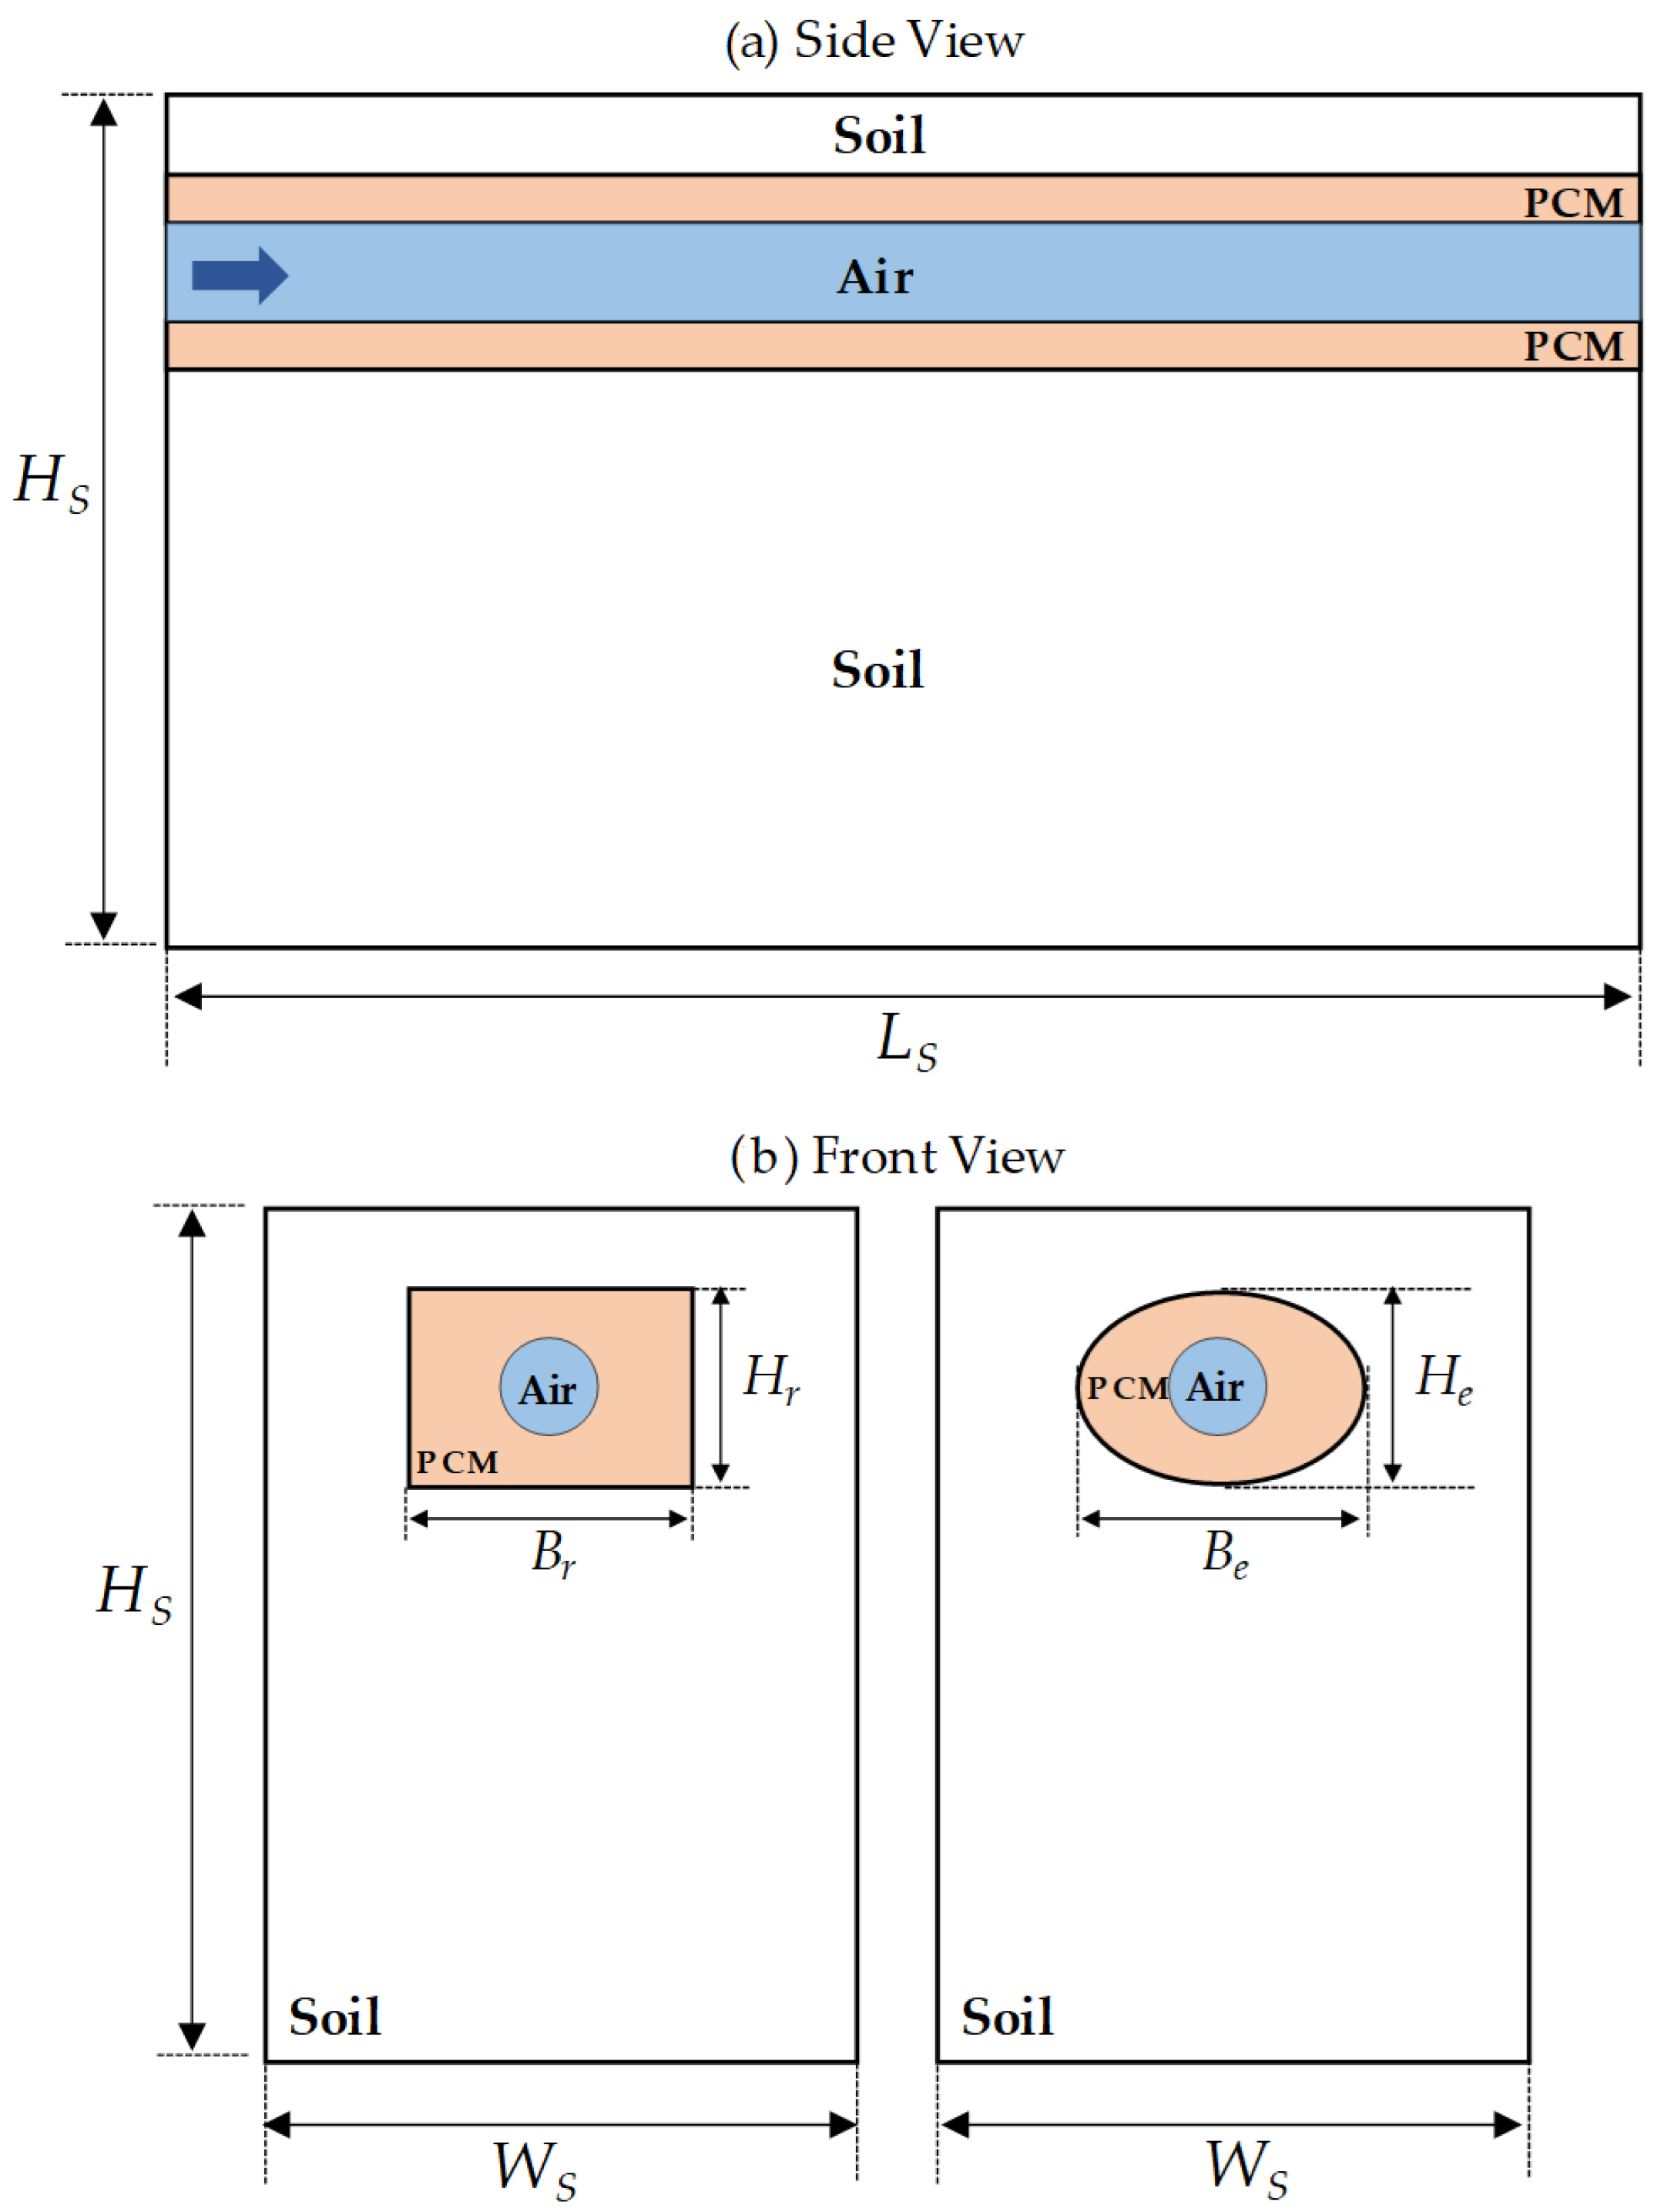
Based on the GAHE computational model of Brum et al. [52], which has been employed in various studies in the literature [7,9,53], the present research developed a GAHE-PCM computational model using the ANSYS Fluent software. Figure 1 illustrates the complete computational domain of the problem, providing an overall view of the modeled system. Complementarily, Figure 2 presents detailed perspectives of the geometry: Figure 2a shows the lateral view, and Figure 2b depicts the frontal view for the rectangular and elliptical PCM configurations.
This includes a three-dimensional soil portion, shaped as a rectangular parallelepiped, whose dimensions are H S = 15.00 m, W S = 5.00 m, and L S = 25.77 m. The pipe was defined with a diameter of d d u c t = 11 cm and a length of L d u c t = 25.77 m, and it was installed in the soil at a burial depth of h = 1.60 m.
The annular PCM container, with a length of L P C M = 25.77 m, was arranged concentrically around the cylindrical duct within the computational domain. This container featured a cross-section that could adopt two configurations: (i) rectangular, characterized by the dimensions B r (width, aligned with the x-axis) and H r (height, aligned with the y-axis), or (ii) elliptical, defined by the full axes B e (along the x-axis) and H e (along the y-axis). The pipe wall thickness was neglected in the numerical modeling, a simplification frequently employed in prior works [7,9,53,54]. Likewise, following Zhou et al. [35], the thickness of the annular cylindrical PCM container wall was not considered.
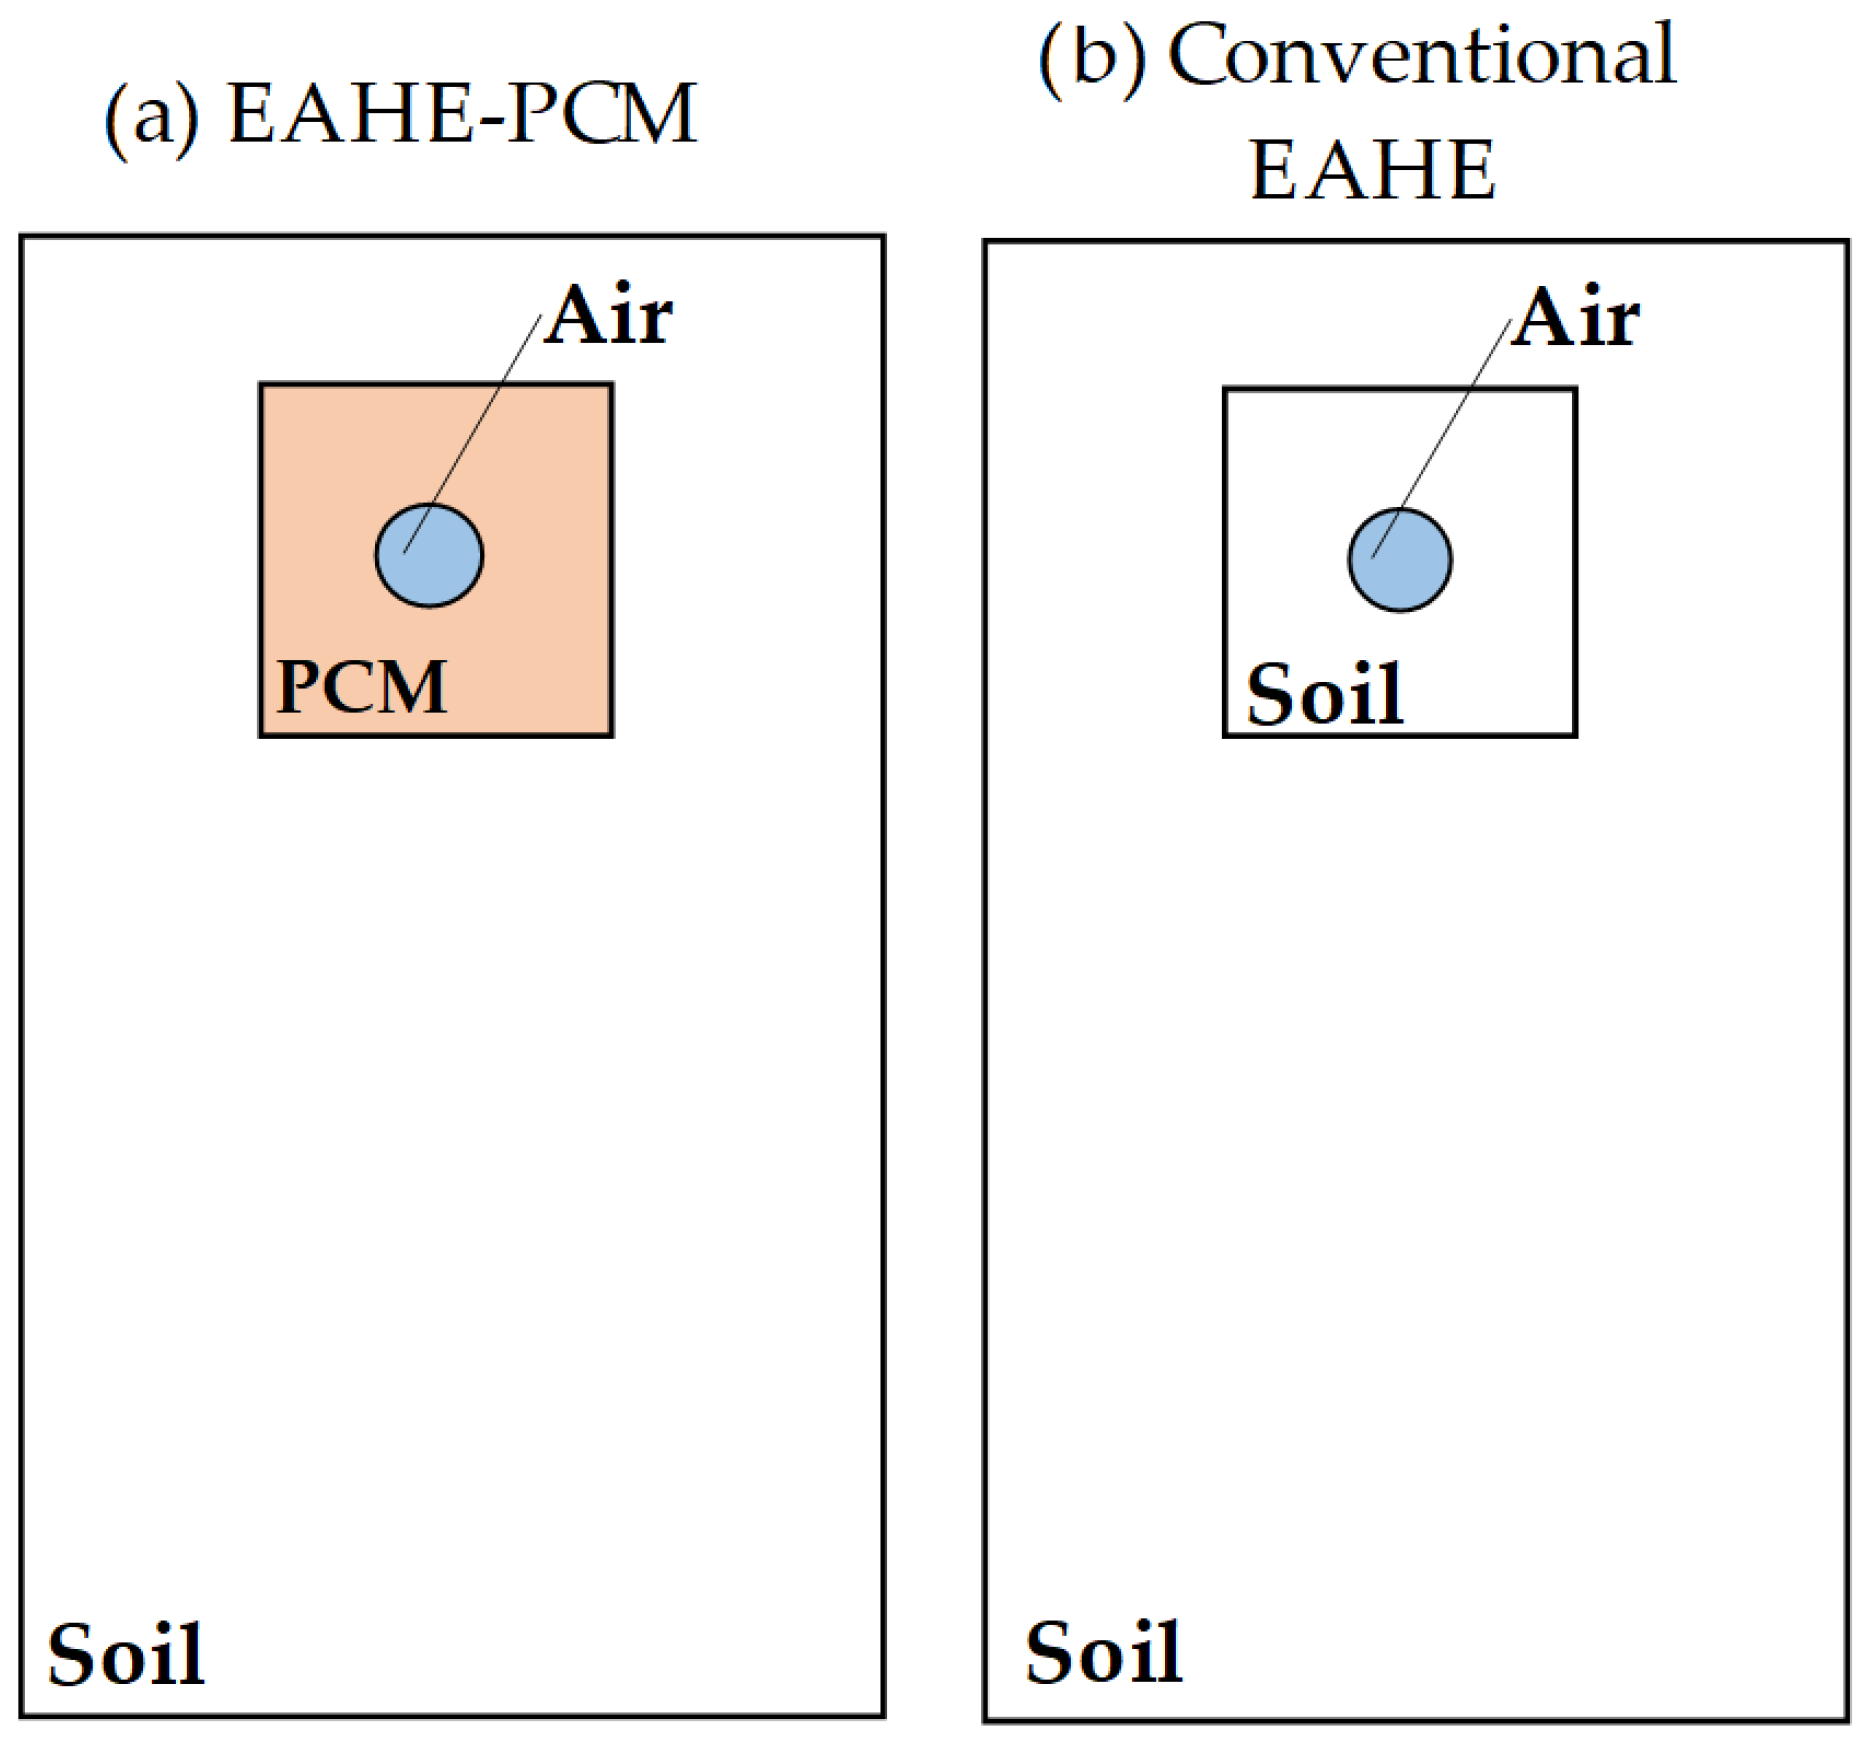
It is worth mentioning that, based on the GAHE computational domain with a rectangular PCM container depicted in Figure 1, the configuration of the GAHE without PCM was obtained by substituting the PCM surrounding the pipe with a container filled with soil, having the same characteristics as the site soil in which the air duct is assumed to be buried, as shown in Figure 3.

2.2.2. Thermophysical Properties of the Materials

The thermophysical parameters of the ground and air employed in this research follow the values reported by Vaz et al. [54] and are presented in Table 1. Regarding the PCM, the commercial product BioPCM Q20, manufactured by Phase Change Energy Solutions, was selected because it is biodegradable, non-toxic, non-corrosive, and chemically and thermally stable, while also exhibiting enhanced storage capacity and thermal conductivity relative to other PCMs [55]. According to Campbell and Sailor [56], these materials are derived from refined soybean oil and palm oil.
To obtain the equation for the equivalent heat capacity of BioPCM Q20, it is required to determine the extrapolated onset temperature, the peak temperature ( T p ), and the extrapolated end temperature, as illustrated in Figure 4 [57].
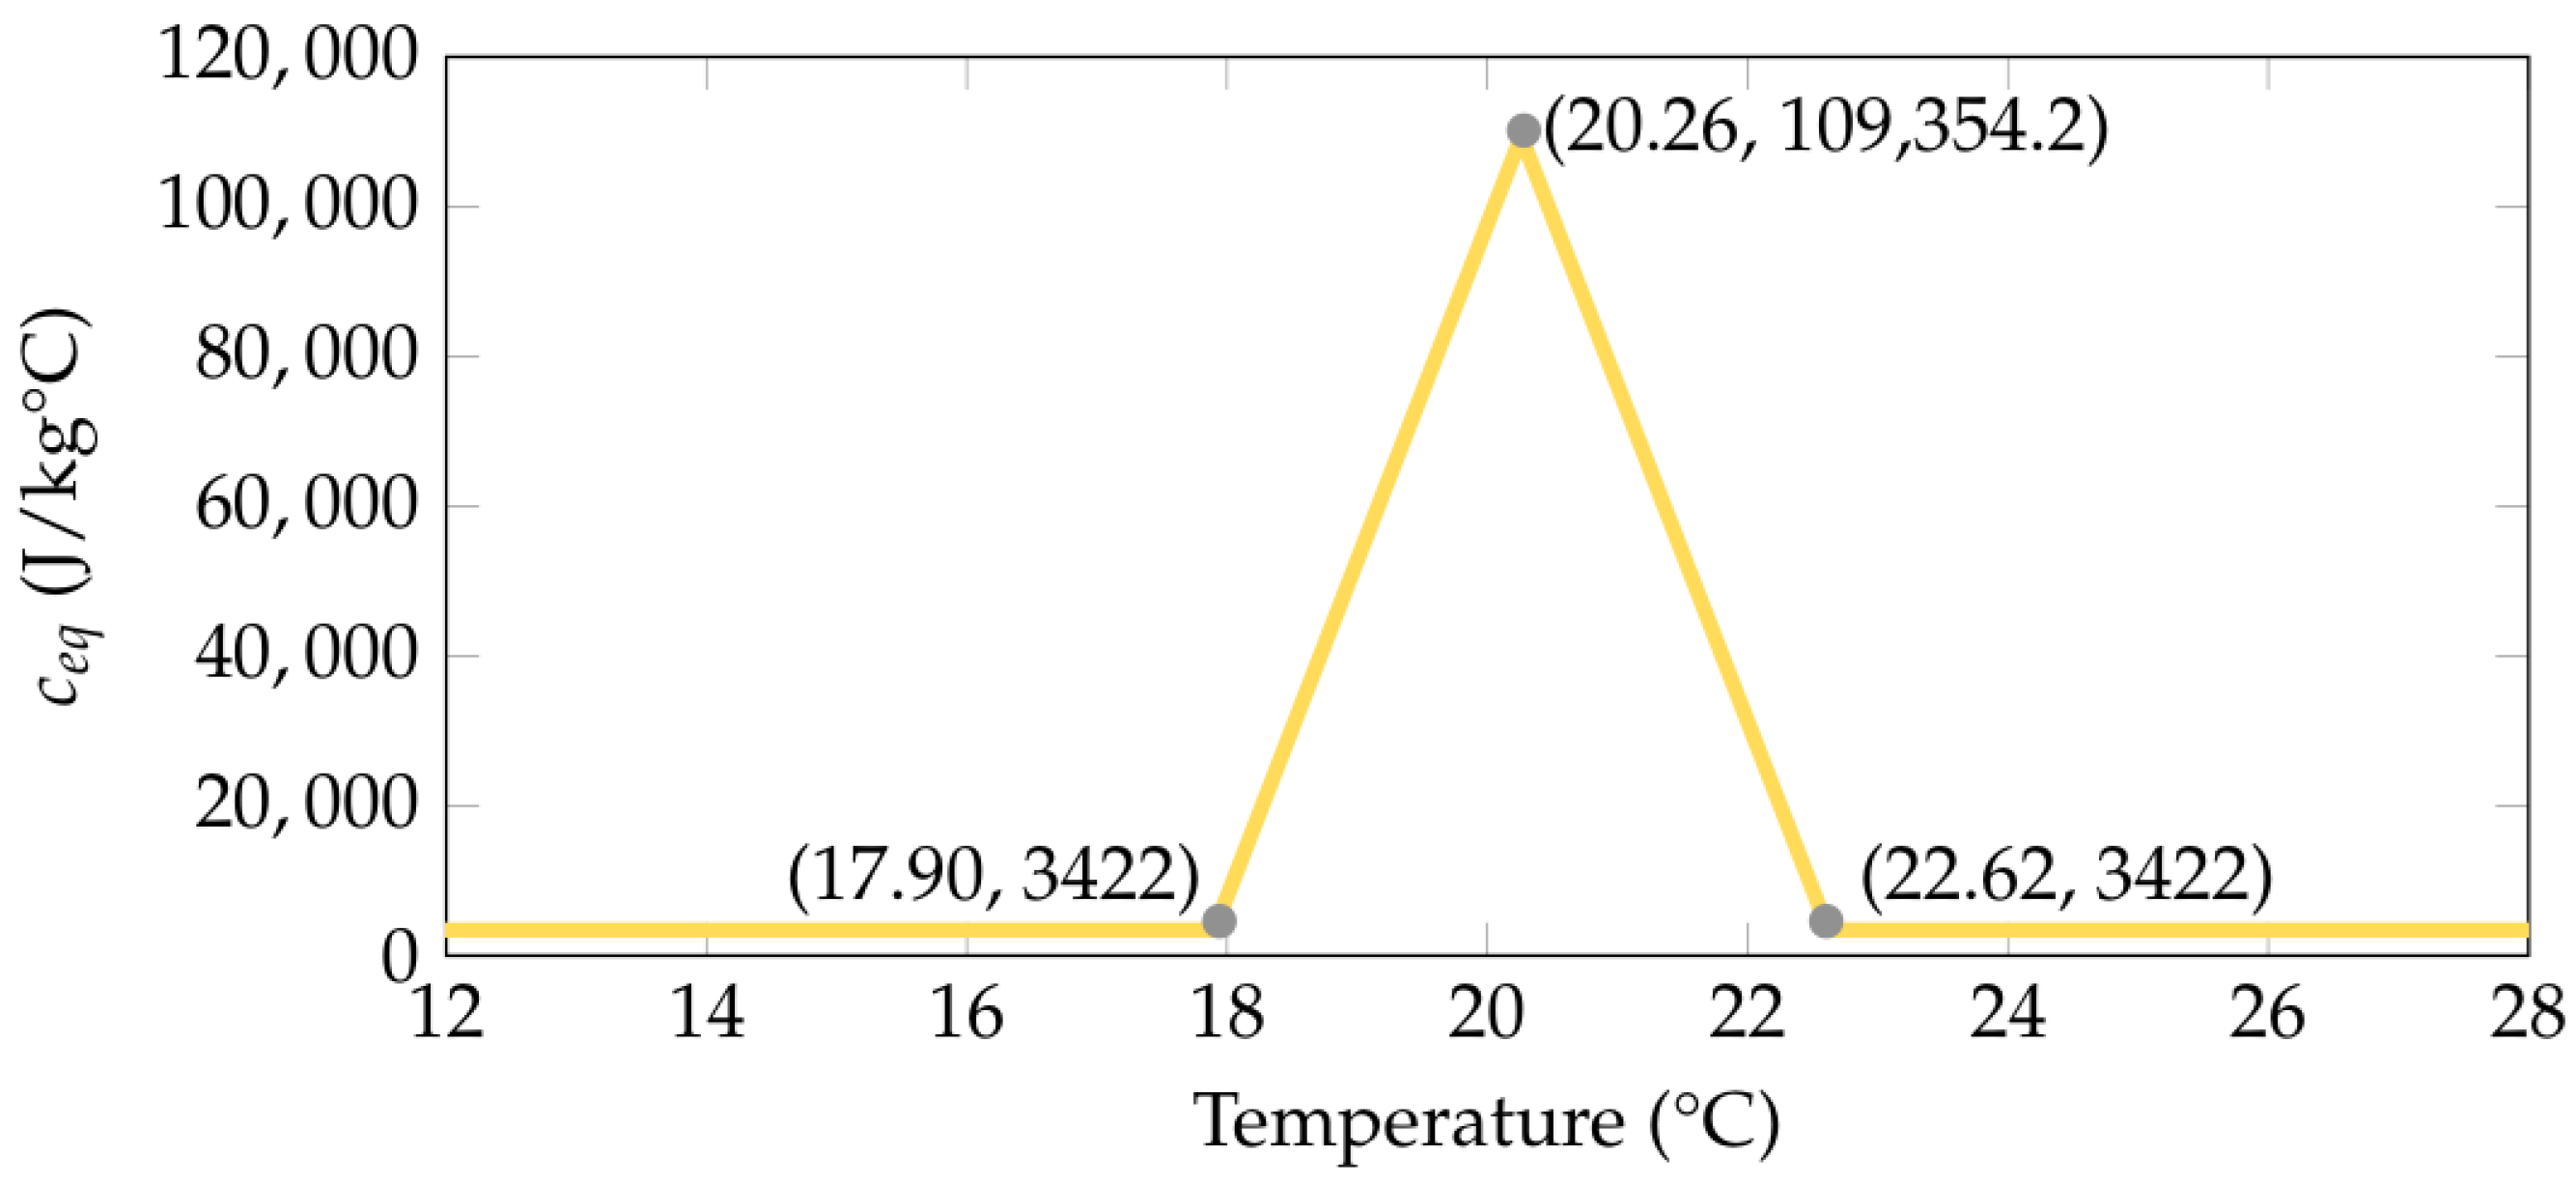
Based on the Differential Scanning Calorimetry (DSC) thermogram provided in the BioPCM Q20 datasheet [55], these temperatures were estimated as T 1 = 17.90 °C, T peak = 20.26 °C, and T 2 = 22.62 °C. In addition, the specific heat before and after the phase change was estimated as c p 1 = c p 2 = 3422 J/kg·K. Assuming a triangular profile, the equivalent specific heat at the peak temperature is calculated by the following:
c p e a k = 2 L T 2 T 1 + c p 1 + c p 2 2 .
For L = 250,000 J/kg [55], the equivalent specific heat is calculated as c p e a k = 109,354.2 J/kg·K. The thermophysical parameters of BioPCM Q20 are listed in Table 1. Figure 5 shows the equivalent specific heat curve of BioPCM Q20.

2.2.3. Initial Condition and Boundary Conditions

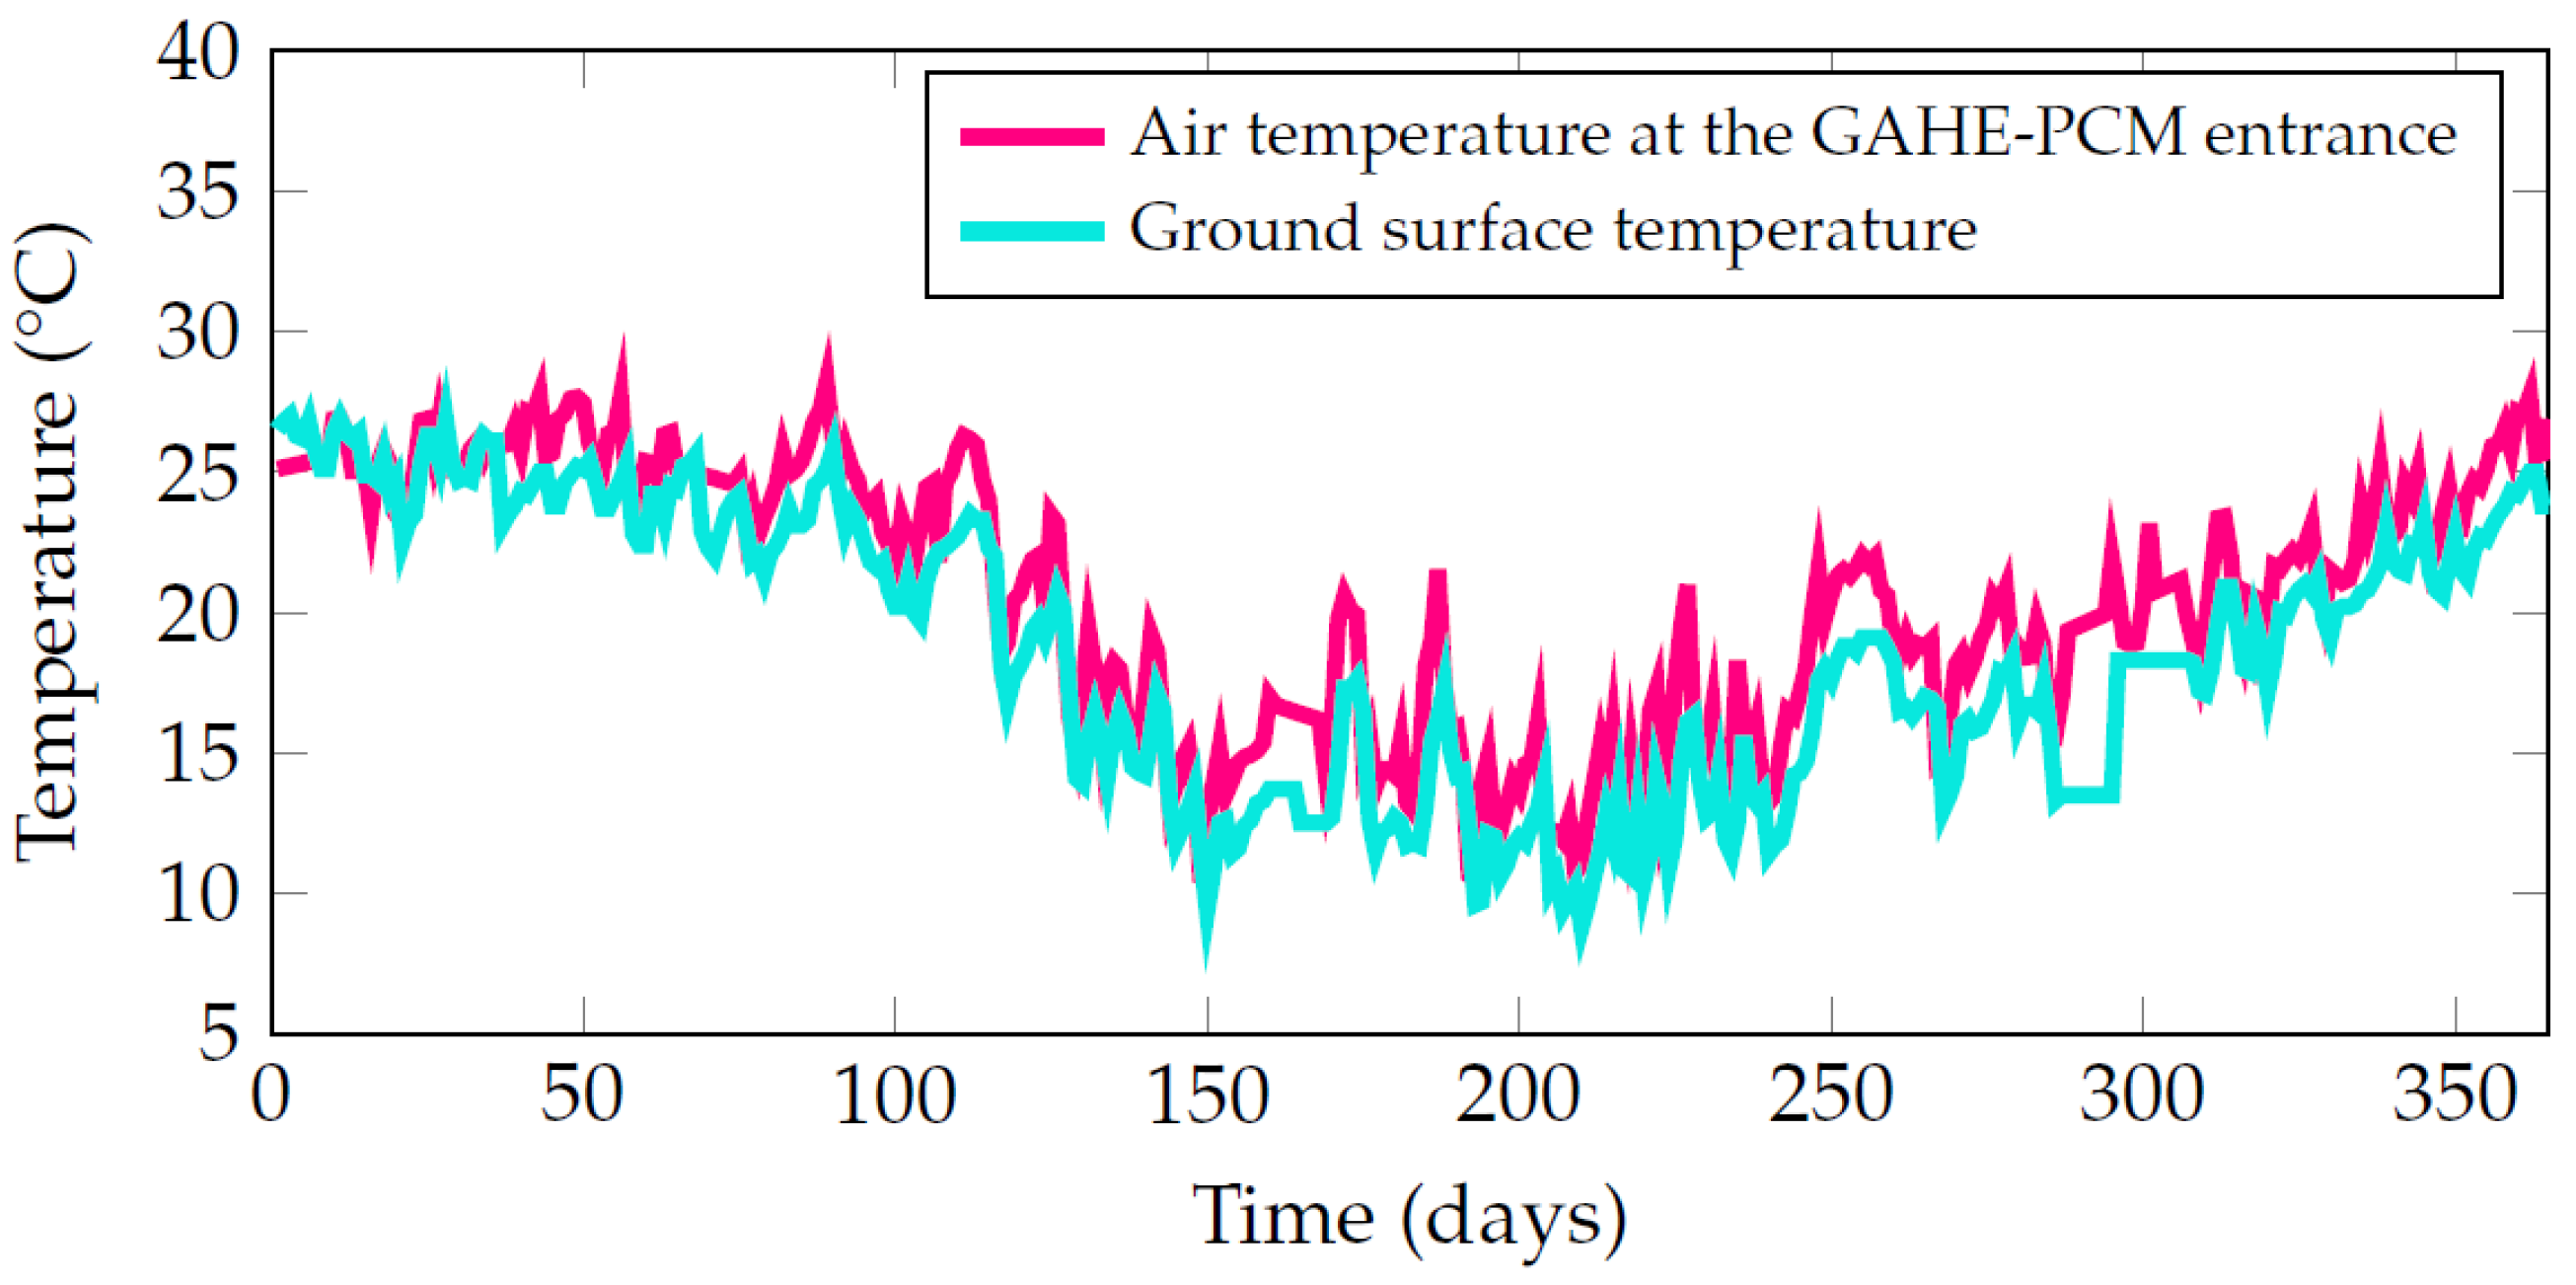
Based on the measurements reported by Vaz et al. [54], the annual variations in air temperature at the duct inlet and at the soil surface were prescribed (see Figure 6). In addition, the inlet air velocity was specified as 3.30 m/s [54]. Atmospheric pressure was imposed at the duct exit. The lateral, front, rear, and bottom faces of the computational domain were considered adiabatic. At the air–PCM interface, the fluid dynamic boundary condition was assumed to be non-slip and impermeable.
For the initial condition, the entire domain was set at 18.7 °C, corresponding to the average yearly soil temperature in Viamão [54].

2.2.4. Preliminary Geometric Configurations of PCM

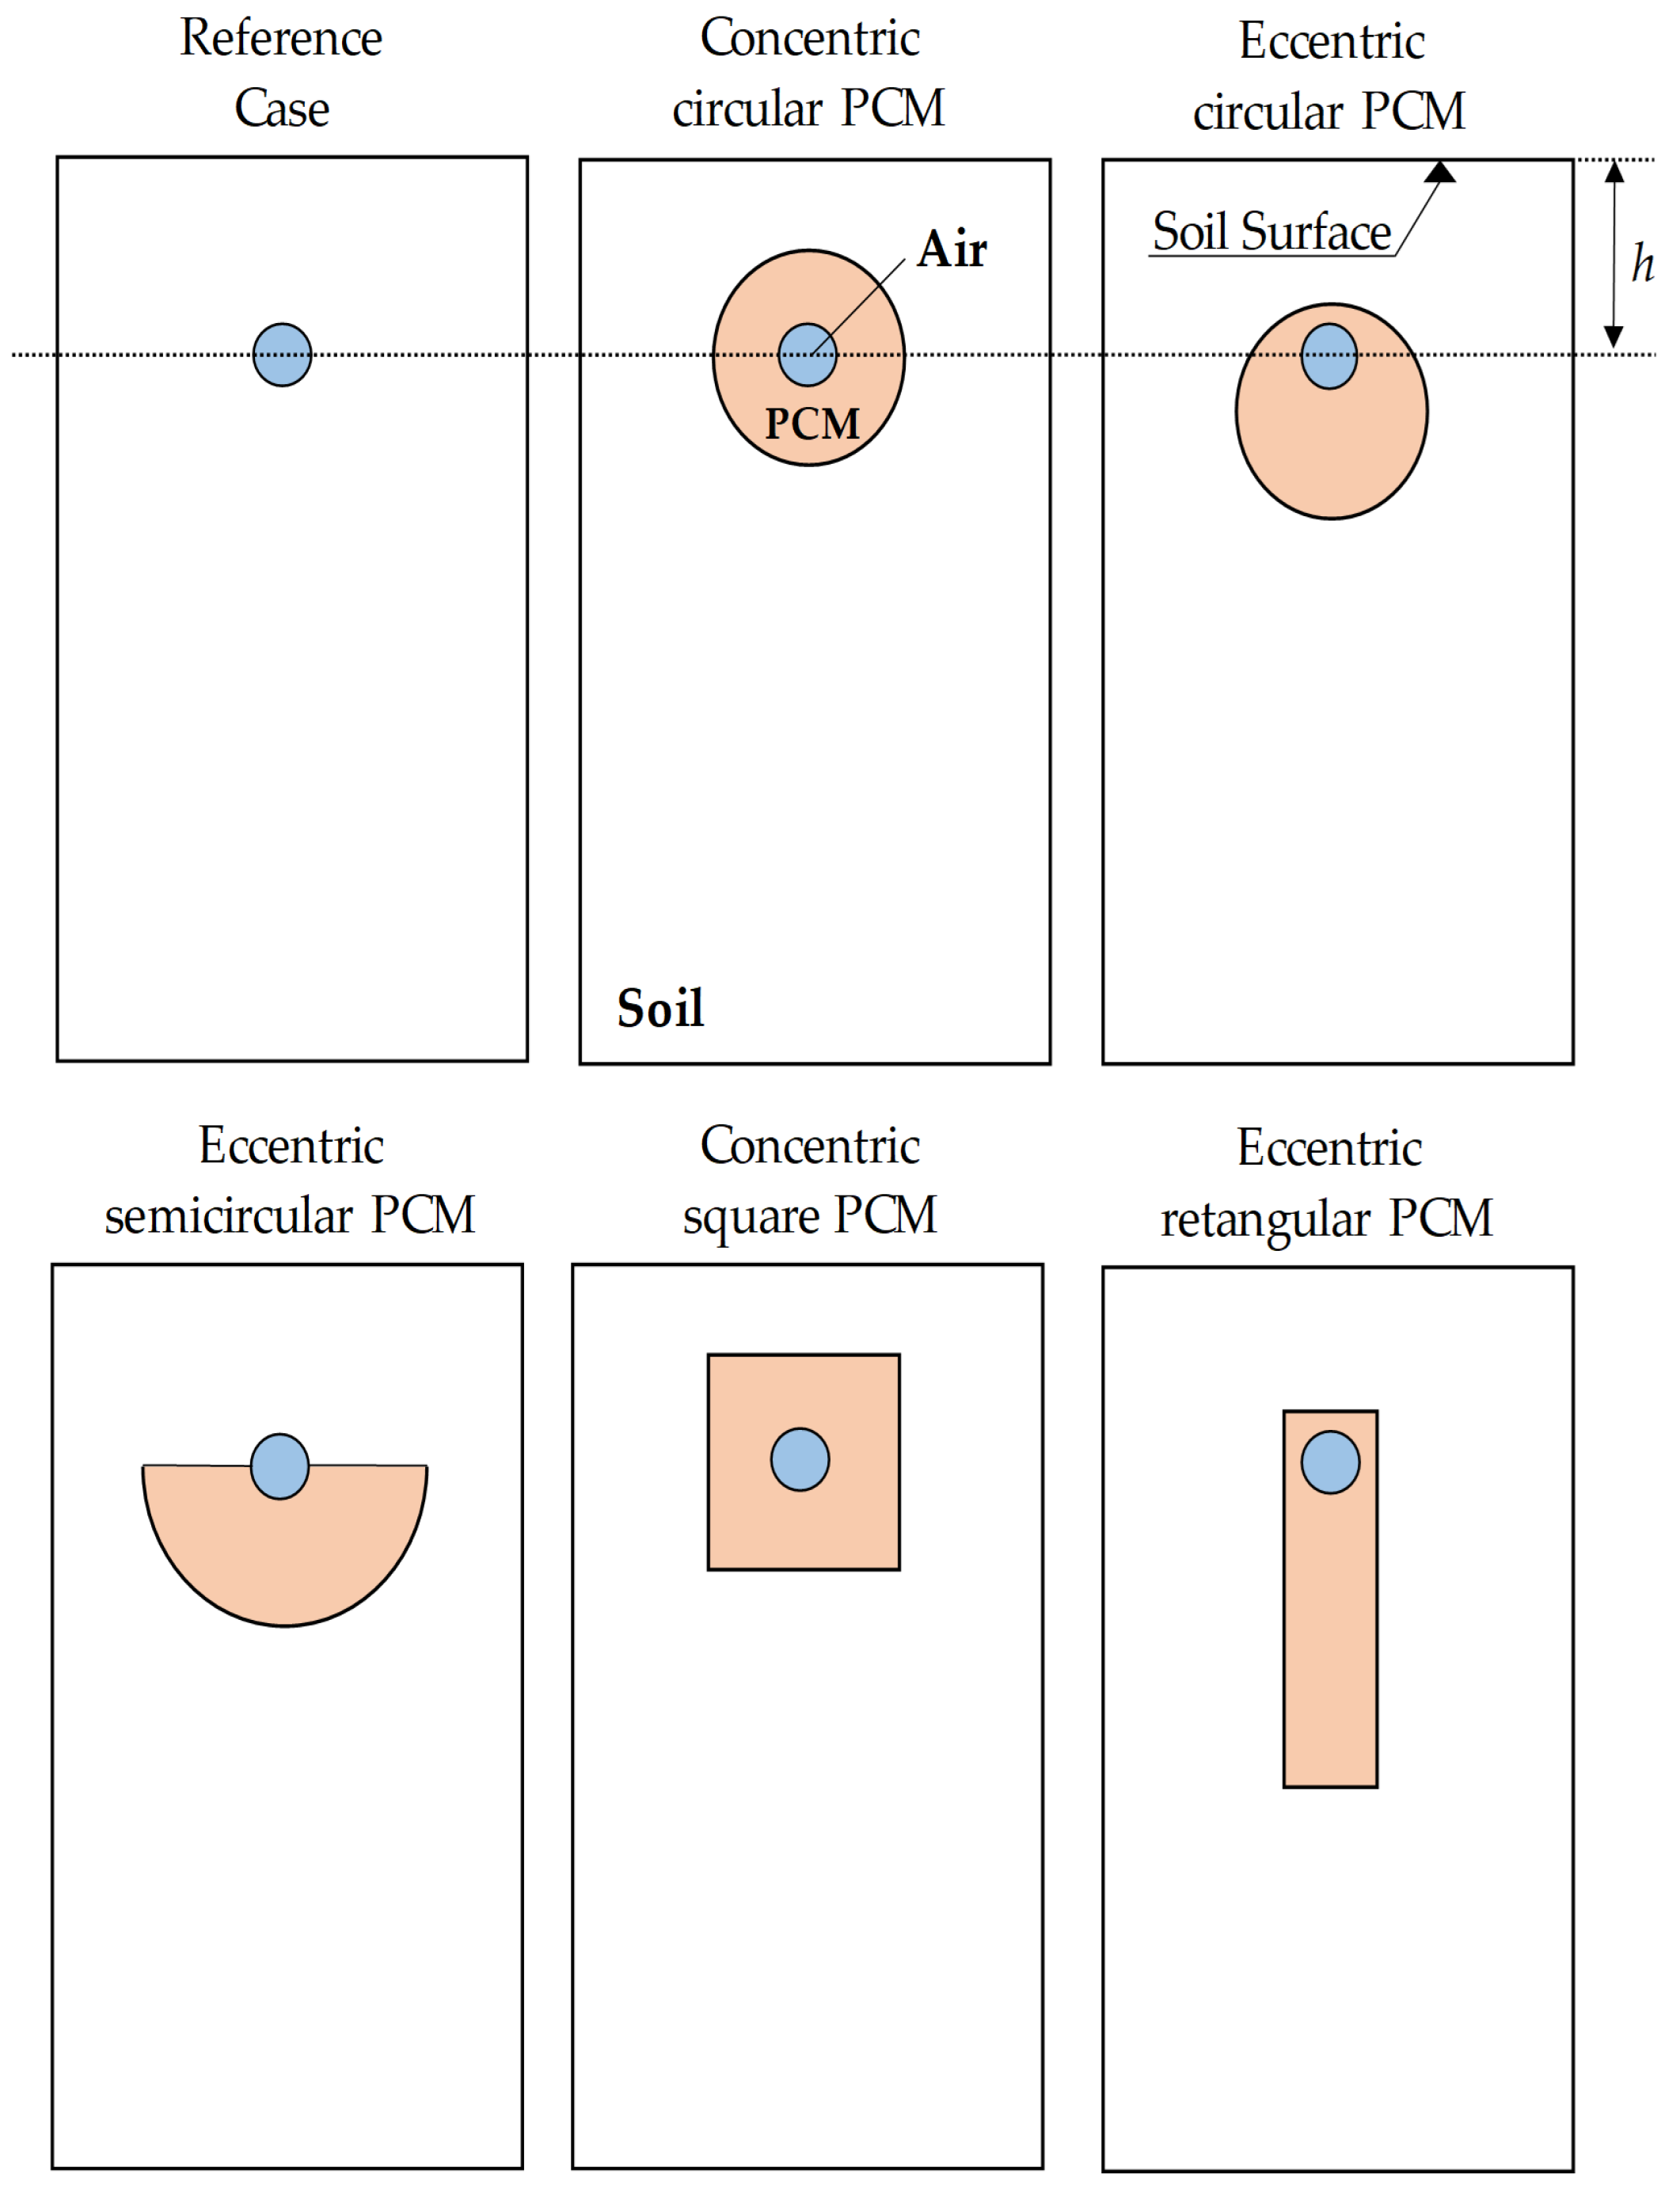
Before conducting the parametric study of PCM containers with rectangular and elliptical cross-sections, preliminary PCM configurations with concentric and eccentric arrangements were evaluated, with most of the material placed below the air duct in the eccentric case. The objective was to investigate whether placing the PCM in deeper soil layers, where temperatures are more stable, could improve the TP.
In this study, both the air mass flow rate ( m ˙ , in kg/s) and the PCM container volume ( V PCM , in m3) were kept constant. For the case of a concentric circular cross-section, they are defined as follows:
m ˙ = ρ v π 4 d duct 2 ,
and
V PCM = π 4 d PCM 2 d duct 2 L PCM .
The magnitude of these two parameters was determined according to Vaz et al. [54], considering an airflow velocity of 3.3 m/s and an air duct diameter of d duct = 11 cm, as well as a PCM container diameter of d PCM = 71 cm [58], which corresponds to a PCM thickness of 30 cm. As mentioned earlier, a length of L PCM = 25.77 m [54] was adopted, resulting in V PCM = 9.96 m3 and m ˙ = 3.64 × 10 2 kg/s.
Four additional configurations were also investigated: (1) an eccentric annular container, with the same external diameter of d PCM = 0.71 m and an eccentricity of 0.22 m ; (2) an eccentric semicircular container, with an external diameter of d PCM = 0.998 m ; (3) an eccentric rectangular container, with dimensions of 0.31 m × 1.277 m ; and (4) a concentric square container, with a side length of 0.629 m .
As illustrated in Figure 7, three of the scenarios were configured so that most of the PCM volume was positioned below the air duct, which has a diameter of d duct = 0.11 m , through which the airflow occurs.

2.2.5. Case Study

For the case study, two main parameters were defined and systematically varied throughout the analyzed cases: (i) the aspect ratio of the vertical to horizontal sides of the rectangular PCM container cross-section ( r 1 = H r / B r ), and (ii) the aspect ratio of the vertical to horizontal sides of the elliptical PCM container cross-section ( r 2 = H e / B e ).
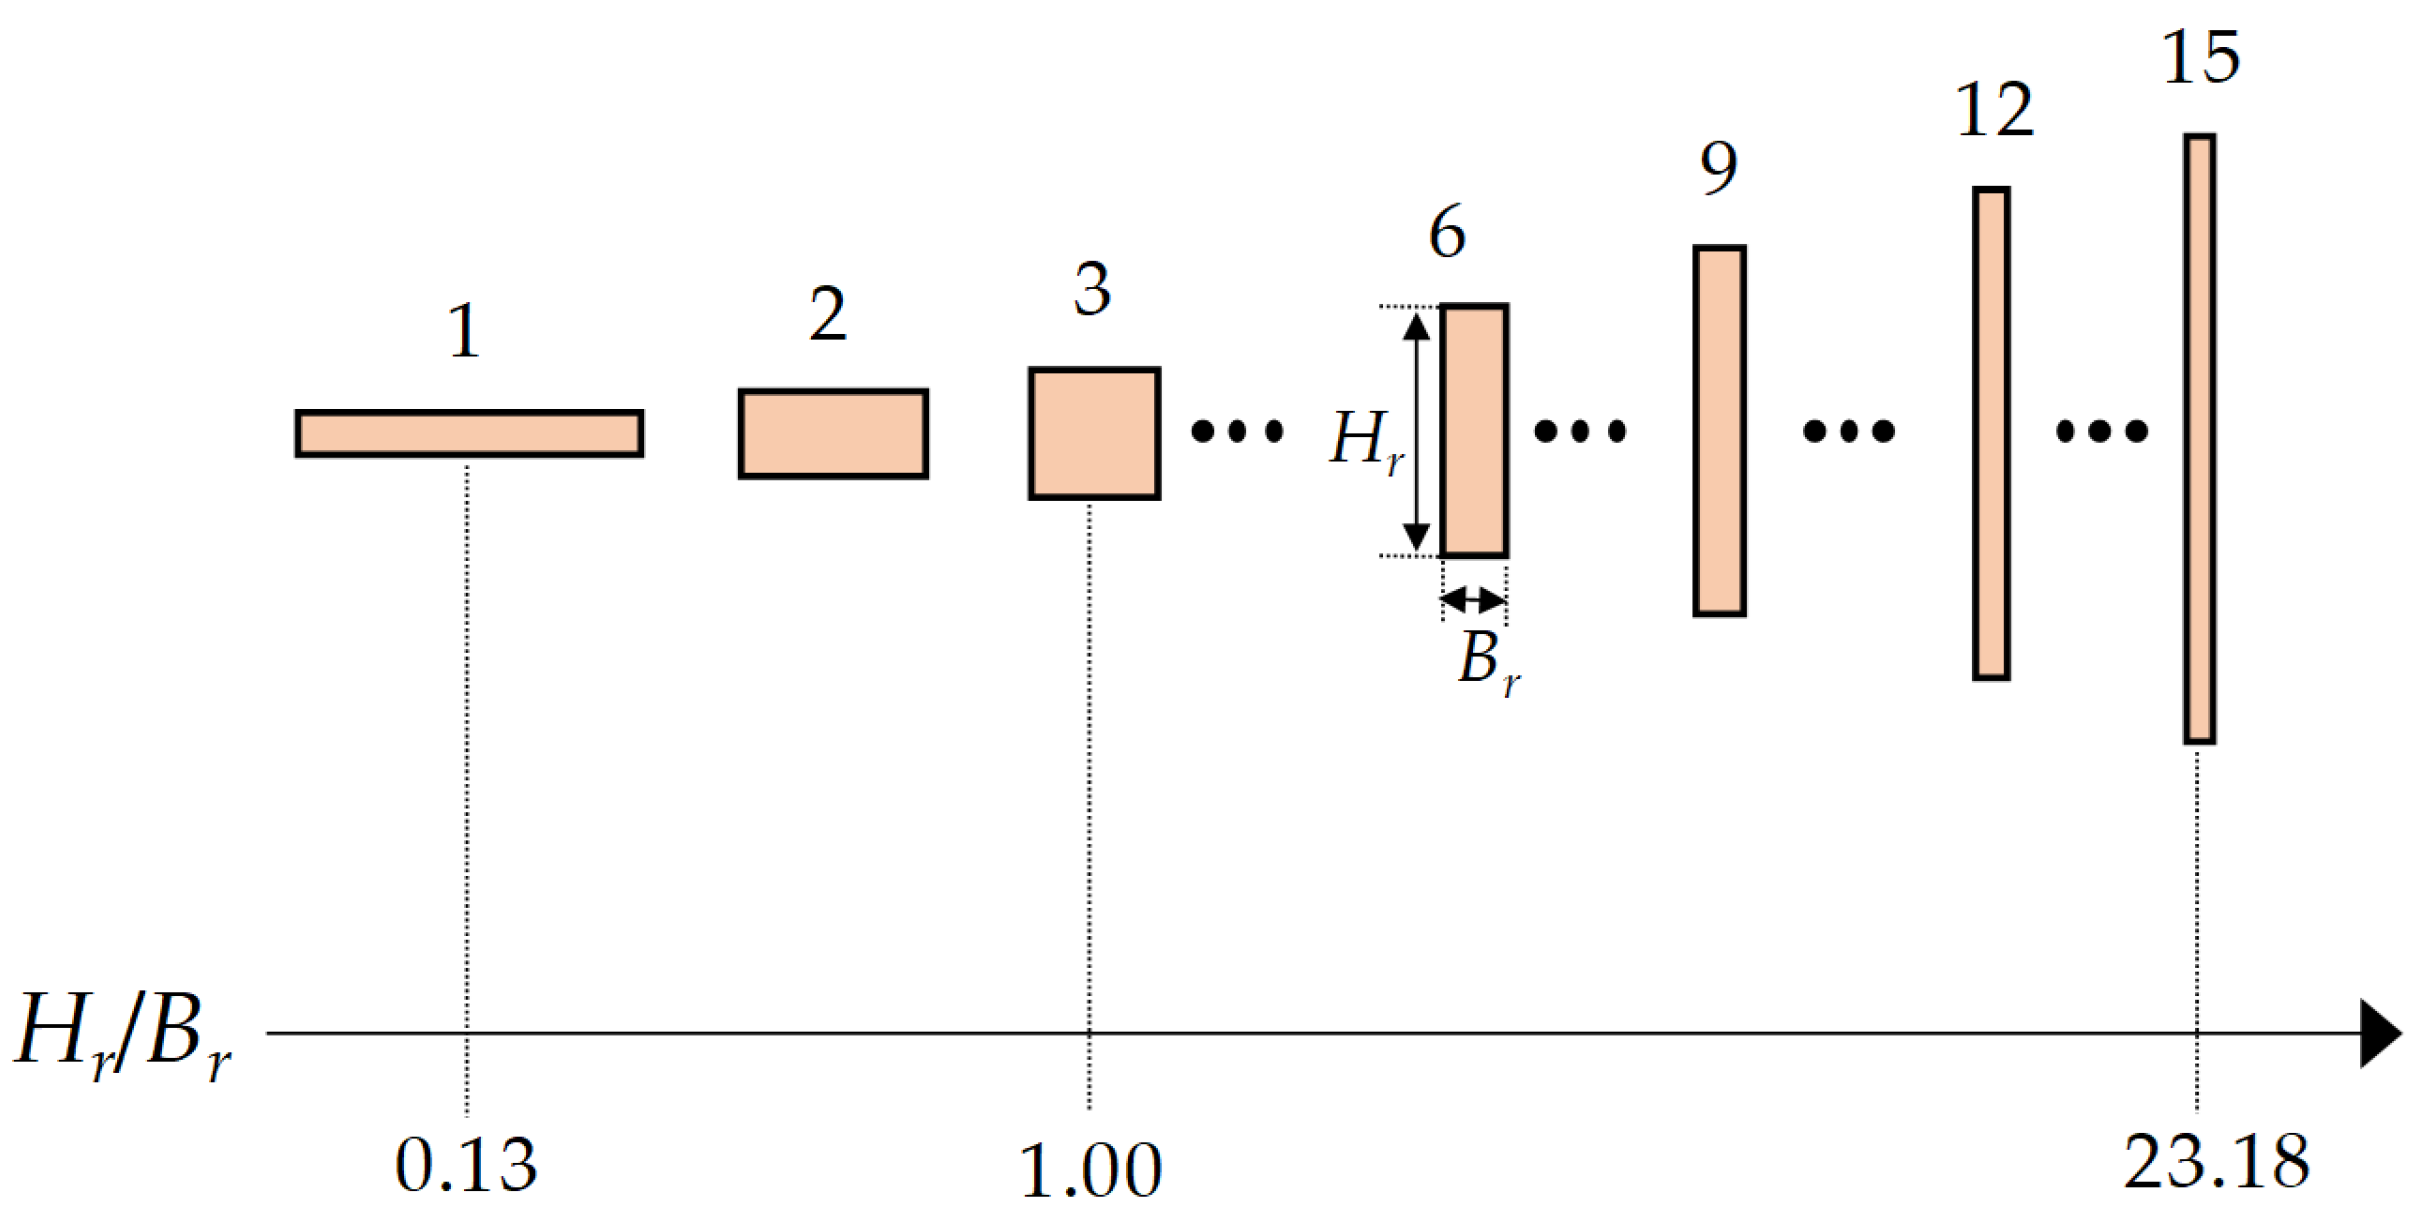
In the present investigation, fifteen distinct values were considered for the ratio r 1 (see Table 2). It should be emphasized that lower r 1 values represent horizontally elongated geometries, whereas higher values correspond to vertically elongated configurations relative to the ground surface. Based on these ratios and the PCM volume for the rectangular cross-section, they are defined by the following:
V PCM = B r H r π 4 d duct 2 L PCM ,
the values of B r and H r were obtained, as presented in Table 2. In Figure 8, the different rectangular cross-section configurations considered can be observed.
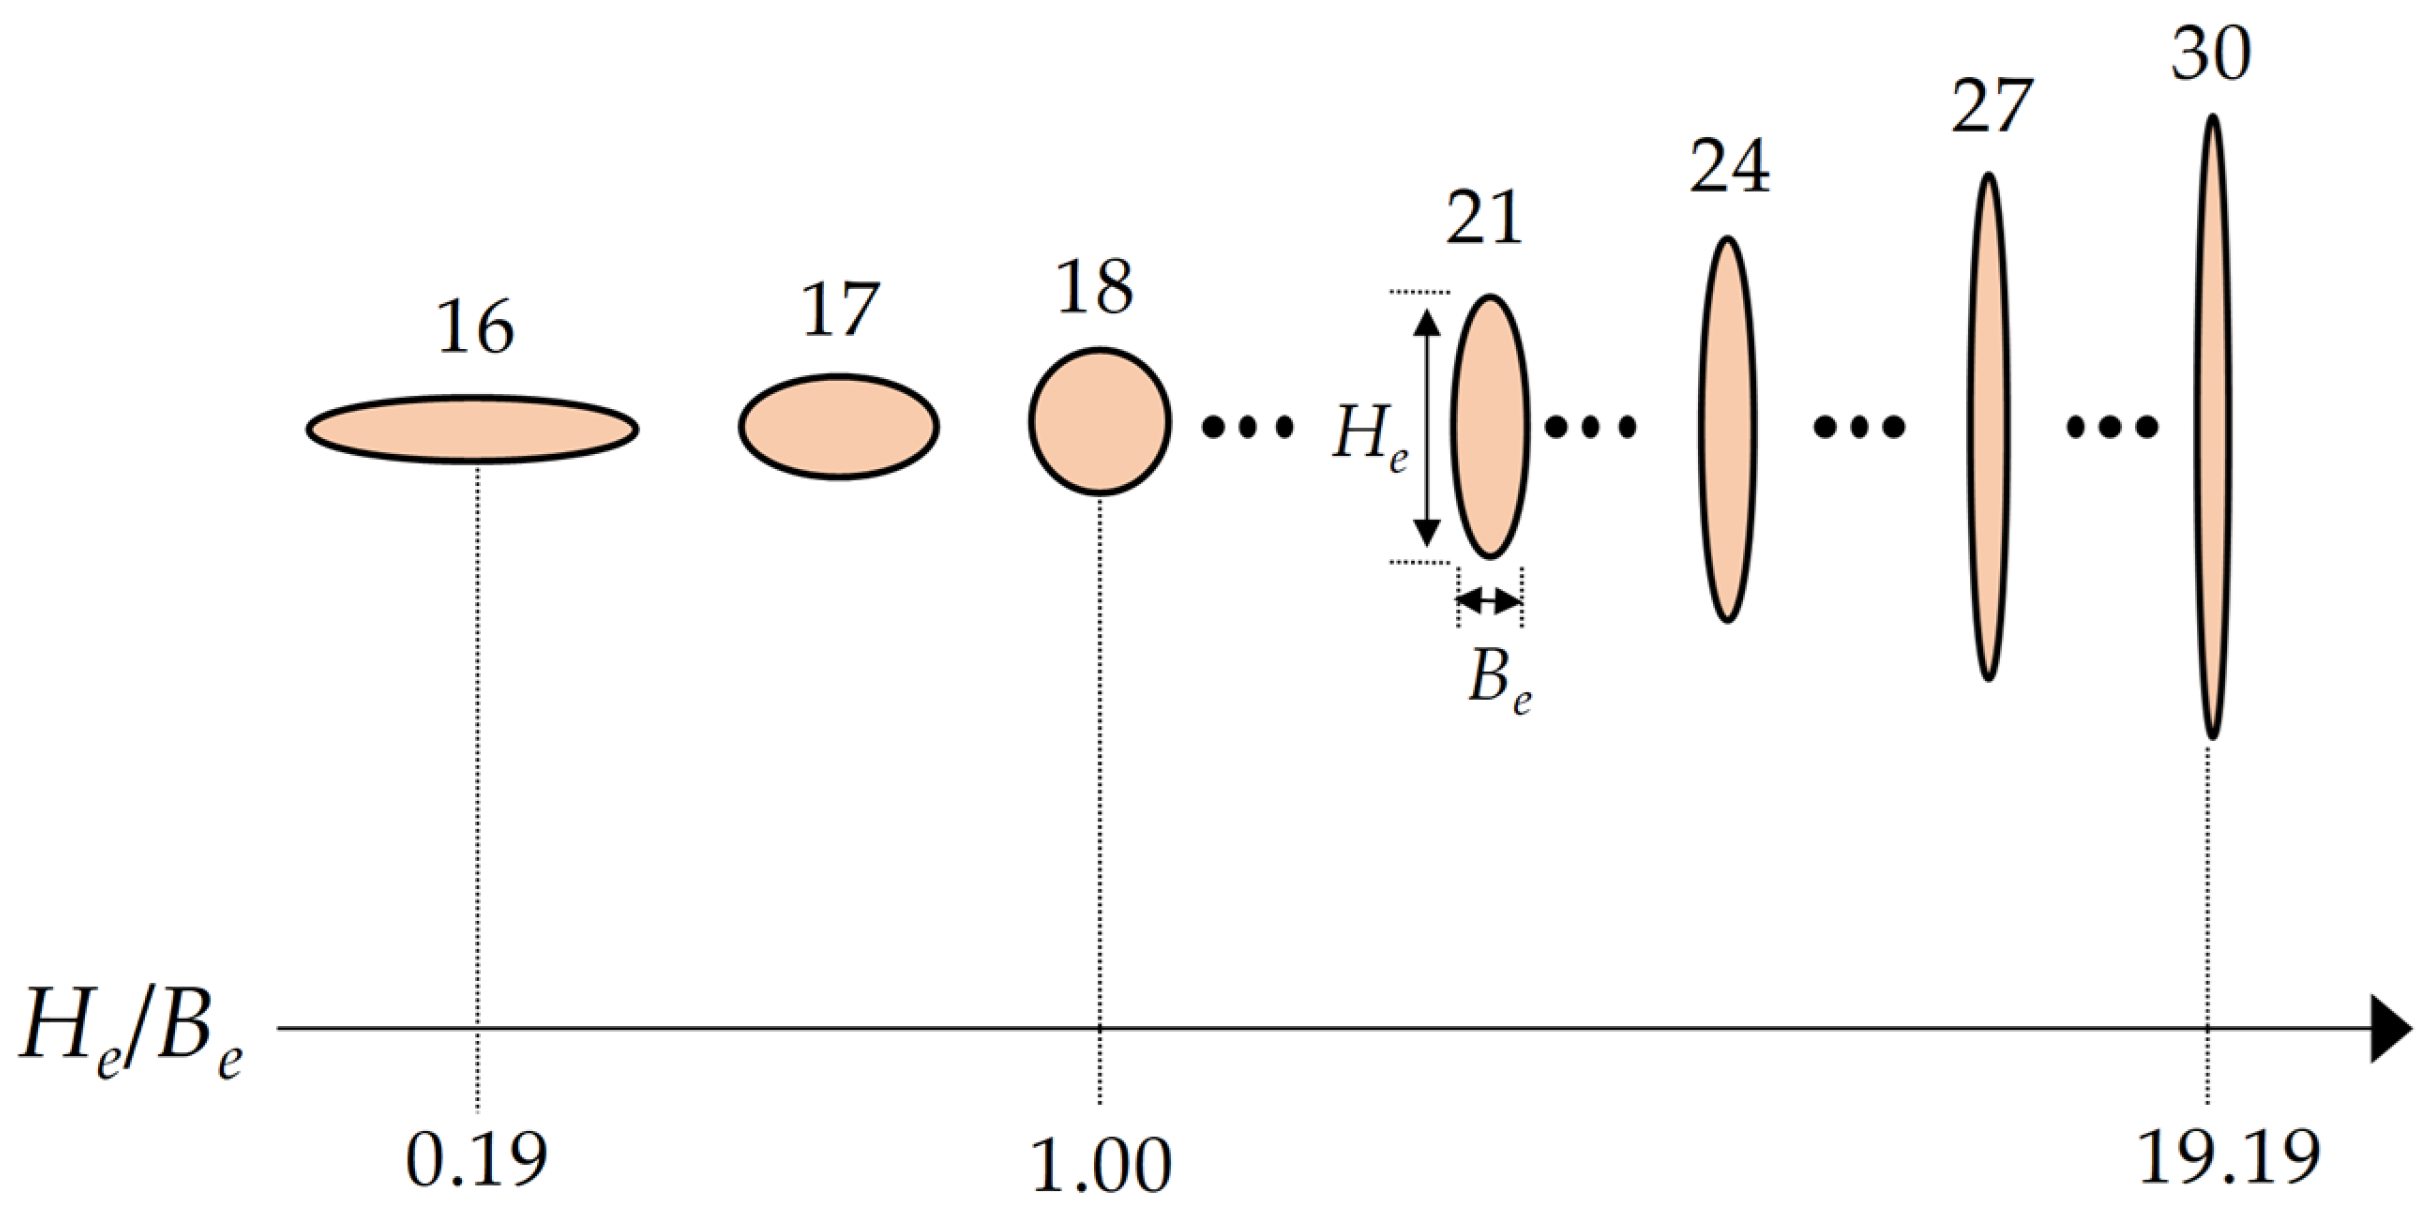
Similarly, for the ratio r 2 , fifteen values were evaluated (see Table 3). Based on these ratios and the PCM volume for the elliptical cross-section, defined by the following:
V PCM = π 4 B e H e d duct 2 L PCM ,
the corresponding values of B e and H e were determined, as shown in Table 3. In Figure 9, the different elliptical cross-section configurations analyzed are shown.

3. Numerical Modeling

In this section, the numerical modeling procedures employed in the present study are described. First, the solution configuration is presented, including the solver settings and numerical schemes used to simulate the system. Subsequently, the mesh independence test is discussed to ensure that the results are not influenced by the spatial discretization. The validation and verification of the numerical model for the GAHE are then presented, followed by the validation and verification of the GAHE model coupled with PCM. This detailed description provides confidence in the accuracy and reliability of the numerical simulations and establishes the basis for the analysis of the results presented in subsequent sections.

3.1. Solution Configuration

The numerical solution of the mathematical model was carried out in Fluent, which employs the Finite Volume Method (FVM). The Coupled algorithm was utilized for the transient, pressure-based solution. Spatial discretization of the governing equations was performed with a second-order upwind scheme, while a first-order implicit scheme was selected for the temporal formulation. Convergence thresholds were set to 10 6 for energy and 10 3 for all other variables, mass, momentum, turbulent kinetic energy, and dissipation rate [37,44,53].
The numerical simulations performed in this study encompass a two-year duration. Using a time step of 3600 s, a total of 17,520 steps was executed, with a maximum of 200 iterations per step, as in Rodrigues et al. [53]. The analysis focused on the second year, while the first year was used to allow ground temperatures to stabilize [7,9,44].

3.2. Mesh Convergence Study

For the mesh convergence study, three structured meshes having sizes of 125,000, 444,800, and 726,000 hexahedral computational cells (volumes) were generated. The absolute relative difference ( A R D ) is defined as
A R D = M j M j 1 M j 1 ,
where M j and M j 1 denote the values of a given variable obtained with the current and the previous mesh refinements, respectively. This criterion was employed to evaluate mesh convergence. Table 4 and Table 5 present the area-weighted mean air temperature at the duct outlet and the static pressure at the duct inlet, measured at 0 h on the final day of the simulation at each mesh refinement level.
As shown in Table 4, by increasing the number of mesh volumes 444,800 to 726,000, the temperature A R D was reduced to 0.99 × 10 4 , which is below the established convergence criterion of 1 × 10 4 in this case.
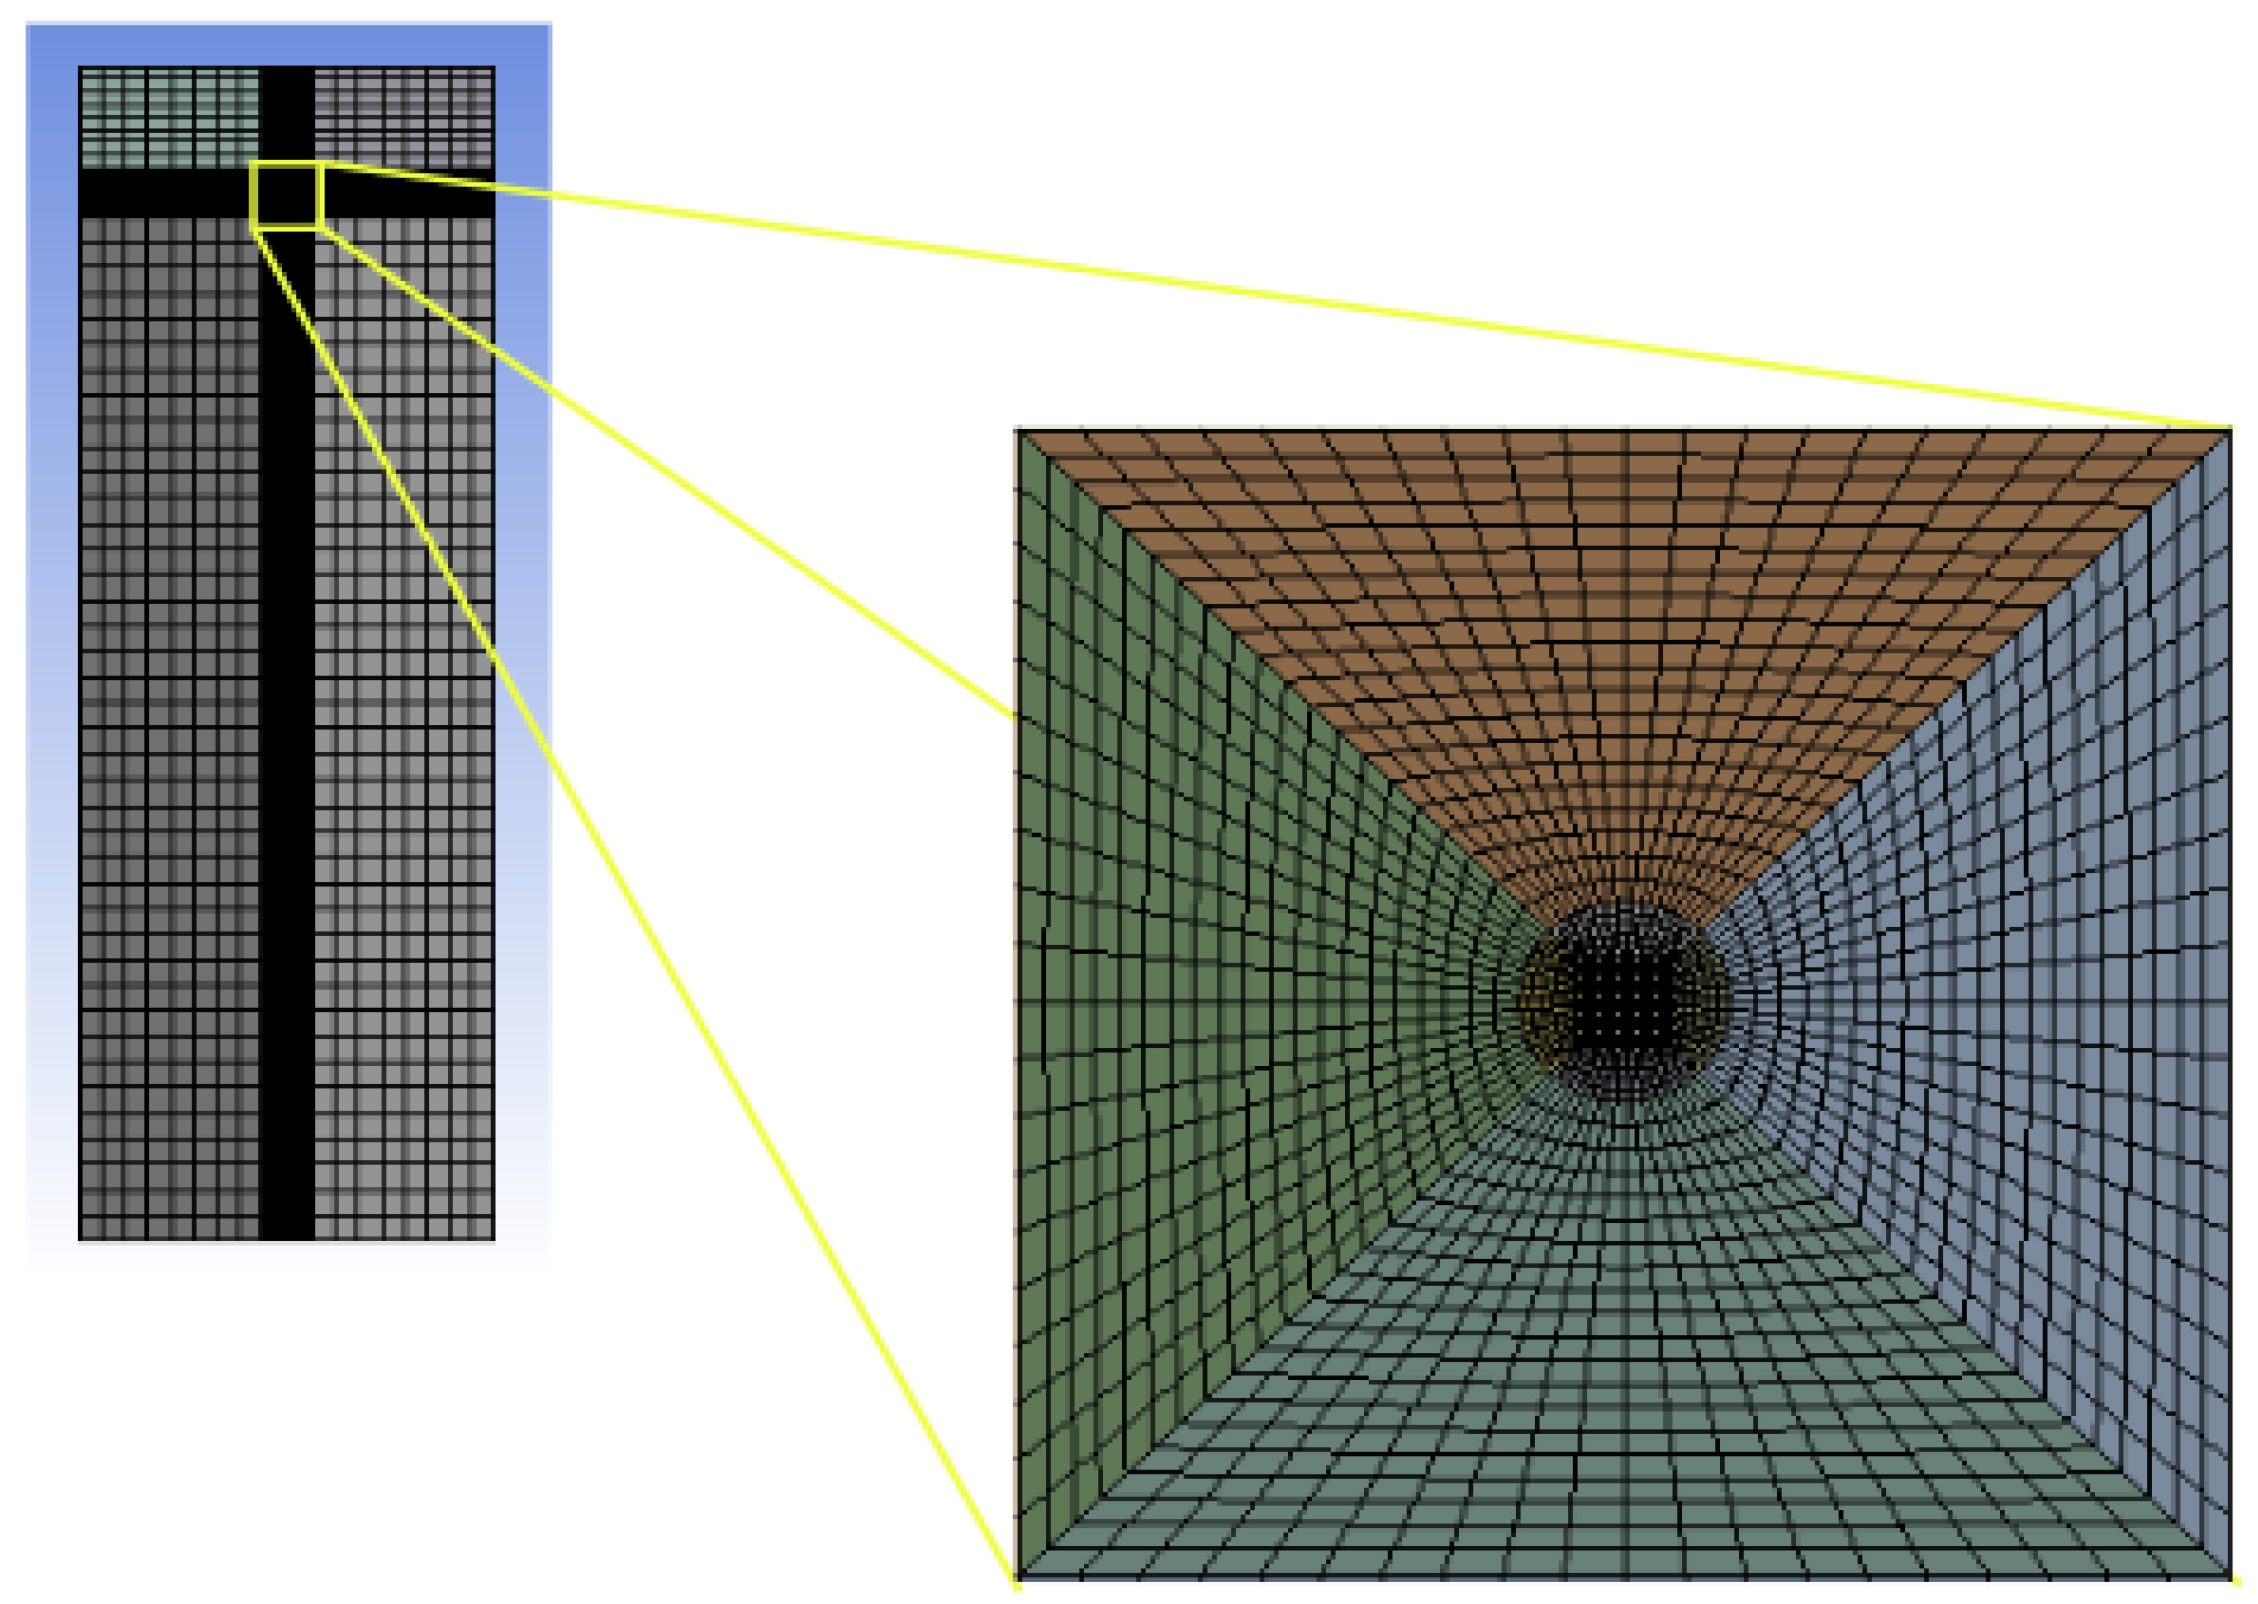
As can be seen in Table 5, the pressure A R D was 0.2 × 10 4 when increasing the number of volumes from 444,800 to 726,000. Therefore, it can be inferred that the mesh with 444,800 volumes provides sufficient accuracy for simulating the TCSA-MMF in this work. Figure 10 illustrates this mesh.
In addition to the mesh convergence test, a time-step independence analysis was conducted to evaluate the transient stability of the model. Three time steps were considered: 1800 s, 3600 s, and 7200 s, while maintaining the mesh with 444,800 volumes. The average outlet air temperatures obtained for each case are presented in Table 6. It can be observed that the absolute relative difference between the results for the 3600 s and 7200 s time steps was lower than 1 × 10 5 , indicating that a time step of 3600 s is adequate to accurately represent the transient behavior of the TCSA-MMF system without compromising the simulation accuracy.

3.3. GAHE Numerical Model Verification and Validation

Validation of the computational GAHE model developed in this study was based on experimental data from Vaz et al. [54], collected in 2007 in Viamão, Rio Grande do Sul, Brazil. Additionally, a complementary verification was conducted by comparing the present findings with the numerical predictions reported by Rodrigues et al. [53] for the same location.
To clarify the level of consistency between the input data used in the validation and verification of the model and the reference studies, Table 7 summarizes the main parameters adopted in Vaz et al. [54], Rodrigues et al. [53], and in the present work. As shown, except for the number of ducts (three in previous studies versus one in the present configuration), all geometric parameters, boundary conditions, soil thermal properties, and climate inputs were retained from the referenced studies, ensuring methodological consistency. This alignment enables a fair comparative evaluation of model performance.
For these comparisons, the Pearson correlation coefficient (r), the mean absolute error (MAE), the root mean square error (RMSE), and the mean absolute percentage error (MAPE) were employed. Additional information on these statistical metrics is available in Wilks [59].
Qualitatively, an adequate match is observed between the numerical results of this study and the experimental measurements reported by Vaz et al. [54], exhibiting similar thermal behavior trends, as shown in Figure 11. However, the numerical predictions slightly underestimated the experimental values. The discrepancies are quantified by MAE = 2.02 °C, RMSE = 2.28 °C, MAPE = 9.18%, and r = 0.96.
It should be emphasized that the model proposed in this research considers only one duct, whereas the study by Vaz et al. [54] used three ducts placed in close proximity to each other, which may have influenced the thermal response of the analyzed pipe and, consequently, contributed to the observed discrepancies.
Moreover, as shown in Figure 11, the findings of the present research agree well with the numerical results reported by Rodrigues et al. [53]. A comparison between the duct outlet temperatures obtained by Rodrigues et al. [53] and those predicted by the current model yields MAE = 0.48 °C, RMSE = 0.55 °C, MAPE = 2.38%, and r = 0.998.
Unlike the present research, Rodrigues et al. [53] employed three ducts, which partially explains the discrepancies observed. Nevertheless, the proposed computational model is considered validated and verified, enabling this numerical approach to be employed to forecast the thermal performance of the GAHE.

3.4. Validation and Verification of the GAHE-PCM Computational Model

The validation of the GAHE-PCM numerical model proposed in this study was carried out based on experimental data obtained from an indoor facility built in Chongqing, China, by Zhou et al. [35]. Additionally, a verification was performed, in which the simulation results from the present research were benchmarked against the numerical predictions of the model by Zhou et al. [35].
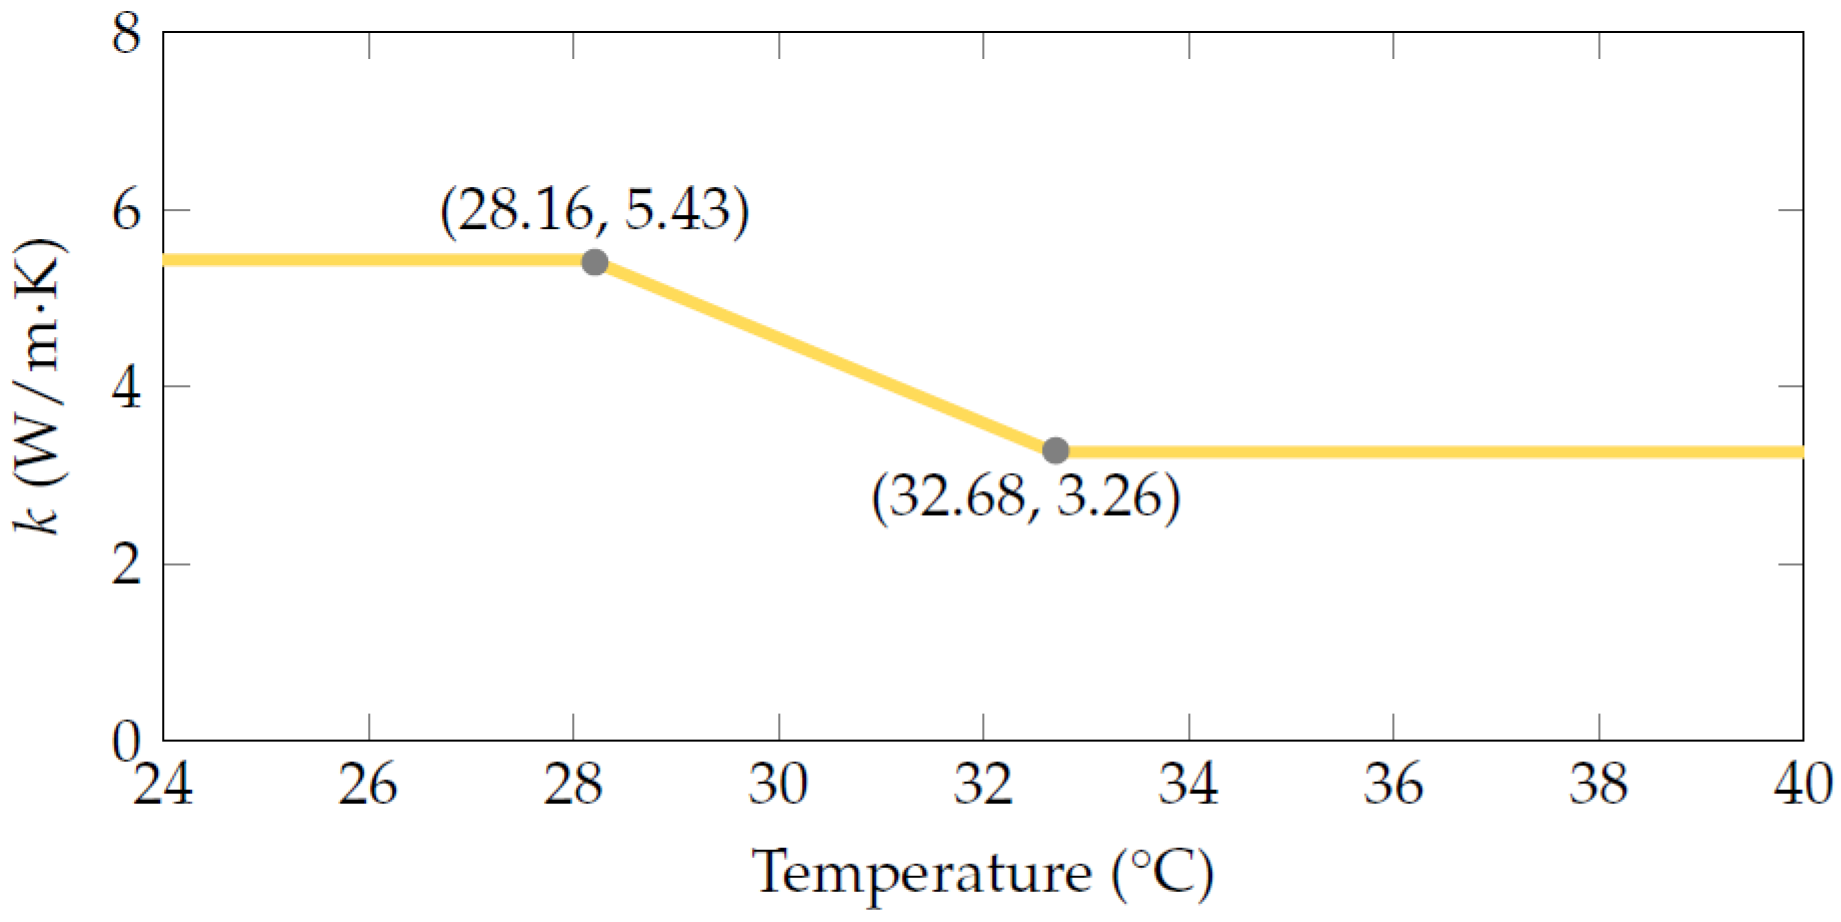
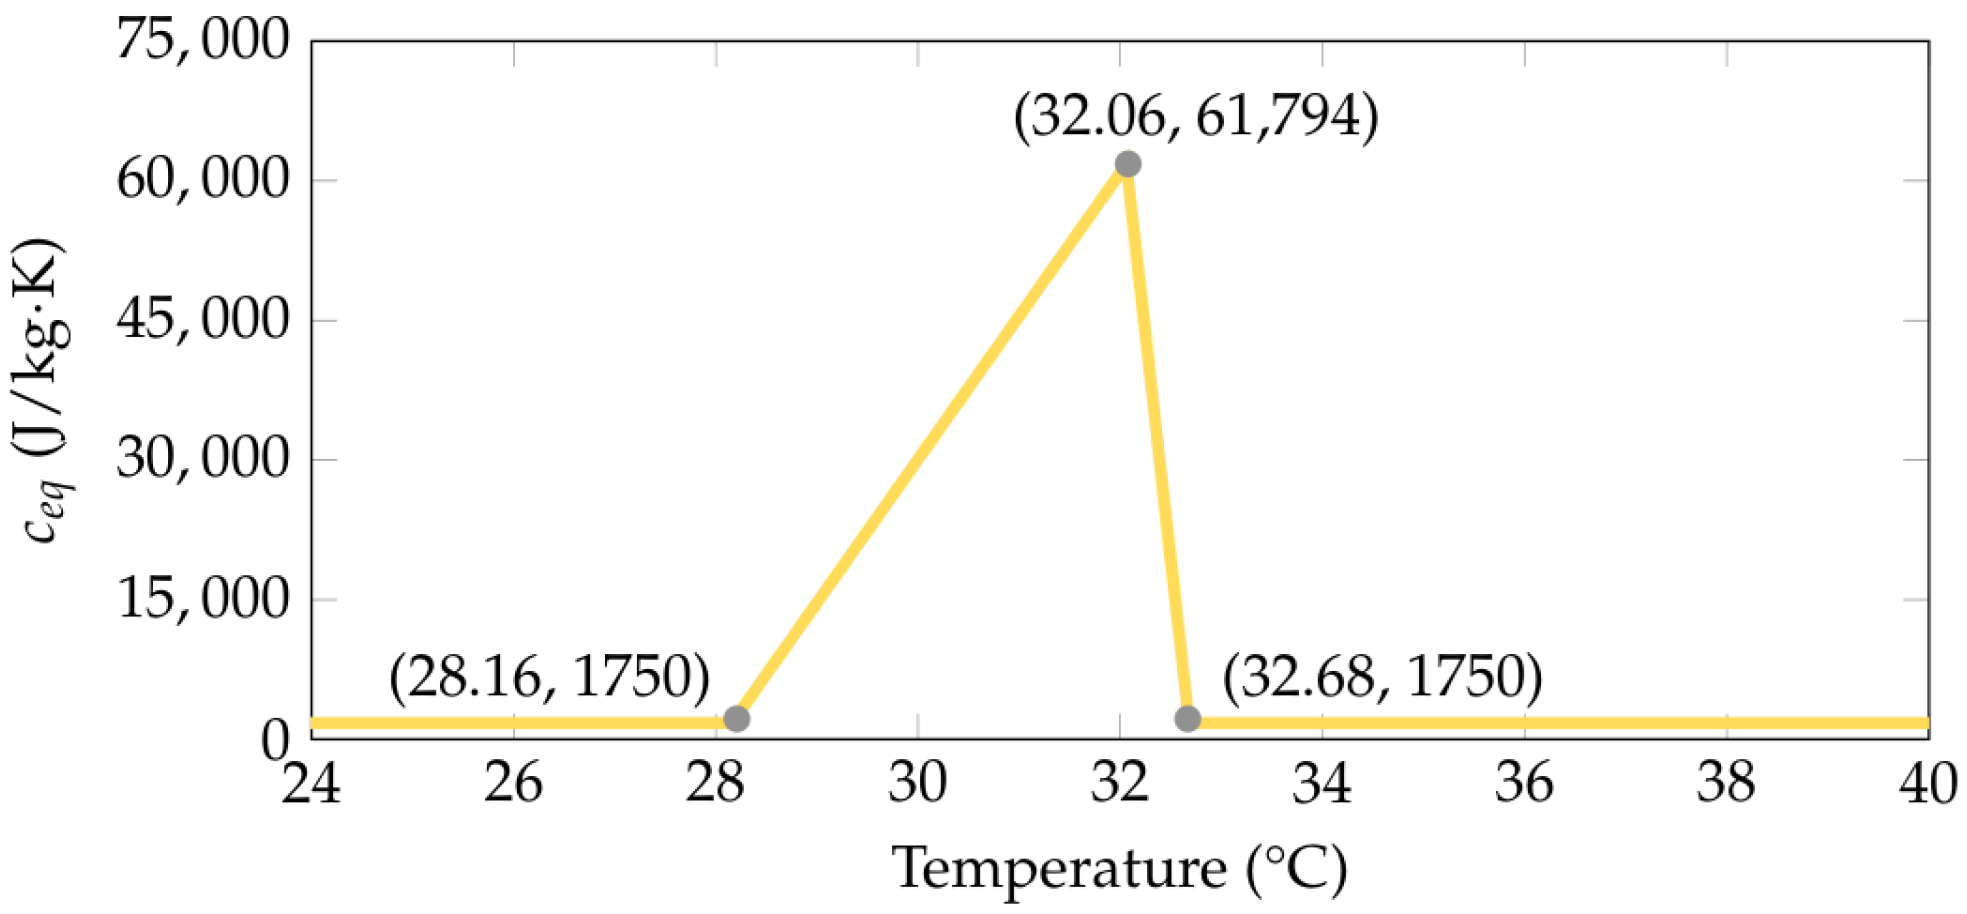
Regarding the validation, the computational domain was defined with dimensions H S = 10.00 m, W S = 6.00 m, and L S = L duct = 25 m. The duct, with a diameter of d duct = 50.8 cm, was installed at a depth of h = 1.50 m. The cylindrical annular PCM has a thickness of e = 25.4 cm. The thermophysical parameters of air, moist sand, and PCM employed in this validation are identical to those used in the experiment conducted by Zhou et al. [35] (see Table 8). The PCM corresponds to a composite material composed of capric acid–palmitic acid/expanded graphite (CA–PA/EG). Figure 12 and Figure 13 present the thermal conductivity and equivalent specific heat curves of the CA–PA/EG mixture, respectively, based on Zhou et al. [35].
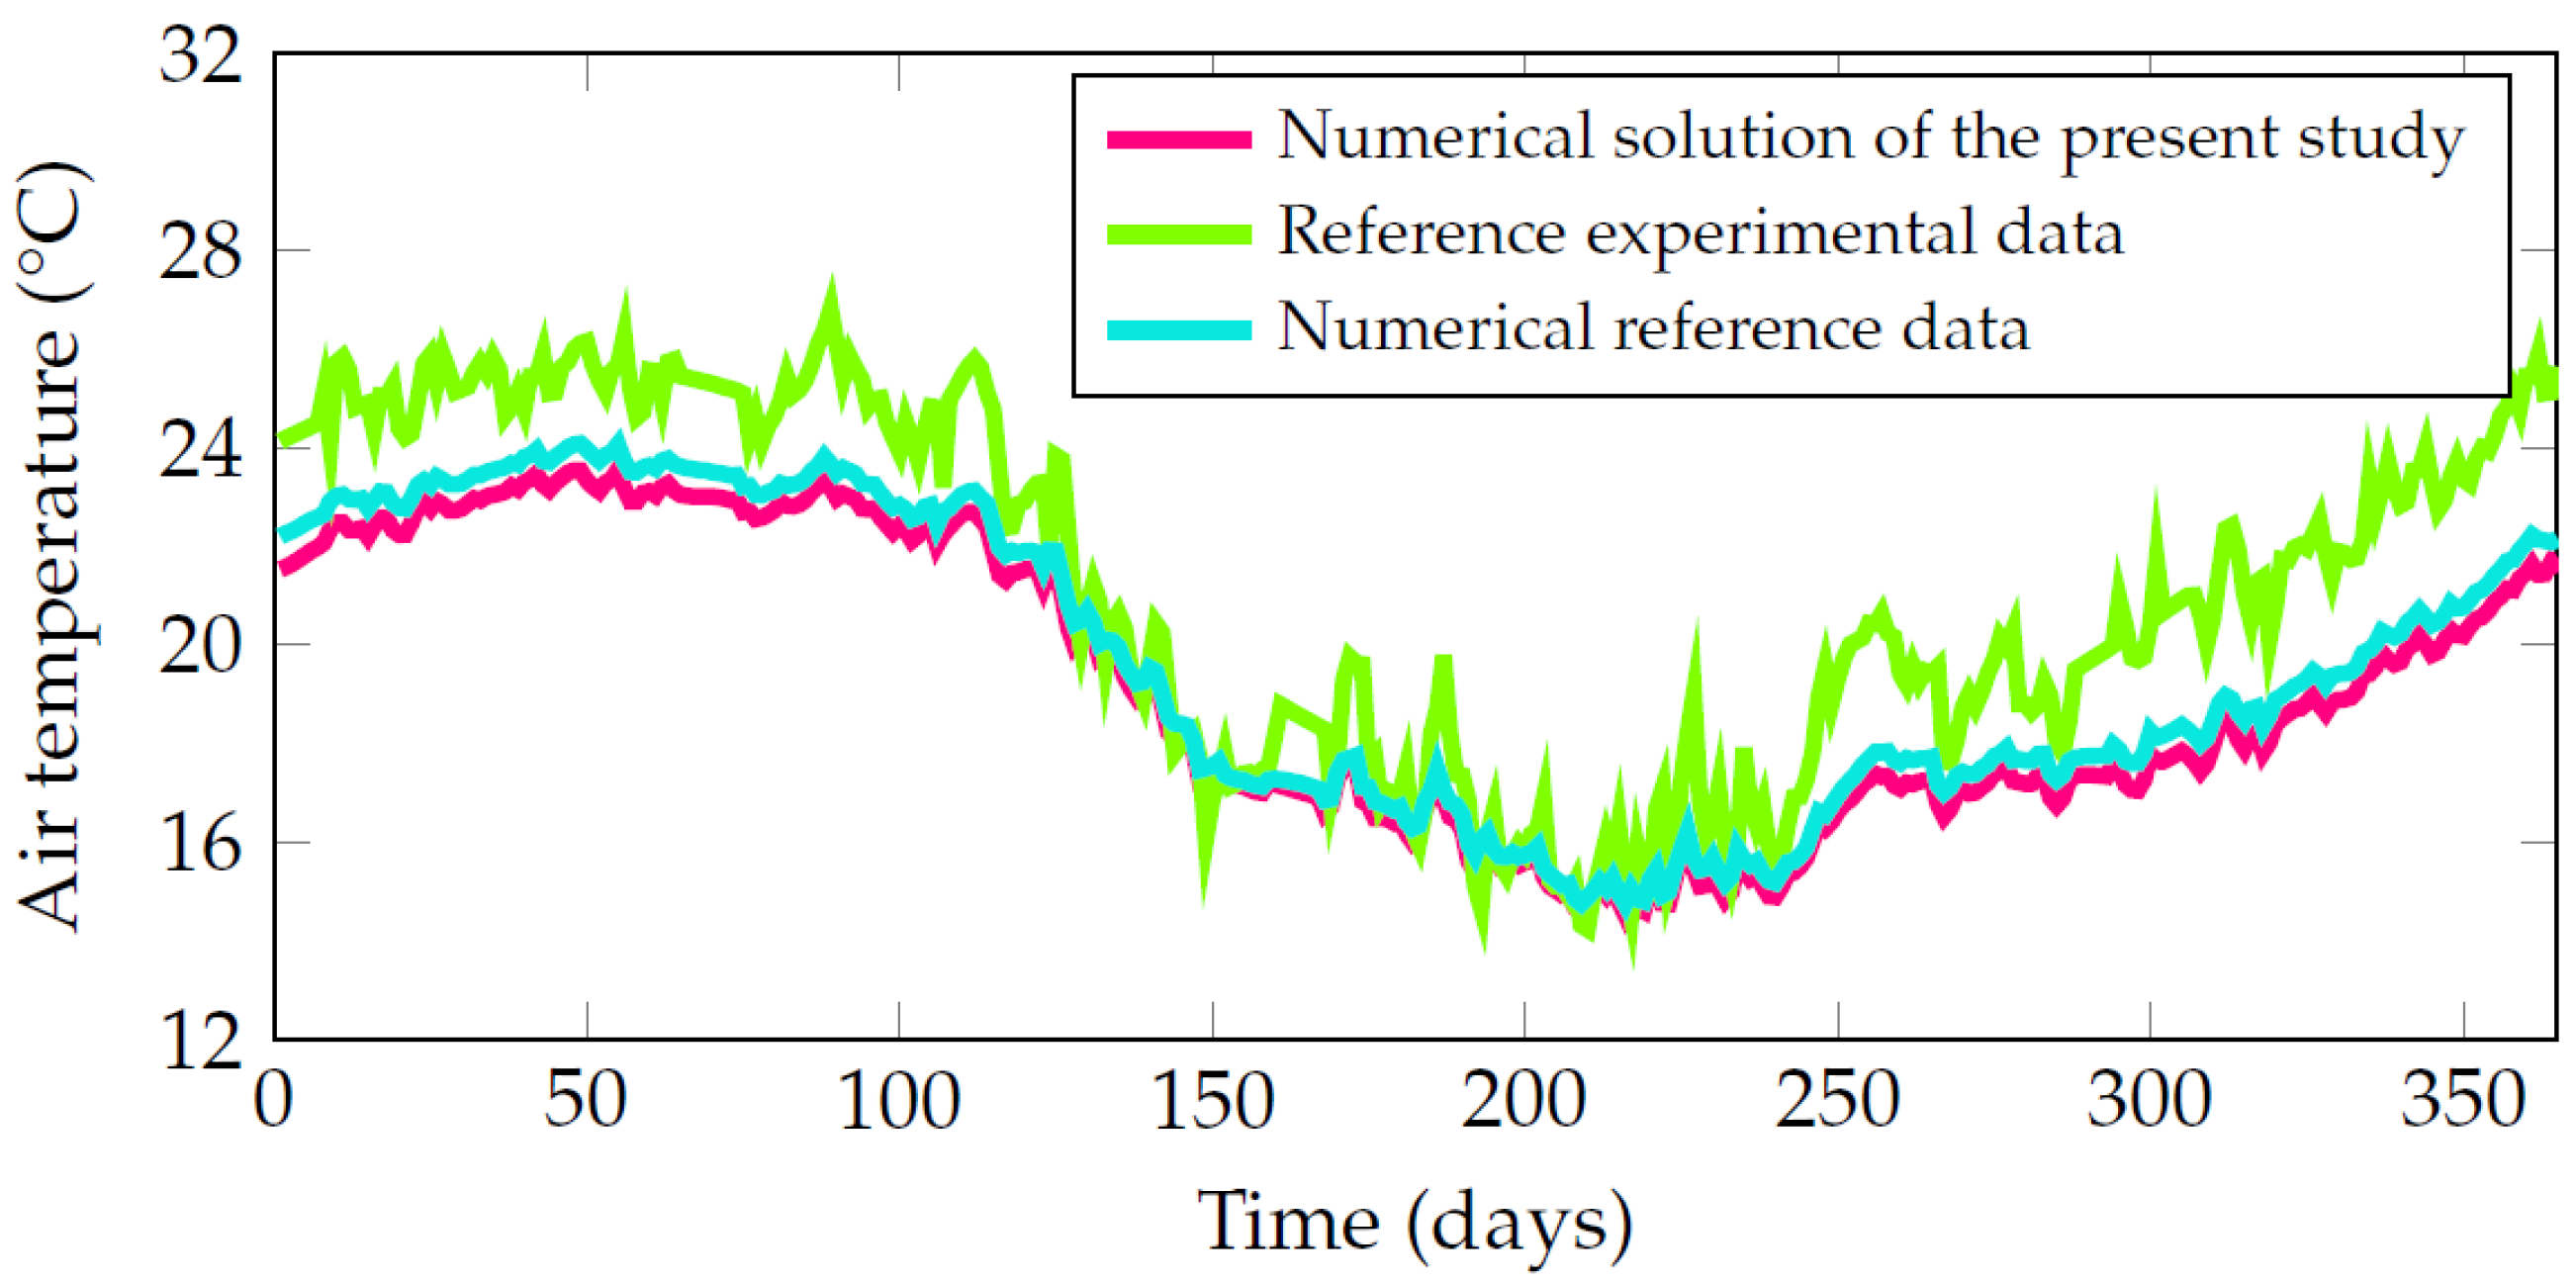
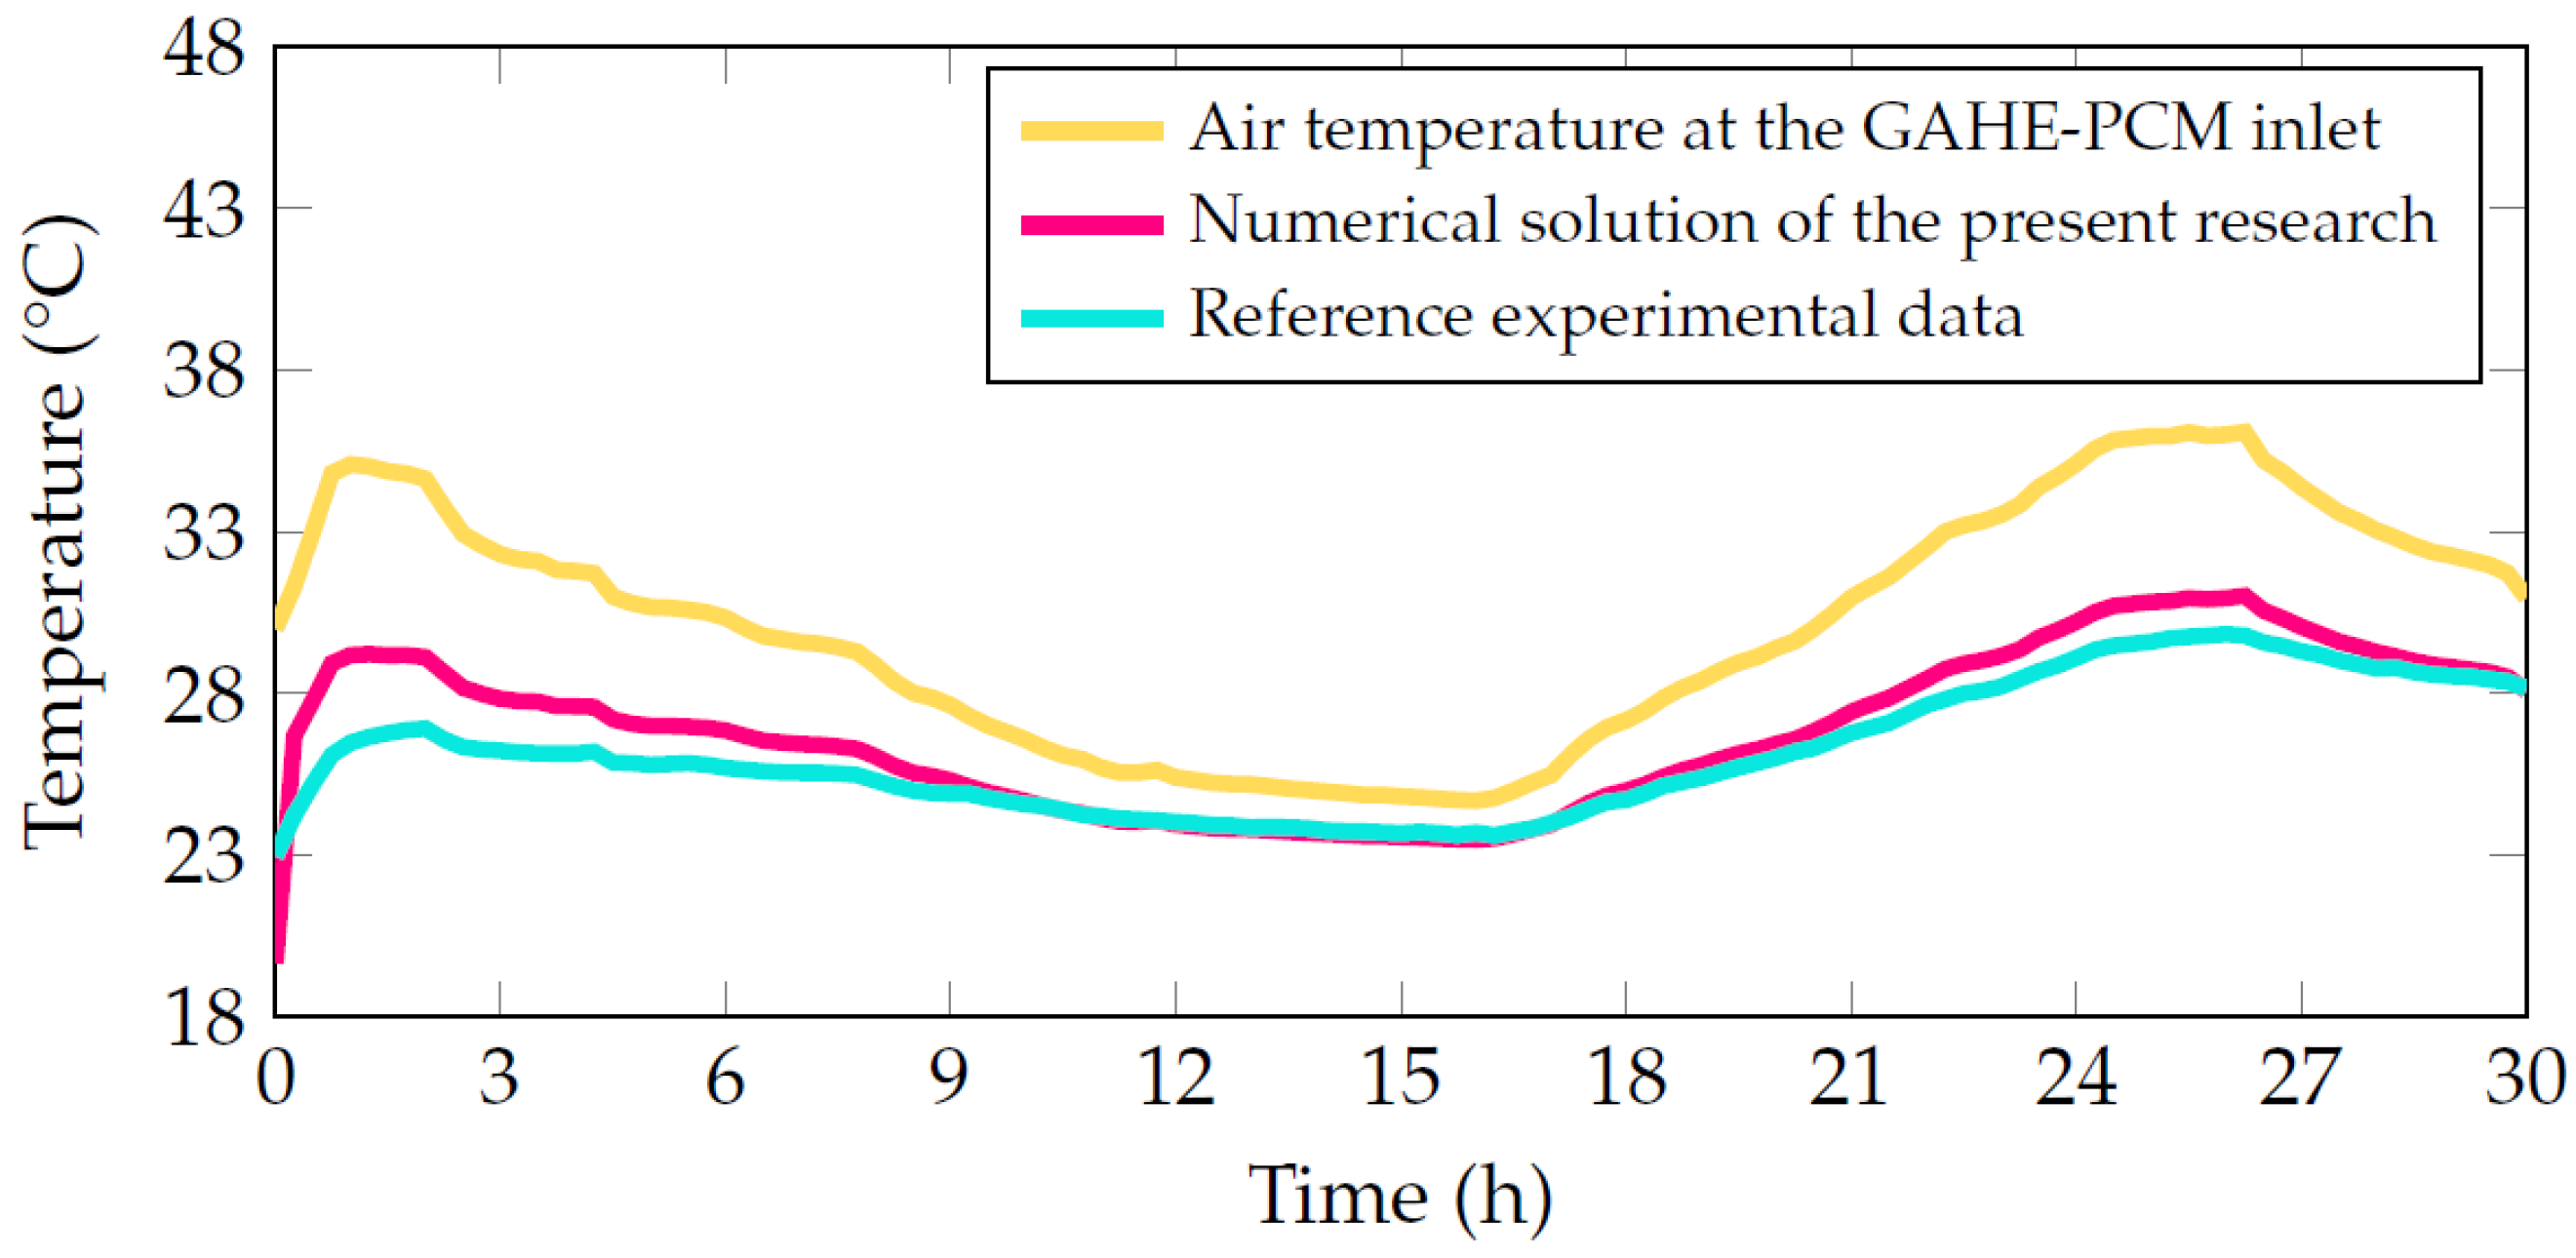
Regarding the boundary conditions, an airflow velocity of 2.02 m/s was set at the duct inlet. Additionally, based on the atmospheric air temperature data for Chongqing, obtained by digitizing an image from Zhou et al. [35] (Figure 14), a prescribed temperature was defined for the air at the pipe inlet and on the top surface of the computational domain. At the pipe outlet, atmospheric pressure was set, while the remaining boundaries were considered adiabatic.
For the initial conditions, the model was considered to initially be at 19.66 °C. Finally, the Fluent setup described in Section 3.1 was employed, except the simulation time was set to 30 h. In this context, a time step of 60 s was used, totaling 1800 steps.
As illustrated in Figure 14, a close agreement was observed between the air outlet temperatures recorded in the experiment by Zhou et al. [35] and the numerical simulation outcomes of the present research, with MAE = 0.78 °C, RMSE = 1.05 °C, MAPE = 2.91%, and r = 0.95.
For the verification of the GAHE-PCM numerical model, the same computational domain dimensions and thermophysical parameters of air and the CA–PA/EG material (see Table 8) used in the system validation were employed. For the soil, the specific properties of Chongqing, also listed in Table 8, were adopted. In this case, the pipe has a diameter of d duct = 30 cm and was installed at a depth of h = 1.50 m. The cylindrical annular PCM was assigned a thickness of e = 20 cm.
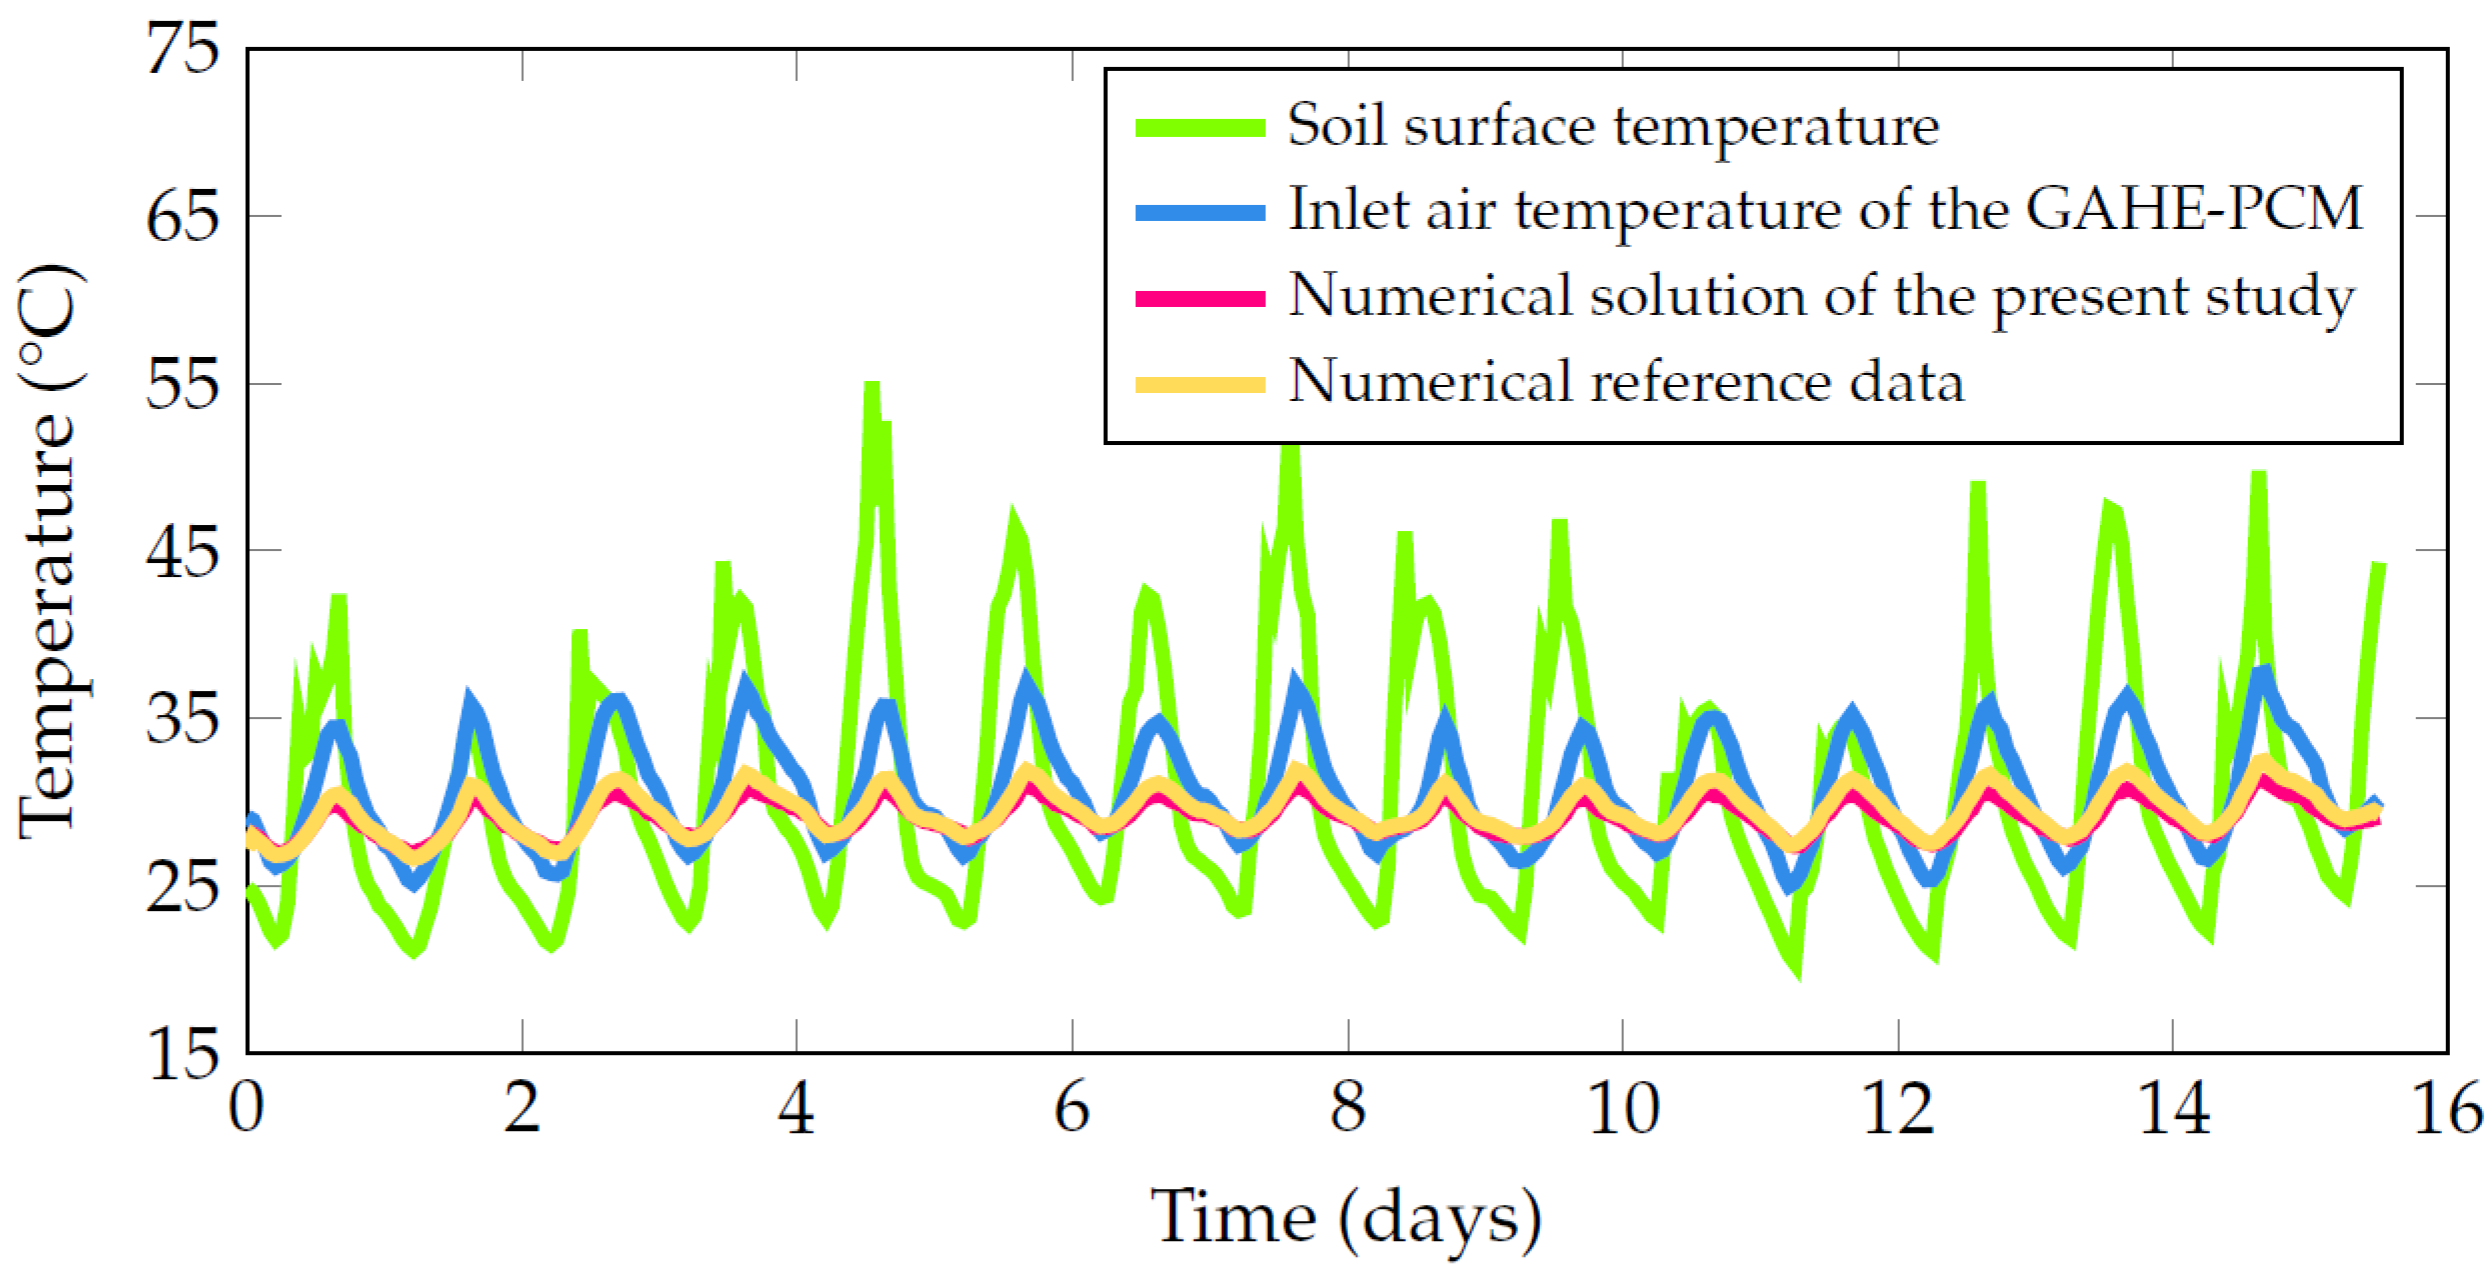
Regarding the boundary conditions, a prescribed air temperature at the duct inlet was defined based on atmospheric air temperature data for Chongqing from the period between 25 July and 9 August, extracted from Zhou et al. [35], and presented in Figure 15. Additionally, an air velocity of 2 m/s was imposed at this inlet. Similarly, soil surface temperature data for Chongqing during the same period, also shown in Figure 15, were adopted as the prescribed temperature variation at the top face of the computational domain.
For the bottom surface of the model, a temperature of 19.66 °C was prescribed, corresponding to the constant ground temperature in Chongqing at depths beyond 10 m, as indicated by Zhou et al. [35]. At the duct outlet, atmospheric pressure was assumed. In contrast, the lateral boundaries, as well as the front and rear faces of the computational domain, were considered thermally adiabatic. For the initial conditions, the entire model was initialized at 27.22 °C [35]. Furthermore, the same Fluent configuration described in Section 3.1 was employed, with a simulation time of 15.5 d. The adopted time step was 600 s, totaling 2232 steps.
Figure 15 presents the outlet temperature in the GAHE-PCM, obtained both from the numerical model of Zhou et al. [35] and from the current research. As illustrated in Figure 15, the results obtained in this study show good agreement with those of Zhou et al. [35], as evidenced by corresponding metrics: MAE = 0.32 °C, RMSE = 0.48 °C, MAPE = 1.30%, and r = 0.99.

4. Results

In this section, the results obtained from the numerical simulations are presented and analyzed. First, the influence of concentric and eccentric PCM arrangements on the thermal potential of the system is evaluated, highlighting the effect of PCM placement on heating and cooling performance. Subsequently, the performance of the rectangular PCM configuration is examined, followed by an analysis of the elliptical PCM configuration. This section provides a detailed comparison of different PCM arrangements and geometries, offering insight into their impact on the thermal behavior of the system.

4.1. Influence of Concentric and Eccentric PCM Arrangements on Thermal Potential

The results of the preliminary evaluation indicate that concentric configurations provide greater improvements in TP compared to eccentric ones.
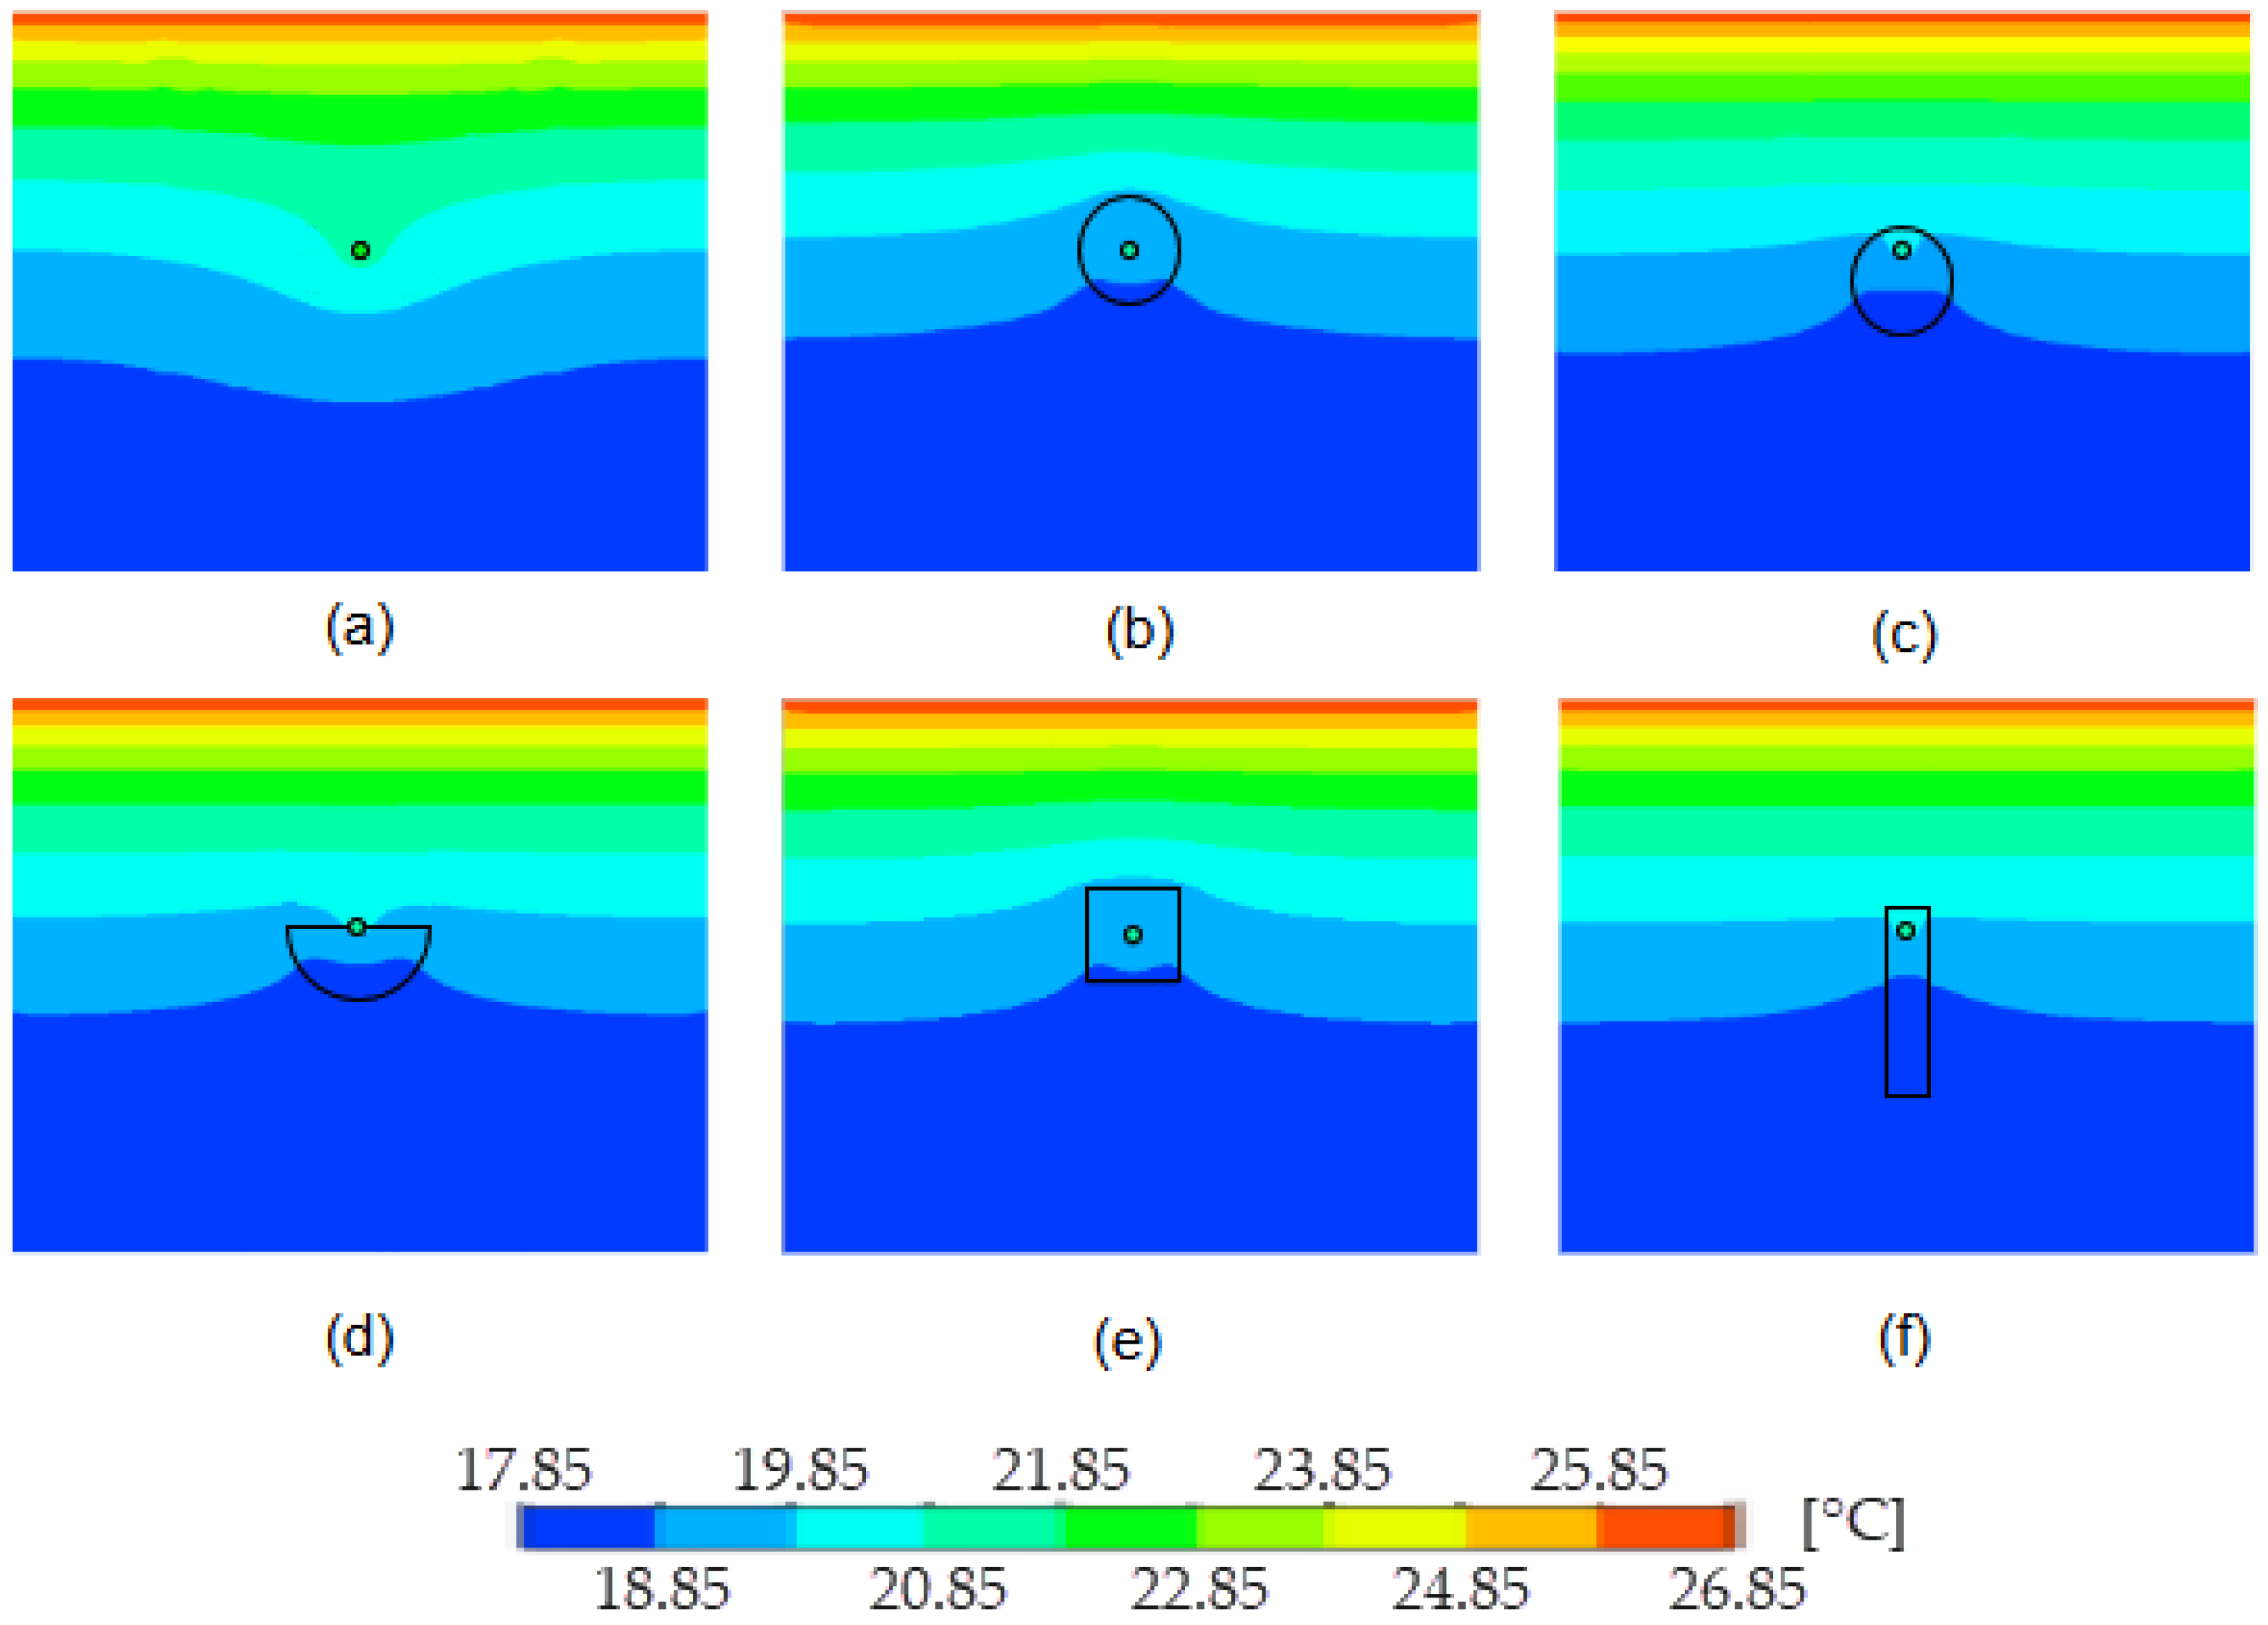
Table 9 summarizes the yearly mean TP for both cooling and heating, considering the reference case (without PCM) and five PCM configurations: concentric circular, eccentric circular, eccentric semicircular, eccentric rectangular, and concentric square (see Figure 7).
In heating mode, the TP increased by 69.31% for both the concentric circular and concentric square configurations, whereas the eccentric configurations presented smaller gains: 66.34% for the eccentric circular, 61.88% for the eccentric semicircular, and 53.47% for the eccentric rectangular configuration. The same tendency was identified in cooling mode, with maximum improvements of 27.56% for the concentric configurations and lower values for the eccentric ones, at 26.15%, 24.03%, and 22.97%, respectively.
These results indicate that, although placing the PCM in deeper soil layers can enhance its interaction with the ground (due to the more stable temperatures), it may also reduce the heat transfer between the air and the PCM (see Figure 16). In particular, the eccentric rectangular configuration (see Figure 16f) exhibited the lowest TP values, as a significant portion of the material was located farther from the air duct.
Therefore, this preliminary assessment supports the choice of concentric configurations for the parametric study involving 15 rectangular section cases and 15 elliptical section cases, which are analyzed in the following subsections.

4.2. Rectangular PCM Configuration

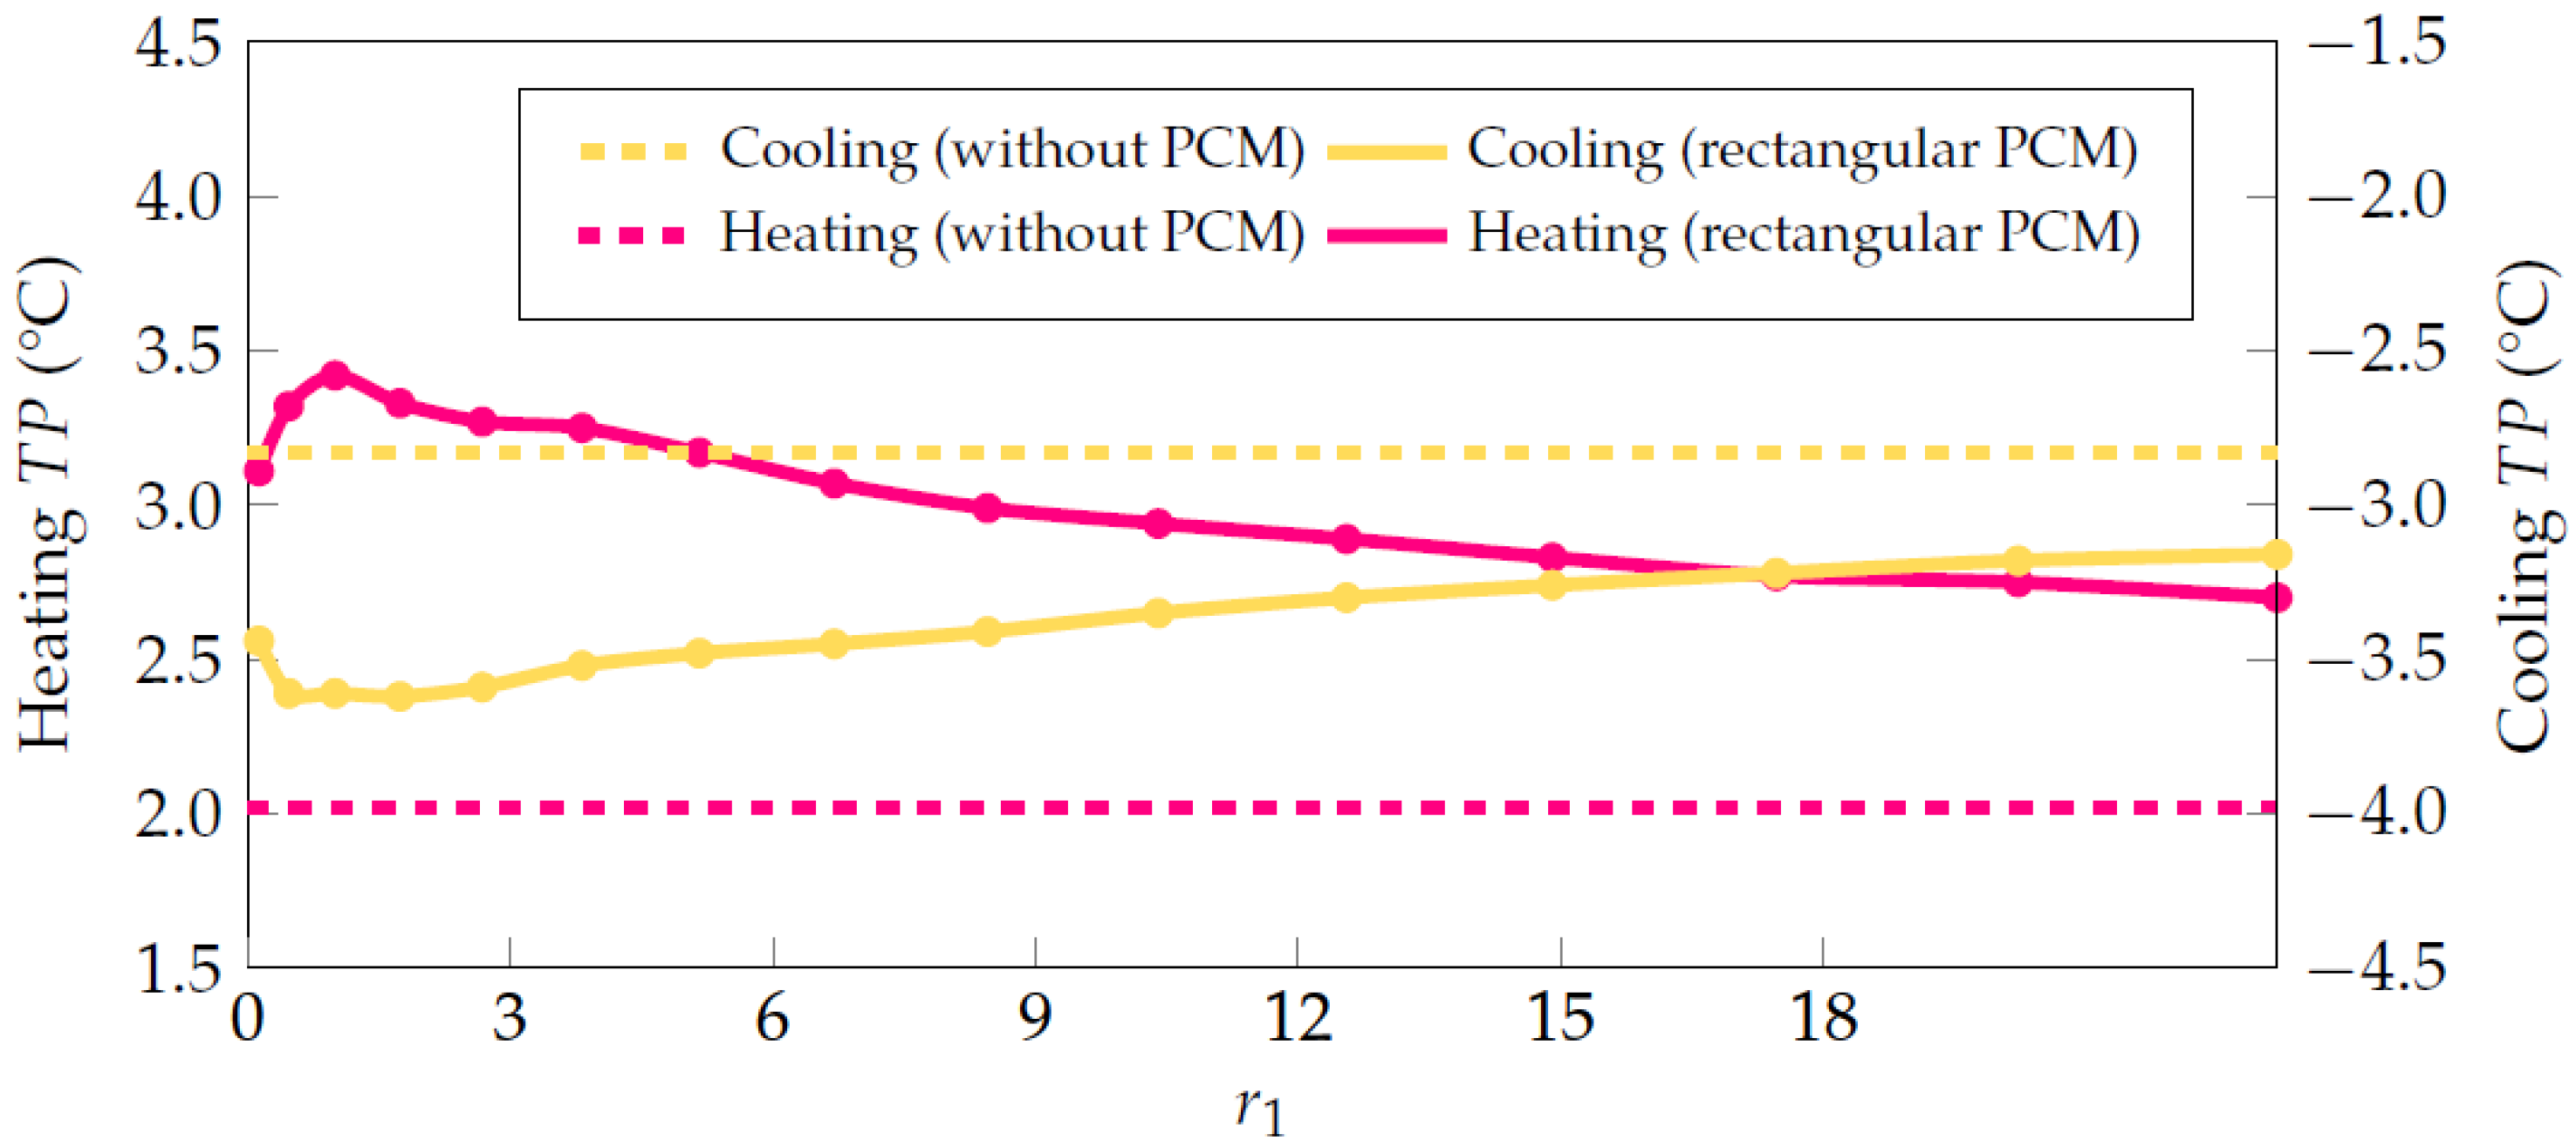
Table 10 presents the yearly mean TP for air cooling and heating for the reference case (GAHE without PCM) and for fifteen geometric configurations of the rectangular cross-section PCM container (see Table 2 and Figure 8). It can be observed that the inclusion of PCM substantially improves the TP in heating mode. The largest improvement was obtained in Case 3 ( r 1 = 1 ), which corresponds to a square cross-section configuration, with an annual average TP of 3.42 °C, representing a 69.31% improvement compared to the reference case (2.02 °C). This indicates that a square container cross-section optimizes heat transfer during heating mode.
Cases with ratios r 1 < 1 (horizontally elongated containers relative to the ground surface, i.e., Cases 1 and 2) show significant improvements, although slightly lower than the optimal case. On the other hand, for ratios r 1 > 1 (vertically elongated containers relative to the ground surface, i.e., Cases 4 to 15), the improvement decreases progressively, reaching only 33.66% in Case 15 ( r 1 = 23.18 ). This behavior suggests that excessive relative height limits the effectiveness of the PCM in heat exchange with the duct air.
Figure 17 depicts the behavior of the annual average TP with respect to the ratio r 1 . The results reveal a clear growth trend in TP as r 1 increases, reaching a peak at r 1 = 1 , which corresponds to the square cross-section (Case 3). Beyond this point, further increases in r 1 lead to a progressive decline in this indicator. This behavior indicates that the square configuration represents the optimal geometric condition for maximizing the annual average heating thermal potential.
The justification for this behavior is based on two aspects. First, the lateral area of the PCM container with a square cross-section (Case 3) presents the lowest value among all cases (64.86 m2). As a result, heat losses from the PCM to the surrounding soil are reduced, and a larger fraction of the stored energy is directed towards the airflow, thereby enhancing the heating TP. In contrast, as the aspect ratio r 1 deviates from unity, the perimeter of the container increases and, consequently, the heat exchange surface with the soil becomes larger, which favors a higher fraction of energy being dissipated into the ground. This behavior is consistent with the annual trends reported in Table 10.
Second, the square cross-section minimizes the extreme distances between the duct wall and the outer boundary of the PCM container. This geometric compactness improves the effective participation of the PCM volume in the heat transfer process with the airflow (see Figure 18b). Conversely, highly elongated geometries, either tall and narrow or wide and flat, as shown in Figure 18a,c, push portions of the PCM (particularly in the corners) farther away from the duct. This increases the conductive path length and may create low-activity zones that contribute less to the annual melting/solidification cycle. These combined effects explain the unimodal behavior of TP, with a maximum at r 1 = 1 and the progressive decrease observed in Cases 1–2 and Cases 4–15.
In cooling mode, a similar trend was observed: the annual average TP increases as the aspect ratio r 1 approaches unity and decreases as r 1 deviates from this configuration (Figure 17). The highest improvement was recorded for Case 4, with −3.62 °C, representing a 27.92% rise relative to the reference case (−2.83 °C), considering the absolute value of the P T . Nevertheless, this value is practically indistinguishable from the square cross-section (Case 3, −3.61 °C, 27.56%), reinforcing that both geometries exhibit nearly identical performances. Overall, this behavior can be explained by the same balance identified in heating mode, where reduced soil interaction and enhanced participation of the PCM in the air–PCM exchange maximize system performance. These results indicate that, regardless of the operation mode, geometries close to the square configuration consistently provide the best utilization of the PCM’s thermal storage capacity.
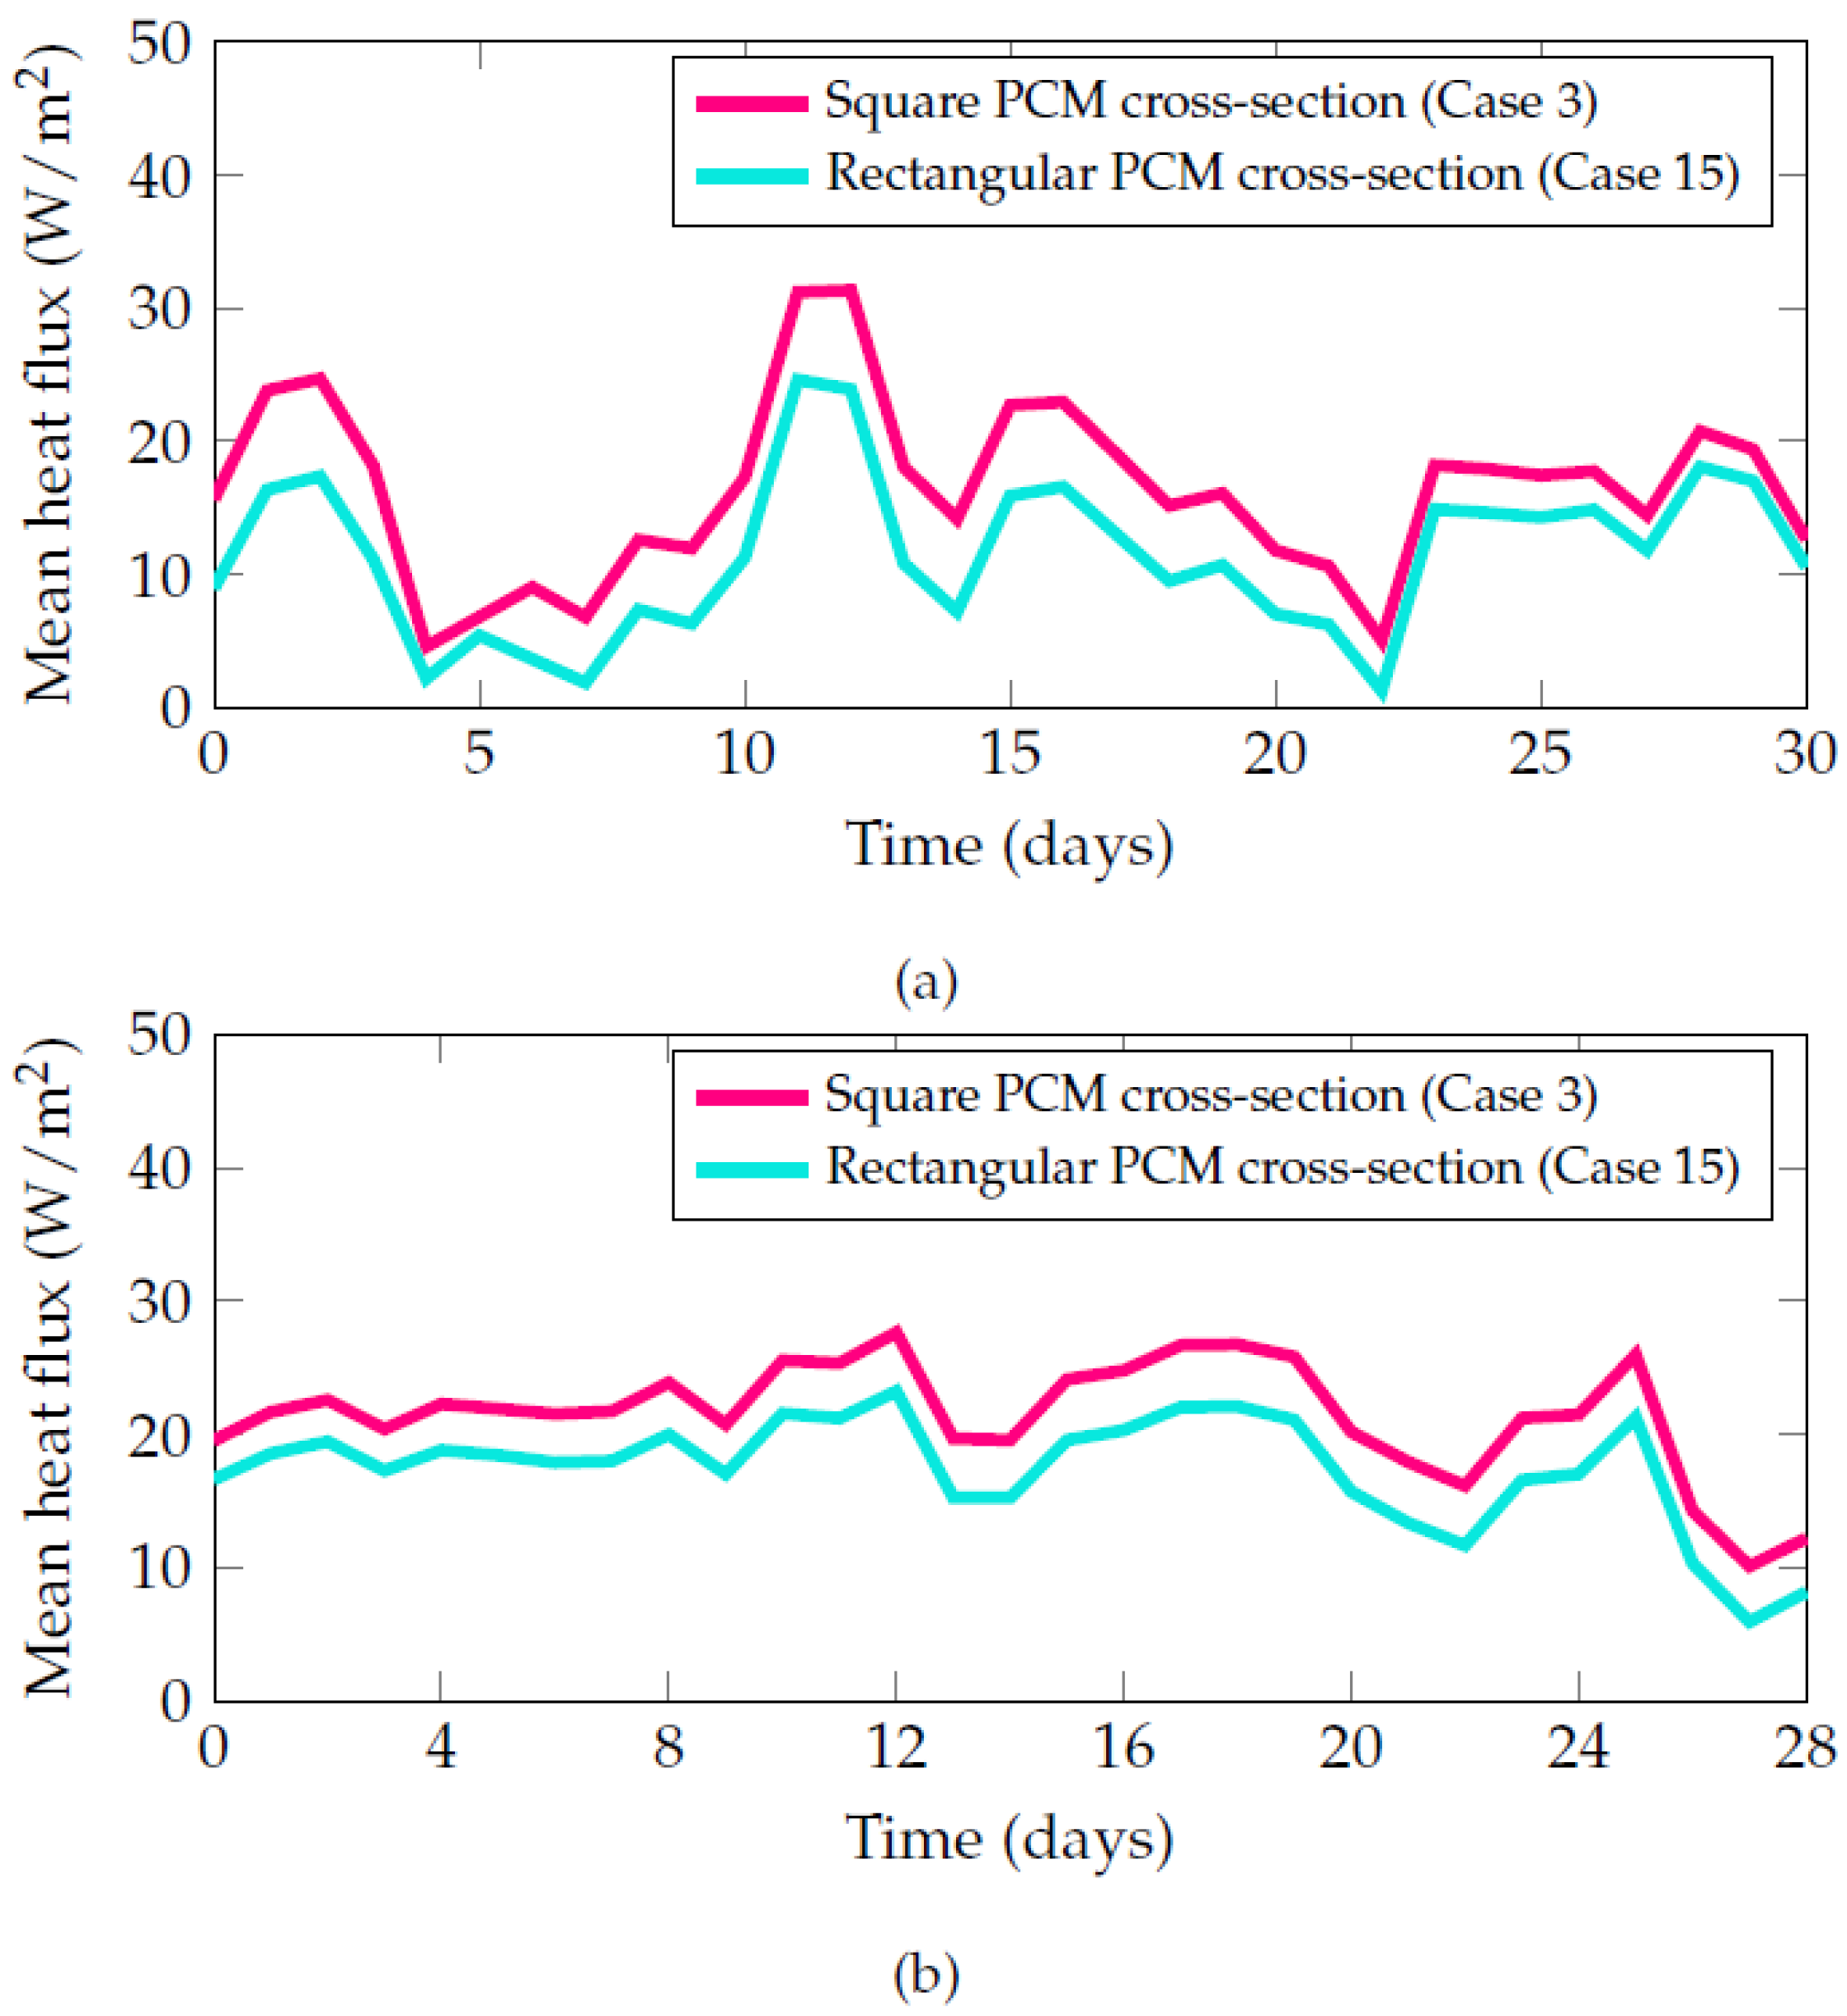
To complement the geometric argument and to explicitly assess the thermal effect of the PCM container shape, an additional analysis was conducted based on the spatially averaged heat flux on the duct wall (W/m2). Two representative rectangular configurations were compared: (i) the square cross-section (Case 3, r 1 = 1 ), which presented the highest annual thermal potential, and (ii) the most elongated configuration (Case 15, r 1 = 23.18 ), associated with the lowest performance.
The annual mean heat flux at the air–duct interface reached 14.77 W/m2 for the square configuration, while Case 15 achieved 13.11 W/m2, corresponding to a 12.67% reduction in heat exchange capability. The contrast becomes more evident when examining the periods of highest thermal activity. In June (winter), Case 3 reached 16.41 W/m2, whereas Case 15 produced only 11.52 W/m2 (42.43% difference). In February (summer), the heat flux reached 21.51 W/m2 for Case 3 and 17.40 W/m2 for Case 15 (23.67% difference).
Figure 19a,b shows the temporal evolution of the heat flux, evidencing that the square configuration consistently maintains higher thermal exchange with the air. These results confirm that the improved thermal performance of the square geometry arises not only from its reduced lateral area but also from enhanced participation of the PCM volume in the air–PCM heat transfer process, limiting thermal dispersion to the surrounding soil.

4.3. Elliptical PCM Configuration

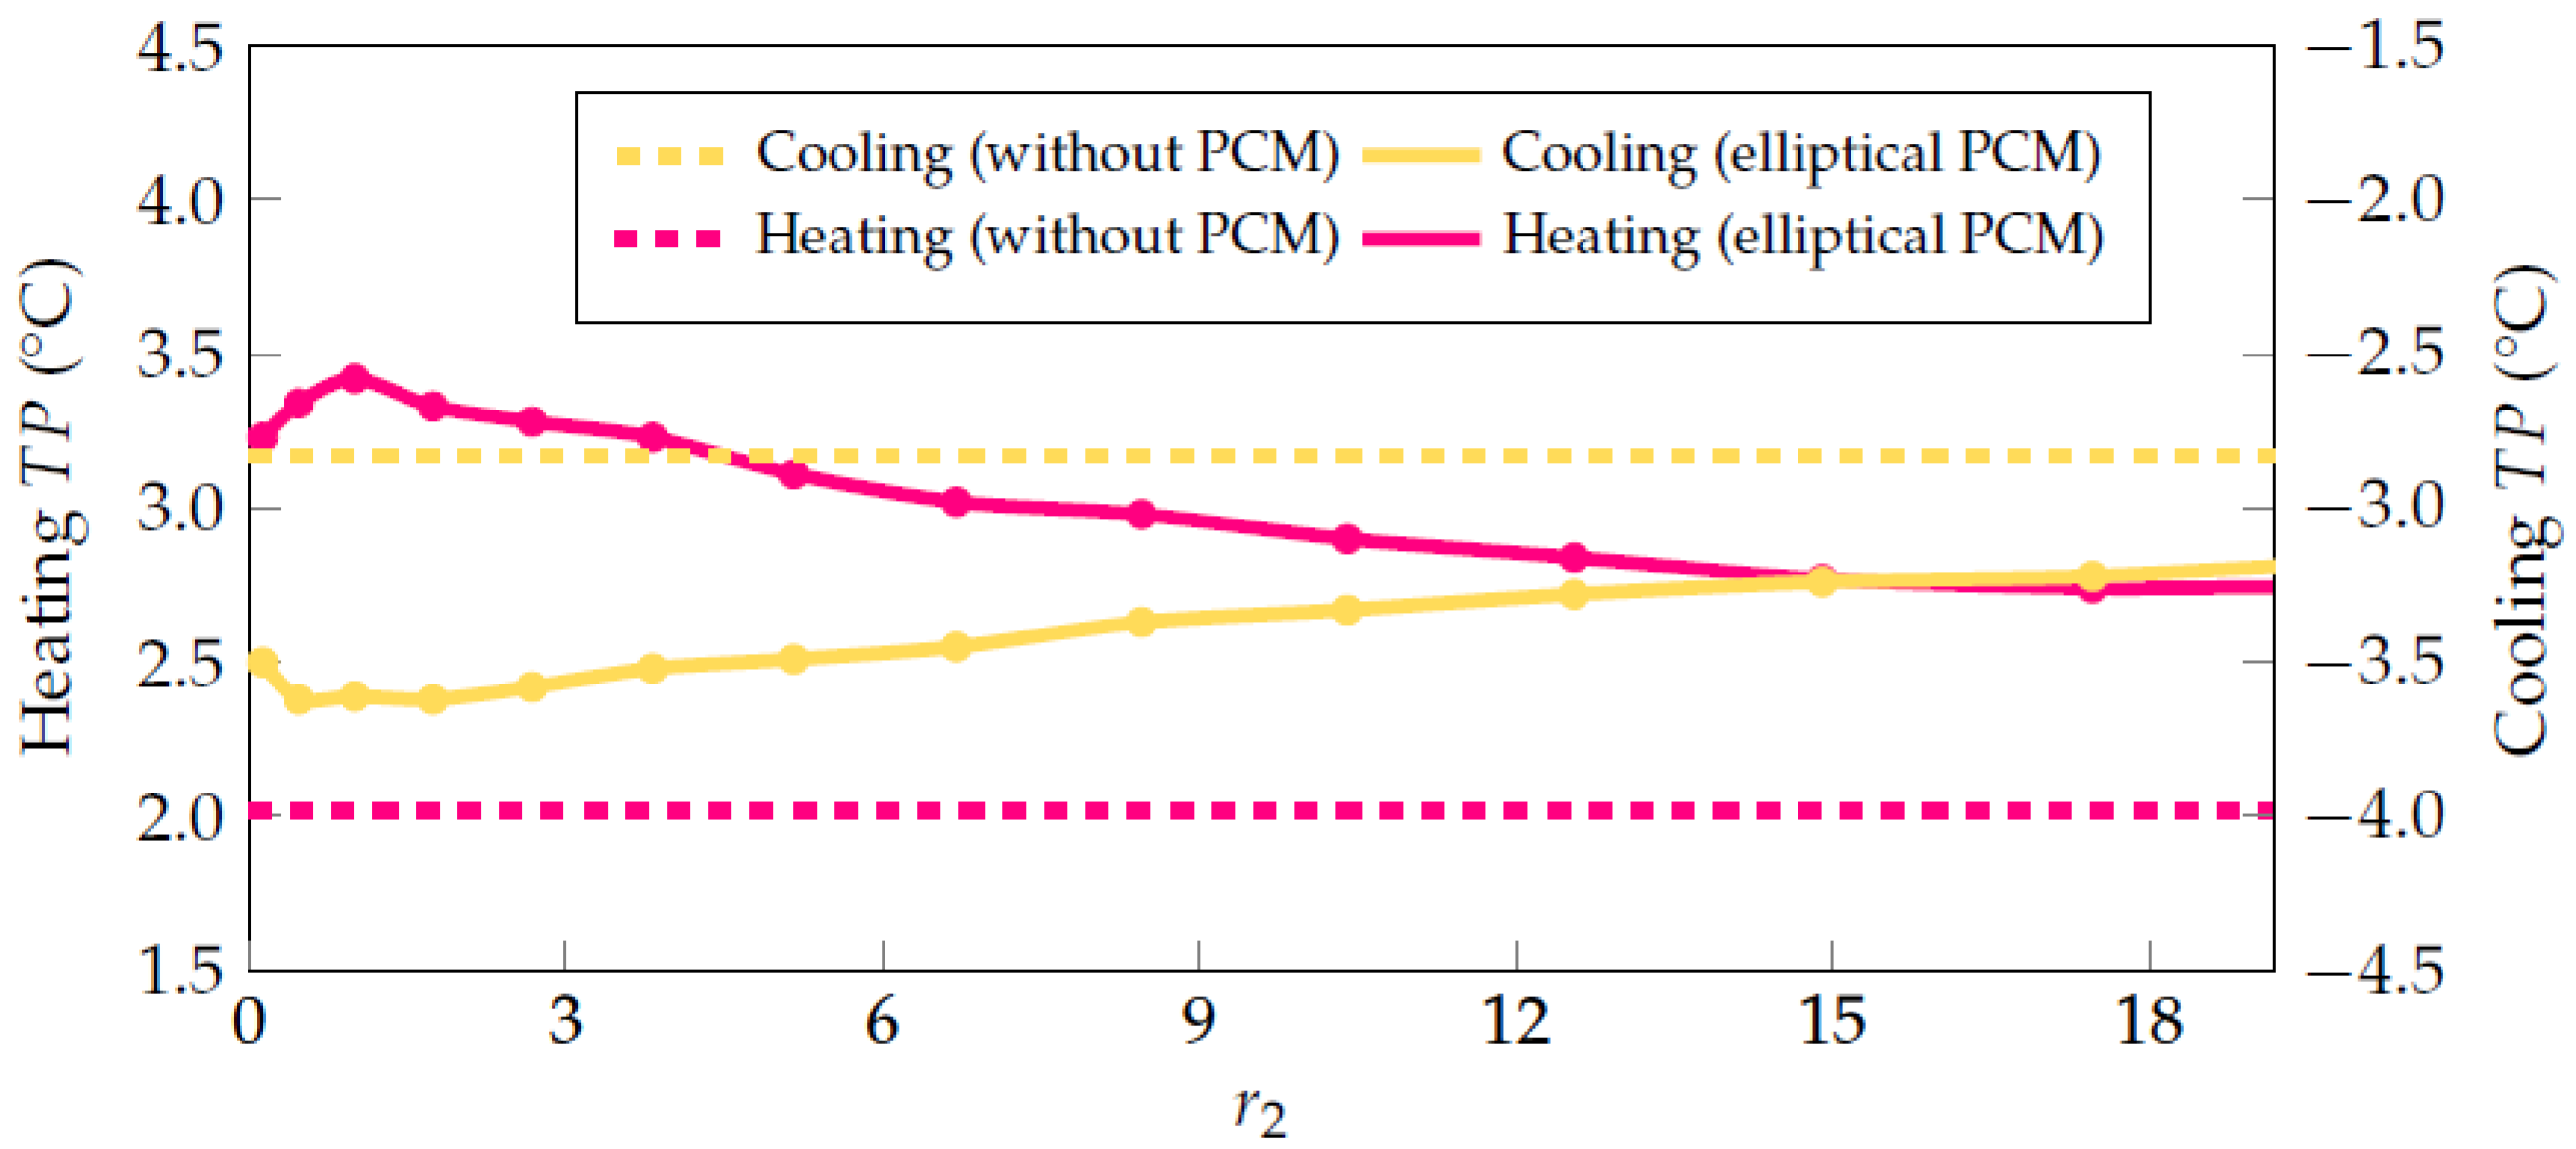
The results presented in Table 11 and Figure 20 show the influence of the axis ratio r 2 = H e / B e on the annual average heating and cooling TP for PCM containers with an elliptical cross-section. As observed, the geometry strongly affects the thermal performance of the GAHE-PCM system.
For heating mode, the maximum TP value was obtained for Case 3 ( r 2 = 1 , circular cross-section), reaching 3.42 °C, which corresponds to an improvement of 69.31% compared to the reference case without PCM. A similar performance was observed in Cases 2 and 4, with increases of 65.35% and 64.85%, respectively. In contrast, when r 2 is increased beyond these optimal configurations, the thermal potential gradually decreases. For instance, Case 15 shows the lowest heating performance, with an improvement of only 31.68%.
In cooling mode, a similar trend was observed. The highest improvement occurred in Cases 2 and 4, with 27.92%, followed closely by Case 3 with 27.56%. For larger r 2 values, the performance decreased, reaching an improvement of just 10.25% in Case 15.
Overall, the results indicate that an intermediate ratio r 2 yields the highest thermal potential in both heating and cooling modes. These findings are consistent with the trends observed in the rectangular section cases. Figure 21 shows the temperature distribution for PCM containers with an elliptical cross-section, reinforcing the behavior observed in the heat flux analysis.
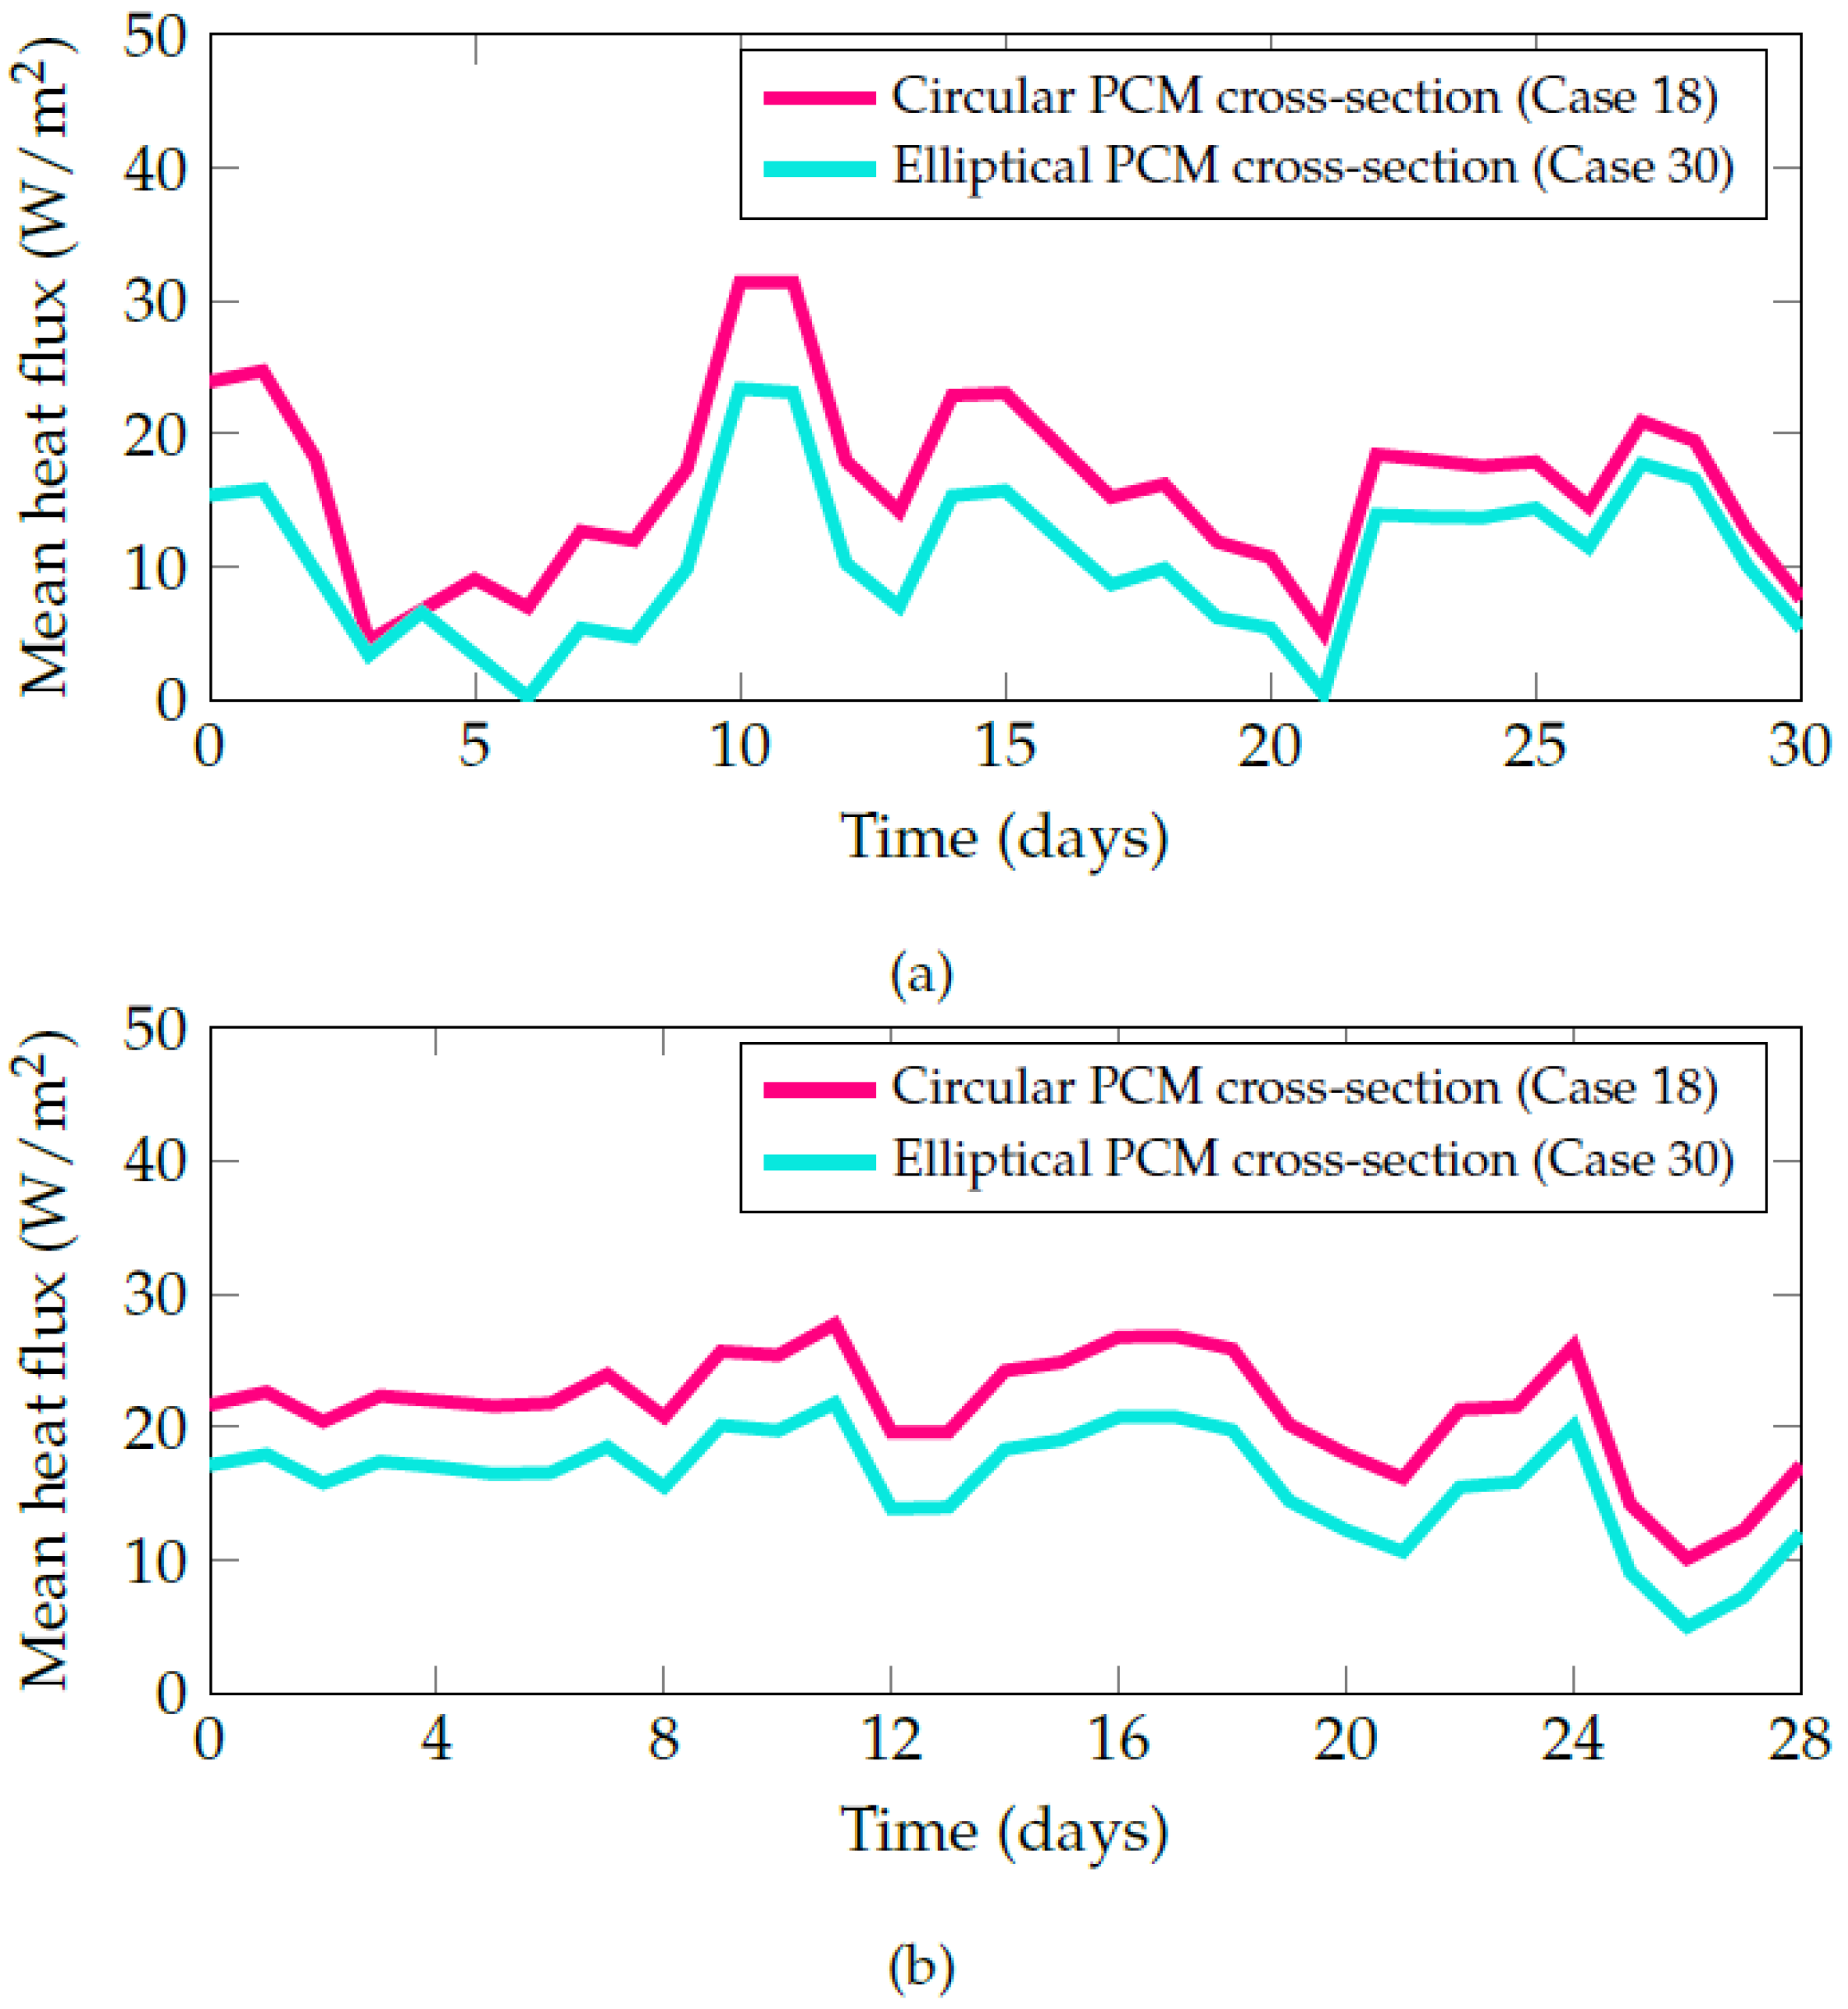
To complement the geometric analysis and explicitly evaluate the effect of the PCM container shape on heat transfer, an additional analysis was performed based on the mean heat flux on the duct wall (W/m2). Two representative elliptical configurations were compared: (i) the circular cross-section (Case 18, r 2 = 1 ), which presented the highest thermal potential, and (ii) the most elongated configuration (Case 30, r 2 = 19.19 ), associated with the lowest performance.
The annual mean heat flux at the air–duct interface reached 14.80 W/m2 for the circular geometry, while the elongated case achieved only 12.33 W/m2, corresponding to a 16.69% reduction in heat exchange capability. The contrast becomes more evident during periods of higher thermal activity. In June (winter), the heat flux reached 15.97 W/m2 for the circular configuration, while the elongated cross-section yielded only 10.48 W/m2 (a 34.38% decrease). In February (summer), heat flux values were 21.38 W/m2 and 15.89 W/m2, respectively (a 25.68% reduction).
Figure 22a,b shows the temporal evolution of the mean heat flux at the duct–air interface throughout these representative periods. The circular cross-section consistently promotes higher heat transfer, demonstrating that the superior thermal performance is not only a consequence of geometric compactness, but also of more effective participation of the PCM volume in the thermal interaction with the airflow.

5. Conclusions

The incorporation of PCM into the GAHE devices significantly enhances its thermal performance under both cooling and heating conditions. The analysis indicates that the system can achieve annual thermal potential improvements of up to 69.31% in heating and 27.92% in cooling when optimal configurations are employed. These findings underscore the significant potential of PCM-assisted GAHE to increase energy efficiency and enhance indoor thermal comfort.
The geometry of the PCM container is a critical factor for maximizing system performance. Square and circular configurations provide the best results, whereas excessively elongated geometries (whether in height or width) lead to inefficient PCM utilization and increased heat exchange with the surrounding soil, consequently reducing thermal potential gains, which in some cases can be less than half of the value achieved with the optimal configuration.
For configurations near the optimum, differences between rectangular and elliptical cross-sections are practically negligible, offering flexibility in design according to construction constraints.
Additionally, placing most of the PCM in deeper, more thermally stable soil layers in an eccentric arrangement does not enhance the system’s thermal potential; instead, it reduces heat exchange with the airflow, lowering overall thermal performance.
The results obtained are relevant for enabling studies of GAHE systems with shorter ducts through the use of PCM, which can facilitate the application of these systems in dense urban areas or on land with limited space, thereby expanding the possibilities for the use of this technology in different contexts.
Although this work focused on evaluating the influence of PCM geometry on annual thermal performance, future research will incorporate a nondimensional analysis (Bi, Fo, and Nu numbers, and geometric ratios) to rigorously characterize the heat transfer mechanisms and generalize the results to other GAHE–PCM configurations.

Author Contributions

Conceptualization, G.A.V.V., L.A.I., R.d.S.B., L.A.O.R., and E.D.d.S.; methodology, G.A.V.V., L.A.I., and R.d.S.B.; software, G.A.V.V. and Z.C.R.; validation, G.A.V.V. and Z.C.R.; formal analysis, G.A.V.V., L.A.I., and R.d.S.B.; investigation, G.A.V.V. and Z.C.R.; resources, L.A.I., L.A.O.R., and E.D.d.S.; data curation, G.A.V.V., L.A.I., and R.d.S.B.; writing—original draft preparation, G.A.V.V.; writing—review and editing, G.A.V.V., L.A.I., A.L.R., R.d.S.B., E.D.d.S., and L.A.O.R.; visualization, G.A.V.V. and A.L.R.; supervision, L.A.I. and R.d.S.B.; project administration, L.A.I.; funding acquisition, L.A.I., E.D.d.S., and L.A.O.R. All authors have read and agreed to the published version of the manuscript.

Funding

The authors G.A.V.V. and Z.C.R. acknowledge the Coordination for the Improvement of Higher Education Personnel (CAPES) for the doctoral and master’s scholarships, respectively (funding code 001). The authors A.L.R., L.A.O.R., E.D.d.S., and L.A.I. acknowledge the National Council for Scientific and Technological Development (CNPq) for the research grants (processes 150193/2023-8, 307791/2019-0, 308396/2021-9, and 309648/2021-1, respectively). All authors also acknowledge the financial support from CNPq (process: 403408/2023-7) and the Research Support Foundation of Rio Grande do Sul (FAPERGS) for research grants (processes 21/2551-0002231-0 and 23/2551-0000165-9).

Data Availability Statement

The original contributions presented in the study are included in the article, further inquiries can be directed to the corresponding author.

Acknowledgments

The authors thank CAPES, CNPq, and FAPERGS for the financial support that enabled the development of this research. They also thank the Universidade Federal do Rio Grande (FURG) for their support.

Conflicts of Interest

The authors declare no conflicts of interest. The funders had no role in the design of the study, in the collection, analyses, or interpretation of data, in the writing of the manuscript, or in the decision to publish the results.

References

  1. International Energy Agency (IEA). Global Energy Review 2025. Available online: https://www.iea.org/reports/global-energy-review-2025 (accessed on 14 May 2025).
  2. Hegazi, A.A.; Abdelrehim, O.; Khater, A. Parametric optimization of earth-air heat exchangers (EAHEs) for central air conditioning. Int. J. Refrig. 2021, 129, 278–289. [Google Scholar] [CrossRef]
  3. Guo, X.; Wei, H.; He, X.; Du, J.; Yang, D. Experimental evaluation of an earth–to–air heat exchanger and air source heat pump hybrid indoor air conditioning system. Energy Build. 2022, 256, 111752. [Google Scholar] [CrossRef]
  4. Ahmed, S.F.; Khan, M.M.K.; Amanullah, M.T.O.; Rasul, M.G.; Hassan, N.M.S. Thermal performance of building-integrated horizontal earth-air heat exchanger in a subtropical hot humid climate. Geothermics 2022, 99, 102313. [Google Scholar] [CrossRef]
  5. Li, J.; Jimenez-Bescos, C.; Calautit, J.K.; Yao, J. Evaluating the energy-saving potential of earth-air heat exchanger (EAHX) for Passivhaus standard buildings in different climates in China. Energy Build. 2023, 288, 113005. [Google Scholar] [CrossRef]
  6. Rodrigues, M.K.; Coswig, F.S.; Camargo, K.R.; Isoldi, L.A.; Brum, R.S.; Ramalho, J.V.A.; Vaz, J.; Rocha, L.A.O.; Santos, E.D. Thermal performance simulations of Earth-Air Heat Exchangers for different soils of a coastal city using in-situ data. Sustain. Energy Technol. Assess. 2018, 30, 224–229. [Google Scholar] [CrossRef]
  7. Brum, R.S.; Ramalho, J.V.A.; Rodrigues, M.K.; Rocha, L.A.O.; Isoldi, L.A.; Dos Santos, E.D. Design evaluation of earth-air heat exchangers with multiple ducts. Renew. Energy 2019, 135, 1371–1385. [Google Scholar] [CrossRef]
  8. Agrawal, K.K.; Misra, R.; Das Agrawal, G.; Bhardwaj, M.; Jamuwa, D.K. The state of art on the applications, technology integration, and latest research trends of earth-air-heat exchanger system. Geothermics 2019, 82, 34–50. [Google Scholar] [CrossRef]
  9. Rodrigues, M.K.; Brum, R.S.; Vaz, J.; Rocha, L.A.O.; Dos Santos, E.D.; Isoldi, L.A. Numerical investigation about the improvement of the thermal potential of an earth-air heat exchanger (EAHE) employing the constructal design method. Renew. Energy 2015, 80, 538–551. [Google Scholar] [CrossRef]
  10. Brum, R.S.; Vaz, J.; Rocha, L.A.O.; Dos Santos, E.D.; Isoldi, L.A. A new computational modeling to predict the behavior of earth-air heat exchangers. Energy Build. 2013, 64, 395–402. [Google Scholar] [CrossRef]
  11. Jensen-Page, L.; Narsilio, G.A.; Bidarmaghz, A.; Johnston, I.W. Investigation of the effect of seasonal variation in ground temperature on thermal response tests. Renew. Energy 2018, 125, 609–619. [Google Scholar] [CrossRef]
  12. Naranjo-Mendoza, C.; Wright, A.J.; Oyinlola, M.A.; Greenough, R.M. A comparison of analytical and numerical model predictions of shallow soil temperature variation with experimental measurements. Geothermics 2018, 76, 38–49. [Google Scholar] [CrossRef]
  13. Badache, M.; Eslami-Nejad, P.; Ouzzane, M.; Aidoun, Z.; Lamarche, L. A new modeling approach for improved ground temperature profile determination. Renew. Energy 2016, 85, 436–444. [Google Scholar] [CrossRef]
  14. Bansal, V.; Misra, R.; Agarwal, G.D.; Mathur, J. Transient Effect of Soil Thermal Conductivity and Duration of Operation on Performance of Earth Air Tunnel Heat Exchanger. Appl. Energy 2013, 103, 1–11. [Google Scholar] [CrossRef]
  15. Mathur, A.; Srivastava, A.; Mathur, J.; Mathur, S.; Agrawal, G.D. Transient Effect of Soil Thermal Diffusivity on Performance of EATHE System. Energy Rep. 2015, 1, 17–21. [Google Scholar] [CrossRef]
  16. Cuny, M.; Lin, J.; Siroux, M.; Magnenet, V.; Fond, C. Influence of coating soil types on the energy of earth-air heat exchanger. Energy Build. 2018, 158, 1000–1012. [Google Scholar] [CrossRef]
  17. Zhang, N.; Wang, Z. Review of soil thermal conductivity and predictive models. Int. J. Therm. Sci. 2017, 117, 172–183. [Google Scholar] [CrossRef]
  18. Cao, D.; Shi, B.; Loheide, S.P.; Gong, X.; Zhu, H.H.; Wei, G.; Yang, L. Investigation of the influence of soil moisture on thermal response tests using active distributed temperature sensing (A–DTS) technology. Energy Build. 2018, 173, 239–251. [Google Scholar] [CrossRef]
  19. Cuny, M.; Lin, J.; Siroux, M.; Fond, C. Influence of Rainfall Events on the of an Earth–Air Heat Exchanger Embedded in a Multilayered Soil. Renew. Energy 2020, 147, 2664–2675. [Google Scholar] [CrossRef]
  20. Agrawal, K.K.; Misra, R.; Agrawal, G.D. Improving the thermal performance of ground air heat exchanger system using sand-bentonite (in dry and wet condition) as backfilling material. Renew. Energy 2020, 146, 2008–2023. [Google Scholar] [CrossRef]
  21. Mohammadi, S.A.; Jahangir, M.H. Numerical investigation of the saturating soil layers’ effect on air temperature drops along the pipe of Earth-Air Heat Exchanger systems in heating applications. Geothermics 2024, 123, 103109. [Google Scholar] [CrossRef]
  22. Mathur, A.; Srivastava, A.; Agrawal, G.D.; Mathur, S.; Mathur, J. CFD analysis of EATHE system under transient conditions for intermittent operation. Energy Build. 2015, 87, 37–44. [Google Scholar] [CrossRef]
  23. Mathur, A.; Surana, A.K.; Mathur, S. Numerical investigation of the performance and soil temperature recovery of an EATHE system under intermittent operations. Renew. Energy 2016, 95, 510–521. [Google Scholar] [CrossRef]
  24. Zhou, T.; Xiao, Y.; Huang, H.; Lin, J. Numerical study on the cooling performance of a novel passive system: Cylindrical phase change material-assisted earth-air heat exchanger. J. Clean. Prod. 2020, 245, 118907. [Google Scholar] [CrossRef]
  25. Maytorena, V.M.; Hinojosa, J.F.; Moreno, S.; Buentello-Montoya, D.A. Thermal performance analysis of a passive hybrid earth-to-air heat exchanger for cooling rooms at Mexican desert climate. Case Stud. Therm. Eng. 2023, 41, 102590. [Google Scholar] [CrossRef]
  26. Pause, B. Phase change materials and their application in coatings and laminates for textiles. In Smart Textile Coatings and Laminates, 2nd ed.; The Textile Institute Book Series: Greer, SC, USA, 2019; pp. 175–187. [Google Scholar]
  27. Li, W.; Rahim, M.; Wu, D.; El Ganaoui, M.; Bennacer, R. Dynamic integration of phase change material in walls for enhancing building thermal performance—A novel self-adaptive method for moving PCM layer. Energy Convers. Manag. 2024, 308, 118401. [Google Scholar] [CrossRef]
  28. Anter, A.G.; Sultan, A.A.; Hegazi, A.A.; El Bouz, M.A. Thermal performance and energy saving using phase change materials (PCM) integrated in building walls. J. Energy Storage 2023, 67, 107568. [Google Scholar] [CrossRef]
  29. NematpourKeshteli, A.; Iasiello, M.; Langella, G.; Bianco, N. Increasing melting and solidification performances of a phase change material-based flat plate solar collector equipped with metal foams, nanoparticles, and wavy wall-Y-shaped surface. Energy Convers. Manag. 2023, 291, 117268. [Google Scholar] [CrossRef]
  30. Algarni, S. Evaluation and optimization of the performance and efficiency of a hybrid flat plate solar collector integrated with phase change material and heat sink. Case Stud. Therm. Eng. 2023, 45, 102892. [Google Scholar] [CrossRef]
  31. Faraji, H.; Çagatay, Y.; Arshad, A.; Arıcı, M.; Choukairy, K.; El Alami, M. Passive thermal management strategy for cooling multiple portable electronic components: Hybrid nanoparticles enhanced phase change materials as an innovative solution. J. Energy Storage 2023, 70, 108087. [Google Scholar] [CrossRef]
  32. Motevalizadeh, M.; Rooberahan, A.; Namaghi, M.S.; Mohammadi, M.; Passandideh-Fard, M.; Sardarabadi, M. Cooling enhancement of portable computers processor by a heat pipe assisted with phase change materials. J. Energy Storage 2022, 56, 106074. [Google Scholar] [CrossRef]
  33. Itani, M.; Bachnak, R.; Ghaddar, N.; Ghali, K. Evaluating performance of hybrid PCM-fan and hybrid PCM-desiccant vests in moderate and hot climates. J. Build. Eng. 2019, 22, 383–396. [Google Scholar] [CrossRef]
  34. Mneimneh, F.; Moussalem, C.; Ghaddar, N.; Ghali, K.; Omeis, I. Experimental study on the effectiveness of the PCM cooling vest in persons with paraplegia of varying levels. J. Therm. Biol. 2020, 91, 102634. [Google Scholar] [CrossRef] [PubMed]
  35. Zhou, T.; Xiao, Y.; Liu, Y.; Lin, J.; Huang, H. Research on cooling performance of phase change material-filled earth-air heat exchanger. Energy Convers. Manag. 2018, 177, 210–223. [Google Scholar] [CrossRef]
  36. Liu, Q.; Huang, Y.; Ma, Y.; Peng, Y.; Wang, Y. Parametric study on the thermal performance of phase change material-assisted earth-to-air heat exchanger. Energy Build. 2021, 238, 110811. [Google Scholar] [CrossRef]
  37. Maytorena, M.; Moreno, S.; Hinojosa, J.F. Effect of operation modes on the thermal performance of EAHE systems with and without PCM in summer weather conditions. Energy Build. 2021, 250, 111278. [Google Scholar] [CrossRef]
  38. Liu, Z.; Yu, Z.; Yang, T.; El Mankibi, M.; Roccamena, L.; Sun, Y.; Sun, P.; Li, S.; Zhang, G. Experimental and numerical study of a vertical earth-to-air heat exchanger system integrated with annular phase change material. Energy Convers. Manag. 2019, 186, 433–449. [Google Scholar] [CrossRef]
  39. Liu, Z.; Sun, P.; Li, S.; Yu, Z.; El Mankibi, M.; Roccamena, L.; Yang, T.; Zhang, G. Enhancing a vertical earth-to-air heat exchanger system using tubular phase change material. J. Clean. Prod. 2019, 237, 117763. [Google Scholar] [CrossRef]
  40. Liu, Z.; Sun, P.; Xie, M.; Zhou, Y.; He, Y.; Zhang, G.; Chen, D.; Li, S.; Yan, Z.; Qin, D. Multivariant optimization and sensitivity analysis of an experimental vertical earth-to-air heat exchanger system integrating phase change material with Taguchi method. Renew. Energy 2021, 173, 401–414. [Google Scholar] [CrossRef]
  41. Ouzzane, M.; Bady, M. Investigation of an innovative Canadian well system combined with a frozen water/PCM heat exchanger for air-cooling in hot climate. Appl. Therm. Eng. 2022, 213, 118737. [Google Scholar] [CrossRef]
  42. Vielma, G.A.; Rodrigues, M.K.; Rocha, L.A.O.; Dos Santos, E.D.; Brum, R.S.; Isoldi, L.A. Computational modeling of an earth–air heat exchanger integrated with phase change materials: A case study performed for the Viamão City, Rio Grande do Sul State, Brazil. Defect Diffus. Forum 2023, 427, 85–94. [Google Scholar] [CrossRef]
  43. Ren, Z.; Ren, Y.; Zhou, T.; Wang, T.; Gao, X.; Yang, Z.; Xiong, Q.; Chen, S.; Xiao, Y. Investigating the dynamic thermal performance of a novel PCM to earth-air heat exchanger: Developing numerical model and comparing thermal performance. J. Build. Eng. 2024, 97, 110718. [Google Scholar] [CrossRef]
  44. Vielma, G.A.; Rodrigues, M.K.; Rocha, L.A.O.; Dos Santos, E.D.; Brum, R.S.; Isoldi, L.A. Numerical analysis of phase change material parameters on the behavior of a ground-air heat exchanger. Defect Diffus. Forum 2024, 436, 103–115. [Google Scholar] [CrossRef]
  45. Zhou, T.; Zhang, H.; Xiao, Y.; Chao, L. Performance improvement of the phase change material-assisted earth-air heat exchanger in summer. Appl. Therm. Eng. 2024, 248, 123325. [Google Scholar] [CrossRef]
  46. Cao, H.; Zeng, C.; He, J.; Lü, X.; Yuan, Y. Experimental investigation on energy and resilience performance of spherical PCM-assisted EAHE system for underground buildings. Appl. Therm. Eng. 2025, 270, 126267. [Google Scholar] [CrossRef]
  47. Bergman, T.L.; Lavine, A.S.; Incropera, F.P.; DeWitt, D.P. Fundamentals of Heat and Mass Transfer, 7th ed.; John Wiley and Sons Inc.: Hoboken, NJ, USA, 2011. [Google Scholar]
  48. Versteeg, H.K.; Malalasekera, W. Introduction to Computational Fluid Dynamics: The Finite Volume Method, 2nd ed.; Pearson Education Limited: Harlow, UK, 2007. [Google Scholar]
  49. Launder, B.E.; Spalding, D.B. Lectures in Mathematical Models of Turbulence; Academic Press: London, UK, 1972. [Google Scholar]
  50. Wilcox, D.C. Turbulence Modeling for CFD, 3rd ed.; DCW Industries: La Canada Flintridge, CA, USA, 2006. [Google Scholar]
  51. Fox, R.; McDonald, A.; Mitchell, J.W. Fox and McDonald’s Introduction to Fluid Mechanics, 10th ed.; John Wiley and Sons Inc.: Hoboken, NJ, USA, 2020. [Google Scholar]
  52. Brum, R.S.; Rocha, L.A.O.; Vaz, J.; Dos Santos, E.D.; Isoldi, L.A. Development of simplified numerical model for evaluation of the influence of soil-air heat exchanger installation depth over its thermal potential. Int. J. Adv. Renew. Energy Res. 2012, 1, 505–514. [Google Scholar]
  53. Rodrigues, M.K.; Vaz, J.; Rocha, L.A.O.; Dos Santos, E.D.; Isoldi, L.A. A full approach to Earth-Air Heat Exchanger employing computational modeling, performance analysis and geometric evaluation. Renew. Energy 2022, 191, 535–556. [Google Scholar] [CrossRef]
  54. Vaz, J.; Sattler, M.A.; Dos Santos, E.D.; Isoldi, L.A. Experimental and numerical analysis of an earth-air heat exchanger. Energy Build. 2011, 43, 2476–2482. [Google Scholar] [CrossRef]
  55. Phase Change Energy Solutions. BioPCM Q20 Tunable Physical and Chemical Properties. Available online: https://phasechange.com/wp-content/uploads/2020/08/BioPCM-Data-Sheet-Q20.pdf (accessed on 13 March 2025).
  56. Campbell, K.R.; Sailor, D.J. Phase change materials as thermal storage for high performance homes. In Proceedings of the ASME 2011 International Mechanical Engineering Congress and Exposition, IMECE 2011 (Parts A and B), Denver, CO, USA, 11–17 November 2011; The American Society of Mechanical Engineers: New York, NY, USA, 2011. [Google Scholar]
  57. Höhne, G.W.H.; Cammenga, H.K.; Eysel, W.; Gmelin, E.; Hemminger, W. The temperature calibration of scanning calorimeters. Thermochim. Acta 1990, 160, 1–12. [Google Scholar] [CrossRef]
  58. Vielma, G.A.; Colonico, Z.; Rodrigues, M.K.; Rocha, L.A.O.; Dos Santos, E.D.; Brum, R.S.; Isoldi, L.A. Influence of the Thickness of the Phase Change Material on the Thermal Performance of a Ground-Air Heat Exchanger. In Proceedings of the XII Regional Meeting on Applied and Computational Mathematics of Rio Grande do Sul (XII ERMAC-RS), Porto Alegre, RS, Brazil, 2–4 July 2025. [Google Scholar]
  59. Wilks, D.S. Statistical Methods in the Atmospheric Sciences, 4th ed.; Elsevier: Amsterdam, The Netherlands, 2019. [Google Scholar]
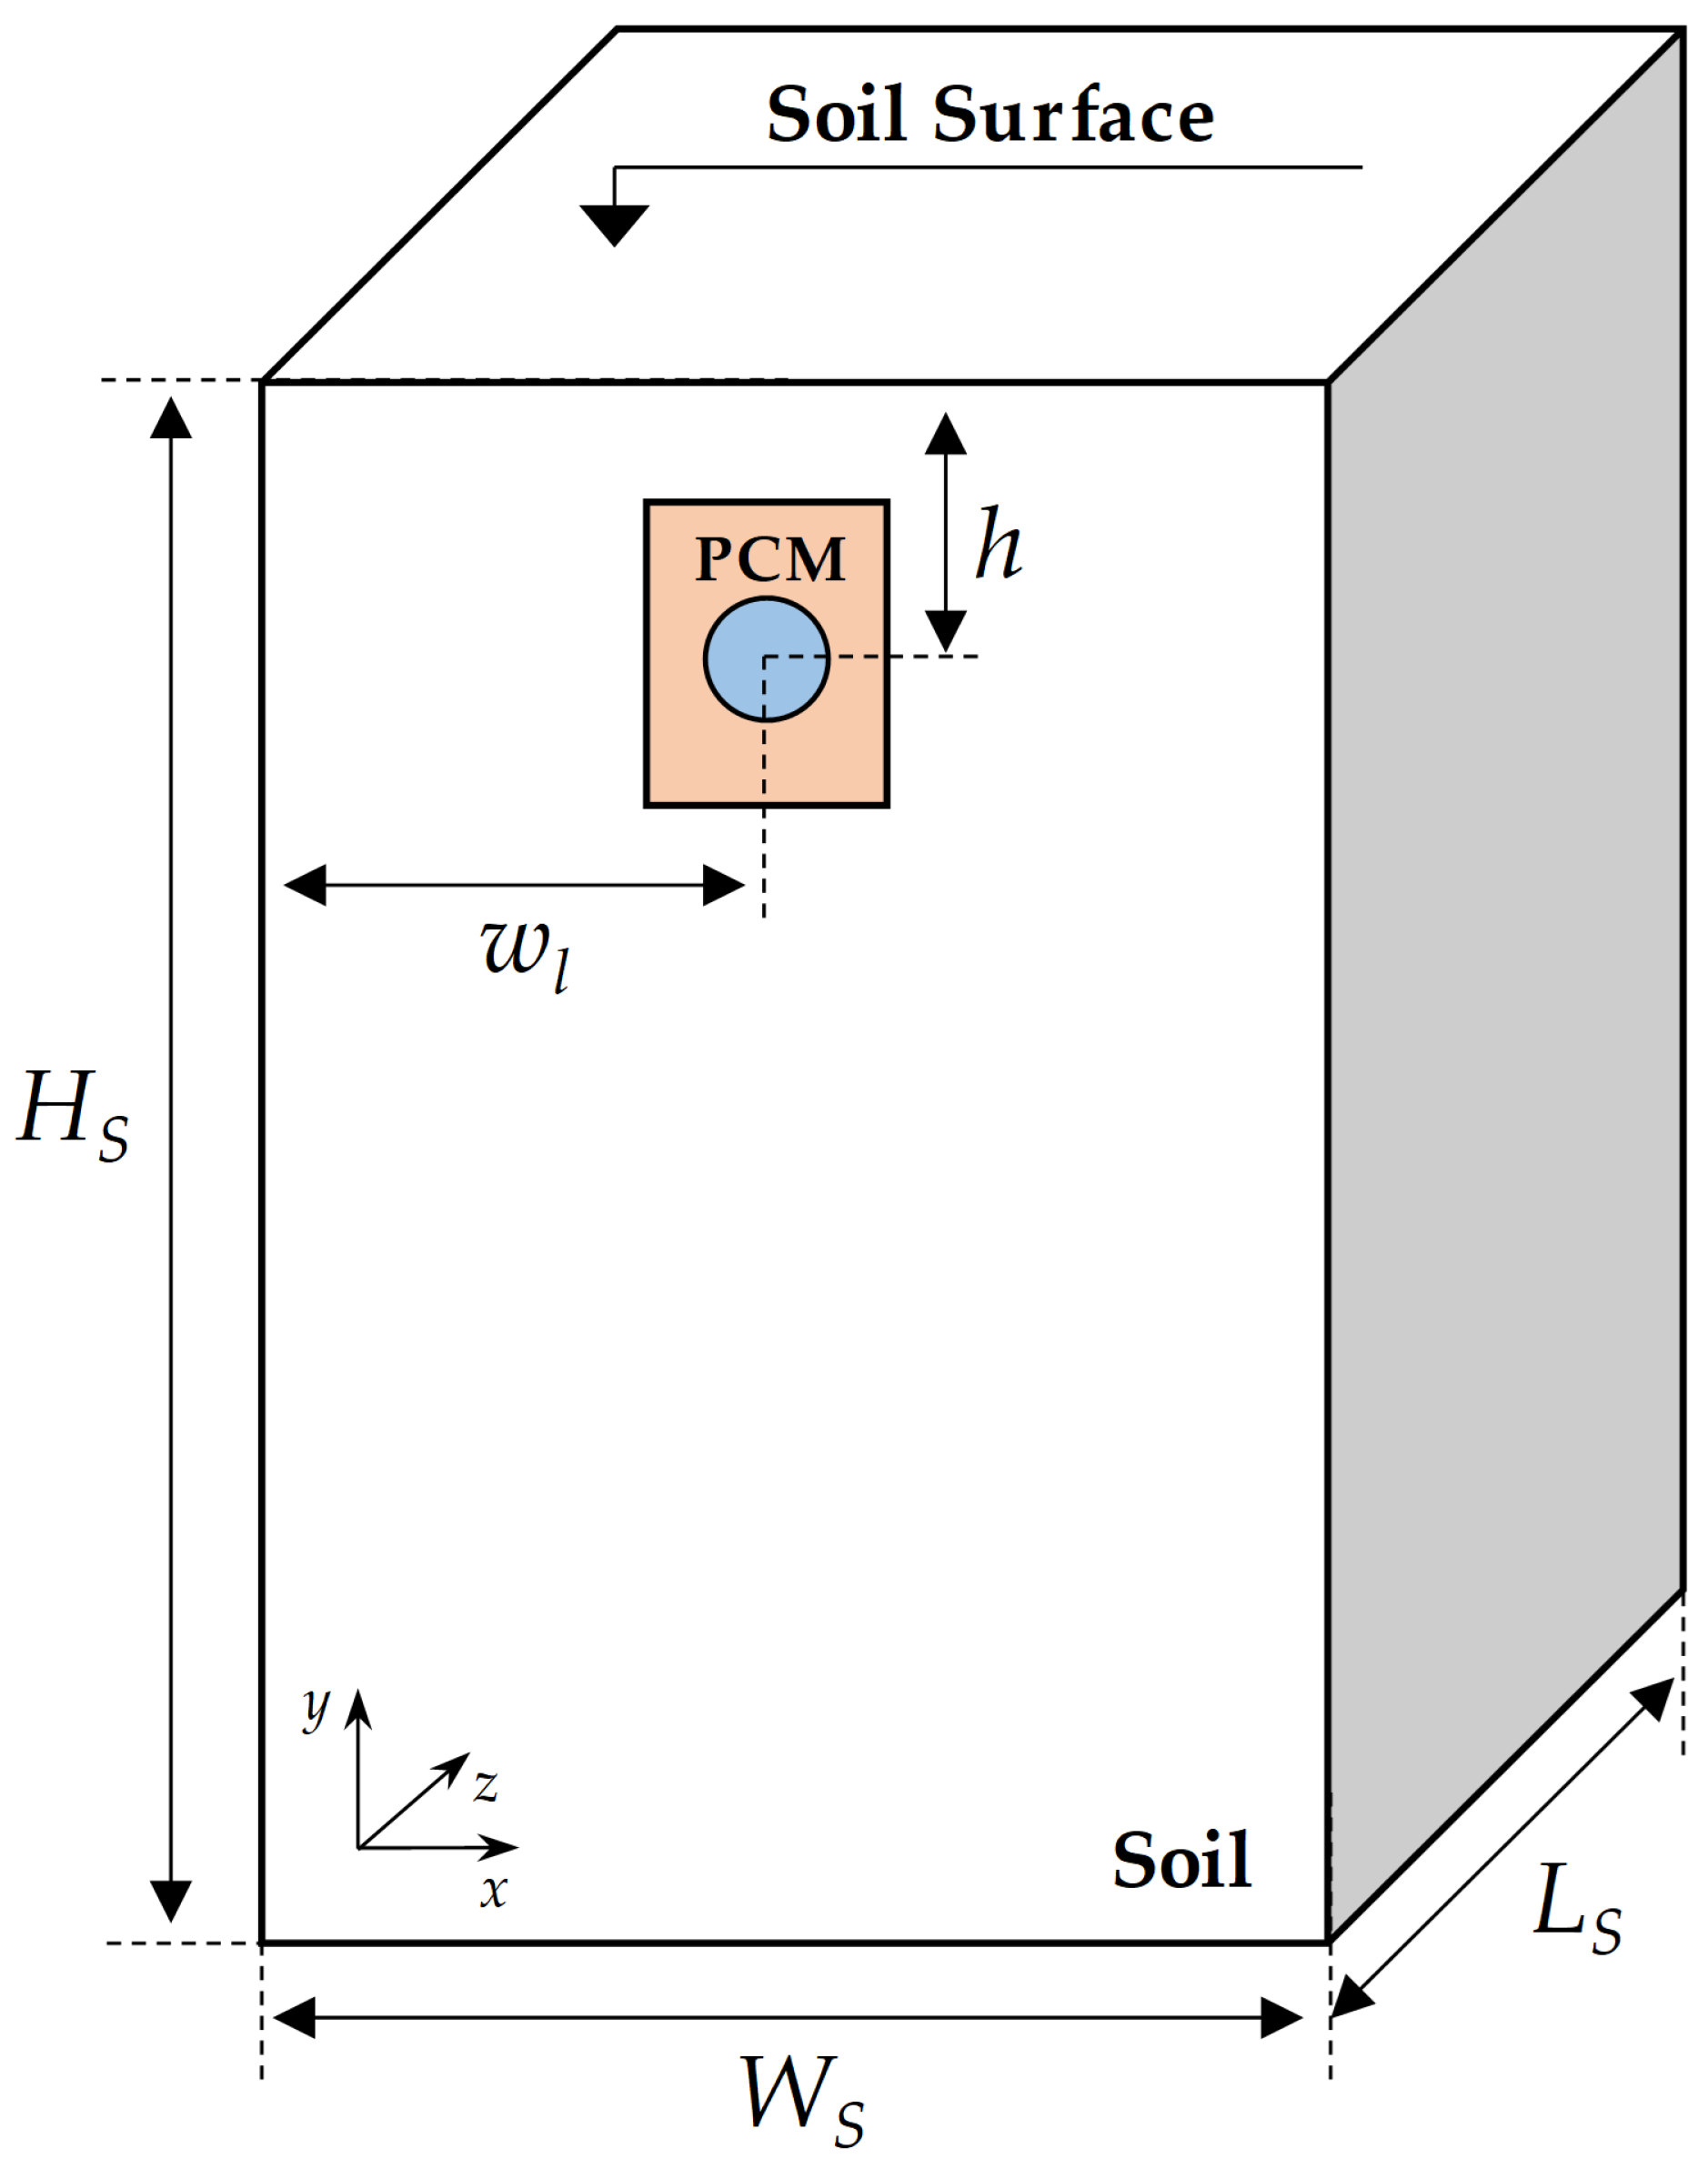
Figure 1. Simulation domain of the problem.
Fluids 10 00311 g001
Figure 2. Diagram of the GAHE system with elliptical and rectangular PCM containers. (a) Side perspective; (b) front perspective.
Fluids 10 00311 g002
Figure 3. Simulation domain representation: (a) GAHE-PCM; (b) conventional GAHE.
Fluids 10 00311 g003
Figure 4. Definition of the characteristic temperatures of a peak.
Fluids 10 00311 g004
Figure 5. Equivalent specific heat curve of BioPCM Q20.
Fluids 10 00311 g005
Figure 6. Atmospheric air and soil surface temperatures in Viamão [54].
Fluids 10 00311 g006
Figure 7. Schematic representation of PCM configurations: concentric and eccentric.
Fluids 10 00311 g007
Figure 8. Cases for the rectangular cross-section. The numbers (1–15) denote the case identifiers; only selected cases are illustrated, and the ellipsis indicates the intermediate configurations.
Fluids 10 00311 g008
Figure 9. Cases for the elliptical cross-section. The numbers (16–30) denote the case identifiers; only selected cases are illustrated, and the ellipsis indicates the intermediate configurations.
Fluids 10 00311 g009
Figure 10. Structured hexahedral grid with 444,800 control volumes.
Fluids 10 00311 g010
Figure 11. Validation and verification of the GAHE model.
Fluids 10 00311 g011
Figure 12. Thermal conductivity curve of the CA–PA/EG.
Fluids 10 00311 g012
Figure 13. Equivalent specific heat curve of the CA–PA/EG.
Fluids 10 00311 g013
Figure 14. Validation of the computational model of the GAHE-PCM system.
Fluids 10 00311 g014
Figure 15. Verification of the computational model of GAHE-PCM.
Fluids 10 00311 g015
Figure 16. Temperature fields at the mid-length of the duct (12.885 m from the inlet) on the last simulation day: (a) without PCM, (b) concentric circular, (c) eccentric circular, (d) eccentric semicircular, (e) concentric square, and (f) eccentric rectangular.
Fluids 10 00311 g016
Figure 17. Comparison of annual heating and cooling thermal potential without and with PCM in a rectangular container.
Fluids 10 00311 g017
Figure 18. Temperature fields at the mid-length of the duct (12.885 m from the inlet) on the last day of simulation for different PCM geometries: (a) Case 1 ( r 1 = 0.13), (b) Case 3 ( r 1 = 1), and (c) Case 15 ( r 1 = 23.18). The square and rectangular shapes outline the PCM geometries in each case, while the circle represents the cross-section of the air duct.
Fluids 10 00311 g018
Figure 19. Daily mean heat flux on the duct wall for PCM containers with square and rectangular cross-sections: (a) June and (b) February.
Fluids 10 00311 g019
Figure 20. Comparison of annual heating and cooling thermal potential without and with PCM in an elliptical container.
Fluids 10 00311 g020
Figure 21. Temperature fields at the mid-length of the duct (12.885 m from the inlet) on the last day of simulation for different PCM geometries: (a) Case 16 ( r 2 = 0.19), (b) Case 18 ( r 2 = 1), and (c) Case 30 ( r 2 = 19.19). The outer ellipse or circle in each subfigure represents the PCM container, while the smaller circle indicates the cross-section of the air duct.
Fluids 10 00311 g021
Figure 22. Daily mean heat flux on the duct wall for PCM containers with circular and elliptical cross-sections: (a) June and (b) February.
Fluids 10 00311 g022
Table 1. Material thermophysical parameters.
Materials ρ (kg/m3)k (W/m·K) c p (J/kg·K) μ (kg/(m·s))
Soil18002.11780
Air1.1600.024210101.798 × 10 5
BioPCM Q2014002.53422
Table 2. Geometric parameters of the rectangular PCM container.
Case B r (m) H r (m) r 1 = H r / B r
11.730.230.13
20.920.430.47
30.630.631.00
40.480.831.74
50.381.032.68
60.321.233.82
70.281.435.16
80.241.636.70
90.221.838.45
100.202.0310.40
110.182.2312.55
120.162.4314.90
130.152.6317.46
140.142.8320.22
150.133.0323.18
Table 3. Geometric parameters of the elliptical PCM container.
Case B e (m) H e (m) r 2 = H e / B e
161.630.310.19
170.990.510.52
180.710.711.00
190.550.911.64
200.451.112.44
210.381.313.40
220.331.514.52
230.291.715.80
240.261.917.24
250.242.118.83
260.222.3110.59
270.202.5112.50
280.192.7114.57
290.172.9116.80
300.163.1119.19
Table 4. Mesh independence test based on temperature.
MeshNumber of NodesNumber of VolumesAverage Temperature at Duct Outlet (°C)Absolute Relative Difference
M 1 130,866125,00019.73750.000435
M 2 459,853444,80019.74610.000099
M 3 746,586726,00019.7442
Table 5. Mesh independence test based on static pressure.
MeshNumber of NodesNumber of VolumesPressure at Duct Inlet (Pa)Absolute Relative Difference
M 1 130,866125,00036.355740.000808
M 2 459,853444,80036.326350.000020
M 3 746,586726,00036.32563
Table 6. Time-step independence test based on outlet air temperature.
Time Step (s)Number of VolumesAverage Temperature at Duct Outlet (°C)Absolute Relative Difference
1800444,80019.74640.000015
3600444,80019.74670.000005
7200444,80019.7468
Table 7. Comparative summary of main parameters used in Vaz et al. [54], Rodrigues et al. [53], and the present study.
ParameterVaz et al. [54]Rodrigues et al. [53]Present Study
Type of studyExperimentalNumericalNumerical
Domain dimensionsNot applicable10 × 15 × 25.77 mSame as
Rodrigues et al. [53]
Number of ducts331
Burial depth1.60 m (A, B)
0.50 m (C)
Same as
Vaz et al. [54]
1.60 m
Duct diameter110 mm (A, B)
100 mm (C)
Same as
Vaz et al. [54]
110 mm
Soil propertiesDerived from
experimental
calibration
Same as
Vaz et al. [54]
Same as
Rodrigues et al. [53]
Inlet air velocity3.30 m/s (A)
3.60 m/s (B)
2.50 m/s (C)
Same as
Vaz et al. [54]
3.30 m/s
Inlet air temperatureMeasured
experimentally
(annual cycle)
Averaged daily
values from
Vaz et al. [54]
Same as
Rodrigues et al. [53]
Ground surface
temperature
Measured
experimentally
(annual cycle)
Averaged daily
values from
Vaz et al. [54]
Same as
Rodrigues et al. [53]
Simulation period1 year of
monitoring
2 years
(1 year stabilization)
Same as
Rodrigues et al. [53]
Table 8. Thermophysical properties of the materials adopted in the validation and verification of the GAHE-PCM.
Materials ρ (kg/m3)k (W/m·K) c p (J/kg·K) μ (kg/(m·s))
Air1.1650.026710051.9 × 10 5
Moist sand14520.761150
Chongqing soil18001.1860
CA–PA/EG904.55.43/3.261750
Table 9. Annual average thermal potential for preliminary PCM configurations.
CaseAnnual Average
Heating TP (°C)
Increase
(%)
Annual Average
Cooling TP (°C)
Increase
(%)
Reference2.02−2.83
Concentric configurations
    Circular concentric3.4269.31−3.6127.56
    Square concentric3.4269.31−3.6127.56
Eccentric configurations
    Circular eccentric3.3666.34−3.5726.15
    Semicircular eccentric3.2761.88−3.5124.03
    Rectangular eccentric3.1053.47−3.4822.97
Table 10. Annual average thermal potential for the rectangular cross-section PCM container.
CaseAnnual Average
Heating TP (°C)
Improvement
(%)
Annual Average
Cooling TP (°C)
Improvement
(%)
Reference2.02−2.83
13.1153.96−3.4421.55
23.3264.36−3.6127.56
33.4269.31−3.6127.56
43.3364.85−3.6227.92
53.2761.88−3.5926.86
63.2560.89−3.5224.38
73.1756.93−3.4822.97
83.0751.98−3.4521.91
92.9948.02−3.4120.49
102.9445.54−3.3518.37
112.8943.07−3.3016.61
122.8340.10−3.2615.19
132.7737.13−3.2213.78
142.7536.14−3.1812.37
152.7033.66−3.1611.66
Table 11. Annual average thermal potential for the elliptical cross-section PCM container.
CaseAnnual Average
Heating TP (°C)
Increase
(%)
Annual Average
Cooling TP (°C)
Increase
(%)
Reference2.02−2.83
13.2359.90−3.5023.67
23.3465.35−3.6227.92
33.4269.31−3.6127.56
43.3364.85−3.6227.92
53.2862.38−3.5826.50
63.2359.90−3.5224.38
73.1153.96−3.4923.32
83.0249.50−3.4521.91
92.9847.52−3.3719.08
102.9043.56−3.3317.67
112.8440.59−3.2815.90
122.7737.13−3.2414.49
132.7435.64−3.2213.78
142.7435.64−3.1712.01
152.6631.68−3.1210.25
Disclaimer/Publisher’s Note: The statements, opinions and data contained in all publications are solely those of the individual author(s) and contributor(s) and not of MDPI and/or the editor(s). MDPI and/or the editor(s) disclaim responsibility for any injury to people or property resulting from any ideas, methods, instructions or products referred to in the content.