The qualitative visualization findings, statistical mean, turbulent flow field, and spectral analysis are discussed in this section.
3.1. Flow Visualization Study
The Reynolds number of the flow visualization experiment was 760, well below the Reynolds number range of the conducted measurements, but certainly within the turbulent regime. This choice was dictated by limitations in the recording speed of the video hardware used and the relative ease in the interpretation of visualization results obtained in a low-speed flow. Differences in flow physics arise with increasing Reynolds number, the most important being, at least as the nearfield coherent motion is concerned, the variations with Re
d of the formation region length [
10,
11], as well as of the streamwise distance over which the constant periodicity of the shed Kármán street prevails [
1,
9]. However, these aspects of the motion do not affect the basic mechanisms of the coherent motion, which are of primary interest here. These include, in principle, the topography of the confined vortex street and its “overall signature” on the flow as imprinted in the attained quantitative data distributions.
The topology of the near wake region (x
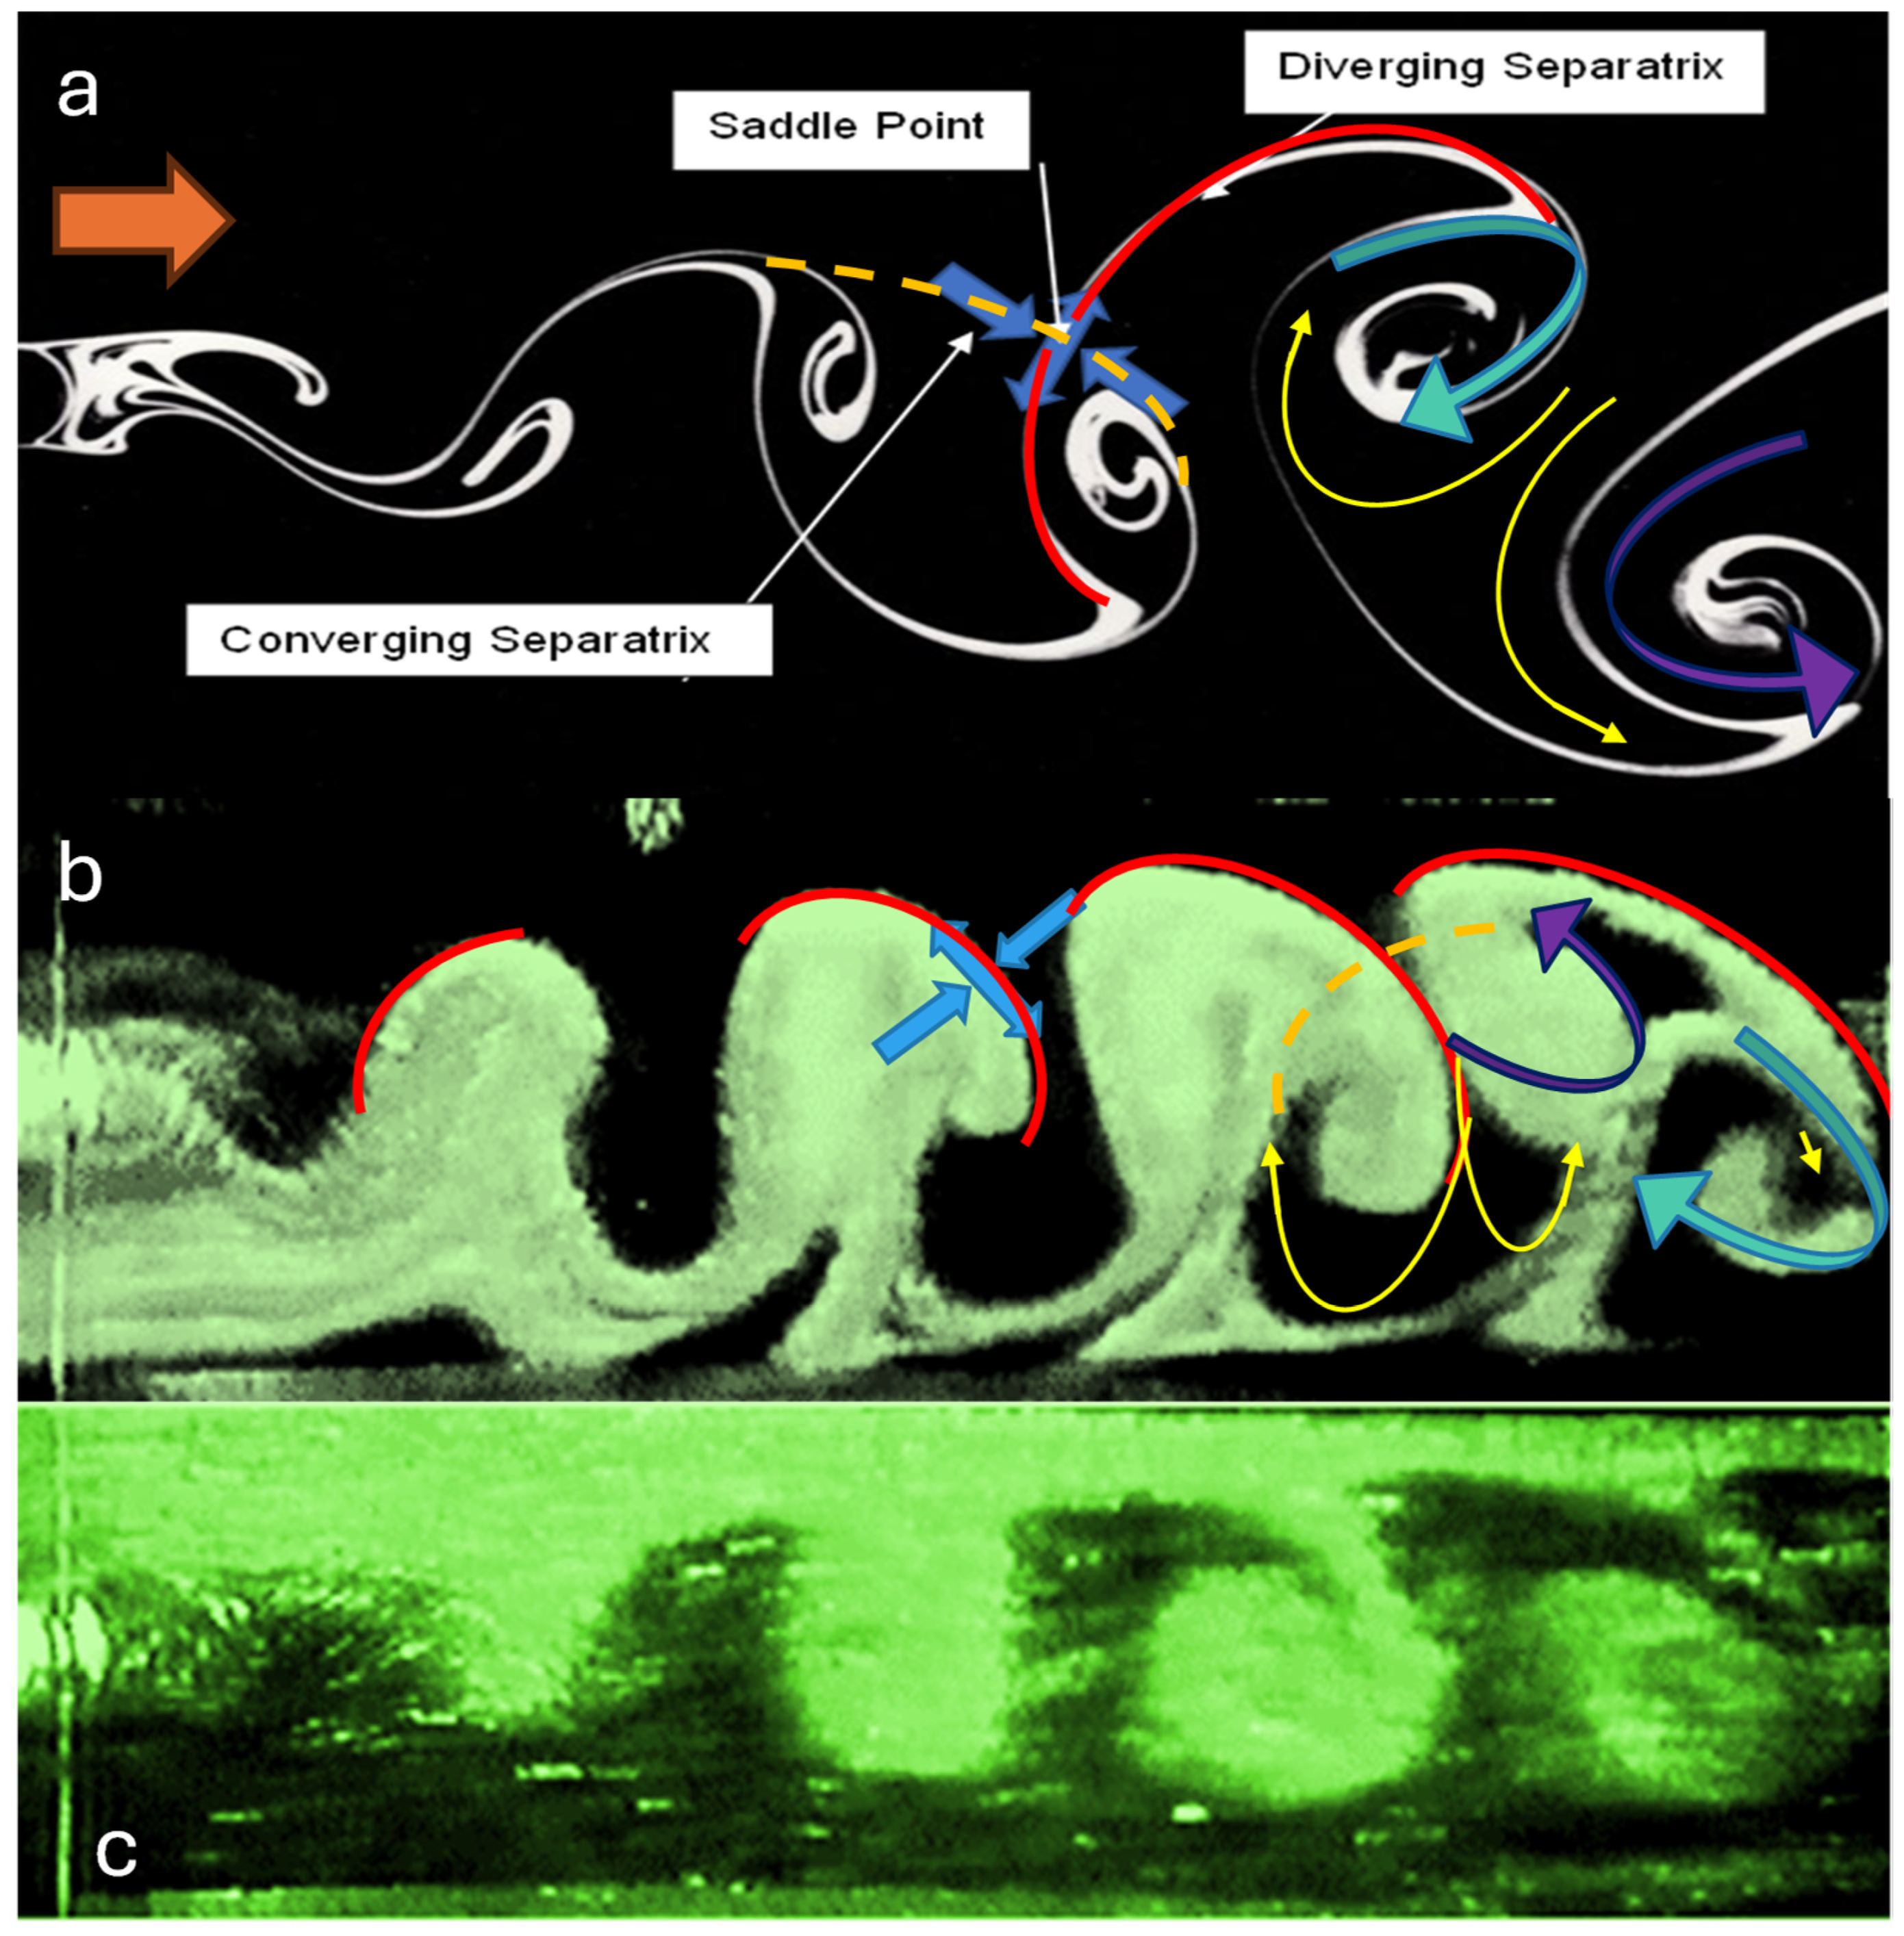
1/d = 0–26) was examined initially. A general view of the confined flow configuration in this region is shown in
Figure 2b,c. For comparison, the early development of an unbounded wake is depicted in
Figure 2a. In the confined case, the pictures presented in this figure visualize the nearfield coherent motion under different seeding conditions.
Figure 2b shows aspects of the motion originating from the lower part of the channel, while
Figure 2c tracks the evolution of the upper flow zone. Organized motions of intermediate scale (longitudinal vortices with vorticity principally along the x
1 and x
2 axes), but of substantial dynamical significance, positioned between successive Kármán vortices with mainly spanwise (x
3) vorticity, can also be seen in
Figure 2b and especially in
Figure 3.
Figure 2 offers a qualitative appreciation of the intense mass and momentum exchange taking place between the two sides of the wake. At the borders of the bright regions and very close to the centreline, regions of concentrated vorticity, namely the Kármán vortices, elliptical in shape, are visible as they are convected downstream, especially in the right-hand part of all the pictures.
In
Figure 2a,b, some topological aspects of the free and the presently studied confined wake have been included. These are the converging and diverging separatrices—often referred to as rib or braid regions—connecting consecutive counter-rotating spanwise structures and the saddle points formed at their intersections. The sense of rotation of the spanwise motion of the bounded and unbounded vortex street is also illustrated. Additionally, the motion of initially irrotational fluid towards its entrainment by the Kármán vortices is indicated by yellow arrows. The downstream increase in the spatial relationship between spanwise structures and ribs is prevalent from the examination of the evolving flow in
Figure 2. In the unbounded configuration, successive separatrices remain parallel to each other since no flow constraint exists in the lateral direction. This is not the case in the presence of a wall restricting the lateral spread of the wake, as in the present situation. Observation of the downstream evolution of a diverging separatrix (denoted by a continuous red line in
Figure 2b) shows that this line has the “right” orientation—as in the free case—in the vicinity of the bluff body. Subsequently, it is gradually tilted in the clockwise direction due to the existing lateral extent limitation. Further downstream, the diverging separatrices of the confined flow grow parallel to each other in the “reverse sense” relative to the free case.
Because of the topological modification described above, the major characteristic of the confined wake is the observed transposition of vortices. Kármán vortices initially form at the expected position in the suction region of the body; that is, clockwise and counterclockwise eddies originate from the upper and lower surfaces of the cylinder, respectively. Further downstream, an upward movement of counterclockwise vortices with positive circulation to the upper midplane of the flow is observed. Simultaneously, countermotion of eddies with negative vorticity across the symmetry axis towards the lower half of the street takes place [
35]. The sequence of events shown in
Figure 4 presents the evolution of the motion of a negative vortex from its stage of formation (
Figure 4a) to a downstream distance (
Figure 4c), where it has already crossed the horizontal symmetry axis.
The approach of the wake vortices to the walls possessing the same sign of vorticity provides a mechanism for their survival. The flow clearly “adapts” itself in the confined environment where it develops. If this topological change in the near wake did not occur, cancellation of vorticity between the street vortices and the wall layers would have happened, probably resulting in the eventual inhibition of the vortex street. The modified topology of the confined Kármán street is also evident in the visualization results as well as in the contours of coherent vorticity of Nakagawa et al. [
34], who studied the near wake of a rectangular cylinder at a blockage ratio of 20%.
Figure 5 and
Figure 6 show aspects of the bounded wake motion further downstream. A rather well-arranged periodic system of vortices is presented in
Figure 5, which visualizes the region x
1/d = 0–65. A varying degree of order of the Kármán vortices from left to right is presented in
Figure 6, where the illustrated region of development is x
1/d = 26–76. The above pictures indicate qualitatively the destruction of the periodic flow regime initially formed behind the body. The succeeding structure is similar in form to the preceding one but more random in character and of larger scale.
3.2. Mean and Turbulent Field Study
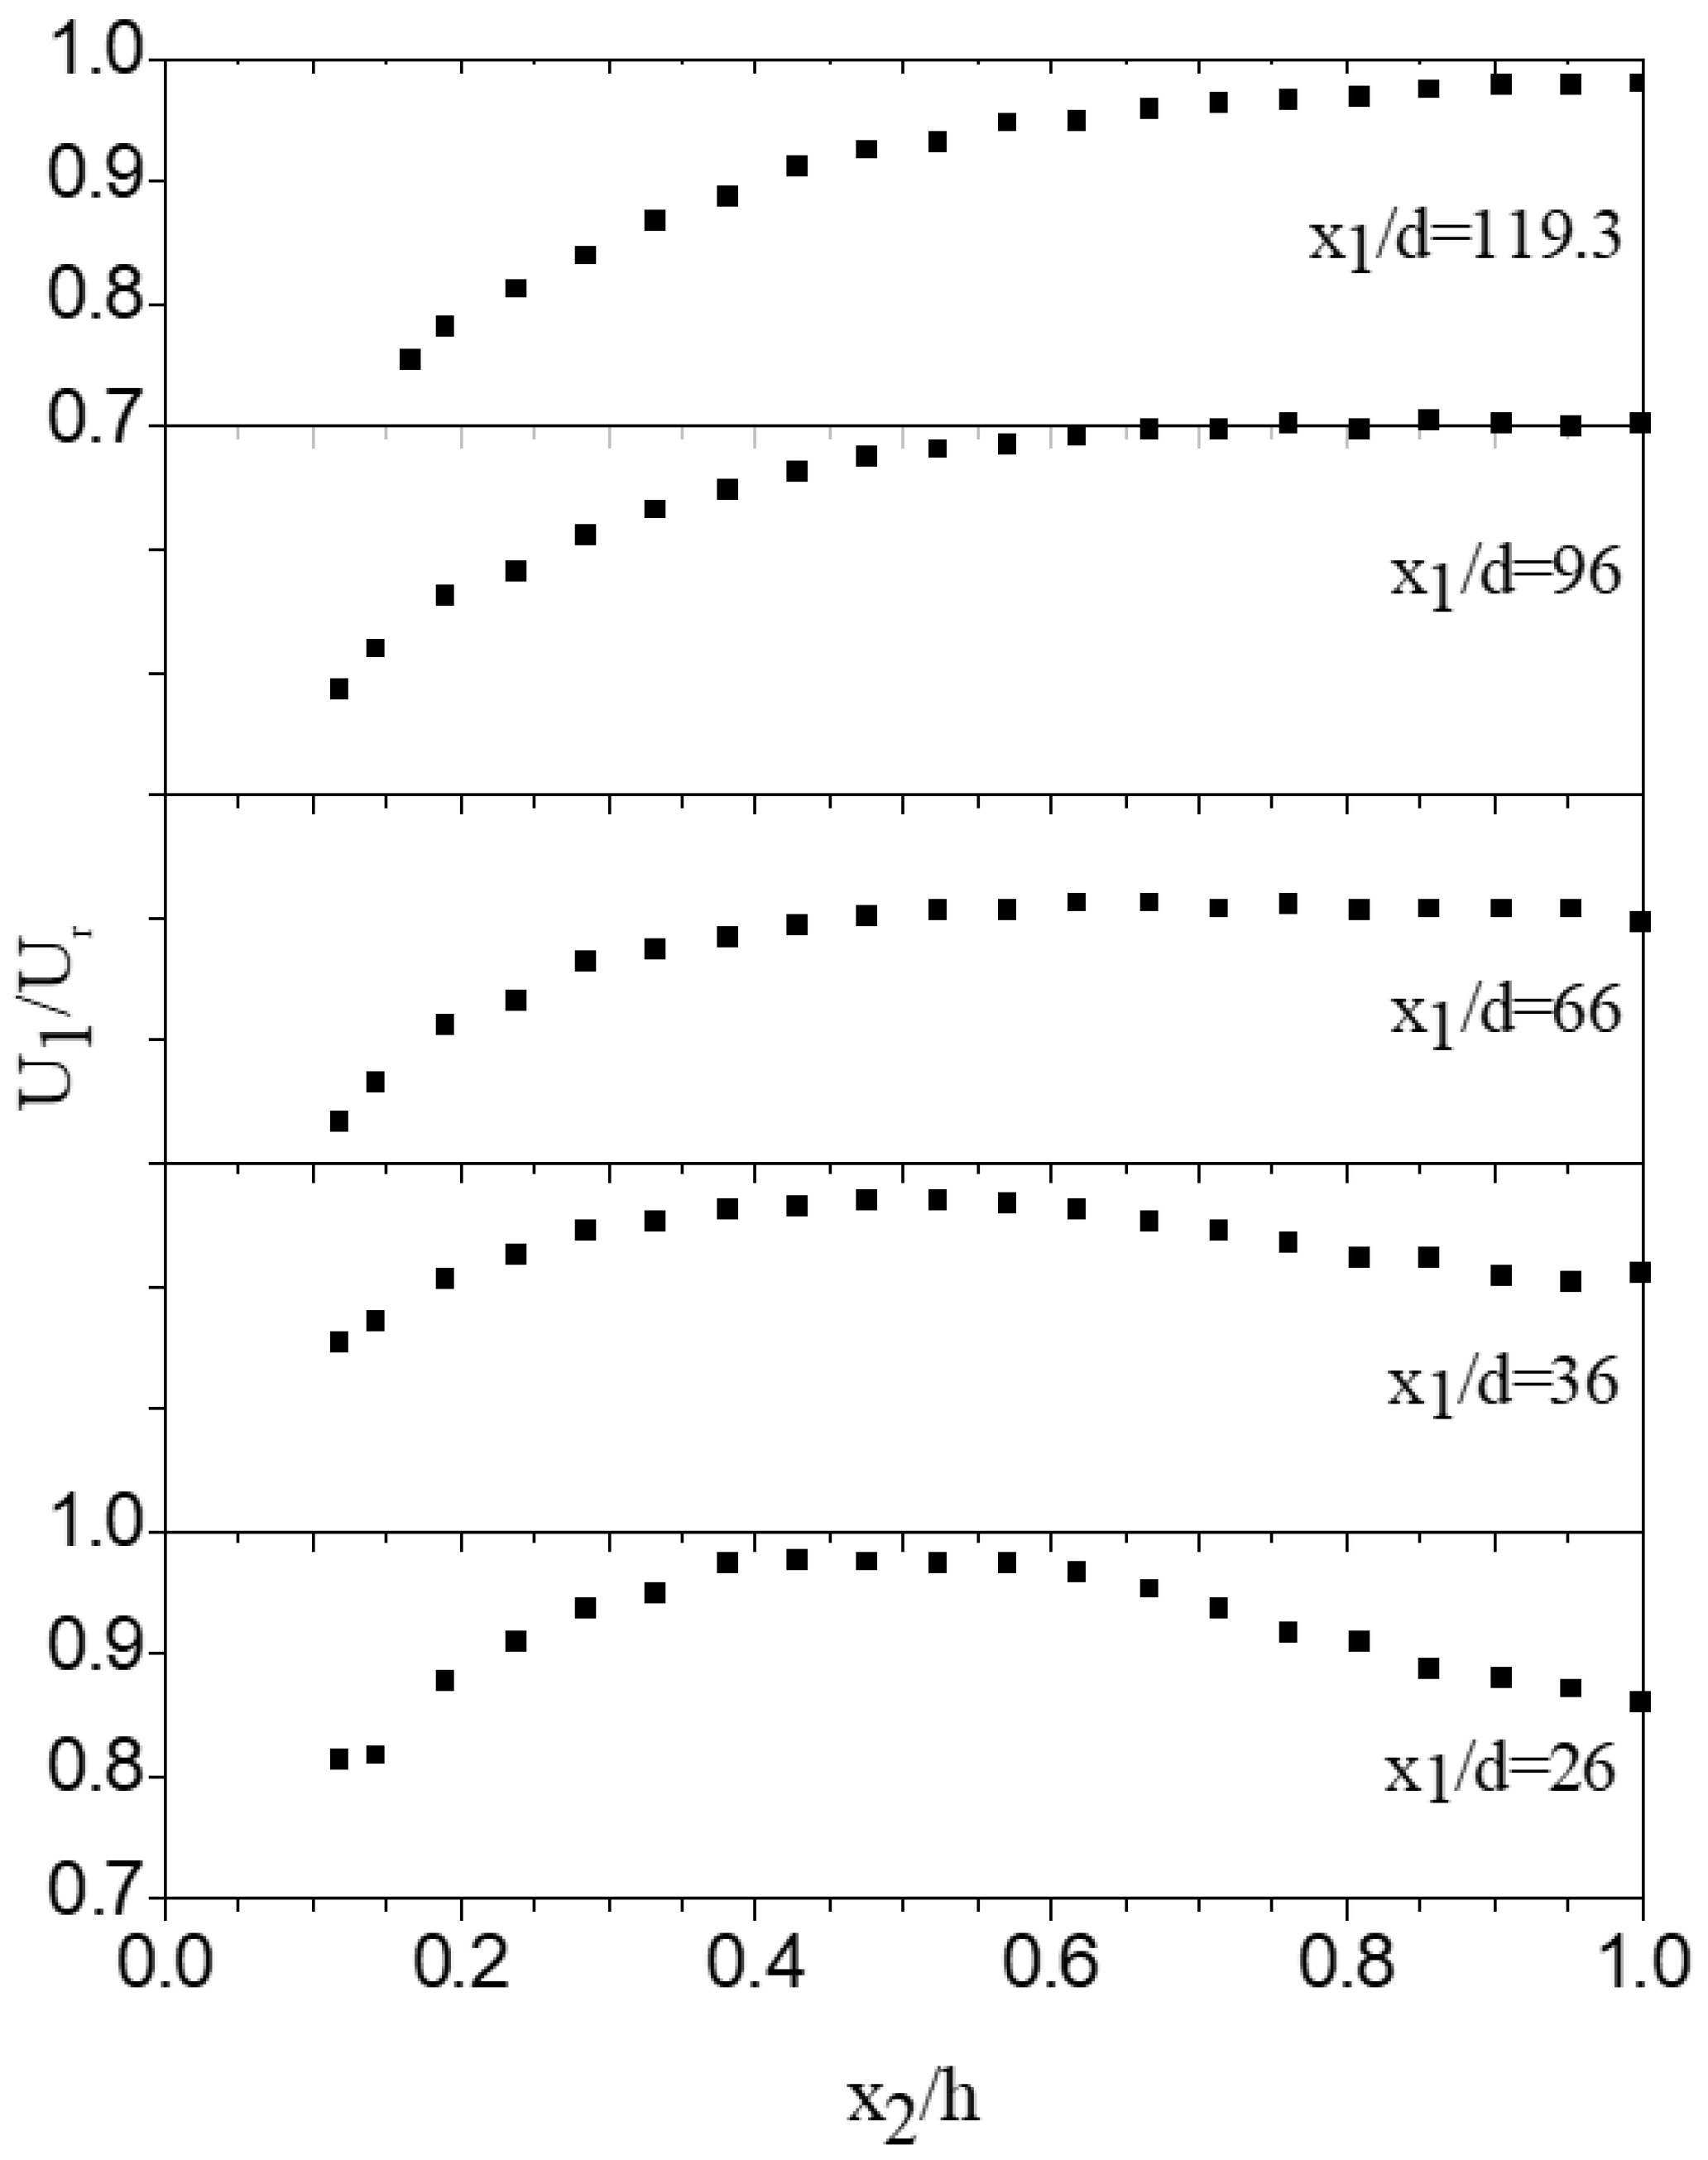
Transverse mean velocity distributions at various downstream positions along the experimental facility are presented in nondimensional form in
Figure 7. The local mean velocities have been normalized with the axial reference velocity U
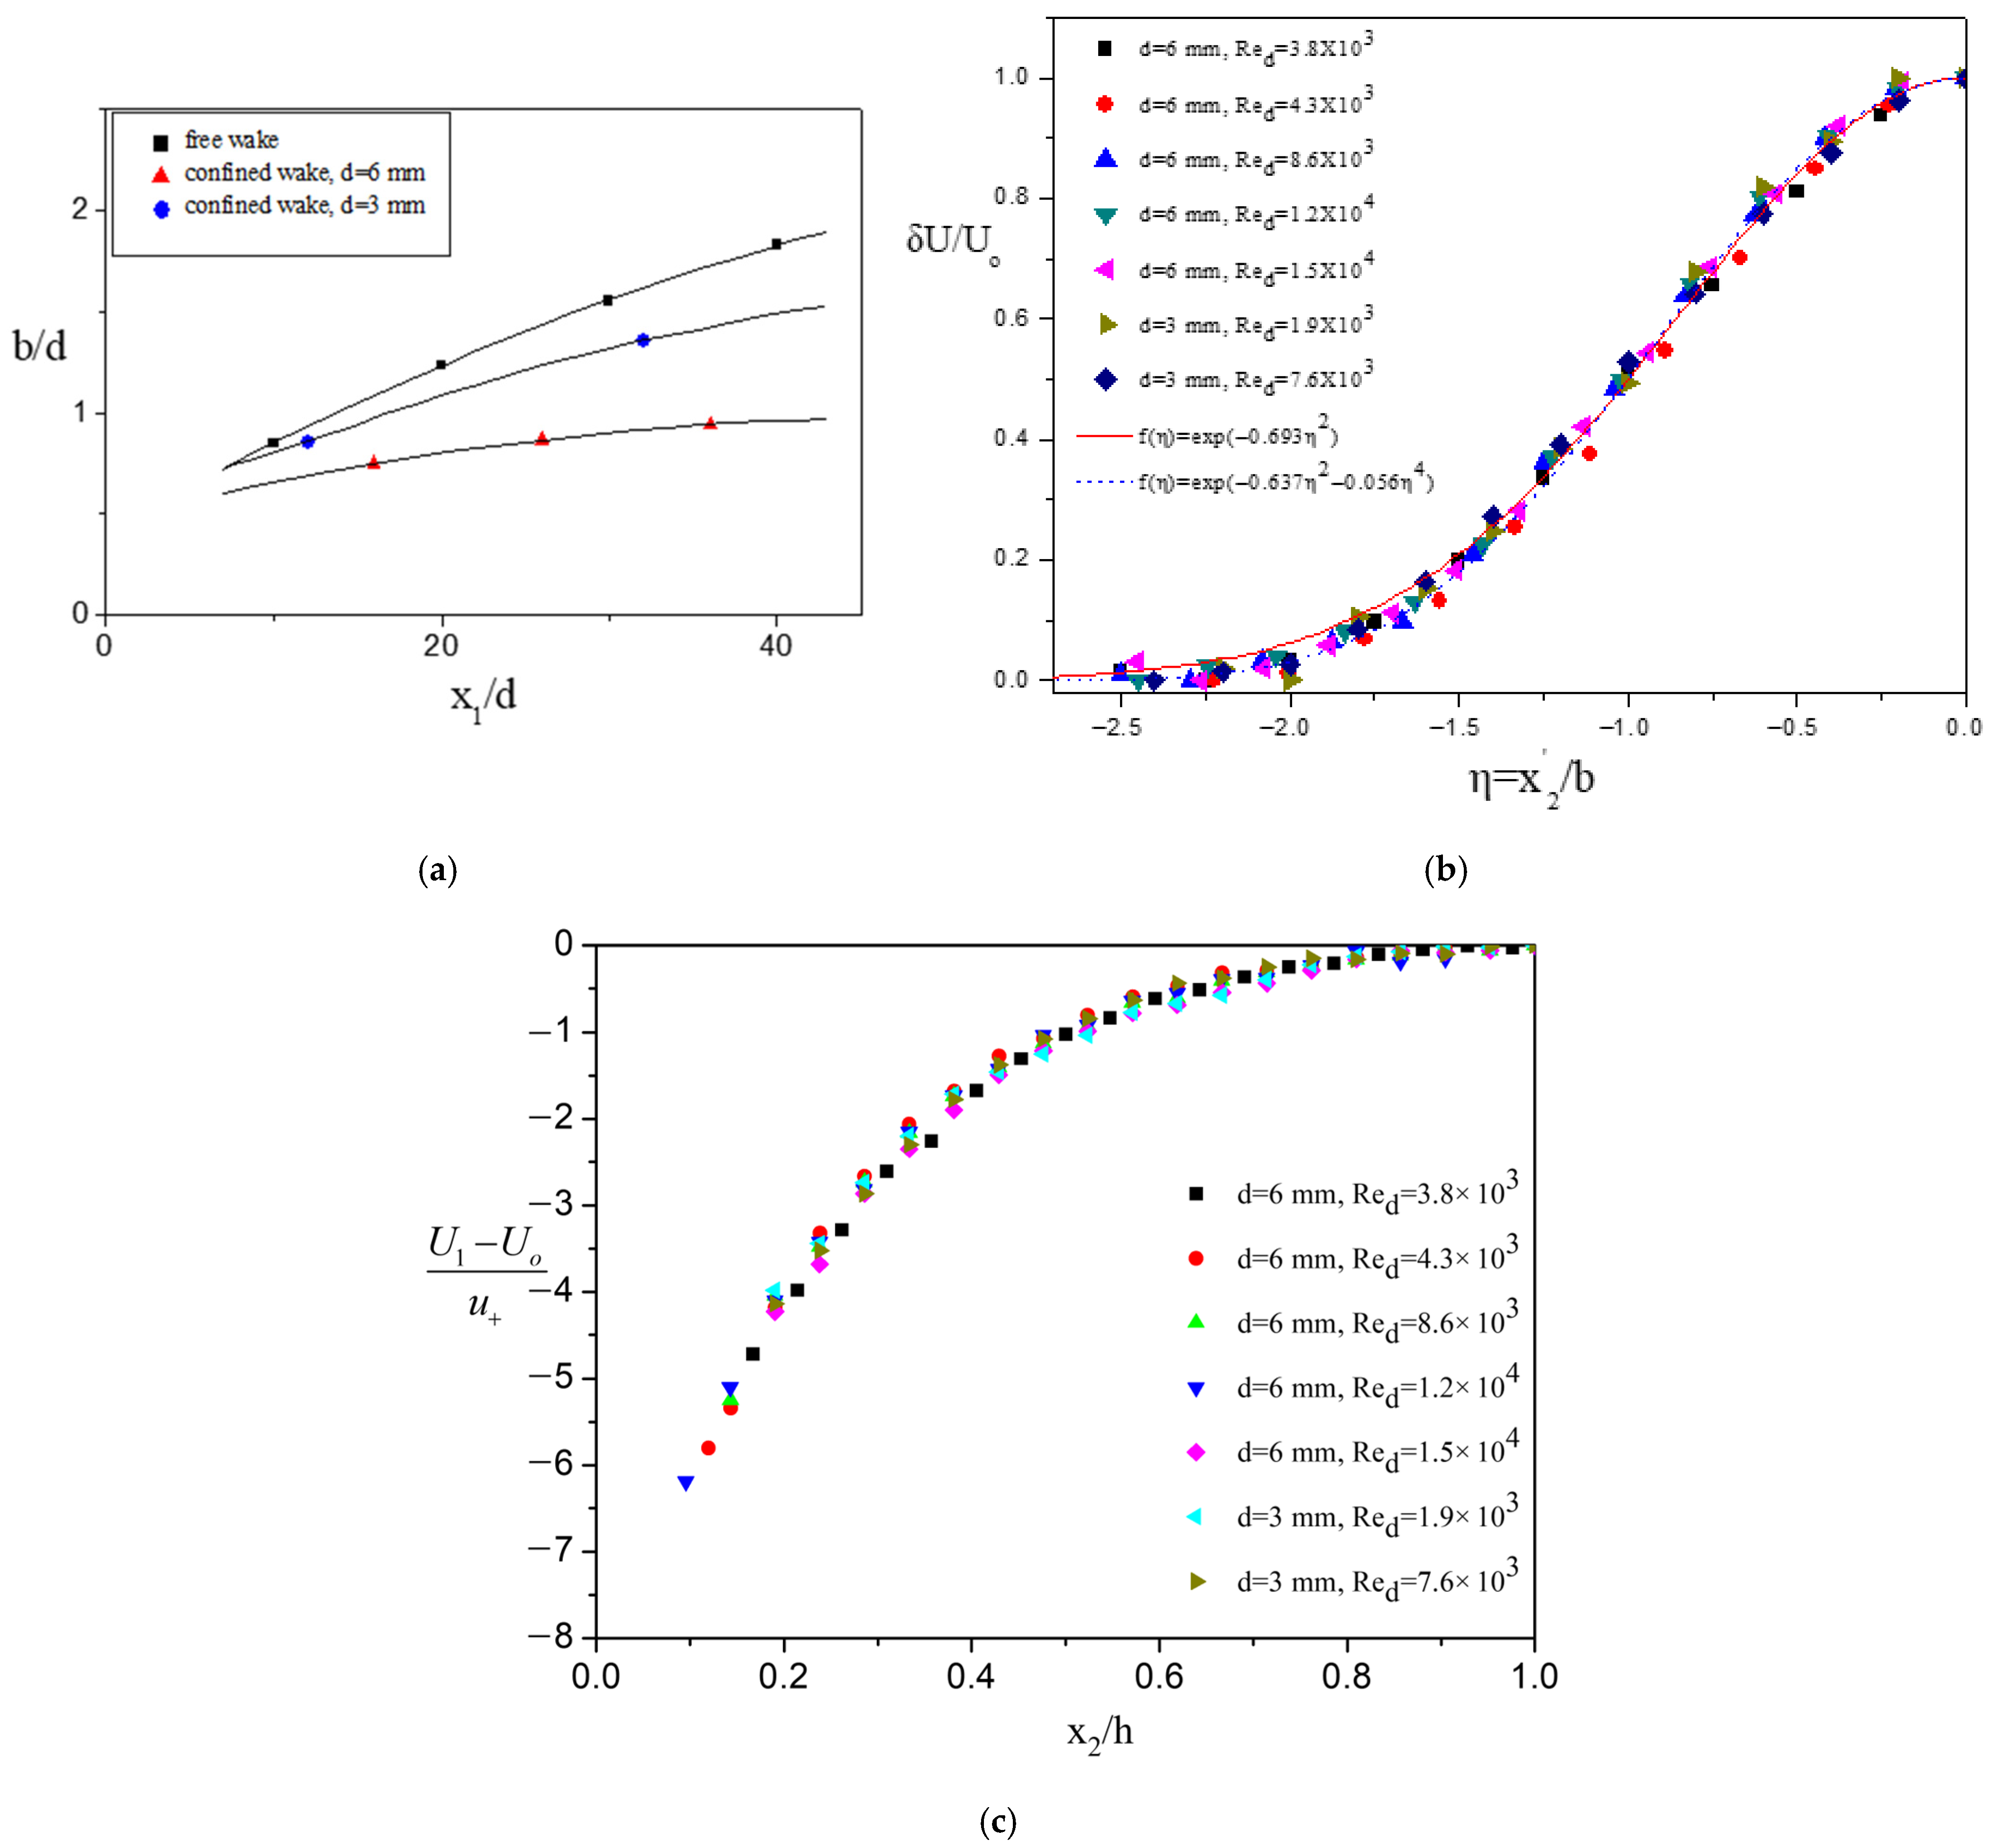
r. The obtained nearfield mean profiles are qualitatively similar in form to those commonly observed in free wakes, though the velocity deficit region appears more “compressed” in the vertical direction in the present flow. Examination of
Figure 8a, where the spreading rates of the unrestricted and the presently studied confined wake are shown, confirms this behavior. According to the data of this figure, the wake halfwidth of the present study, in the near region where velocity deficit profiles exist, increases as b ∝ x
10.46 and b ∝ x
10.24 behind the 3 and the 6 mm in diameter cylinder, respectively, as compared to the free wake growth of b ∝ x
10.5.
The initially observed “velocity deficit” distributions do not persist indefinitely. For x
1/d > 60, the mean velocity distributions differ markedly from those attained in the near wake region. The alteration of the mean profiles can be explained by the observed vortex street reversal. Consequently, the velocity induced in the core flow region by the two rows of counter-rotating vortices with mainly spanwise vorticity lies in the same direction as the mean flow celerity.
Figure 6, for example, clearly demonstrates this.
Additionally,
Figure 8b presents early confined wake profiles obtained in the Reynolds number range examined here (1.9 × 10
3 ≤ Re
d ≤ 1.5 × 10
4) at x
1/d = 36 and 56. Fully developed free wake mean deficit distributions are also included in this figure for comparison. The latter are represented by the exponential functions f(η) = exp(−0.693 η
2) traditionally used to describe the mean velocity profile, and f(η) = exp(−0.637 η
2–0.056 η
4) proposed by Wygnanski et al. [
9], to achieve better agreement with measurements at the outer edges of the wake. Here, δU is the local velocity deficit, U
o is the maximum deficit at the center of the wake, and η ≡
/b is the dimensionless transverse distance from the centerline. (The notation is introduced to distinguish the transverse wake coordinate from x
2, originally defined in
Figure 1b). The present early core flow data agree relatively well with the free wake profiles. However, they demonstrate a possible trend of acceleration relative to the free case. This result can be seen in conjunction with
Figure 8a, where it is observed that the confined wake halfwidth is narrower than its unbounded counterpart. Hence, the velocity field induced by the spanwise structures in that region increases the translational flow velocity near the symmetry axis and gradually alters the initial deficit profile. In
Figure 8c, the distant confined wake mean velocity data are shown for the whole Reynolds number range under study.
As with the early deficit field, self-similarity is observed in the distant “channel flow” region. The same is true also for the various Reynolds stress distributions at the same measurement stations, not presented here.
In accordance with the wake profile “destruction” previously described, the mean flow field becomes subsequently nearly uniform at the core in the transverse direction, as shown in
Figure 7. At the same time, this uniform region decreases in lateral extent along the intermediate stations of the parallel flow section because of boundary layer growth and increases with streamwise development of the deformation rate of eddies with spanwise vorticity. Gradually, this zone shrinks to a small region around the symmetry axis close to the exit of the first duct. In general, the attained mean velocity distributions resemble those of a channel flow for x
1/d ≥ 60.
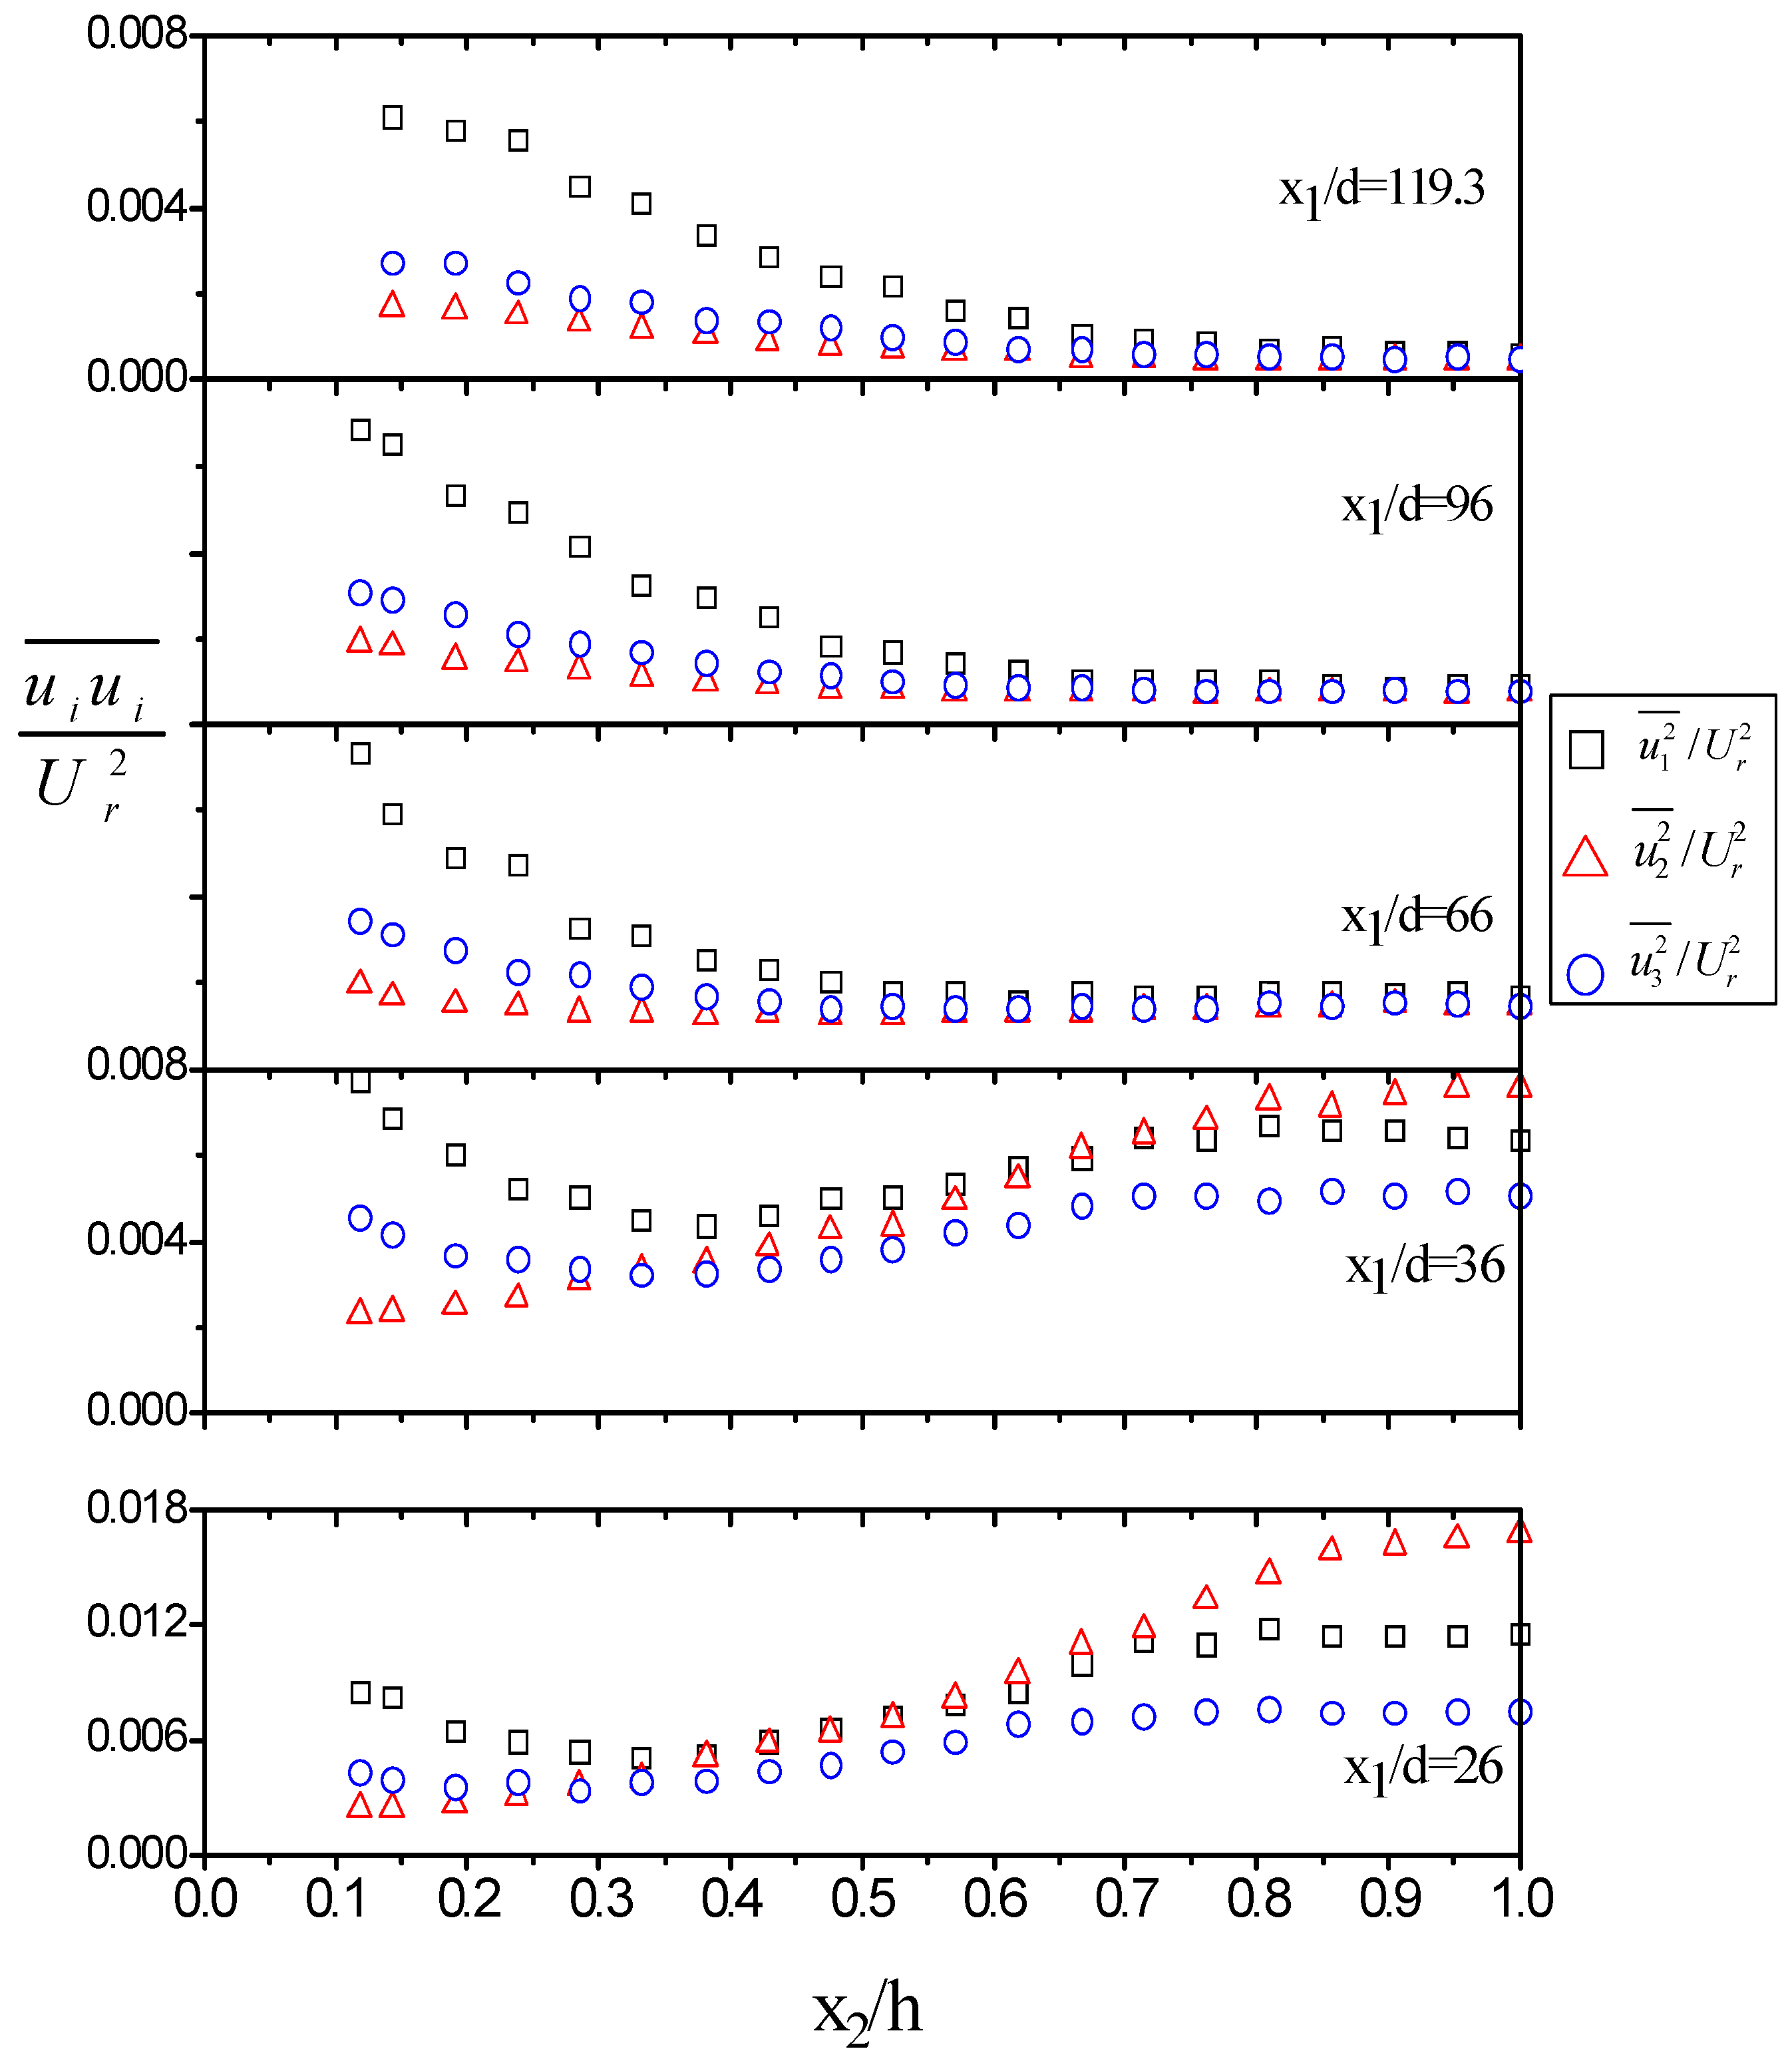
Figure 9 shows transverse distributions of the intensity components,
,
and
, normalized by the reference velocity U
r in the range x
1/d = 26–119.3. The turbulence action is concentrated mainly at the core near the cylinder, with
being initially the largest, as is commonly observed in wake flows. As with the mean field, there is a close resemblance of the fluctuating motion to the free wake case in the near region. In the remaining part of the parallel flow section, the attained distributions become progressively uniform but not isotropic at the central zone and strongly non-uniform close to the walls. In general, mean shearing prevailing in the vertical direction leads to transverse distributions with
>
>
in regions where ∂U
1/∂x
2 ≠ 0, with the latter inequality being stronger the higher the mean shear rate.
The normalized Reynolds shear stress
/
distributions are shown in
Figure 10. These profiles exhibit the familiar antisymmetric form throughout. Except for the initial “wake-like” distributions near the cylinder (up to x
1/d ≈ 60), the remaining profiles vary essentially linearly in regions where ∂U
1/∂x
2 ≠ 0. Since the mean shear rate ∂U
1/∂x
2 is positive in the lower halfplane of the flow for x
1/d ≥ 66, the quantity is negative throughout this region. The Reynolds shear stress, defined as τ = −ρ
, is thus positive without exception in the same region.
The alteration of the mean velocity and the turbulent stress profiles after x1/d ≈ 60, previously observed, raises the question of what remains of the wake effect at the end of the straight section. Moreover, to gain an understanding of the distant structure, its resemblance to the free wake and fully developed channel flow configurations needs to be examined. To clarify the above, measurements of the momentum field were carried out at the exit of the parallel duct in the absence of the bluff-body under identical inlet flow conditions with the preceding wake ones. These supplementary measurements do not correspond to the fully developed channel flow situation, due to the insufficient length of the parallel duct. However, since only fully developed channel data exist in the literature, in the following, the present channel measurements are compared with related experimental fully developed data, expecting imperfect agreement with the latter. In this comparison, and for the reasons stated above, confined wake data are also included.
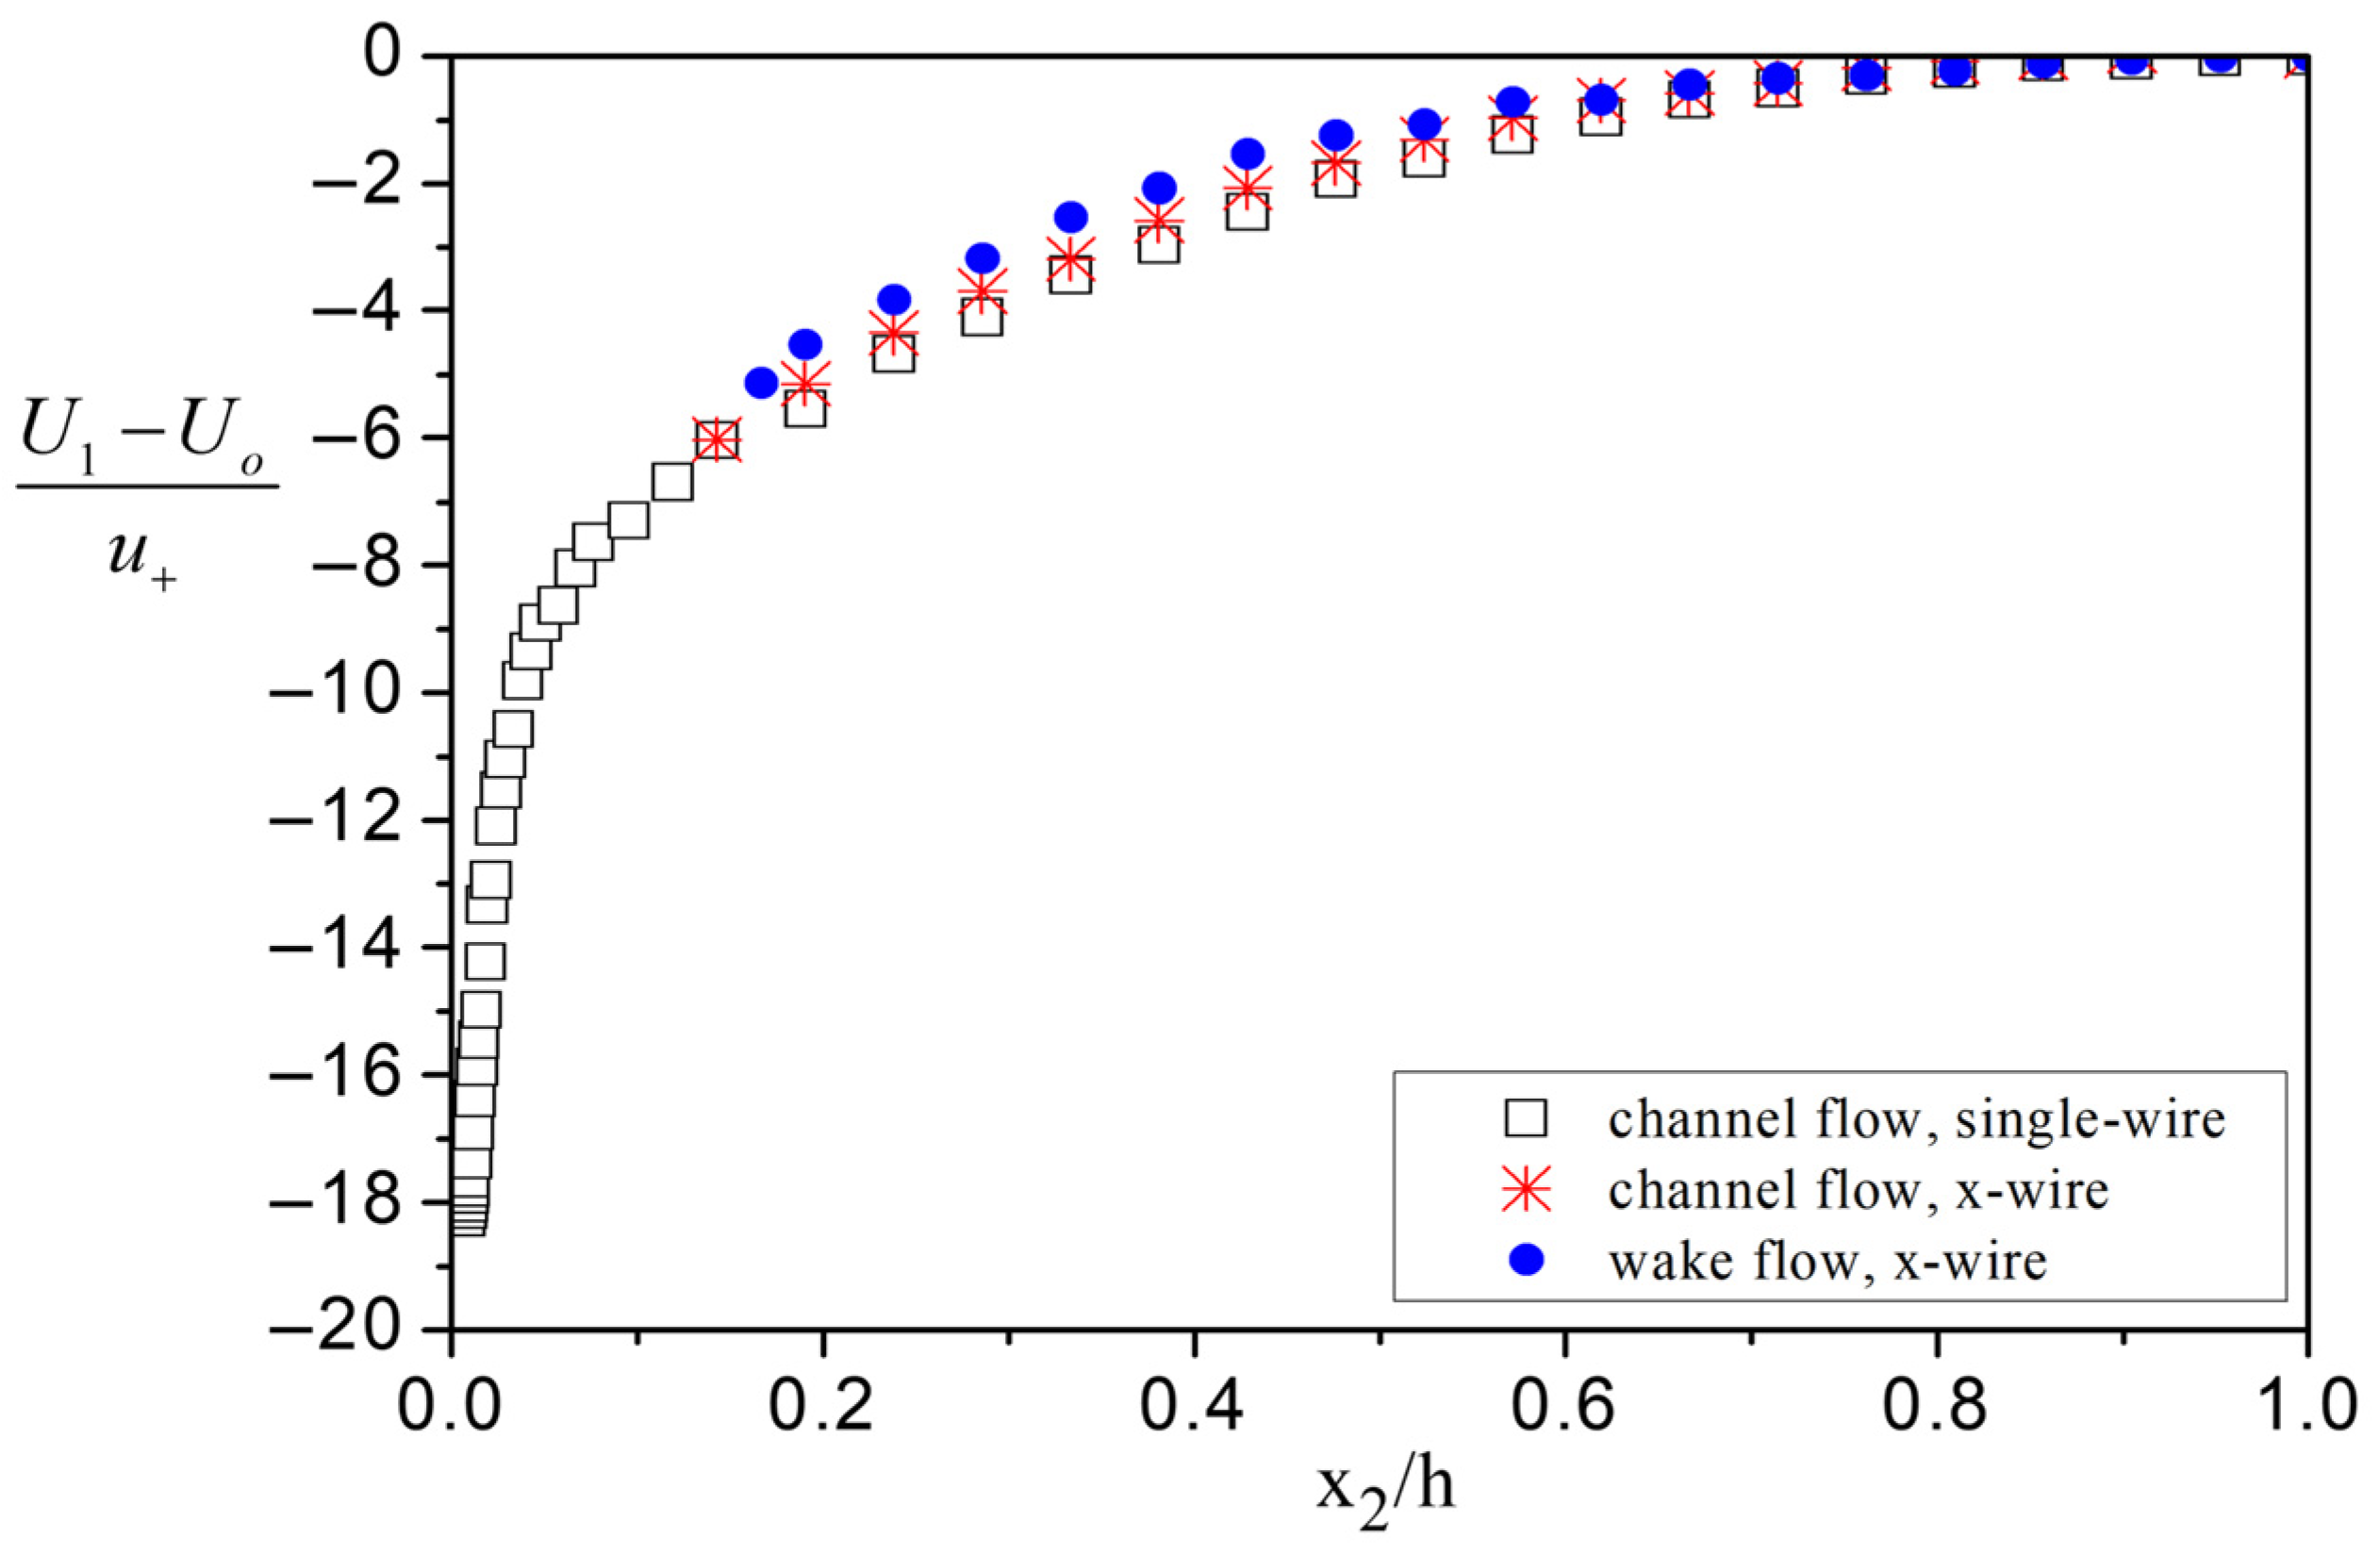
Figure 11 presents mean velocity profiles for channel and wake flow, normalized by the friction velocity and expressed in outer variables, at the farthest measuring station in the parallel section (x
1/d = 119.3). The friction velocity u
+ was estimated following the procedure described by Djenidi et al. [
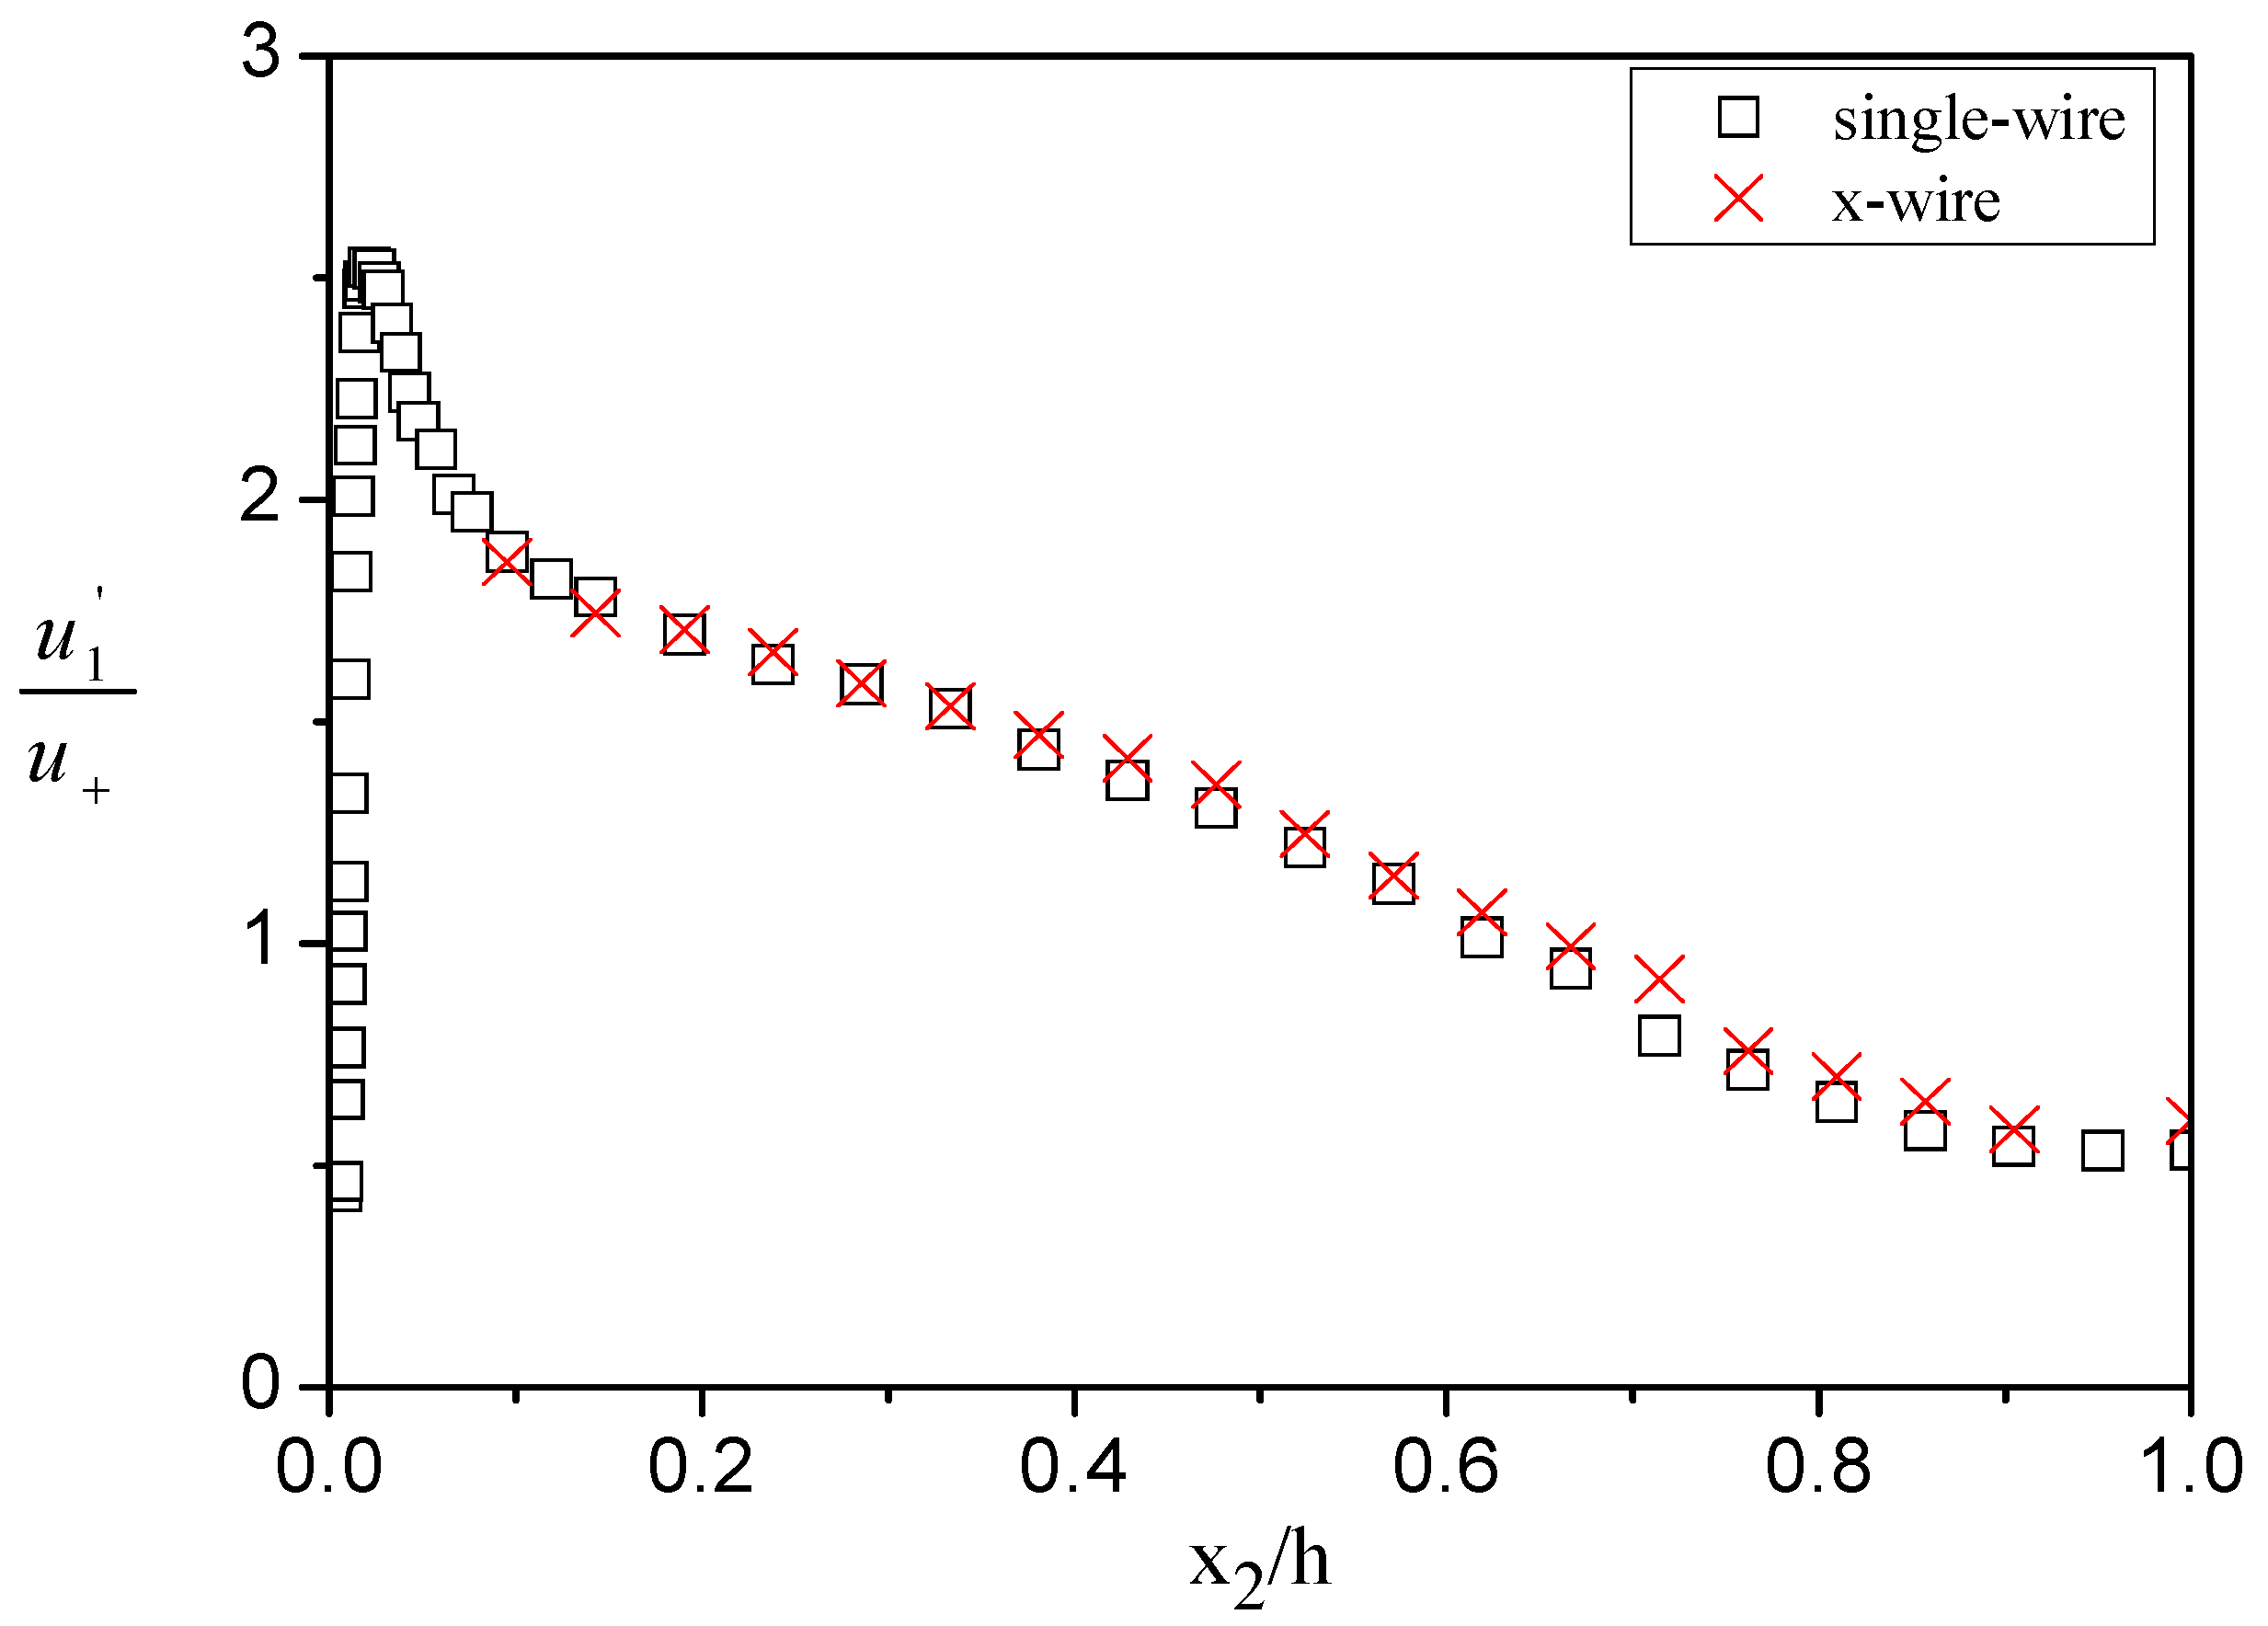
36], based on the assumption of a power law velocity distribution, and is applicable for boundary layer, pipe, and channel flow configurations. As mentioned above, channel flow measurements were obtained using both an X-probe and a single boundary layer type wire, the latter used as a reference probe. It is evident from the examination of
Figure 11 and
Figure 12—where the RMS distribution of the longitudinal velocity component for channel flow is shown—that the two probes provide nearly identical descriptions of the mean and the fluctuating field. Thus, the accuracy of the x-wire measurements is certified. Regarding the streamwise component for channel flow, data from the single-wire probe are presented in all related graphs. The mean confined wake profile (
Figure 11) appears more uniform than the channel distribution in the common range of measurements, due to the “homogenizing” effect of the spanwise wake eddies at the core zone.
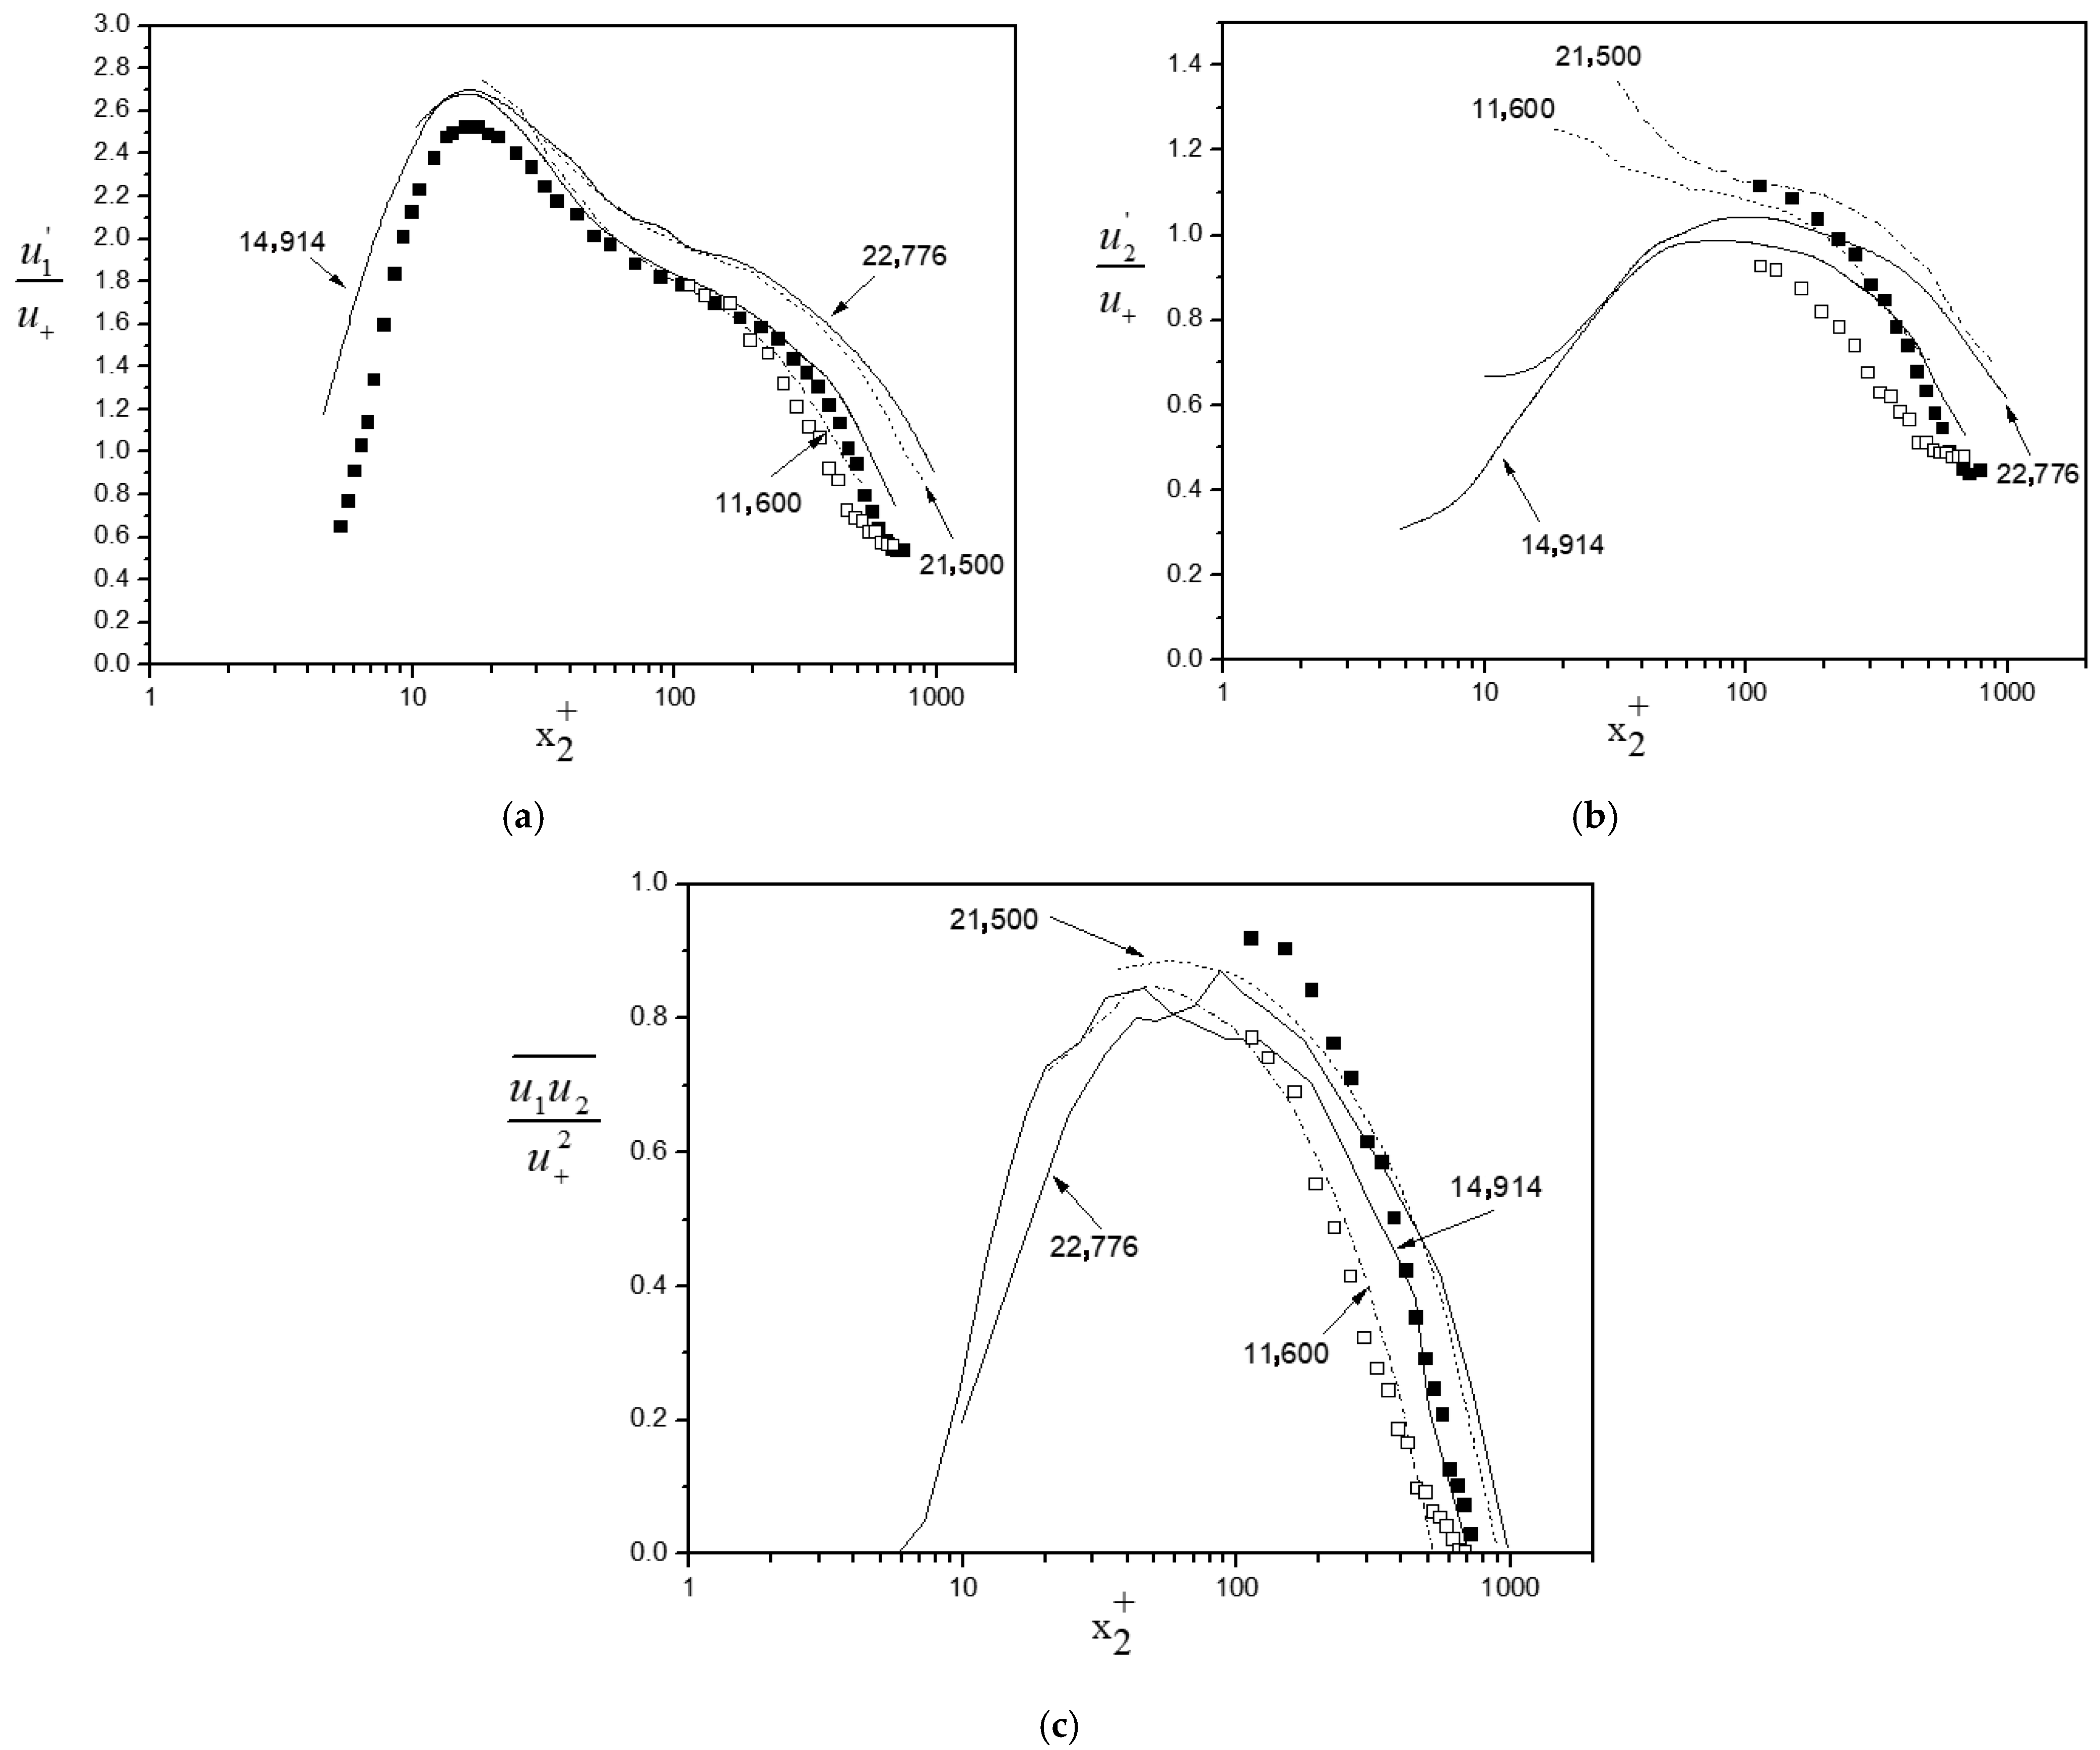
Figure 13 demonstrates the RMS distributions of the streamwise and transverse components (
Figure 13a,b) and the shear stress profile (
Figure 13c) for the present channel and confined wake flow, all expressed in inner variables. Experimental results for fully developed channel flow from Wei and Willmarth [
24], obtained at Re
h = 14,914 and 22,776, and Antonia et al. [
25], at Re
h = 11,600 and 21,500, are also included in
Figure 13. The above choice of Reynolds numbers was dictated by the fact that they were the closest to Re
h = 15,630 of the present channel flow case. The Reynolds number dependence on the dimensionless fully developed turbulent statistics is quite evident in this figure. To avoid overcrowding of the figure, the referenced measurements have been omitted and are represented by a family of curves passing through the original data.
In all graphs presented in
Figure 13, the present channel results exhibit relatively better agreement with the Re
h = 14,914 case of the Wei and Willmarth experiment due to the closer proximity in Reynolds number, especially for
≥ 300 (
≡ x
2u
+/ν, where ν is the kinematic viscosity and the superscript + denotes normalization by the wall variables). Since the present channel flow is not fully developed, the agreement with the literature data is only qualitative, especially for u
1. The streamwise component shows a faster trend towards the fully developed stage in relation to the other moments presented in
Figure 13. In contrast, the observed deviations are largest for u
2, indicating a much slower trend for the normal fluctuations. Therefore, the deviations of
from the corresponding fully developed curves are also substantial. Regarding the confined wake measurements, also included in
Figure 13, it is observed that the corresponding profiles differ appreciably from the present and the referenced channel flow data. This indicates that they represent a quantitative macroscopic signature resulting from a different flow structure. Turbulent flow field statistics reveal a less “canonical” channel flow. This is clearly seen in
Figure 13, where comparison of Reynolds stress values between channel and wake flow illustrates a ratio value near 1.0 at the wall proximity (
= 100), and then increases monotonically towards the channel core (
= 650) where values of 7.0 are observed. Ratio values of 1.0 reflect the effect of wall confinement, while larger values indicate a progressive loss of organized vortex coupling and transition toward channel-like turbulence.
Additional insight into the present confined wake and channel flow dynamics is provided by the examination of measured spectra and correlations, derived from both configurations.
Figure 14 and
Figure 15 present axial and transverse component spectra and the corresponding autocorrelation coefficients ρ
11 and ρ
22, respectively, measured at several distances from the cylinder. The variation in the above distributions from the vicinity of the generating obstacle towards the end of the parallel section can thus be seen for the bounded wake case.
Channel flow spectra and autocorrelations obtained close to the exit of the parallel section are also included in these figures. To compare the various wake and channel spectra, all taken at the same x
2 position (x
2/h = 0.71), the spectral densities
and
of u
1 and u
2, respectively, have been normalized.
Normalization is such that the energy content variation of each component with wavenumber band can be observed due to variations in flow development and configuration. Here k1 = ω/Ur is the wavenumber in the x1 direction, ω is the radian frequency, and , are the local mean square values. No attempt is made here to find out if some scaling law exists (presumably in outer variables since we consider measured spectra close to the centerline). In fact, no scaling exists because we are dealing with wake spectra at various stages of flow development and channel spectra as well.
Fluctuations in a wide k
1h range are observed in all measured wake spectra, providing evidence that different scales coexist in the flow. The nearfield spectra (x
1/d = 36 and 56) demonstrate definite high intensity peaks at k
1h ≈ 0.8 in the present coordinates, specifically intense in u
2 corresponding to the vortex shedding or Kármán frequency for the Reynolds number examined in this case. This is in accordance with Bevilaqua’s [
37] suggestion that velocity fluctuations due to a vortex street are more readily detected in the cross-wake (u
2) component. This behavior, also noticeable in
Figure 15b, constitutes an essential feature of the vortex shedding process immediately downstream of the bluff-body, where the spectral density of the velocity fluctuations is characterized by high-quality peaks quite different in nature from those of many other unstable flows.
The constant periodicity of the large-scale motion near the cylinder is seen to prevail up to about x
1/d = 60 in the present case. A direct measure of the rapid destruction of the Kármán vortex street is provided by observing the evolution of the spectral peak with downstream distance. The confined wake spectral distributions of the velocity fluctuations in the present study follow quite similar behavior regarding the evolution of the shedding frequency with free wake flows. Cimbala et al. [
10] report that the Kármán street shed in the wake of a circular cylinder does not persist indefinitely but rather decays exponentially with downstream distance. They found experimentally that the decay is rapid, such that velocity fluctuations at the Kármán frequency are lost in ‘background noise’ at a distance between 100 and 150 diameters at Re
d = 150. They also state that the decay is even faster in turbulent wakes where the small-scale motion is more prevalent. Ferré and Giralt [
11] point out that the large-scale motions detected in the near wake are Kármán vortices, the periodic activity of which is lost beyond the 60 diameters. The same estimate for the longitudinal distance over which the initial periodicity terminates also comes out from Taneda’s [
1] earlier experiments.
Further downstream (x
1/d = 119.3,
Figure 14), but also in all measured spectra beyond the 60 diameters not presented here, no sign of periodicity is observed in the measured wake spectral densities. The u
1 component spectral densities reach maxima at lower k
1h values, indicating that the greatest portion of its energy content is favorably distributed to larger scales. The secondary vortex street, which evolves after the original Kármán street has largely decayed, is more diffuse in character and of larger scale. As with the free wake, in the present confined case, the far structure shows no preference for any frequency or scale. A broad band of fluctuations is visible in the related spectra, the center of the band shifting to lower wavenumbers (larger scales) as the flow evolves downstream. The transverse u
2 component spectra show maxima, in general, far from the origin. This happens because the corresponding correlation often becomes negative for small time delays τ (
Figure 15b), which in turn means backflow (due to u
2) along the x
1 direction. It should be noted that the k
1h ≈ 0.8 value corresponds to a vortex shedding frequency of f
s ≈ 420 Hz measured in the original spectral distributions, which are presented here in normalized form in
Figure 14, as discussed above. This vortex shedding frequency value yields a Strouhal number St ≈ 0.2, as is the case with free wakes in the subcritical Reynolds number range (300 < Re < 3.0 × 10
5). This is also the case for all the conducted confined wake experiments within the range 1.9 × 10
3 < Re < 1.5 × 10
4 and blockage ratios of 7% and 14%.
The channel flow spectra at x
1/d = 119.3 are smoother for both velocity components than their wake counterparts and more favorably distributed on the larger scale. On the other hand, the wake spectra possess relatively more energy in the inertial and the dissipative wavenumber bands.
Figure 15a clearly demonstrates the difference in scale of the energy-containing part of the motion in the two different flow cases. From the autocorrelation functions, the integral scales L
11,1 of the u
1 component along the x
1 direction have been computed. Hence, a typical length scale of the coherent motion can be derived from the correlation plots of
Figure 15a. For the confined wake and for x
1/d = 36, 56, and 119.3, L
11,1 =1.35 d, 1.63 d, and 2.44 d, respectively, while for channel flow at x
1/d = 119.3, L
11,1 =3.0 h.

