Article

The Effects of Mesoscale Ocean–Atmosphere Coupling on the Quasigeostrophic Double Gyre

by
Ian Grooms
1,* and
Louis-Philippe Nadeau
2,*
1
Department of Applied Mathematics, University of Colorado, Boulder, CO 80309, USA
2
Institut des Sciences de la Mer de Rimouski, Université du Québec à Rimouski, Rimouski, QC G5L 3A1, Canada
*
Authors to whom correspondence should be addressed.
Fluids 2016, 1(4), 34; https://doi.org/10.3390/fluids1040034
Submission received: 30 August 2016 / Revised: 3 October 2016 / Accepted: 8 October 2016 / Published: 21 October 2016
(This article belongs to the Collection Geophysical Fluid Dynamics)

Abstract

:
We investigate the effects of sea surface temperature (SST)-dependent wind stress on the wind-driven quasigeostrophic (QG) double gyre. The main effects are to reduce the strength of the circulation and to shift the inter-gyre jet to the south. The SST front across the inter-gyre jet induces a zonal wind stress anomaly over the jet that accelerates the southern flank of the jet and decelerates the northern flank. This local wind stress anomaly causes the jet to shift southwards. Shifting the jet south, away from the peak wind stress, reduces the net power input to the ocean circulation. Allowing the wind stress to depend on the difference between the atmospheric and oceanic velocity also reduces the net wind power input, and has a larger impact than SST dependence. When wind stress depends only on SST, the impact on the circulation is stronger than when wind stress depends on both SST and ocean surface velocity. Ocean surface velocity dependence leads to direct extraction of mesoscale energy by the winds. In contrast, SST dependence leads to injection (extraction) of mesoscale energy in the subtropical (subpolar) gyres, with almost complete cancellation because of the symmetric wind field.

1. Introduction

Thorough analyses of satellite observations have repeatedly shown variations in the wind stress at the ocean surface on length scales comparable to mesoscale ocean eddies (e.g., [1,2,3]). The range of processes responsible for these mesoscale wind stress variations, and the range of effects that these variations have on atmospheric and oceanic dynamics and on ocean biogeochemistry have been discussed by many authors; Small et al. [4] and Chelton and Xie [5] provide reviews and References [6,7,8,9] provide an incomplete sampling of more recent work. This investigation focuses on two causes of wind stress variations—ocean surface velocity and temperature anomalies—and their impact on the large-scale ocean circulation.
Pacanowski [10] argued that the wind stress τ in an ocean model should depend on both the winds u a and the ocean surface velocity u o through a relation of the form
τ = ρ a C D | u a - u o | ( u a - u o ) ,
where ρ a is the density of air and C D is a dimensionless drag coefficient. Duhaut and Straub [11] and Dawe and Thompson [12] found that this leads to a significant reduction in the net power input by the winds, and that the large-scale circulation is accordingly weakened when compared with the alternative formulation where u o is assumed negligible. Duhaut and Straub [11] showed that the variability in wind stress reduces the net power input by directly removing energy from the ocean mesoscale.
Hogg et al. [13] modeled the effect of sea surface temperature (SST) on wind stress through a relation of the form
τ = ρ a C D ( 1 + α Δ T ) | u a | u a ,
where Δ T is the atmosphere–ocean temperature difference. They found that this also leads to a significant reduction in the strength of the gyre circulation. They argued that transient Ekman pumping anomalies near the western boundary current separation point destabilize the flow; the unstable jet then produces a downgradient flux of potential vorticity (PV) between the gyres, causing the circulation to weaken. More recently, Byrne et al. [9] found that thermodynamic air–sea coupling at the ocean mesoscale in a coupled model enhances the transfer of wind energy to the ocean.
The current investigation considers both of these ocean influences on wind stress, ocean velocity and SST, and on how the resulting wind stress variations impact the large-scale ocean circulation. As in [11,13], we frame our investigation in the context of the classical wind-driven quasigeostrophic (QG) double-gyre. We find, as expected, that both the SST and ocean velocity dependences cause the net wind power input to decrease. The two dependences do not have an additive effect: the impact of the SST dependence is reduced when considered in combination with the ocean velocity dependence. We also find that SST dependence tends to shrink the subtropical gyre at the expense of the subpolar gyre, with an associated southward shift of the inter-gyre jet. This southward bias leads to a new explanation for the way in which SST dependence leads to reduced wind power input: the net wind power input is proportional to the product of the stress and the surface currents τ · u , and the southward shift of the jet leads to a reduction in the stress–current alignment, which results in reduced power input. The southward shift of the jet itself is explained by an SST-induced wind stress anomaly that accelerates the southern edge of the jet and decelerates the northern edge, pushing the jet south.
In Section 2, we describe the formulation and configuration of our QG model with active SST and interactive wind stress. Section 3 analyzes the model output, and Section 4 discusses the results.

2. A Quasigeostrophic Model with SST

The vertical direction of the continuously-stratified quasigeostrophic system is commonly discretized using either a finite–difference approach or projection onto baroclinic modes [14]. Rocha et al. [15] have recently developed a Galerkin truncated (modal) model with active surface buoyancy; we pursue an alternative, finite-volume based approach here.

2.1. Formulation

The continuously-stratified quasigeostrophic system has the form ([16] (Section 5.4))
t b + + J [ ψ + , b + ] + w + E N + 2 = 0 ,
t q + J [ ψ , q ] + β v = 0 ,
t b - + J [ ψ - , b - ] + w - E N - 2 = 0 ,
h 2 ψ + z f 0 2 N 2 ( z ) z ψ = q , S ( z ) = f 0 2 N 2 ( z ) ,
where q is QG PV, ψ is the streamfunction, b = f 0 z ψ is the QG buoyancy, f 0 is the Coriolis frequency, N ( z ) is the buoyancy frequency, J [ f , · ] = x ψ y ( · ) - y ψ x ( · ) , and the subscripts − and + indicate evaluation at z = - H and z = 0 , respectively. The stresses at the top and bottom surfaces generate Ekman layers whose pumping velocity is
w E = 1 ρ 0 f 0 x τ y - y τ x .
We model the stresses at the upper surface using a combined version of Equations (1) and (2)
τ + = ρ a C D ( 1 + α ( Δ T ) ) | u a - u + | ( u a - u + ) ,
where Δ T is the QG SST perturbation and ( Δ T ) is a spatially high-pass filtered version of the QG SST perturbation. The high-pass filtered component is defined as ( Δ T ) = Δ T - Δ T ¯ where
- L f 2 h 2 + 1 Δ T ¯ = Δ T
with no-flux boundary conditions and a filter scale L f = 40 km. The filter scale is an inverse wavenumber, and therefore corresponds to a wavelength of approximately 250 km.
Note the difference in notation with Equation (2) from Hogg et al. [13]: they used the atmosphere-ocean temperature difference where we use the SST perturbation. Local SST perturbations affect wind stress, so, to avoid having the gyre-scale SST pattern influence the wind stress, we spatially high-pass filter the QG SST perturbation. Small et al. [4] (and references therein) point out that the relationship between SST and wind stress that is of interest here occurs on ocean mesoscales, and is in fact opposite to the relationship at basin scales; our use of a high-pass filter ensures that only the eddy-scale part of SST contributes to the wind stress dependence. Furthermore, the SST itself, not the difference between SST and atmospheric boundary–layer temperature, is the quantity found to influence wind stress in observational studies ([4,5] and references therein). The Hogg et al. [13] formulation has the benefit of allowing the atmospheric boundary-layer conditions to adjust to the SST; this effect is lacking in our model, where the atmospheric velocity is imposed, symmetric, and purely zonal.
The proportionality coefficient α is modeled as
α = 0.0027 | u a | - 0.002 K - 1 .
This form is taken from Byrne et al. [7] and Byrne (personal communication). Phrase Indicating Stage of Publication (submitted, in press, etc). We use a standard linear Ekman layer model for the stress at the bottom boundary ([16] Section 2.12.3)
τ - = d f 0 ρ 0 2 u - + z ^ × u - .
The SST perturbation Δ T is needed to compute the stress at the upper surface. Walstad and Robinson [17] developed a model coupling deep QG dynamics to ocean surface mixed layer dynamics; in their model, the QG surface buoyancy was located at the base of the mixed layer and was not identified with SST. The simpler three-layer QG model of Hogg et al. [13] also used an additional mixed-layer model governing SST, where the surface mixed layer temperature was not identified with the QG surface buoyancy. In contrast, Spall [18] identified the QG surface buoyancy with SST in his investigation of how wind-stress SST dependence impacts the Eady baroclinic instability problem. SST perturbations are also identified with QG surface buoyancy in recent algorithms to infer subsurface geostrophic velocity using satellite SST observations [19,20]. We chose to develop a model where the QG surface buoyancy is identified with SST; we assume that the QG buoyancy perturbation at the base of the mixed layer is mixed uniformly through the mixed layer to the surface. Using a simple linear univariate equation of state of the form ρ = ρ 0 ( 1 - α T Δ T ) and the Boussinesq approximation leads to the identification
b = g α T Δ T ,
where Δ T is an SST perturbation, g is the gravitational acceleration, and α T is the coefficient of thermal expansion of seawater.
The development of a discretization of the continuous QG equations with respect to the vertical coordinate is well-known ([21], Section 6.18), but we briefly repeat the derivation, in order to point out elements related to active surface buoyancy. The total depth H is discretized into n layers with depth H i , where i increases with depth from 1 at the top to n at the bottom. The vertically-averaged streamfunction, velocity, and potential vorticity (PV) within layer i are denoted ψ i , u i , and q i respectively. The PV in each layer and the surface buoyancy evolve according to
t b + + J [ ψ + , b + ] + w + E N + 2 = 0 ,
t q i + J [ ψ i , q i ] + β v i = 0 , i = 1 , n ,
t b - + J [ ψ - , b - ] + w - E N - 2 = 0 .
To obtain the streamfunction at the top surface ψ + , we assume the existence of a “ghost” layer i = 0 above the surface with depth H 0 = H 1 , and we use the following finite-volume approximations
ψ + = ψ 0 + ψ 1 2 and b + = f 0 H 1 ( ψ 0 - ψ 1 )
to obtain the approximation
ψ + = ψ 1 + H 1 2 f 0 b + .
Similar approximations are made for the bottom surface, and the surface buoyancy equations with these approximations become
t b + + J [ ψ 1 , b + ] + w + E N + 2 = 0 ,
t b - + J [ ψ N , b - ] + w - E N - 2 = 0 .
A standard finite–volume approximation to the PV inversion relation (6) is
h 2 ψ i + 1 H i 2 S i - 1 / 2 H i - 1 + H i ( ψ i - 1 - ψ i ) - 2 S i + 1 / 2 H i + 1 + H i ( ψ i - ψ i + 1 ) = q i , i = 2 , , N - 1 .
In the top layer, we use the relation f 0 b / N 2 ( z ) = S ( z ) z ψ to approximate the PV inversion relation by
h 2 ψ 1 + 1 H 1 f 0 b + N + 2 - 2 S 3 / 2 H 2 + H 1 ( ψ 1 - ψ 2 ) = q 1 .
A similar relation can be obtained for the bottom layer. The surface buoyancy and PV Equations (18) and (14) can be combined to form an evolution equation for surface pseudo-PV that has the form
t Q 1 + J [ ψ 1 , Q 1 ] + β v 1 = f 0 H 1 w + E ,
where
Q 1 = q 1 - f 0 H 1 N + 2 b + = h 2 ψ 1 + 2 S 3 / 2 H 1 ( H 2 + H 1 ) ( ψ 2 - ψ 1 ) .
The bottom layer has a similar pseudo-PV with the form
t Q n + J [ ψ n , Q n ] + β v n = - f 0 H n w - E ,
Q n = q n + f 0 H n N - 2 b - = h 2 ψ n + 2 S n - 1 / 2 H n ( H n - 1 + H n ) . ( ψ n - 1 - ψ n ) .
Since ψ i can be obtained from Q 1 , q 2 , , q n - 1 , and Q n without recourse to b ± , there is typically no need to include separate evolution equations for b ± . In the present investigation, the surface buoyancy impacts the wind stress and therefore the Ekman pumping, and cannot be ignored. Similarly, the bottom buoyancy b - impacts the bottom velocity u - through the bottom–surface analogue of Equation (17), which then influences the Ekman friction by Equation (11). In the interests of simplicity, we neglect this effect and use the traditional discrete approximation of linear Ekman drag
τ - = d f 0 ρ 0 2 u n + z ^ × u n .
The full model is thus described by:
  • Evolution equations for PV and pseudo-PV (14), (22), and (24), to which are added biharmonic viscous terms - ν 4 h 6 ψ i with stress-free boundary conditions;
  • An evolution equation for surface buoyancy (18), to which is added biharmonic diffusion κ h 4 b + with no-flux boundary conditions;
  • PV inversion Equations (20), (23), and (25), supplemented by the usual mass-conserving boundary conditions ψ i dxd y = 0 ;
  • Equations (8) and (26) modeling the stresses, which depend on u + via Equation (17) and on b + via Equations (10) and (12).

2.2. Configuration

In this subsection, we provide the details of the particular model configuration and numerical methods used in our experiments. All parameter values are listed in Table 1.
The system is forced by a double-gyre atmospheric wind pattern of the form
u a = τ 0 2 C D ρ a 1 - cos 2 π y L .
The domain is a square of width L = 3072 km and depth 4.5 km on a midlatitude β plane. The domain is discretized using an equispaced grid of 1025 × 1025 points, leading to a grid size of Δ x = 3 km. The depth is divided into 10 layers with depths increasing exponentially from H 1 = 187 m to H 10 = 551 m. The buoyancy frequency follows the exponential decay:
N ( z ) = N a + Δ N e z / l z , z = [ - 4500 , 0 ] m ,
where N a = 0.0026 s - 1 the value in the abyss, Δ N = 0.004 s - 1 is the top-to-bottom difference in buoyancy frequency and l z = 1 km is the decay scale. The Rossby deformation radii range from 43 km to 7.4 km, all of which are resolved by our horizontal grid spacing. Equation (28) only describes the buoyancy frequency at the interior layer interfaces; at the top surface z = 0 , we set N + = 0.01 s - 1 . Several values of N + were tested, and the value 0.01 s - 1 was chosen because it leads to a mean SST difference on the order of 30 C between the subtropical and subpolar gyres; larger values of N + lead to larger SSTs and vice versa.
All spatial derivatives are approximated using second-order finite differences; the Jacobian advection terms make use of the second-order energy and enstrophy conserving Arakawa Jacobian [22]. The elliptic PV inversion is accomplished using a multigrid V-cycle as described by Nadeau and Straub [23]. The time derivatives are discretized using the third-order Adams–Bashforth scheme with a time step of 15 min.
We run simulations using four configurations of wind stress:
I 
Non-interactive wind stress τ + = ρ a C D | u a | u a ;
II 
Wind stress of the form (1), i.e., depending only on the ocean surface velocity;
III 
Wind stress of the form (2), i.e., depending only on the SST;
IV 
Wind stress of the form (8), i.e., depending on both SST and ocean surface velocity.
Note that the configuration II does not track an SST perturbation; it sets ψ + = ψ 1 rather than the SST-dependent approximation (17). Simulations are spun up from rest until the kinetic energy reaches a statistical equilibrium, typically several decades.

3. Results

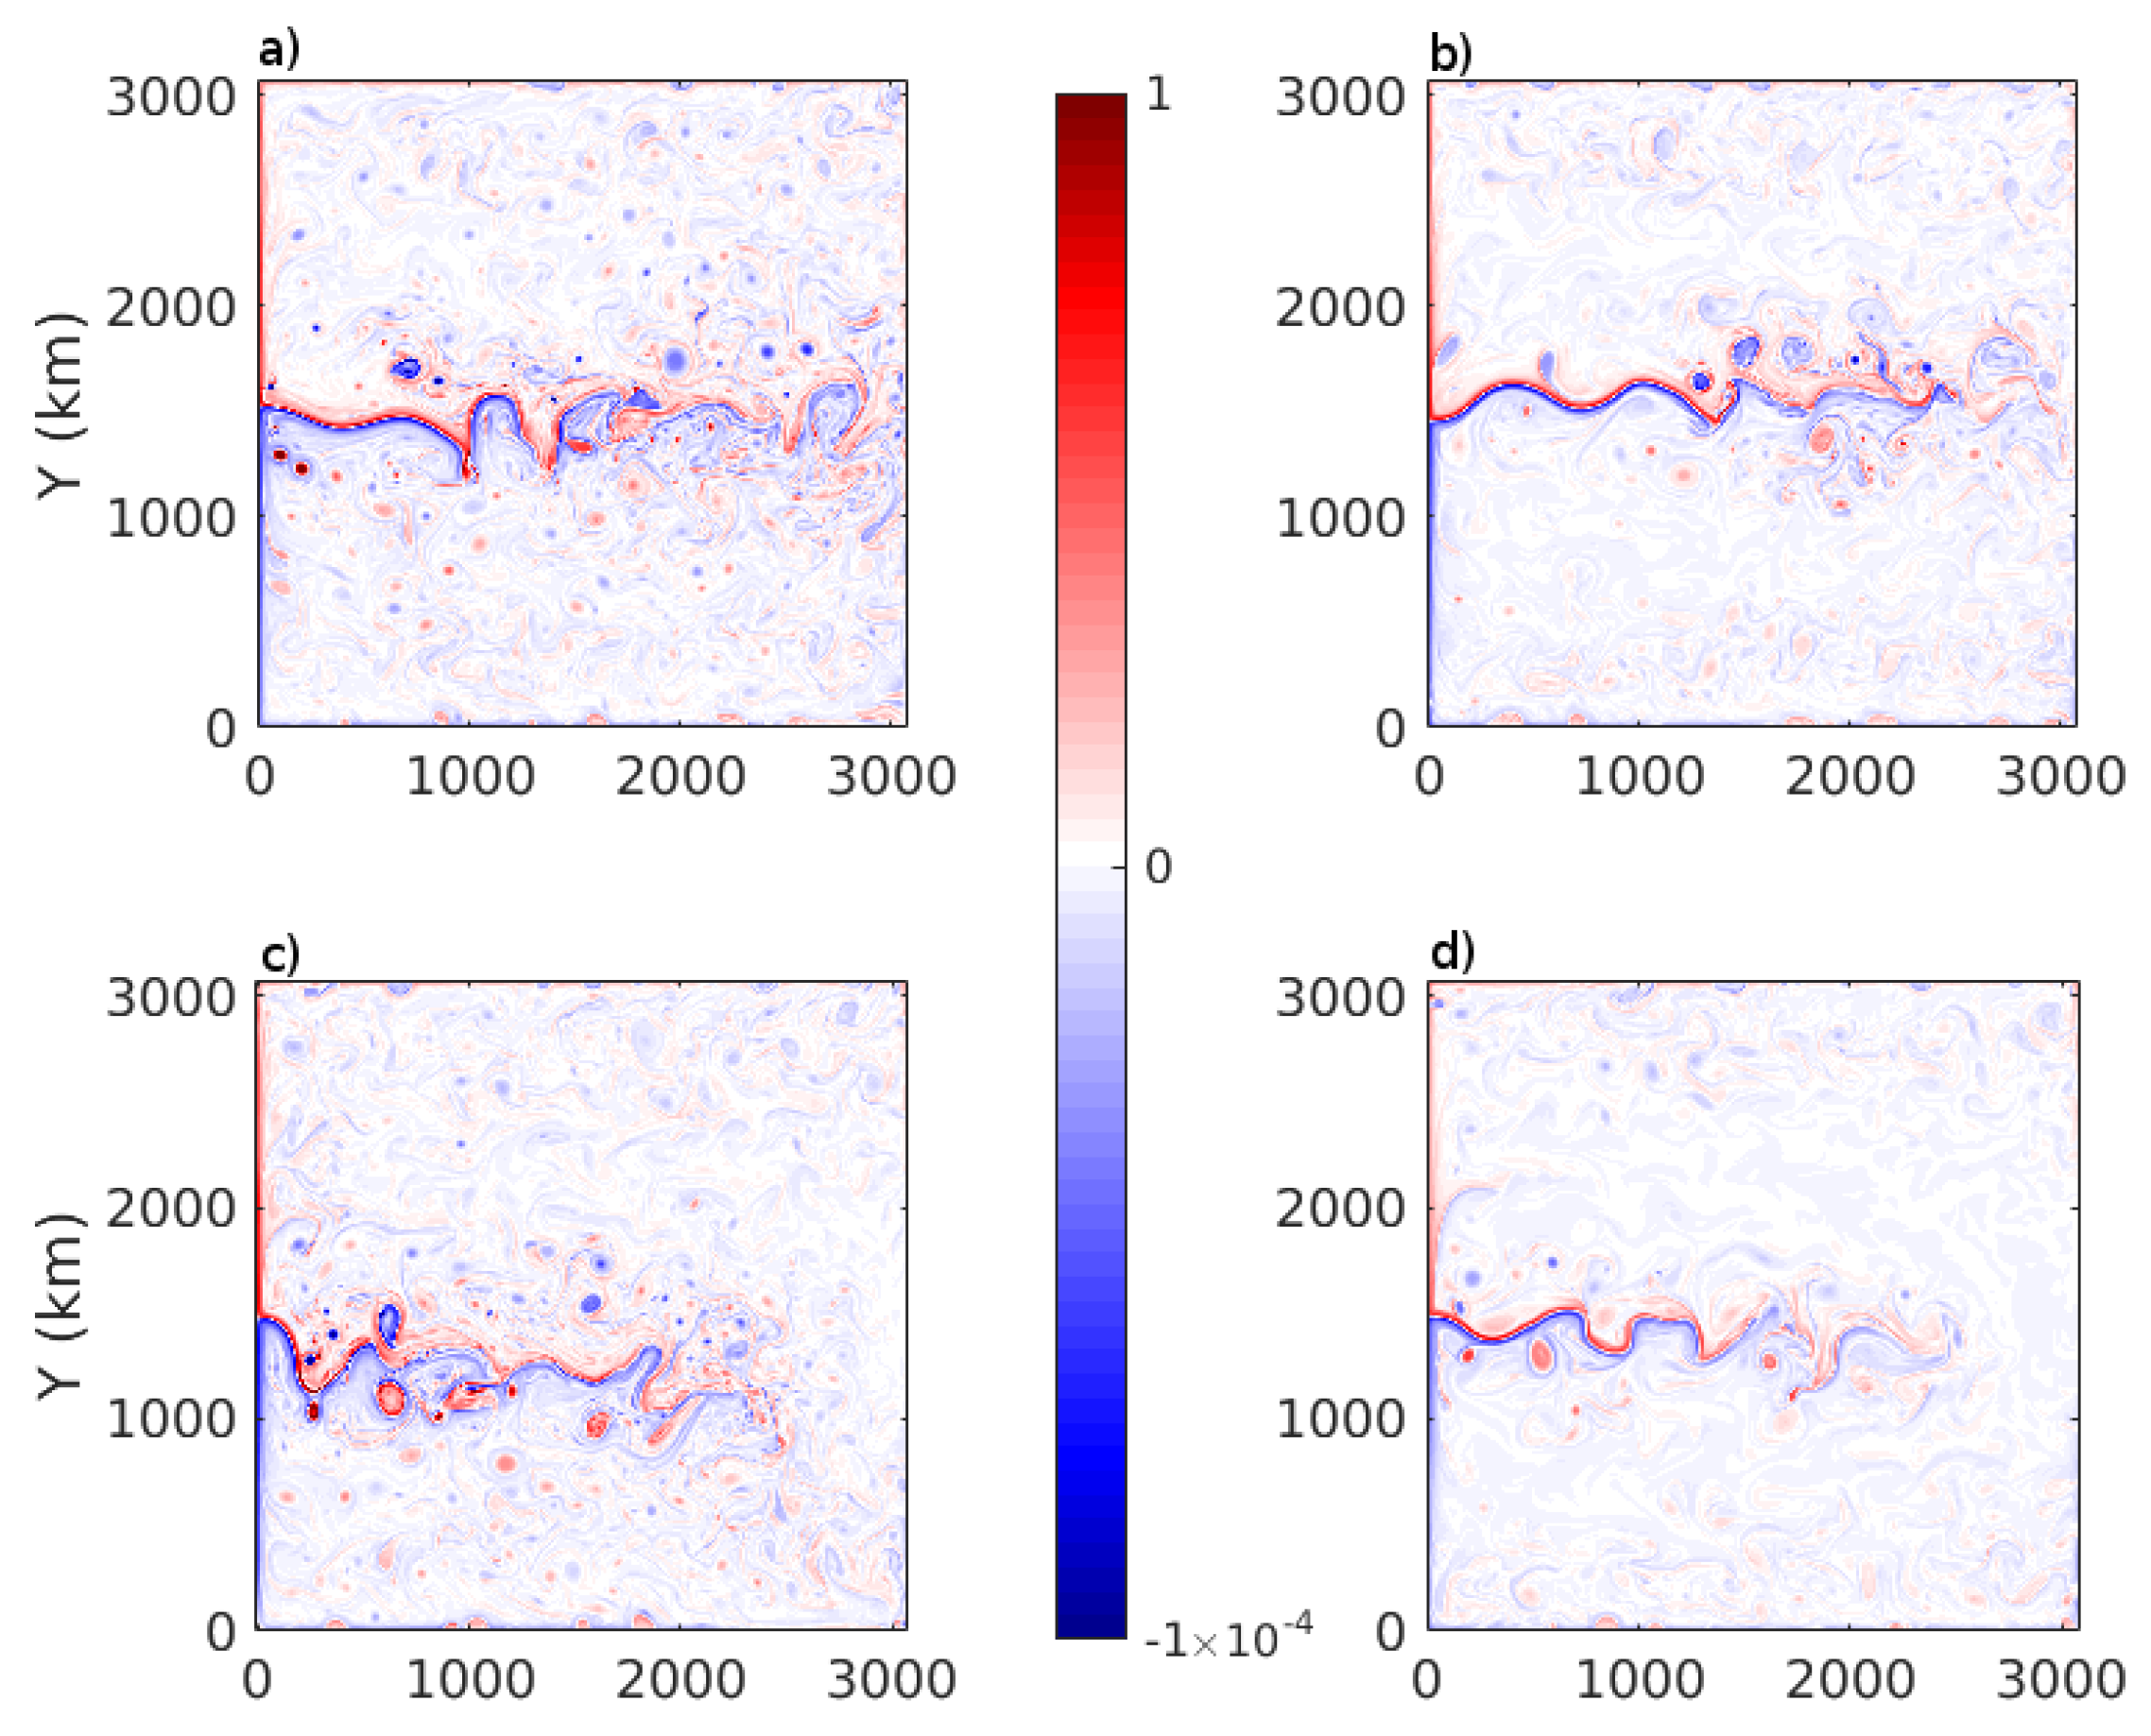
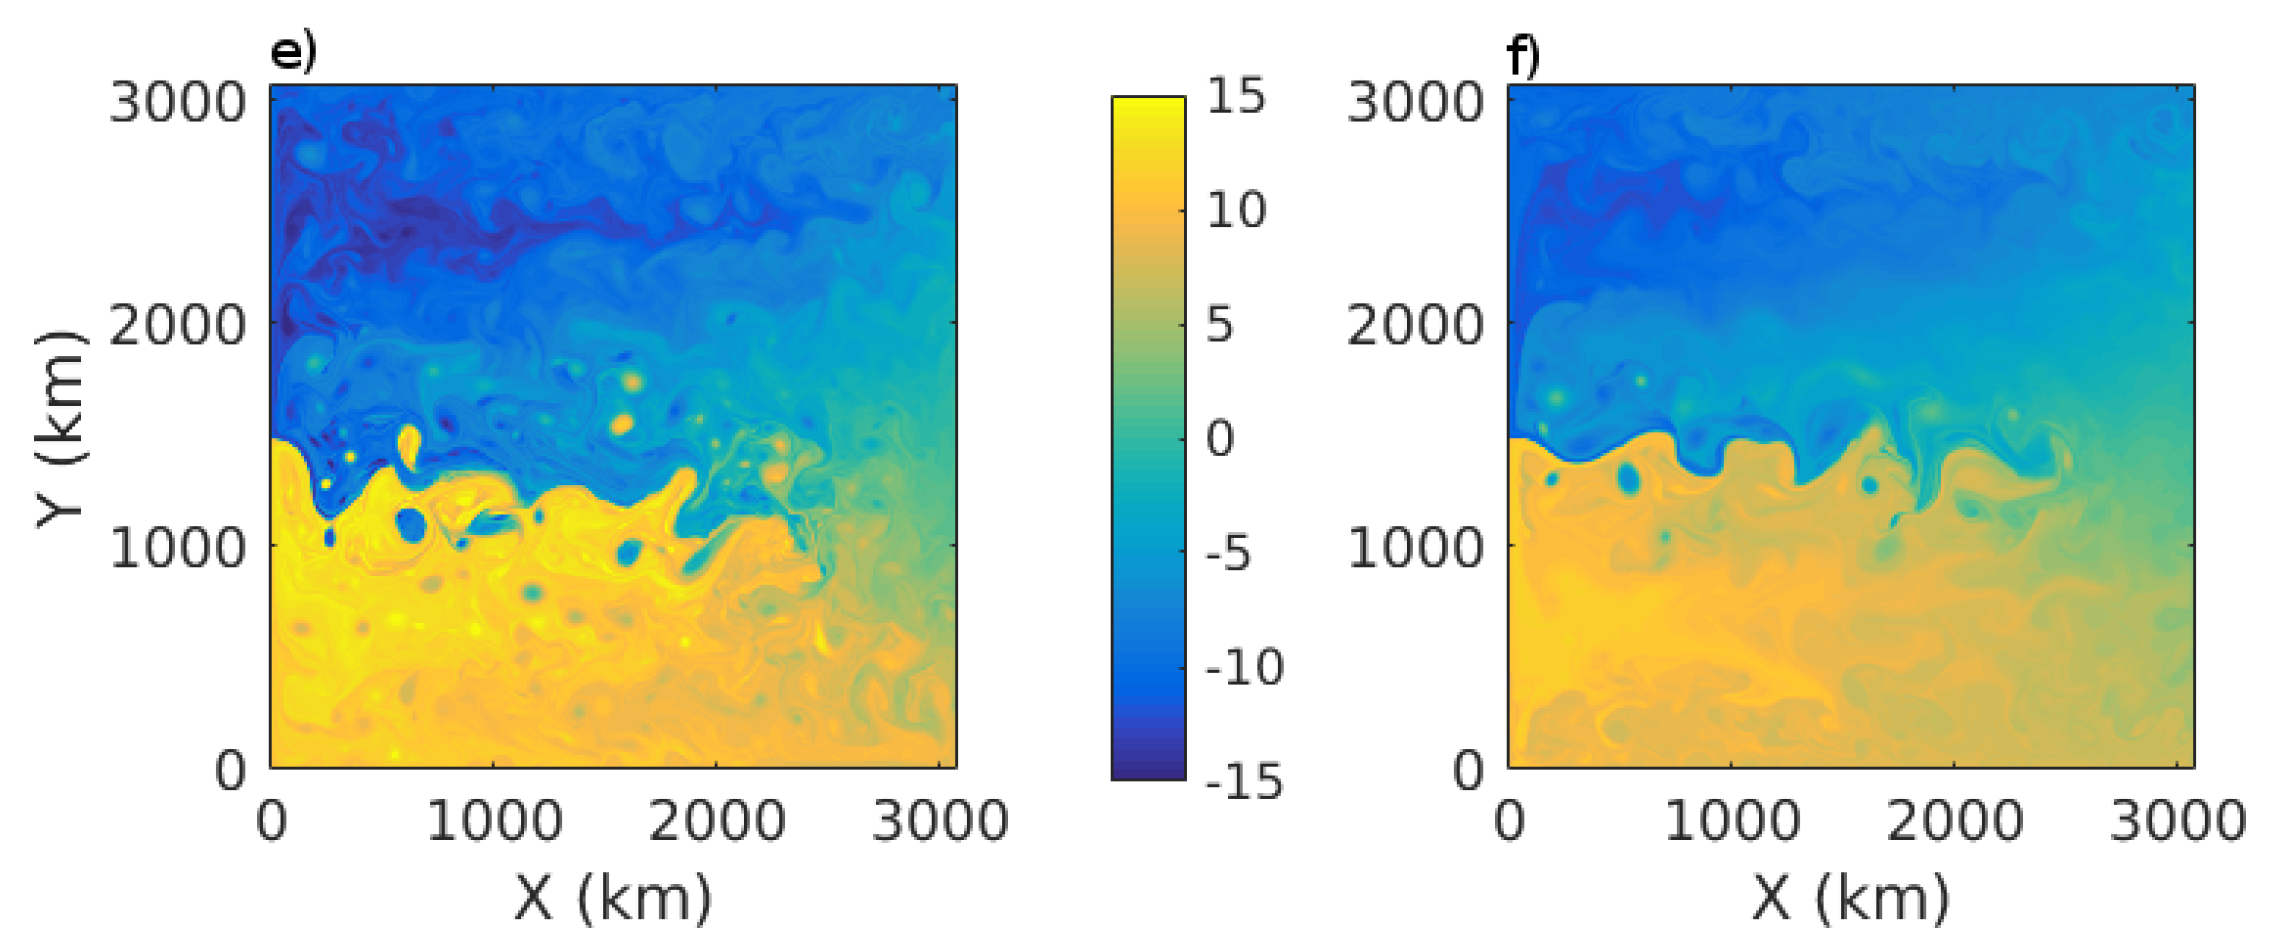
We begin our investigation by considering, in Figure 1, typical snapshots from the four configurations. In each case, surface relative vorticity patterns (panels a–d) are characteristic of a double gyre flow: two western boundary currents merging into an inter-gyre jet, continually destabilized to produce a rich eddying field. The eastern extension of this meandering jet varies according to the wind stress formulation, decreasing from case I to case IV. The QG SST perturbation (Figure 1e,f) covers a range of about 30 K, which corresponds roughly to the observed SST range of the polar/sub-polar gyre system of the Atlantic and Pacific. An asymmetry about y = L y / 2 is visible on some snapshots of relative vorticity and SST perturbation in Figure 1. This asymmetry will be discussed in more detail later in this section.
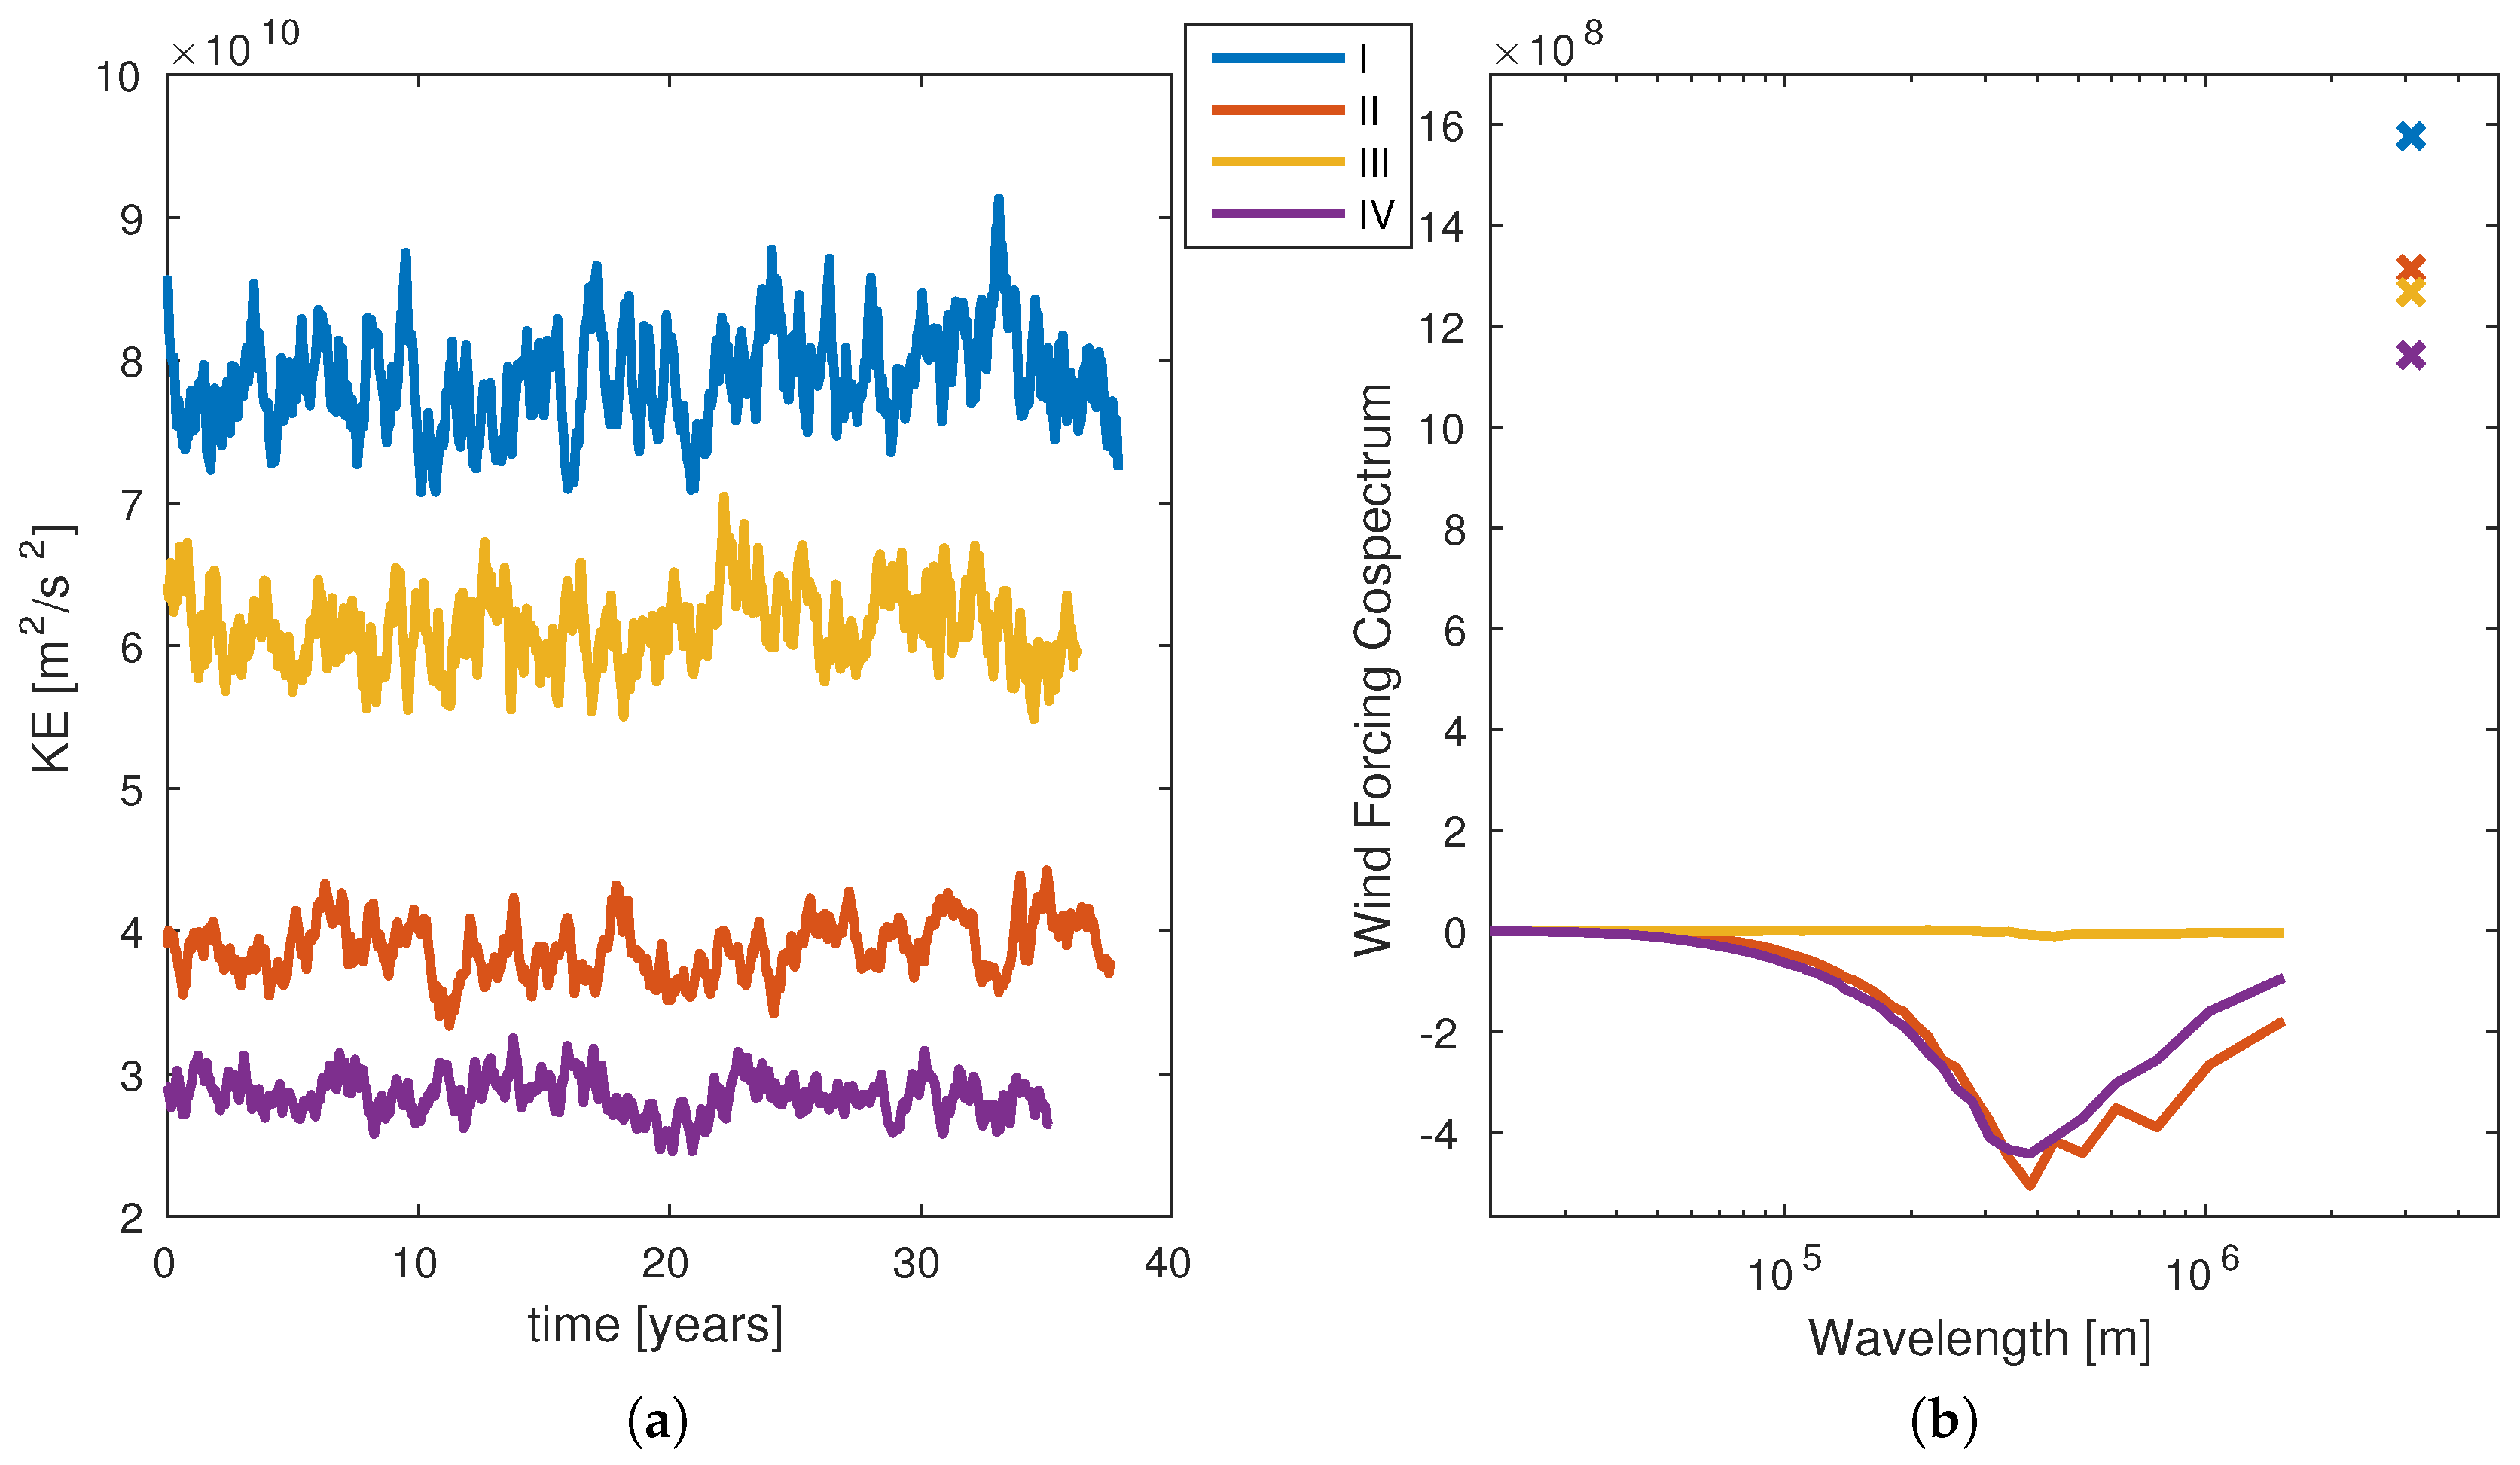
Figure 2a shows time series of the total kinetic energy at statistical equilibrium for all four cases. Consistent with the results of several previous studies, the use of the surface velocity dependent formulation (1) decreases significantly the total kinetic energy—by roughly half. The SST dependent formulation (2) has a similar but weaker effect.
To understand the origin of these differences in energy between each wind formulation, we now focus on the power input from the surface wind. Recall that the energy equation is obtained by multiplying the evolution equations for Q 1 , q 2 , , q n - 1 and Q n by - H i ρ 0 ψ i , then summing over the layers and integrating over the domain. The wind power input is therefore
- ρ 0 f 0 ψ 1 w + E d x d y .
Expanding both w + E and ψ 1 in Fourier series, we can write the wind power input as
- ρ 0 f 0 k x k y ( w ^ + E ) * ψ ^ 1
up to an arbitrary normalization constant that can be absorbed into the definition of the Fourier coefficients w ^ + E and ψ ^ 1 . Superscript * denotes the complex conjugate, and ( k x , k y ) are wavenumbers in the x- and y-directions. The rescaled wavenumbers ( K x , K y ) = ( 2 π / L ) ( k x , k y ) are integers, and the sum in Equation (30) can be re-arranged into a sum over wavenumber shells as follows:
- ρ 0 f 0 K K | ( K x , K y ) | < K + 1 ( w ^ + E ) * ψ ^ 1 K P ( K ) ,
where P ( K ) is the one-dimensional wind power cospectrum, shown for each case in Figure 2b. By definition, the non-interactive wind stress (I) only injects energy at the largest scale (notice that for each case, the value of the power input at the largest scale has been divided by 10 to fit the vertical axis on Figure 2b). The cospectrum breaks the total wind power input into contributions from different spatial scales; and the total power input is obtained by summing the cospectrum. Negative values indicate that the wind is removing energy from the oceans at a particular length scale.
The ocean velocity dependent formulation (II) has two effects on the energy input: it decreases the power input of the largest scale and it removes energy from the smaller scales. The peak of this energy sink occurs at a wavelength of about 300 km, slightly larger than the wavelength of the largest internal Rossby radius. In contrast, Figure 2b shows that the SST dependent formulation does not remove energy at the smaller scales and only affects directly large-scale wind power input. In this case, the spectral decomposition of power input for independent snapshots have a non-zero contribution from the smaller scales. However, these contributions cancel each other when the time-mean is applied.
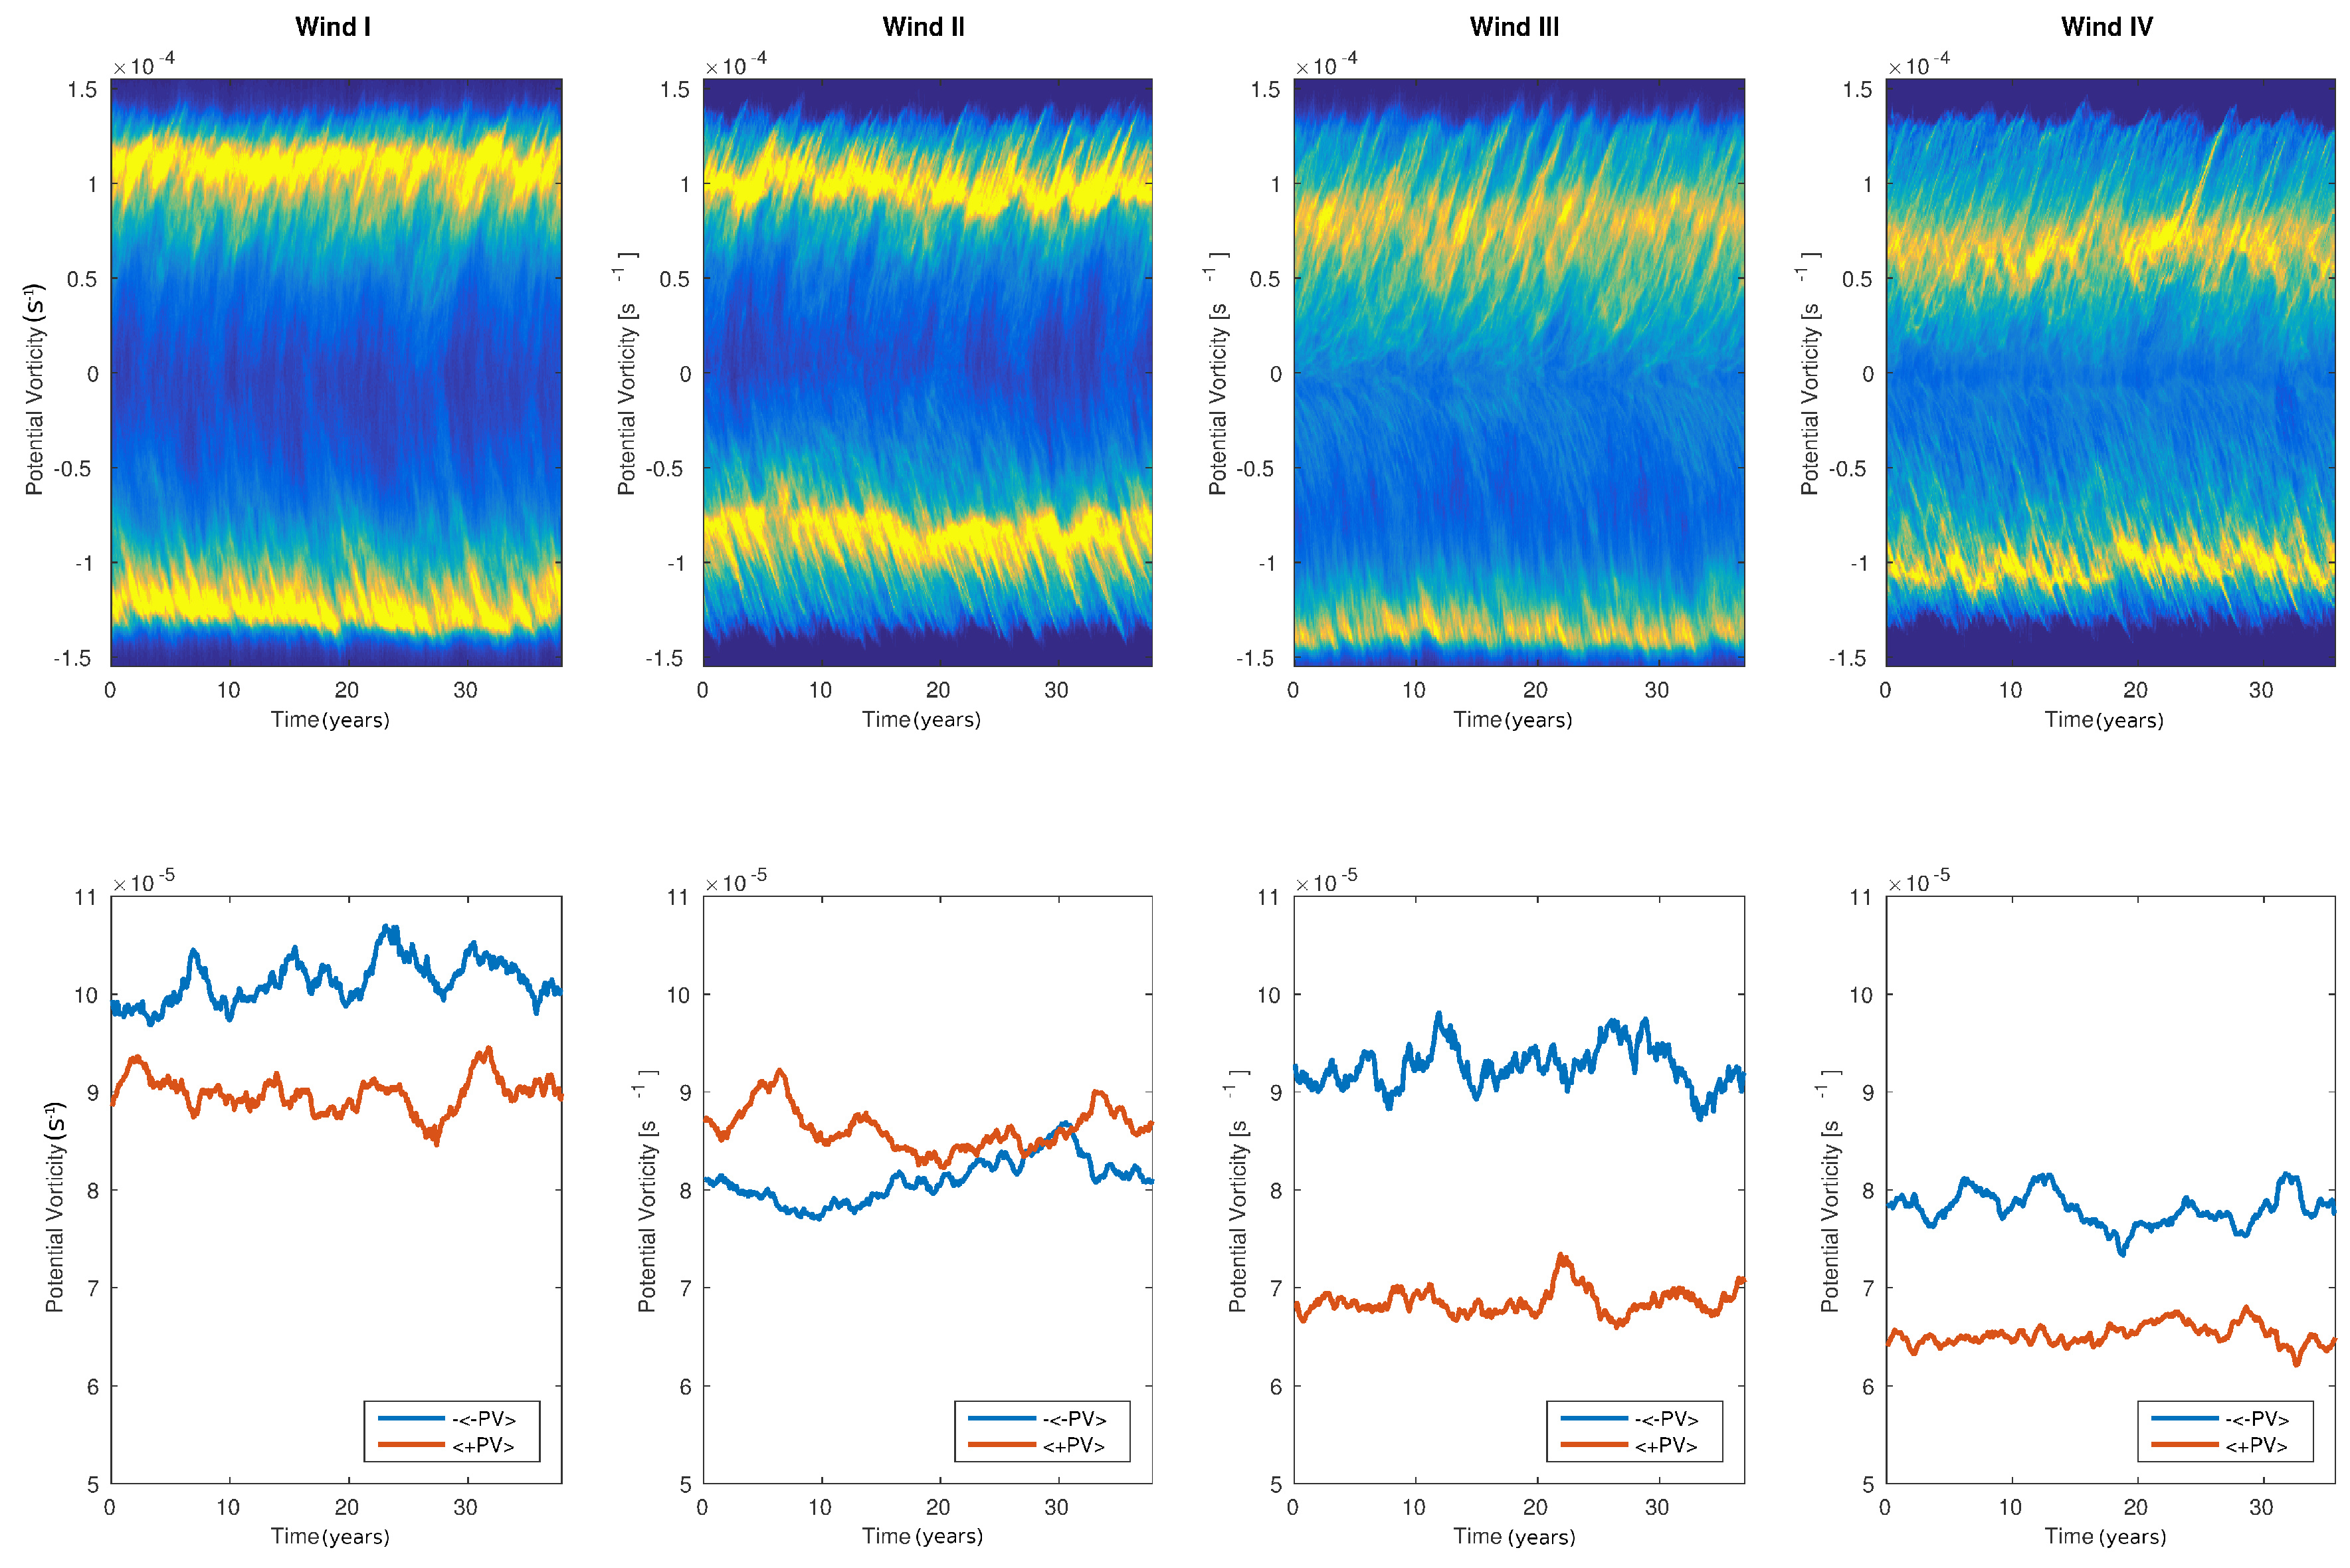
We now focus on the gyres asymmetry about y = L y / 2 , visible in Figure 1. As a useful way to quantify this asymmetry, we show in Figure 3, the temporal evolution of the distribution of surface pseudo PV, Q 1 . The lower panels shows the absolute value of the average positive and negative PV. In each case, distributions of positive and negative PV show some level of asymmetry. However, the details of the disparity between the mean and skewness of each distributions varies widely for each independent cases.
In the case of non-interactive wind stress, asymmetric solutions have been observed in several other studies with similar double gyre setup (e.g., [24,25,26]). These studies show that although asymmetric solutions occur spontaneously, they are generally unstable for high Reynolds numbers and the system can thus oscillate between several “preferred phenomenological regimes” [26]. The QG equations with symmetric wind forcing are invariant under the following symmetry: y L y / 2 - y , ψ - ψ ( q - q ). The different preferred states are associated with a spontaneous symmetry breaking, but because of the symmetric invariance of the QG equations, the solutions can oscillate equally between the northward-shifted and southward-shifted preferred states. These oscillations occur on a long-term scale, and are not visible in our simulations. Ocean velocity dependent wind stress does not break the symmetry of the equations, and Duhaut and Straub [11] have shown that this feature of the circulation is not enhanced or modified in the case of ocean velocity dependent formulation of the wind stress (Wind II). In contrast, the addition of SST dependence to the wind stress formulation breaks the aforementioned symmetry of the QG equations. In the following, we show that the SST dependent formulation (2) induces a systematic asymmetry leading to a southward slanting and shift of the inter-gyre jet.
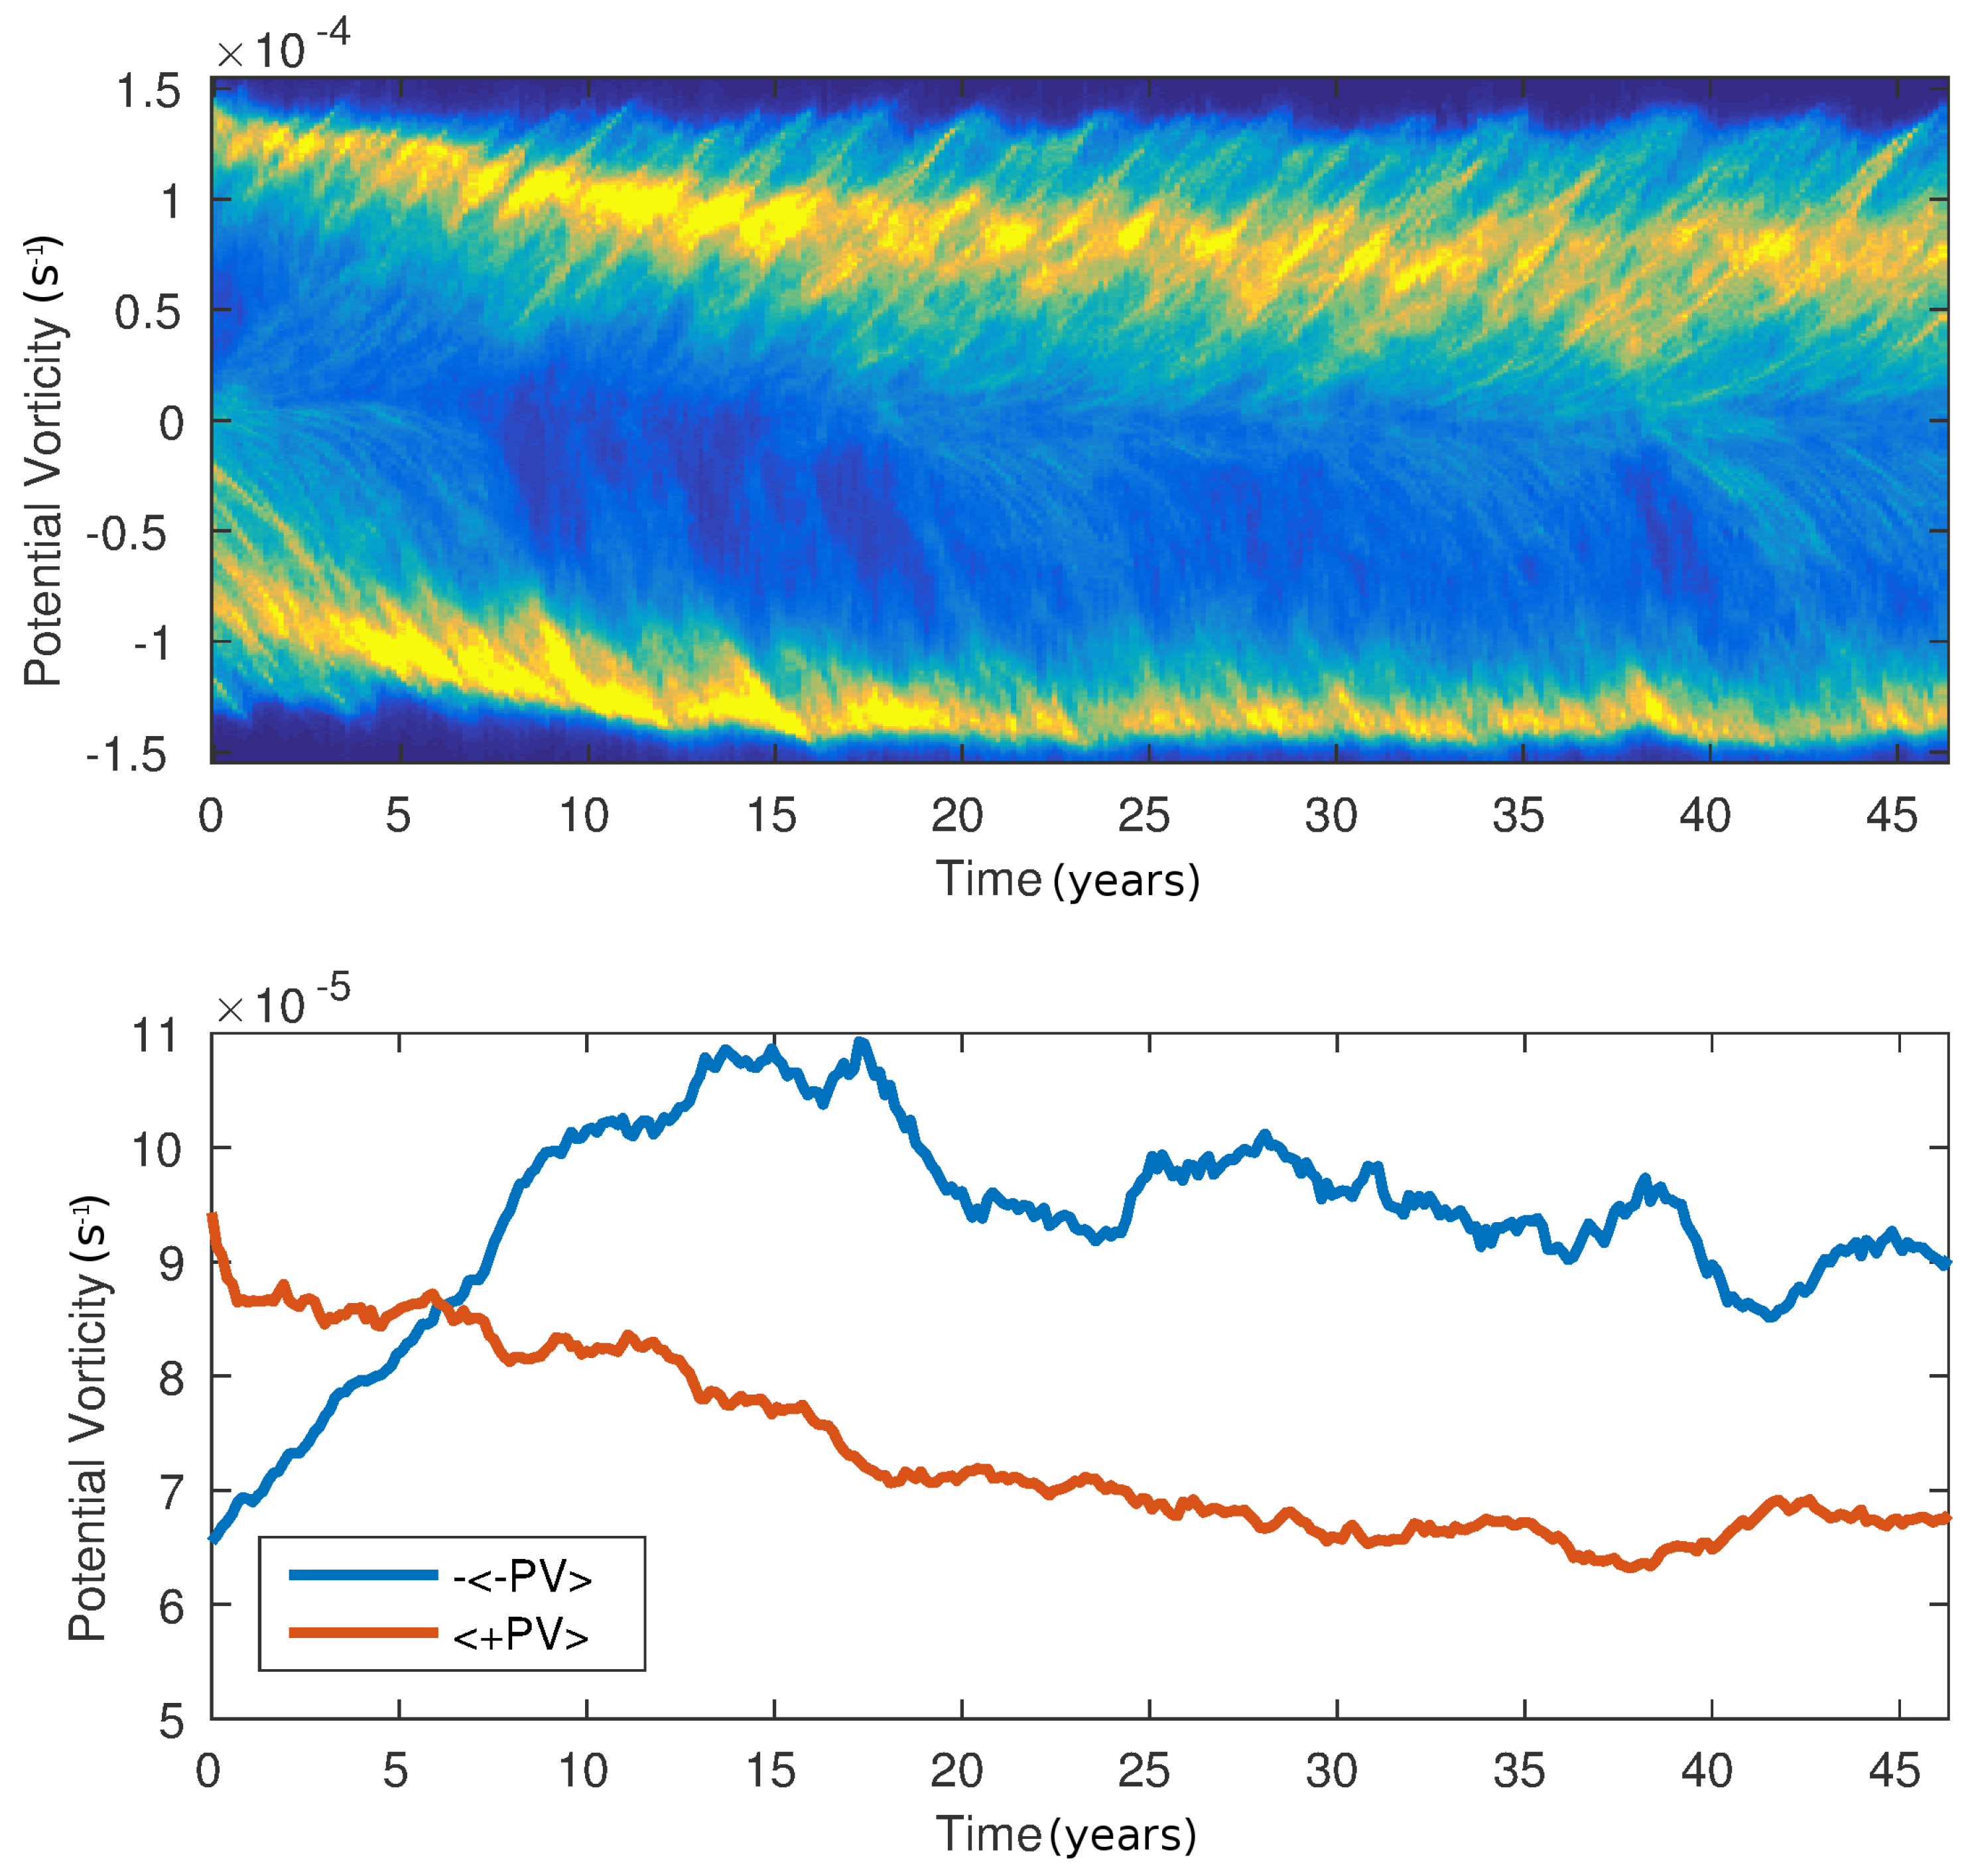
In principle, it could be the case that a northward-shifted regime still exists for the case with SST dependent wind stress, and that our simulation simply shows one of many possible regimes. To test this, we ran a simulation with SST-dependent wind stress (Wind III), and with an initial condition taken from a previous simulations, but transformed according to y L y / 2 - y (flipped north–south) and ψ - ψ (reversed). If a northward-shifted regime exists for the SST dependent case, then this simulation should remain northward-shifted, perhaps after a period of adjustment. Figure 4 shows a Hovmöller diagram similar to the ones of Figure 3 but for the simulation with sign reversed and flipped initial conditions. The southern gyre rapidly shrinks and strengthens, as seen in the rapid increase of mean negative PV, while the northern gyre slowly dilates and weakens, as seen in the slow reduction of mean positive PV. After approximately 25 years, the asymmetry of the initial condition has reversed, and the simulation has returned to a southward-shifted state.
For comparison, we ran a simulation with independent wind stress (Wind I) where the initial condition was flipped and reversed. Unlike the simulation with SST dependent wind stress, this simulation remained in a northward-shifted state for the length of the simulation. In principle, the simulations with SST independent wind stress can transition between northward-shifted and southward-shifted states, but this happens on a very long-term scale. In contrast, the simulations with SST dependent wind stress have a clear preference for a southward-shifted state.

Physical Mechanism

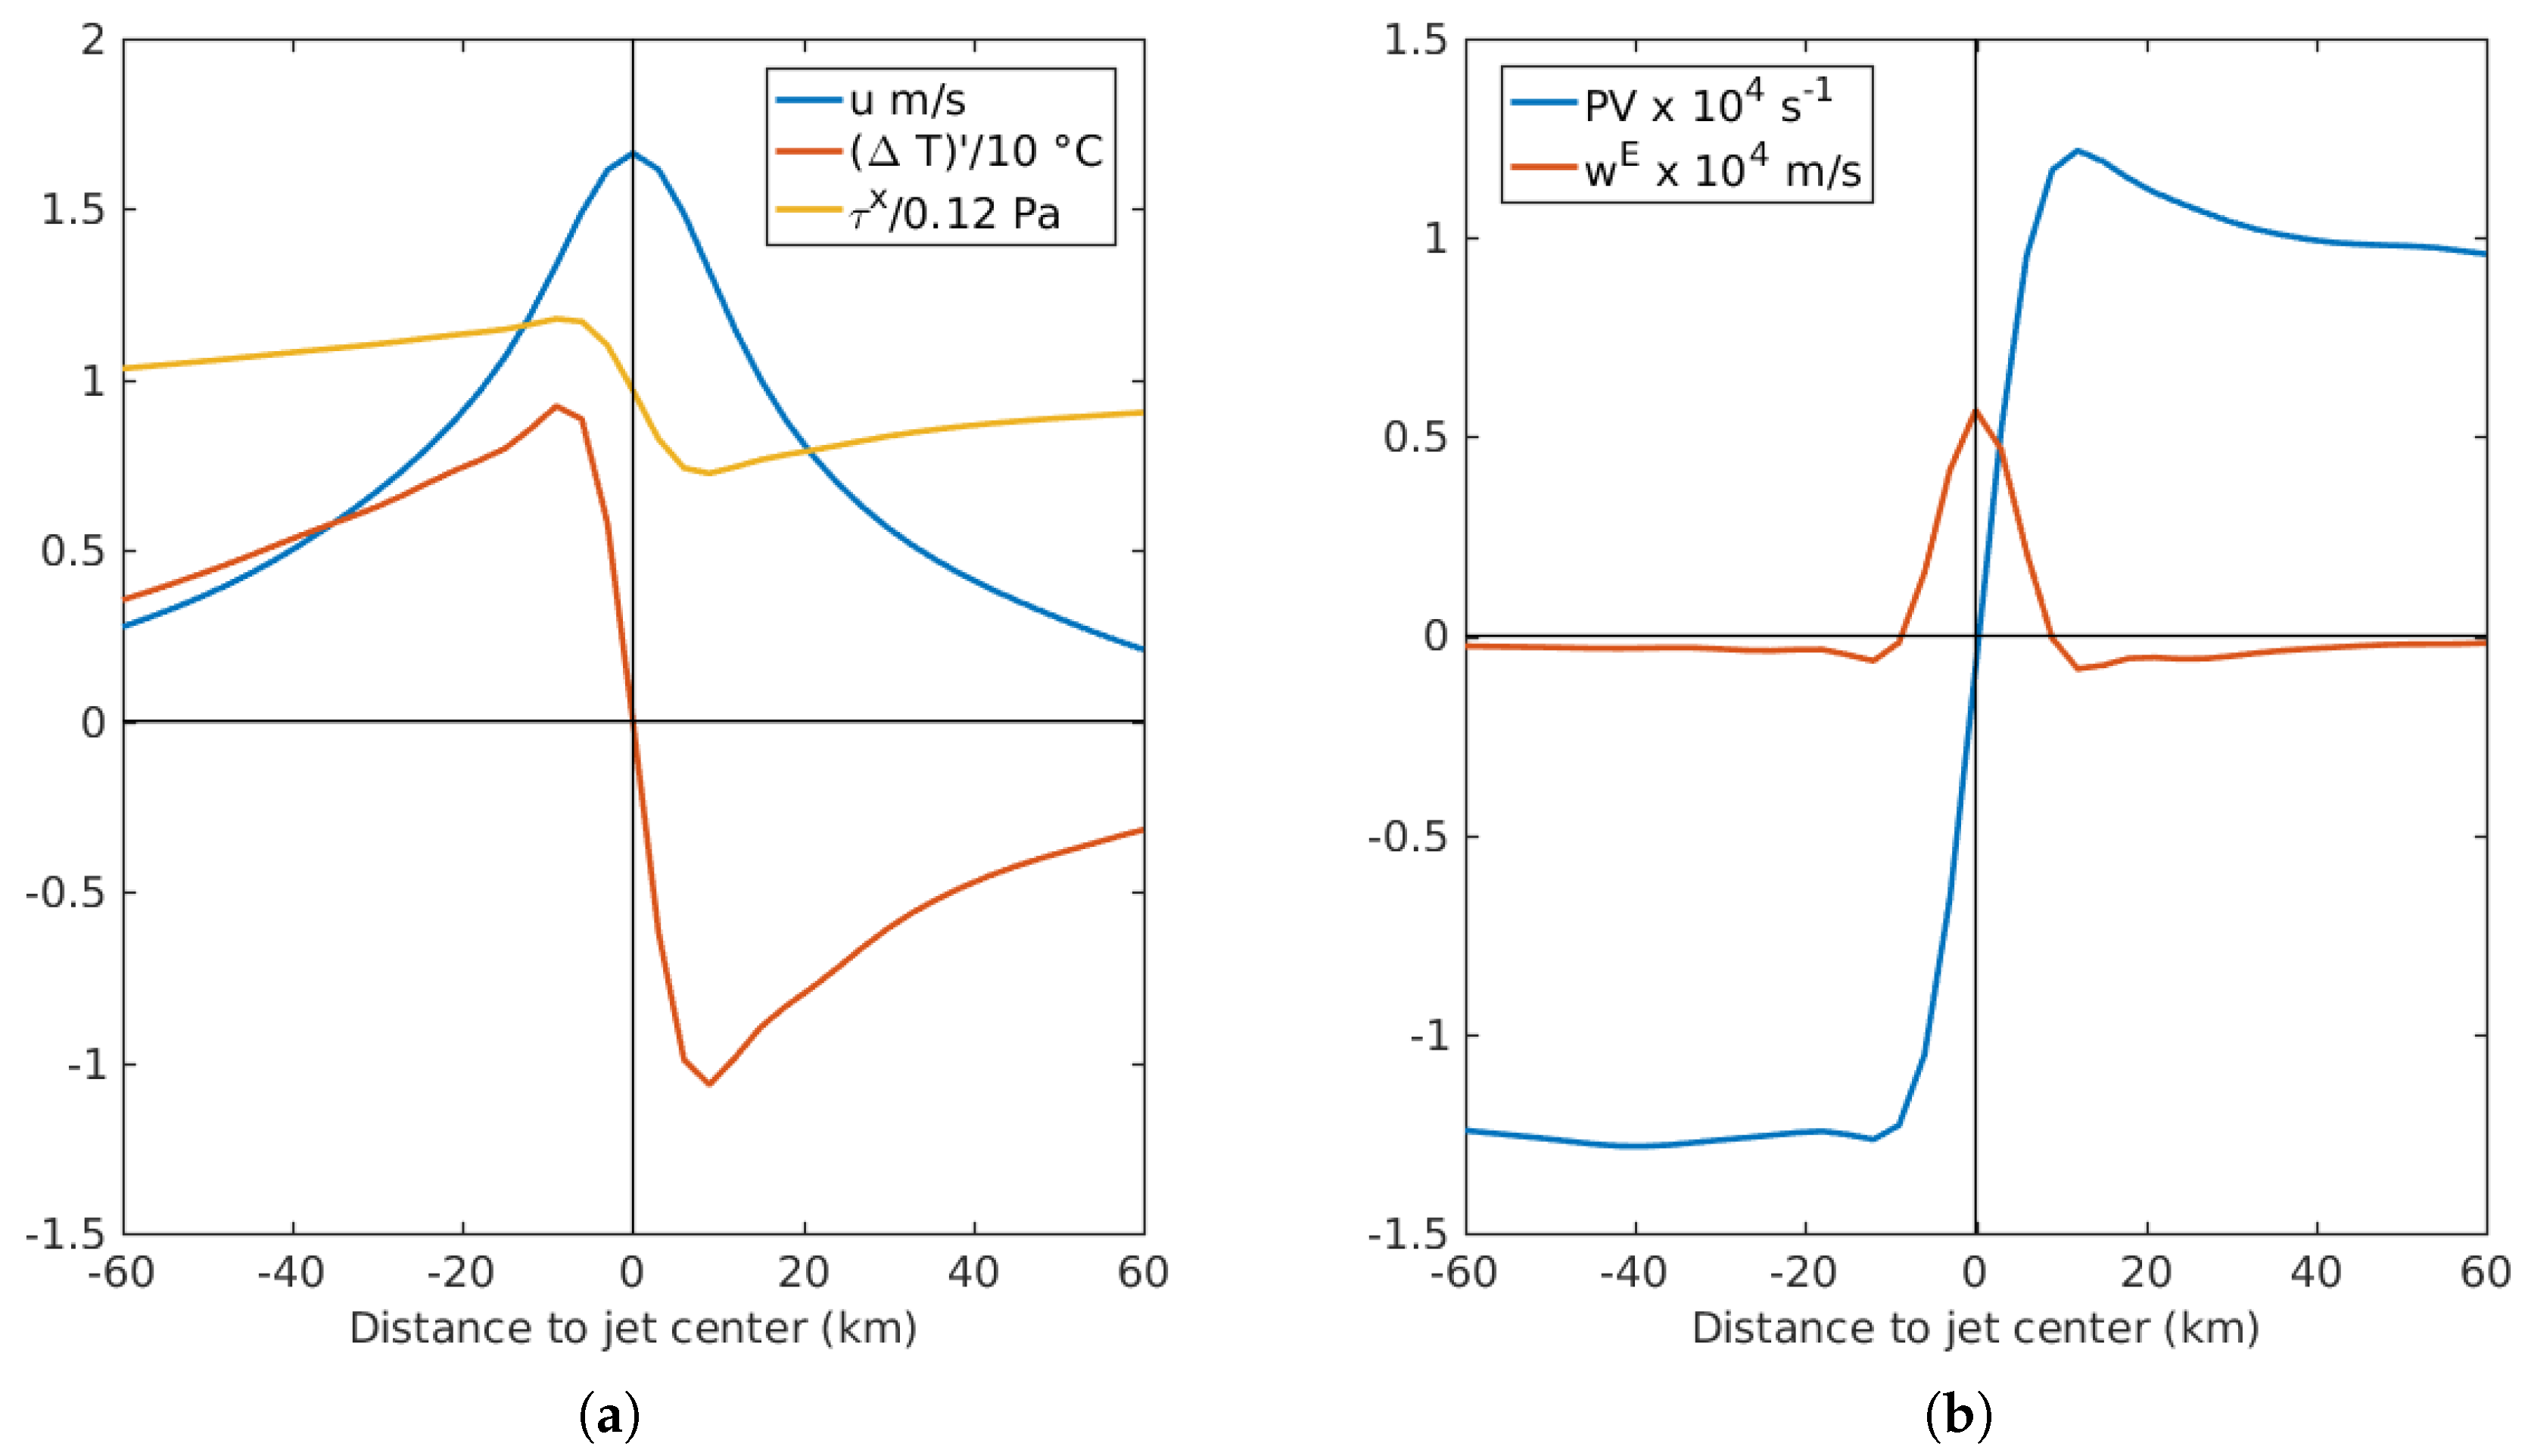
We propose that SST dependence causes the jet to shift southward because the SST anomaly induces a wind stress anomaly over the jet that accelerates the southern flank and decelerates the northern flank. The jet is extremely unsteady; thus, to track the wind stress over the jet, we perform a jet-centered time average as follows. We first compute the instantaneous location of the maximum zonal velocity along a line 150 km east of the western boundary. This location is considered to be the center of the jet. The zonal velocity, SST perturbation ( Δ T ) , zonal wind stress τ x , surface pseudo-PV Q 1 , and Ekman pumping w E are all time-averaged in a moving coordinate frame centered on the jet. Figure 5a shows the jet-centered time-mean zonal velocity profile, SST perturbation, and zonal wind stress; a positive wind stress anomaly on the southern flank and a negative anomaly on the northern flank are clearly visible.
The wind stress anomaly is explained as follows. The SST front is centered on the jet, as shown in Figure 5a, and the atmospheric zonal wind profile u a varies on a much larger scale than the jet or the SST front. Equation (2) then implies that the local wind stress anomaly takes the form
τ x = ρ a C D α ( Δ T ) u a 2 .
The SST perturbation is positive on the southern flank of the jet and negative on the northern flank, leading to a wind stress perturbation with the same pattern.
The effect can also be viewed from the perspective of PV. Figure 5b shows the jet-centered time-mean surface pseudo-PV front and Ekman pumping. The Ekman pumping is derived from the meridional derivative of the zonal wind stress, which is dominated by the short-scale variation of the wind stress anomaly, and, as a result, there is a positive Ekman pumping anomaly centered on the PV front. The Ekman pumping appears as a forcing term in the surface PV equation; thus, the positive anomaly tends to shift the front to the south.

4. Discussion and Conclusions

The primary point of comparison for our results is the work of Hogg et al. [13], who also found that SST dependent wind stress leads to reduced net wind power input, and who observed a southward shift of the jet. Though they also considered the impact of SST dependent wind stress on a QG double-gyre circulation, there are several differences in model configuration worth reviewing. The major differences in comparison with the present study are that they used an atmospheric mixed layer model and defined Δ T as the atmosphere–ocean temperature difference, and that they used an ocean mixed-layer model for SST rather than identifying it with the QG surface buoyancy anomaly. Despite these and other differences in the models, the main qualitative results—reduced wind power input, and a southward-shifted jet—are the same.
We propose a mechanism to explain the reduced wind power input that is different from the mechanism proposed by Hogg et al. [13]. The wind power input is proportional to the domain-integrated scalar product of surface velocity and wind stress u + · τ (up to small corrections due to boundary stresses). The wind forcing cospectra in Figure 2 indicate that wind power input is dominated by the largest scales, and that the SST dependence causes a reduced wind power input at the largest scales, with no net effect on smaller scales. As shown in Figure 5, SST dependence causes a wind stress anomaly that pushes the jet south and leads to asymmetric gyres. This wind stress anomaly is small-scale, and can not directly account for the reduced wind power input. Instead, the wind stress anomaly leads to asymmetric gyres whose surface currents are out of alignment with the wind stress, reducing the net power input.
Previous studies [27,28] have shown that the low-frequency variability found in the QG double-gyre problem with symmetric wind stress is qualitatively different from the variability in models with even a slightly asymmetric wind stress. The qualitative nature of the low frequency variability observed in our model, with symmetric zonal winds, is probably different from the variability that would be observed with a more realistic asymmetric wind field. Nevertheless, the mechanism proposed here (a wind stress anomaly shifting the jet southwards) is robust; Hogg et al. [13] used an asymmetric wind stress and observed a southward jet shift. Shifting of the jet away from the region of maximum wind stress leads to an overall decrease in the wind power input, regardless of whether the wind field is symmetric or not.
Hogg et al. [13] proposed a different mechanism to explain why SST dependent wind stress leads to a weaker gyre circulation. They argued that transient Ekman-pumping anomalies in the dynamically-sensitive region near the separation of the western boundary current destabilize the jet. The dynamics of the destabilized jet then lead to downgradient PV flux between the gyres, reducing their intensity. It is worth noting that this explanation is not directly at odds with the mechanism proposed here: both mechanisms could be operating simultaneously. However, the mechanism proposed by Hogg et al. [13] is dynamically more complex, and therefore harder to observe directly in simulations.
Byrne et al. [9] recently examined the effect of SST dependent wind stress in coupled atmosphere–ocean simulations of the South Atlantic. They found that SST dependence led to an increase of up to 10% in the wind power input, and furthermore that this input is directly into the ocean mesoscale rather than at large scales. These results appear to be in direct contradiction to ours, but the contradiction is only apparent. The mechanism they proposed requires a single sign of wind gradient: in the Southern Ocean, if the meridional wind gradient is positive the eddies are energized, and if the wind gradient is negative the eddies are de-energized. In our idealized QG double gyre, the wind gradient is positive over half the domain, and negative over the other half. The effects thus cancel each other out, leading to our observation of zero mean wind power input to the eddies.
To verify this cancellation of effects, we computed the eddy-scale part of the Ekman pumping velocity ( w + E ) and the eddy-scale part of the surface streamfunction ψ 1 , where the prime notation indicates application of the high-pass spatial filter. The eddy-scale contribution to the total wind power input is approximately
- ρ 0 f 0 ( w + E ) ψ 1 d x d y .
We computed this integral separately for the northern and southern halves of the domain and time-averaged the results (a similar result could presumably be obtained by computing the wind power cospectrum over the northern and southern halves independently.) In order to isolate the impact of SST dependence, we computed the results for the case where wind stress depends on SST but not on the ocean surface currents (Wind III). The time-averaged eddy-scale wind power input for the southern half was 7.6 MW (megawatts), and for the northern half was - 6.2 MW, leading to near-cancellation. The real ocean gyres are not symmetric so the effects from the subpolar and subtropical gyres are not likely to cancel as completely in the real ocean, or in a particular region of the ocean as in the study of Byrne et al. [9].
The impact of SST dependent wind stress on jets is interesting in its own right, independent of its effect on the wind input to the circulation. The southward shift could potentially lead to improvements in eddy-permitting ocean model representations of the Gulf Stream separation, since many ocean models have a Gulf Stream that separates too far north [29]. The mechanism proposed here could for example act on jets in the Southern Ocean, in addition to western-boundary current extensions. The SST fronts are reversed in the Southern Ocean, which would lead to a wind stress anomaly that accelerates the northern flank and decelerates the southern flank of a jet. Nevertheless, one hesitates to predict that this mechanism will cause Southern Ocean jets to drift north because the dynamics of jets are a complex and incompletely understood interplay between wind stress, Reynolds stresses, topography, and potential vorticity gradients (e.g., [30,31]).
In summary, we have investigated the effects of SST dependent wind stress on the wind-driven QG double gyre. The SST front co-located with the inter-gyre jet induces a wind stress anomaly that accelerates the southern flank of the jet, and decelerates its northern flank causing it to shift towards the south. The subtropical gyre shrinks and strengthens while the subpolar gyre dilates and weakens. This asymmetrizing of the gyre circulation, despite a symmetric wind stress forcing, leads to a reduction in the wind power input and an overall reduction of the strength of the circulation. The effects found in this simplified model should be verified in more complete, coupled atmosphere-ocean models.
Acknowledgments

The authors are grateful to David Byrne for helpful conversations at the beginning of the research, and to two anonymous reviewers.

Author Contributions

Ian Grooms and Louis-Philippe Nadeau conceived, designed, and performed the experiments; Ian Grooms and Louis-Philippe Nadeau analyzed the data; Ian Grooms and Louis-Philippe Nadeau wrote the paper.

Conflicts of Interest

The authors declare no conflict of interest.

Abbreviations

The following abbreviations are used in this manuscript:
PVPotential vorticity
SSTSea surface temperature
QGQuasigeostrophic

References

  1. Chelton, D.B.; Esbensen, S.K.; Schlax, M.G.; Thum, N.; Freilich, M.H.; Wentz, F.J.; Gentemann, C.L.; McPhaden, M.J.; Schopf, P.S. Observations of coupling between surface wind stress and sea surface temperature in the eastern tropical Pacific. J. Clim. 2001, 14, 1479–1498. [Google Scholar] [CrossRef]
  2. Nonaka, M.; Xie, S.P. Covariations of sea surface temperature and wind over the kuroshio and its extension: Evidence for ocean-to-atmosphere feedback. J. Clim. 2003, 16, 1404–1413. [Google Scholar] [CrossRef]
  3. Chelton, D.B.; Schlax, M.G.; Freilich, M.H.; Milliff, R.F. Satellite measurements reveal persistent small-scale features in ocean winds. Science 2004, 303, 978–983. [Google Scholar] [CrossRef] [PubMed]
  4. Small, R.; deSzoeke, S.; Xie, S.; O’Neill, L.; Seo, H.; Song, Q.; Cornillon, P.; Spall, M.; Minobe, S. Air–sea interaction over ocean fronts and eddies. Dyn. Atmos. Oceans 2008, 45, 274–319. [Google Scholar] [CrossRef]
  5. Chelton, D.B.; Xie, S.P. Coupled ocean–atmosphere interaction at oceanic mesoscales. Oceanography 2010, 23, 52–69. [Google Scholar] [CrossRef]
  6. Frenger, I.; Gruber, N.; Knutti, R.; Münnich, M. Imprint of Southern Ocean eddies on winds, clouds and rainfall. Nat. Geosci. 2013, 6, 608–612. [Google Scholar] [CrossRef]
  7. Byrne, D.; Papritz, L.; Frenger, I.; Münnich, M.; Gruber, N. Atmospheric Response to Mesoscale Sea Surface Temperature Anomalies: Assessment of Mechanisms and Coupling Strength in a High-Resolution Coupled Model over the South Atlantic. J. Atmos. Sci. 2015, 72, 1872–1890. [Google Scholar] [CrossRef]
  8. Gaube, P.; Chelton, D.B.; Samelson, R.M.; Schlax, M.G.; O’Neill, L.W. Satellite observations of mesoscale eddy-induced Ekman pumping. J. Phys. Oceanogr. 2015, 45, 104–132. [Google Scholar] [CrossRef]
  9. Byrne, D.; Münnich, M.; Frenger, I.; Gruber, N. Mesoscale atmosphere ocean coupling enhances the transfer of wind energy into the ocean. Nat. Commun. 2016, 7. [Google Scholar] [CrossRef] [PubMed] [Green Version]
  10. Pacanowski, R. Effect of equatorial currents on surface stress. J. Phys. Ocean. 1987, 17, 833–838. [Google Scholar] [CrossRef]
  11. Duhaut, T.H.; Straub, D.N. Wind stress dependence on ocean surface velocity: Implications for mechanical energy input to ocean circulation. J. Phys. Oceanogr. 2006, 36, 202–211. [Google Scholar] [CrossRef]
  12. Dawe, J.T.; Thompson, L. Effect of ocean surface currents on wind stress, heat flux, and wind power input to the ocean. Geophys. Res. Lett. 2006, 33. [Google Scholar] [CrossRef]
  13. Hogg, A.M.C.; Dewar, W.K.; Berloff, P.; Kravtsov, S.; Hutchinson, D.K. The effects of mesoscale ocean–atmosphere coupling on the large-scale ocean circulation. J. Clim. 2009, 22, 4066–4082. [Google Scholar] [CrossRef]
  14. Flierl, G.R. Models of vertical structure and the calibration of two-layer models. Dyn. Atmos. Oceans 1978, 2, 341–381. [Google Scholar] [CrossRef]
  15. Rocha, C.B.; Young, W.R.; Grooms, I. On Galerkin Approximations of the Surface Active Quasigeostrophic Equations. J. Phys. Oceanogr. 2016, 46, 125–139. [Google Scholar] [CrossRef]
  16. Vallis, G.K. Atmospheric and Oceanic Fluid Dynamics: Fundamentals and Large-Scale Circulation; Cambridge University Press: Cambridge, UK, 2006. [Google Scholar]
  17. Walstad, L.J.; Robinson, A.R. A coupled surface boundary-layer-quasigeostrophic model. Dyn. Atmos. Oceans 1993, 18, 151–207. [Google Scholar] [CrossRef]
  18. Spall, M.A. Effect of sea surface temperature-wind stress coupling on baroclinic instability in the ocean. J. Phys. Oceanogr. 2007, 37, 1092–1097. [Google Scholar] [CrossRef]
  19. Lapeyre, G.; Klein, P. Dynamics of the upper oceanic layers in terms of surface quasigeostrophy theory. J. Phys. Oceanogr. 2006, 36, 165–176. [Google Scholar] [CrossRef]
  20. Isern-Fontanet, J.; Lapeyre, G.; Klein, P.; Chapron, B.; Hecht, M.W. Three-dimensional reconstruction of oceanic mesoscale currents from surface information. J. Geophys. Res. Oceans 2008, 113. [Google Scholar] [CrossRef]
  21. Pedlosky, J. Geophysical Fluid Dynamics, 2nd ed.; Springer: Berlin, Germany, 1987. [Google Scholar]
  22. Arakawa, A. Computational design for long-term numerical integration of the equations of fluid motion: Two-dimensional incompressible flow. Part I. J. Comput. Phys. 1966, 1, 119–143. [Google Scholar] [CrossRef]
  23. Nadeau, L.P.; Straub, D.N. Basin and channel contributions to a model Antarctic Circumpolar Current. J. Phys. Oceanogr. 2009, 39, 986–1002. [Google Scholar] [CrossRef]
  24. Cessi, P.; Ierley, G.R. Symmetry-breaking multiple equilibria in quasigeostrophic, wind-driven flows. J. Phys. Oceanogr. 1995, 25, 1196–1205. [Google Scholar] [CrossRef]
  25. Jiang, S.; Jin, F.F.; Ghil, M. Multiple equilibria, periodic and aperiodic solutions in a wind-driven, double-gyre, shallow water model. J. Phys. Oceanogr. 1995, 25, 764–786. [Google Scholar] [CrossRef]
  26. McCalpin, J.D.; Haidvogel, D. Phenomenology of the low-frequency variability in a reduced-gravity, quasigeostrophic double-gyre model. J. Phys. Oceanogr. 1996, 26, 739–752. [Google Scholar] [CrossRef]
  27. Berloff, P.S.; McWilliams, J.C. Large-scale, low-frequency variability in wind-driven ocean gyres. J. Phys. Oceanogr. 1999, 29, 1925–1949. [Google Scholar] [CrossRef]
  28. Berloff, P.; Hogg, A.M.C.; Dewar, W. The turbulent oscillator: A mechanism of low-frequency variability of the wind-driven ocean gyres. J. Phys. Oceanogr. 2007, 37, 2363–2386. [Google Scholar] [CrossRef]
  29. Chassignet, E.P.; Marshall, D.P. Gulf Stream Separation in Numerical Ocean Models. In Ocean Modeling in an Eddying Regime; American Geophysical Union: Washington, DC, USA, 2008; pp. 39–61. [Google Scholar]
  30. Thompson, A.F.; Richards, K.J. Low frequency variability of Southern Ocean jets. J. Geophys. Res. Oceans 2011, 116. [Google Scholar] [CrossRef] [Green Version]
  31. Stern, A.; Nadeau, L.P.; Holland, D. Instability and Mixing of Zonal Jets along an Idealized Continental Shelf Break. J. Phys. Oceanogr. 2015, 45, 2315–2338. [Google Scholar] [CrossRef]
Figure 1. Snapshots from the four configurations. The top four panels show surface vorticity h 2 ψ 1 (units: s - 1 ) from the simulations with (a) non-interactive wind stress (I); (b) wind stress depending only on ocean surface velocity (II); (c) wind stress depending only on SST (III); and (d) wind stress depending on both SST and ocean surface velocity (IV). The bottom two panels show the QG SST perturbation (units: C) from the simulations with (e) wind stress depending only on SST (III); and (f) wind stress depending on both SST and ocean surface velocity (IV).
Fluids 01 00034 g001aFluids 01 00034 g001b
Figure 2. (a) Time series of total horizontal "kinetic energy" | u | 2 / 2 ; and (b) cospectra of wind power input; the plot is normalized such that total power (watts) is obtained by summing up the cospectrum. The wind power input at the largest scale is denoted by × symbols, and has been divided by a factor of 10 to fit on the same axes. Symbols IIV indicate the wind stress formulation used in the simulations.
Fluids 01 00034 g002
Figure 3. Temporal evolution of the distribution of surface pseudo PV ( Q 1 ) from the simulations with different wind stress formulations IIV. The northern 20% and southern 20% of the domain have been excluded from these statistics in order to highlight the asymmetry concentrated around the inter-gyre jet. Temporal evolution of the distribution of potential vorticity (up) and of the mean positive and (minus) mean negative potential vorticity (down).
Fluids 01 00034 g003
Figure 4. Hovmöller diagram of the global distribution of surface pseudo PV ( Q 1 ) from a simulation using Wind III, restarted from sign reversed and flipped initial condition. Temporal evolution of the distribution of potential vorticity (up) and of the mean positive and (minus) mean negative potential vorticity (down).
Fluids 01 00034 g004
Figure 5. Time-averaged meridional profiles at 150 km east of the western boundary, centered on the instantaneous jet maximum, from a simulation with wind stress depending only on SST (III). (a) zonal velocity (m/s), high-pass filtered SST perturbation ( Δ T ) (scaled by a factor of 10; C), and zonal wind stress τ x (scaled by 0.12; Pa); and (b) surface pseudo PV Q 1 (scaled by 10 - 4 ; s - 1 ) and Ekman pumping w + E (scaled by 10 - 4 ; m/s).
Fluids 01 00034 g005
Table 1. Parameter values used in the simulations, and their descriptions.
ParameterValueDescription
L3072 kmSquare domain size
Δ x 3 kmHorizontal grid spacing
H4.5 kmTotal depth
n10Number of vertical layers
Δ t 15 minTime step
N + 0.01 s - 1 Surface buoyancy frequency
Δ N 0.004 s - 1 Top to bottom difference in buoyancy frequency
N a 0.0026 s - 1 Abyssal buoyancy frequency
l z 1 kmDecay scale of the stratification
f 0 1 × 10 - 4 s - 1 Coriolis frequency
β2 × 10 - 11 (ms) - 1 Coriolis parameter gradient
ρ 0 1000 kg·m - 3 Reference ocean density
ρ a 1 kg·m - 3 Reference atmosphere density
ν 4 2 × 10 8 m 4 ·s - 1 Biharmonic viscosity coefficient
κ4 × 10 8 m 4 ·s - 1 Biharmonic SST diffusion coefficient
C D 1.3 × 10 - 3 Wind stress drag coefficient
g9.8 m·s - 2 Gravitational acceleration
τ 0 0.12 PaBackground wind stress amplitude
d4.5 mDepth of the bottom Ekman layer
L f 40 kmHigh-pass SST filter length scale