1. Introduction
Aerobic granular sludges are self-assembled spherical biofilms composed of micro-organisms embedded in an extracellular polymeric substances (EPSs) matrix. These biofilms are used in wastewater treatment and present many benefits over activated sludges [
1]. Extracted EPS have the potential to be used in a wide variety of applications [
2,
3,
4,
5] mainly due to their capacity to form stable hydrogels with divalent cations, like calcium [
6,
7,
8]. A hydrogel is defined as a crosslinked polymeric network that has the capacity to absorb water while maintaining resistance to dissolution. In this sense, hydrogels are swollen by the solvent forming a one-phase system, whereas precipitates are dense, solid structures that make two-phase systems [
9,
10]. The extraction of gel-forming EPSs from aerobic granular sludge is conventionally carried out by alkaline treatment, followed by acidic precipitation, giving a yield varying from 1.5% to 29% of organic matter [
11,
12,
13,
14]. This underlines the necessity for a gel formation screening method that is able to detect the presence of gel-forming polymers at the beginning of the extraction protocol and to follow their loss during extraction (if any).
Some of the gel-forming polymers extracted from aerobic granules were named alginate-like exopolysaccharides (ALEs) due to their functional and chemical similarities with alginate [
7]. In the presence of CaCl
2, the gelation mechanism relies on calcium ions playing the role of a crosslinker through bridging two carboxylic acid functions (negatively charged) from adjacent alginate polymers, specifically through their guluronic acids [
15,
16]. Different functional groups are implied in the (ionic) crosslinking reactions of biomolecules with gel-forming capacities, such as primary amines, alcohols, thiols, carbonyls, and carboxylic acids [
16]. In fact, it was proven that the ALEs extracted from aerobic granules, whatever their origin, are made of a wide variety of molecules, including polysaccharides, proteins, lipids, and humic acids, among other molecules [
13,
14]. Further fractionation steps are required to obtain the fractions enriched with gel-forming EPSs to disclose the chemical groups that are responsible for the gelation mechanisms. Therefore, the development of a miniaturized method that is able to detect gel-forming capacity with low quantities of polymers either in liquid raw extracts and/or in the enriched soluble fractions obtained through diverse fractionation techniques (liquid chromatography, selective precipitation, etc.) is required.
In literature, the detection of the gelling capacity of EPSs is carried out through different methods. The first technique consists of extruding concentrated EPSs in a calcium solution and checking if a gel bead forms, therefore giving only a qualitative (gel formation or not) appreciation of the gel-forming capacity [
17]. A study carried out by Seviour et al. (2009) used a rheometer equipped with a Couette cell to follow the storage and loss modulus of the sample (224 mg per test) [
18], necessitating the sampling of large volumes of aerobic sludge, which could be problematic, especially for lab-scale reactors, as well as the availability of a rheometer being necessary. The most used method is based on the formation of cylindrical gels through dialysis for 24 h with divalent cations and then measuring the deformation of the formed hydrogels by dynamic mechanical analysis to obtain the corresponding Young’s modulus [
6]. This generally requires 10% (
w/
v) EPS solutions and, therefore, 40 mg for each test. Efforts have been made by Pagliaccia et al. (2022) to limit the consumption of EPSs through the optimization of the gels’ geometry, the concentration of the EPS solutions, and the calcium ions being used. It was found that at 0.1 M Ca
2+, the minimal concentration of EPS required is 5% (
w/
v) to obtain stable hydrogels and, therefore, 13.5 mg per test. The dependency of the hydrogel stiffness on the crosslinker concentration has also been underlined [
8].
This article aims to study the feasibility and performance of a miniaturized screening method using a simple technique (UV-visible spectroscopy) to measure the reactivity of the samples to calcium ions, with the goal of ensuring the availability of gelation screening methods to a wider audience of scientists and industrials through the use of simple techniques. The test aims to detect the presence of the molecules capable of interacting with calcium and forming gels and compare the gel formation capacity of different solutions. This objective will be attained through the development of the method using commercial standard molecules alone or in mixtures and then through its application through the different steps of the extraction protocol of EPS performed on granular sludge to check its efficiency in selecting gel-forming polymers. The test will help monitor the efficiency of gel-forming EPS extraction and will therefore allow the development of more targeted extraction protocols for a better recovery of gel-forming biopolymers [
14]. On an industrial level, the test will allow for the examination of the richness of wastewater treatment plants with gelling polymers for valorization purposes.
2. Results and Discussions
2.1. Calcium Requirements for Gel Formation
The detection of the calcium requirements for gel formation was performed to ensure that the molecules capable of reacting with calcium have the necessary amount of calcium to form gels. This was carried out by comparing the UV-vis spectra of supernatants obtained for 1.5% w/v alginate with low viscosity (ALV) in various Ca2+ concentrations (0; 0.025; 0.05; 0.1; 0.2 M). ALV was chosen because its density of negative charges is very high in comparison with other natural biopolymers due to the alternation of mannuronic and guluronic monomers bearing a negative carboxylic charge.
Figure 1 presents the spectra with and without calcium. It is clearly noticed that ALV can react with small amounts of calcium since, even at 0.025 M, the spectrum decreased drastically because of gel formation. However, upon reaching 0.1 M in calcium, it can be seen that the spectrum stabilized and no further decrease in the signal was noticed in comparison with the addition of 0.2 M calcium. In agreement with this, other studies underlined that alginate solutions with concentrations varying between 1 and 5% were able to react even at very low concentrations of calcium (i.e., 0.001 M). However, the stiffness (Young’s modulus) of the formed alginate hydrogels at 2.5%
w/
v with 0.001 M calcium was approximately 2.3 times lower compared to the highest tested concentration of calcium (0.1 M) [
8]. Therefore, the concentration of 0.1 M was chosen for the overall test.
2.2. Gelling Capacity of Standard Molecules Solutions
ALV, Bovine Serum albumin (BSA), and deoxyribonucleic acid (DNA) were used for the development of the test to represent the biochemical diversity within the EPS matrix. Whatever the tested polymer concentrations (0.5%, 1%, and 1.5%
w/
v), the BSA solutions exhibited a very low reactivity to calcium, with a %R of around 10% (
Figure 2), and no significant differences were noted between the tested concentrations. After calcium addition, there was no or minimal decrease at the 280 nm wavelength specific to proteins, while a decrease in absorbance was specifically localized around the 220 nm wavelength (
Supplementary Data Figure S1). This can be explained by changes in the secondary structure of BSA [
19]. Another explanation could be the formation of Ca(OH)
2 precipitates due to the interaction of calcium ions with the sodium hydroxide used to dissolve the samples. For the three tested BSA concentrations, the gel volume (Vg) was lower than 2.5% and did not increase significantly with an increase in BSA concentration (
Figure 2), reinforcing the hypothesis that no gel formation occurred and that only a small pellet of Ca(OH)
2 precipitate was formed. As expected, the GF of BSA (
Figure 2) is very low, indicating that the solutions of BSA did not exhibit a measurable gelling capacity.
Concerning DNA, whatever the tested concentrations, all the molecules present in the solutions reacted with calcium, leading to %R values of around 100 % (
Figure 2 and
Figure S1). The %Vg parameter showed an increase from 8.3% to 15%, with an increase in the DNA concentration from 0.5% to 1.5%
w/
v. Hence, it can be noted that the GF of DNA increases with an increase in concentration to reach 0.15 ± 0.03 at 1.5%
w/
v. This capacity of DNA molecules to form gels can be explained by their backbone composed of negatively charged phosphates that allow for interactions with positively charged biomolecules and ions. Hence, nucleic acids can function as strong hydrophilic polyelectrolytes with the ability to absorb water. In the literature, DNA was described as an attractive material for hydrogel matrices due to its functional properties, such as biocompatibility, biodegradability, and permeability, among others [
20]. In addition, the high affinity of DNA to calcium has been proven even in the presence of competing cations, such as monovalent cations (Na
+ or K
+) or divalent cations like Mg
2+ [
21].
The ALV solutions exhibited a high reactivity to calcium since the percentage of the initial area that disappeared was higher than 80% for all the tested concentrations (
Figure 2 and
Figure S1). In addition, a high percentage of gel volume was obtained, evolving from 46.1% to 68.1% with an increase in concentration from 0.5% to 1.5%
w/
v (
Figure 2). The highest GF was noted for alginate at 1.5% (
w/
v) and was equal to 0.56 ± 0.04. Indeed, alginate is a well-known gelling molecule capable of forming gels with different ions and particularly with calcium [
22]. Therefore, the capacity to form gels of the various solutions in terms of both molecular interaction with calcium and water swelling was as follows: ALV ˃ DNA ˃ BSA, whatever the tested concentrations.
2.3. Scanning Electron Microscopy (SEM) Characterization
The gels formed with Alginate and DNA were observed using SEM, and, in both cases, the 3D network responsible for gel formation was detected (
Figure 3). However, different structures were observed; indeed, alginate hydrogels are more compact in comparison with DNA hydrogels that appear more filamentous with larger pores. The difference in porosity influences the properties of the hydrogels formed, such as their elastic properties. When compression is applied to a hydrogel, fluid is pushed through the pores, and the polymeric chains realign and then reach a point where the fluid’s ability to pass through the pores is reduced. Hydrogels with larger pores have a greater ability to recover once the mechanical load is reduced due to the greater ability of fluids to be redistributed within the polymeric network and, therefore, are more elastic [
8].
2.4. Gelling Capacity of Mixtures of Standard Molecules
The developed method was tested on mixes of standard molecules, with the concentration of each molecule present in the final mixture set to 0.5% (w/v). This low concentration was chosen in order to evaluate the screening capacity for gelling molecules by respecting low material consumption and to check the capacity of the test to detect gelation, even in complex mixtures.
As shown in
Figure 4 and
Figure S2, the three solutions composed of two types of molecules exhibited GF values ranging from 0.05 ± 0.04 to 0.32 ± 0.04, the highest being obtained with the mixture of ALV+DNA and the lowest corresponding to the binary solution of BSA+DNA. The mixture containing the three standard molecules (BSA+ALV+DNA) had an intermediate GF of 0.22 ± 0.02 that decreased by one-third compared to the GF of the binary ALV+DNA solution (0.32 ± 0.04). This is consistent with the fact that BSA did not harm the capacity of ALV and DNA to form gels (%Vg remained the same between ALV+DNA and BSA+ALV+DNA). However, the addition of BSA to the mixture has reduced the ratio of the gelling molecules and, therefore, has caused a %R decrease in the tested conditions. In the same way, combining BSA with ALV reduced the GF by half, going from 0.38 ± 0.02 for ALV at 0.5% (
Figure 2) to 0.19 ± 0.05 for the mixture of BSA+ALV. A similar reduction in the GF was also observed after the addition of BSA to a solution of pure DNA that decreased from 0.09 ± 0.01 to 0.05 ± 0.04.
Concerning the effects of DNA in the mixtures, it can be noticed that a decrease in %Vg is observed after the addition of DNA to a solution (from a %Vg of 46.1 ± 2.3% for ALV down to 32.1 ± 4.6% in the case of ALV+DNA). The same observation can be made upon comparing BSA+ALV with BSA+ALV+DNA. A hypothesis explaining this observation could be that DNA is a highly negatively charged molecule, which increases the negative repulsive forces between molecules in the solution, thus possibly hindering gelation. In addition, interactions between DNA and ALV could lead to the formation of a more compact hydrogel with a lower water retention capacity.
In order to summarize the different cases when performing this test, a classification based on the GF, %R, and %Vg is proposed in
Figure 5 and
Figure S3. The previously tested solutions could be classified as samples with high gelling potential (GF > 0.4) resulting from a high %R and high %Vg or with low-gelling potential (GF < 0.1) or with an intermediate gelling potential (0.1 < GF < 0.4), divided into two categories depending on the %R (higher or lower than 50%) and the %Vg (higher or lower than 35%).
According to this classification, BSA and the binary of BSA+DNA are the representatives of the low GF group. As previously mentioned, BSA does not have a gel-forming capacity in the tested conditions. Although the %Vg of the binary BSA+DNA was similar to that of DNA, the binary BSA+DNA was classified as a low gel-forming solution because the ratio of gelling molecules present in the solution was reduced due to the presence of BSA (a non-gelling molecule). The high GF group consisted of the pure ALV solution, a gelling molecule with a high capacity for gel formation.
Particular attention should be paid to the solutions with a medium or intermediate GF, which could correspond to two categories. The first category is based on high %R (>50%) and low %Vg (<35%). In this case, the studied solution might be exhibiting precipitation behavior since it is reactive but does not have the capacity to retain water, which is a characteristic of hydrogels. Another possibility is that a gelling molecule that has a low water retention capacity is present in the solution. It can be noticed that the majority of solutions containing DNA are present in this category (as noticed previously, the presence of DNA reduced the %Vg hence decreasing the gel formation capacity).
The second profile that resulted from a low %R (<50%) but with a high %Vg (>35%) is due to a swelling behavior, therefore meaning the presence of a gelling molecule. In this case, the low %R might be due to a low extinction coefficient, therefore masking the reactivity of the gelling molecule. In this category, the BSA+ALV solutions are the only representatives. Indeed, as previously discussed, BSA did not hinder gelation, and this was previously shown in the literature where there was no influence of BSA on the post-gelling stiffness of alginate [
8]. However, the presence of BSA reduced the ratio of gelling molecules in the solution, causing a decrease in %R. In addition, the extinction factors of BSA and ALV are very different, and this shows that even with quite different extinction factors, the test was still capable of detecting gelation. Attention must be paid when comparing solutions with the same GF since it can be possible to obtain a similar GF but with different %R and/or %Vg. This is clearly shown when comparing the BSA+ALV and BSA+ALV+DNA solutions that exhibited similar GF values (0.22 ± 0.02 and 0.19 ± 0.05, respectively) but different reactivities and gel volumes leading to different interpretations.
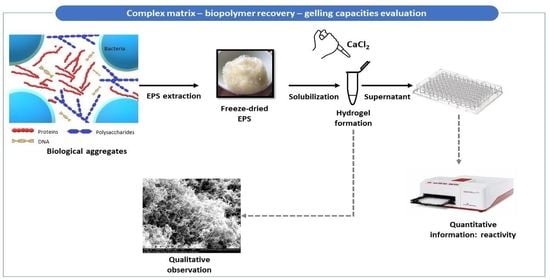
2.5. Application on Complex EPS Mixtures
The developed test was applied to the three EPS samples that were recovered during gel-forming EPS extraction from aerobic granular sludges [
7,
14]. The three tested fractions corresponding to the S1 (raw extract), S2 (solubilized acidic precipitate), and S’1 (supernatant of the acidic precipitation) were submitted to the test at a final concentration of 0.5%
w/
v, and the results can be seen in
Figure 6 and
Figure S4.
The highest GF was for S2 at 0.16 ± 0.03, followed by S1 at 0.10 ± 0.01, and finally, S’1 at 0.004 ± 0.002. The acidic precipitation is meant to select the gel-forming molecules [
7,
13,
14], therefore explaining that the S2 solution had the highest GF. Since S1 is made by the totality of the extracted molecules (i.e., the molecules that have the capacity to form gels and those that do not), a lower GF was expected due to a lower ratio of gelling molecules in the solution. The gelling molecules are not supposed to be present in the supernatant of the acidic precipitation, S’1; hence, the lowest value of GF was obtained in this solution. Altogether, these results show that the protocol of extraction and acidic precipitation is indeed capable of extracting and concentrating the gelling molecules in one fraction (S2), where it can be noticed that the GF increased by a factor of 1.6 only through this step of acidic precipitation. As previously mentioned, biochemical groups often recurring in gel-forming EPSs are proteins, polysaccharides, and DNA [
13,
14,
23]. However, they are not equally abundant in the mixture; for example, Bou-Sarkis et al. (2022) showed that there are equal amounts of proteins and polysaccharides in the EPS extracted using sodium carbonate, whereas it had approximately 40 times less DNA. Another study using anammox granules showed that EPSs are composed, to a lesser extent, of DNA in comparison with polysaccharides and proteins [
24]. This means that the effects of DNA on the GF of S2 are most probably limited, but other contaminants were present, such as non-gelling proteins that could reduce the GF of S2, as was the case when mixing BSA with ALV.
The effect of the concentration on the GF values for S2 was quantified. As can be seen in
Supplementary Data Figure S5A, in the tested range (0.5 to 1.5%
w/
v), the GF increased linearly (from 0.16 ± 0.03 to 0.23 ± 0.03).
A more filamentous and porous structure for S2 (
Supplementary Data Figure S5B) was obtained in comparison with alginate gels (
Figure 3). Pfaff et al. (2021) noticed that the gels formed by gel-forming EPSs are rather fibrous and filled with voids, and they attributed this observation to many factors, including the calcium concentration and the concentration of the gelling polymers; hence, these factors can be used to control the properties of the gels [
25]. In 2022, Pagliaccia et al. attributed more significative linear elastic behavior to EPS hydrogels in comparison to alginate, and this could be due to a more porous structure.
2.6. Gelling Index: Comparing Solutions’Gelling Capacity to a Reference
Finally, a new parameter was proposed and named “gelling index”, with the goal of comparing the gelling capacity of a solution to an alginate solution at the same concentration (a well-known gelling molecule). This parameter will allow for the determination of the gelling capacity in reference to a well-studied gelling polymer and hence obtain a more tangible notion of the gelling capacity of the solution being studied in comparison with that of alginate.
The GI of both the standard molecules and the EPS samples described in this study was calculated for the concentration of 0.5% (
w/
v). As shown in
Figure 7, the evaluation of the GI allows for the classification of solutions according to their capacity to form gels. It can be noticed rapidly that none of the solutions’ gelling index is close to 1 (alginate). Among the compared solutions, precipitated EPS in S2 has the highest gelling index: 0.43, followed by the S1 sample containing alkaline extracted EPS, with a GI of 0.26. This technique allows for a quick comparison between solutions’ capacities to form gels by using a reference (ALV). Indeed, when compared to the obtained results within the literature, it can be noticed that alginate has a better gel formation capacity than EPS; in particular, the value of alginate’s Young’s modulus is approximately 10 times higher than that of EPS at 5%
w/
v [
8]. In addition, it was shown that alginate (at a concentration of 2.5%
w/
v compared to EPS at 10%
w/
v) had a Young’s modulus approximately 15 times higher than calcium [
6]. Thus, Young’s modulus has a better sensitivity to detect the differences between hydrogels, but the proposed test remains interesting since it can provide information about the presence of nongelling molecules within a mixture and can be coupled with other methods to have a global view on the gelation capacity of a solution. The lower sensitivity compared to Young’s modulus is acceptable since the primary purpose of the developed test is to screen for the gelling capacity. In comparison to the literature [
6,
8,
17,
18], this screening method allows for reduced sampling from bioreactors due to the reduced amount of EPS needed per test, and offers a quick screening using simple equipment. These results show that the test is capable of detecting gel formation as a screening method to select interesting solutions for further characterization. The test showed that more purification of the extracted EPS is needed in order to obtain a solution of polymers with more interesting properties closer to that of alginate.
Therefore, the proposed test (
Supplementary Data Figure S3) allows for a quick comparison of the gelling potential of the biological samples assayed at the same final concentration. The test can be used to monitor the increase or decrease in gelling capacity during the purification of biopolymers in order to quickly identify the relevant fractions. In addition, activating or inhibiting effects could be detected, thus offering the possibility of formulating new preparations or mixtures of biopolymers. In fact, the mixtures of molecules that give composite hydrogels were shown previously in the literature to have interesting properties. Hydrogels made by using xanthan gum and β-lactoglobulin have been described in which β-lactoglobulin plays the role of a crosslinking agent between the xanthan polymers when the pH conditions are convenient [
26]. Hence, this test can be used to study composite hydrogels since it proved its capacity to detect gelation even in complex mixtures.
3. Conclusions
A method was developed to quickly screen the capacity of solutions to form gels in the presence of calcium. This method can be used to understand the role of contaminants in the hydrogel formation and by being coupled with microscopic observations (SEM), can provide knowledge on the structure of the hydrogel network formed. The method has the advantage of being less material and time-consuming in comparison to the conventional methods used in the literature and allows for the detection of gelation through the use of simple methods (UV-vis spectroscopy). Screening tests can be carried out using only 1 mg of the sample to be tested, leading to less sampling volumes and, therefore, less perturbation of lab-scale reactors.
The direct application of the method will be as a screening process for gelling capacity and to compare extracts’ capacities of gelation. The method was applied to the EPS extraction protocol as a proof of concept, and it was found that the protocol allowed for the selection of gel-forming molecules, but the obtained gelling solution still needs further purification to attain a GF closer to alginate and, therefore, a GI closer to 1. This test can be further used to follow the enrichment in gelling polymers during purification/fractionation processes. In conclusion, due to its ease of application, low consumption of materials, and speed, this test can be very helpful in the progression toward efficiently selecting gel-forming molecules from aerobic granules. In the future, trying to detect the participation of specific biochemical groups in gelation through the coupling of this test with fluorescent detection using specific probes can be tested. Moreover, this test can help in modulating and understanding the parameters affecting the gelation of different solutions, such as pH, divalent ions, the concentration of polymers, etc., and hence allow for the more efficient valorization of EPS.


 ,
, 


