
Microsponge-Based Gel Loaded with Immunosuppressant as a Simple and Valuable Strategy for Psoriasis Therapy: Determination of Pro-Inflammatory Response through Cytokine IL-2 mRNA Expression

 ,
, 

Abstract
1. Introduction
2. Results and Discussion
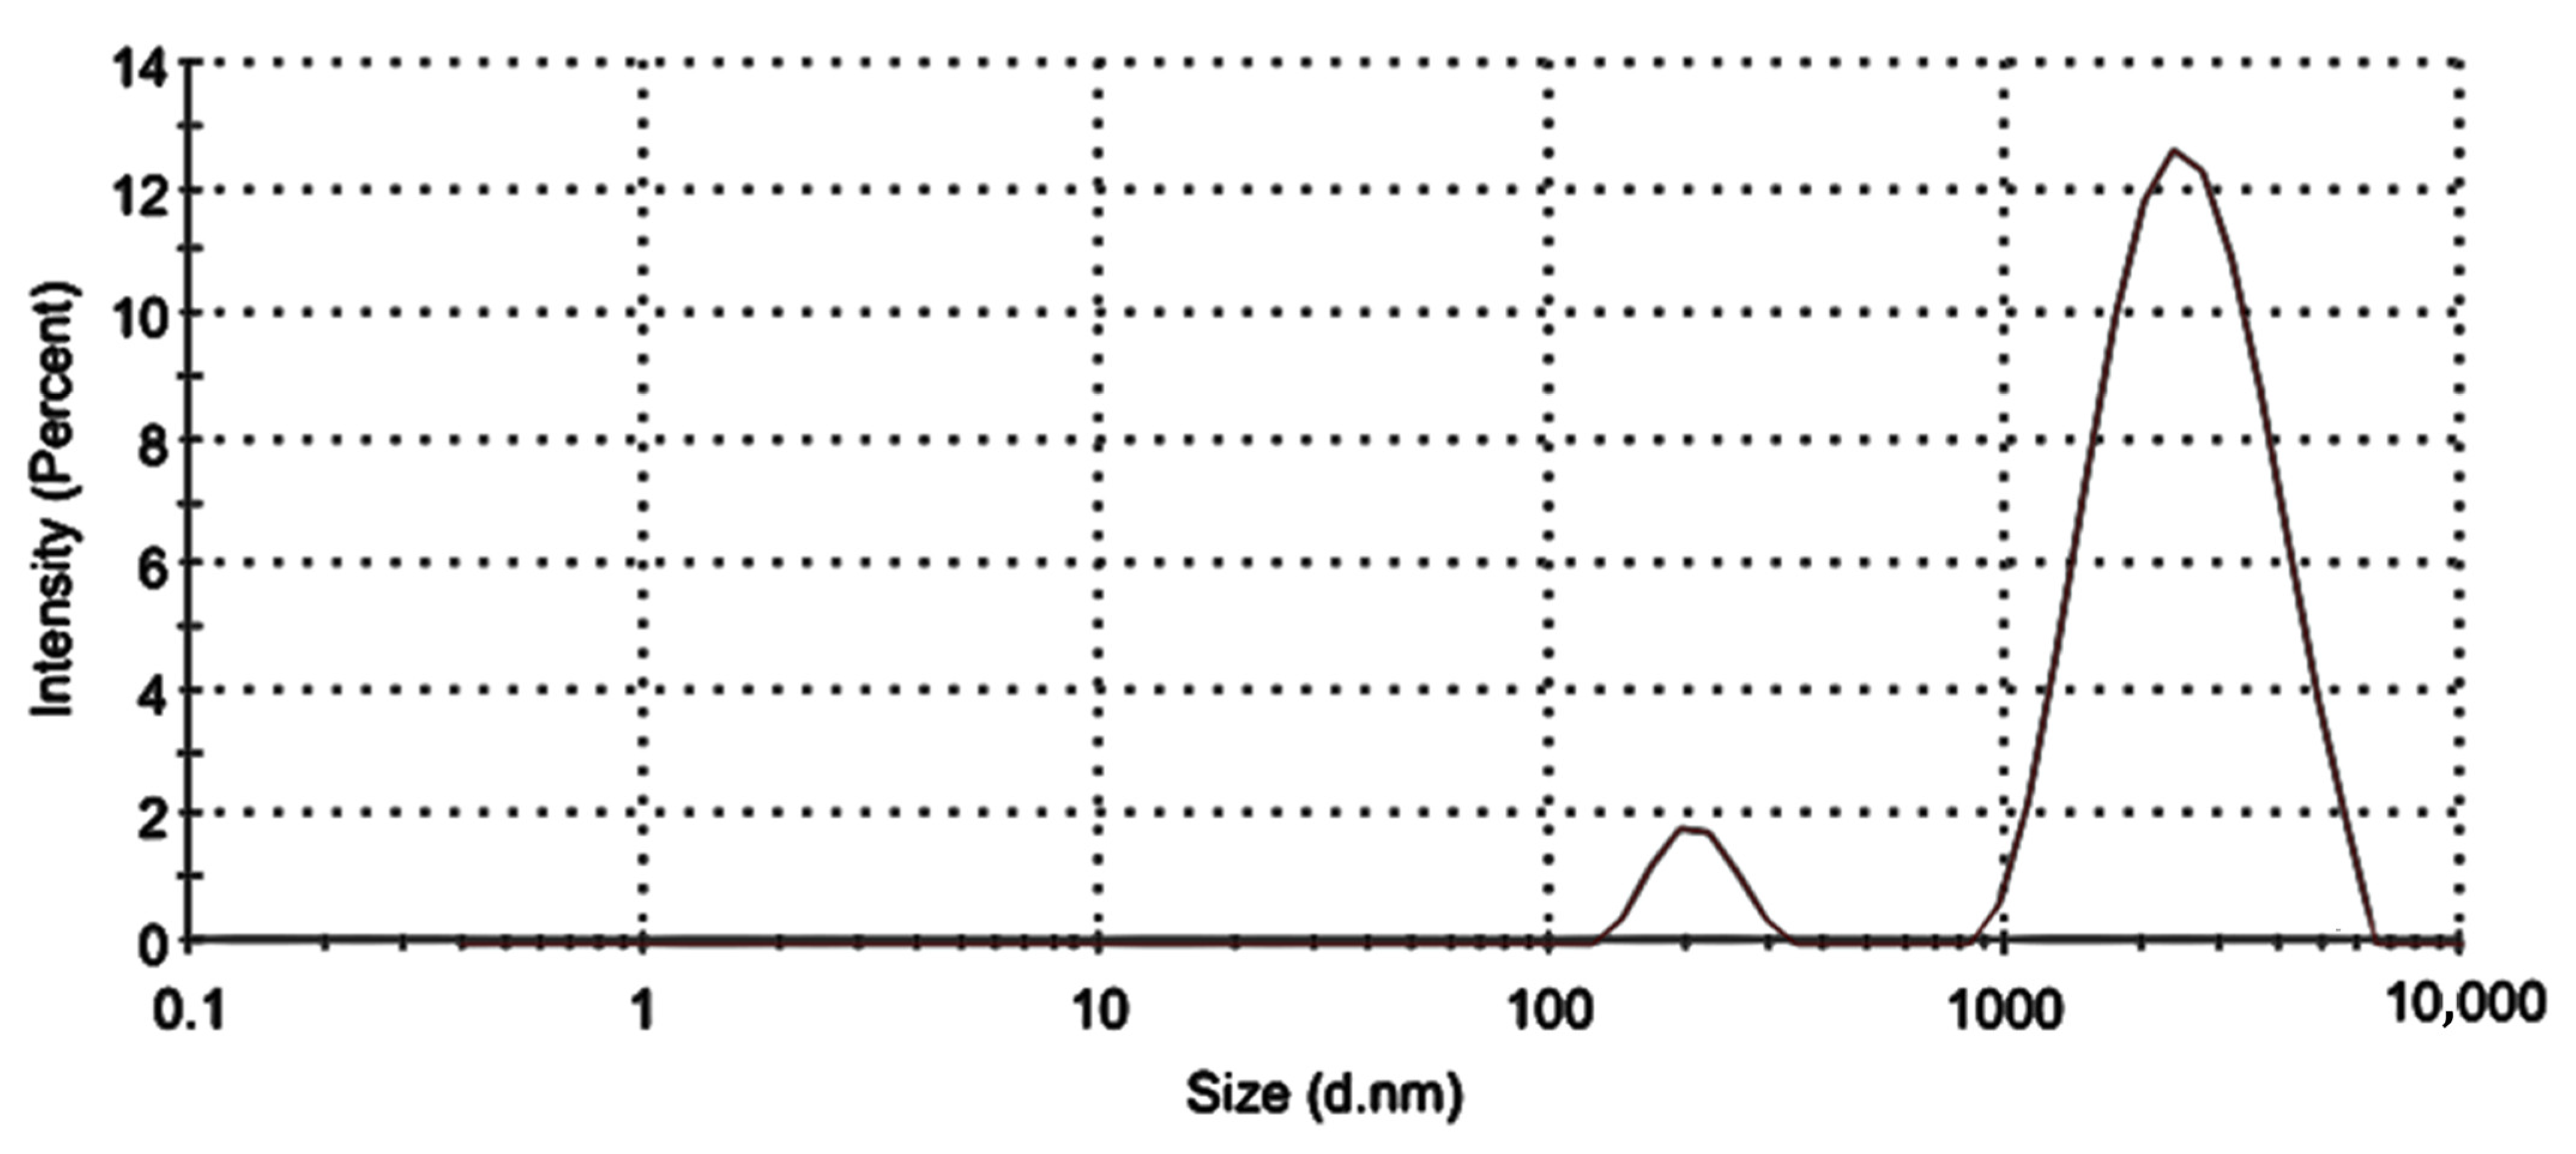
2.1. Particle Size, Polydispersity Index (PDI) and Zeta Potential
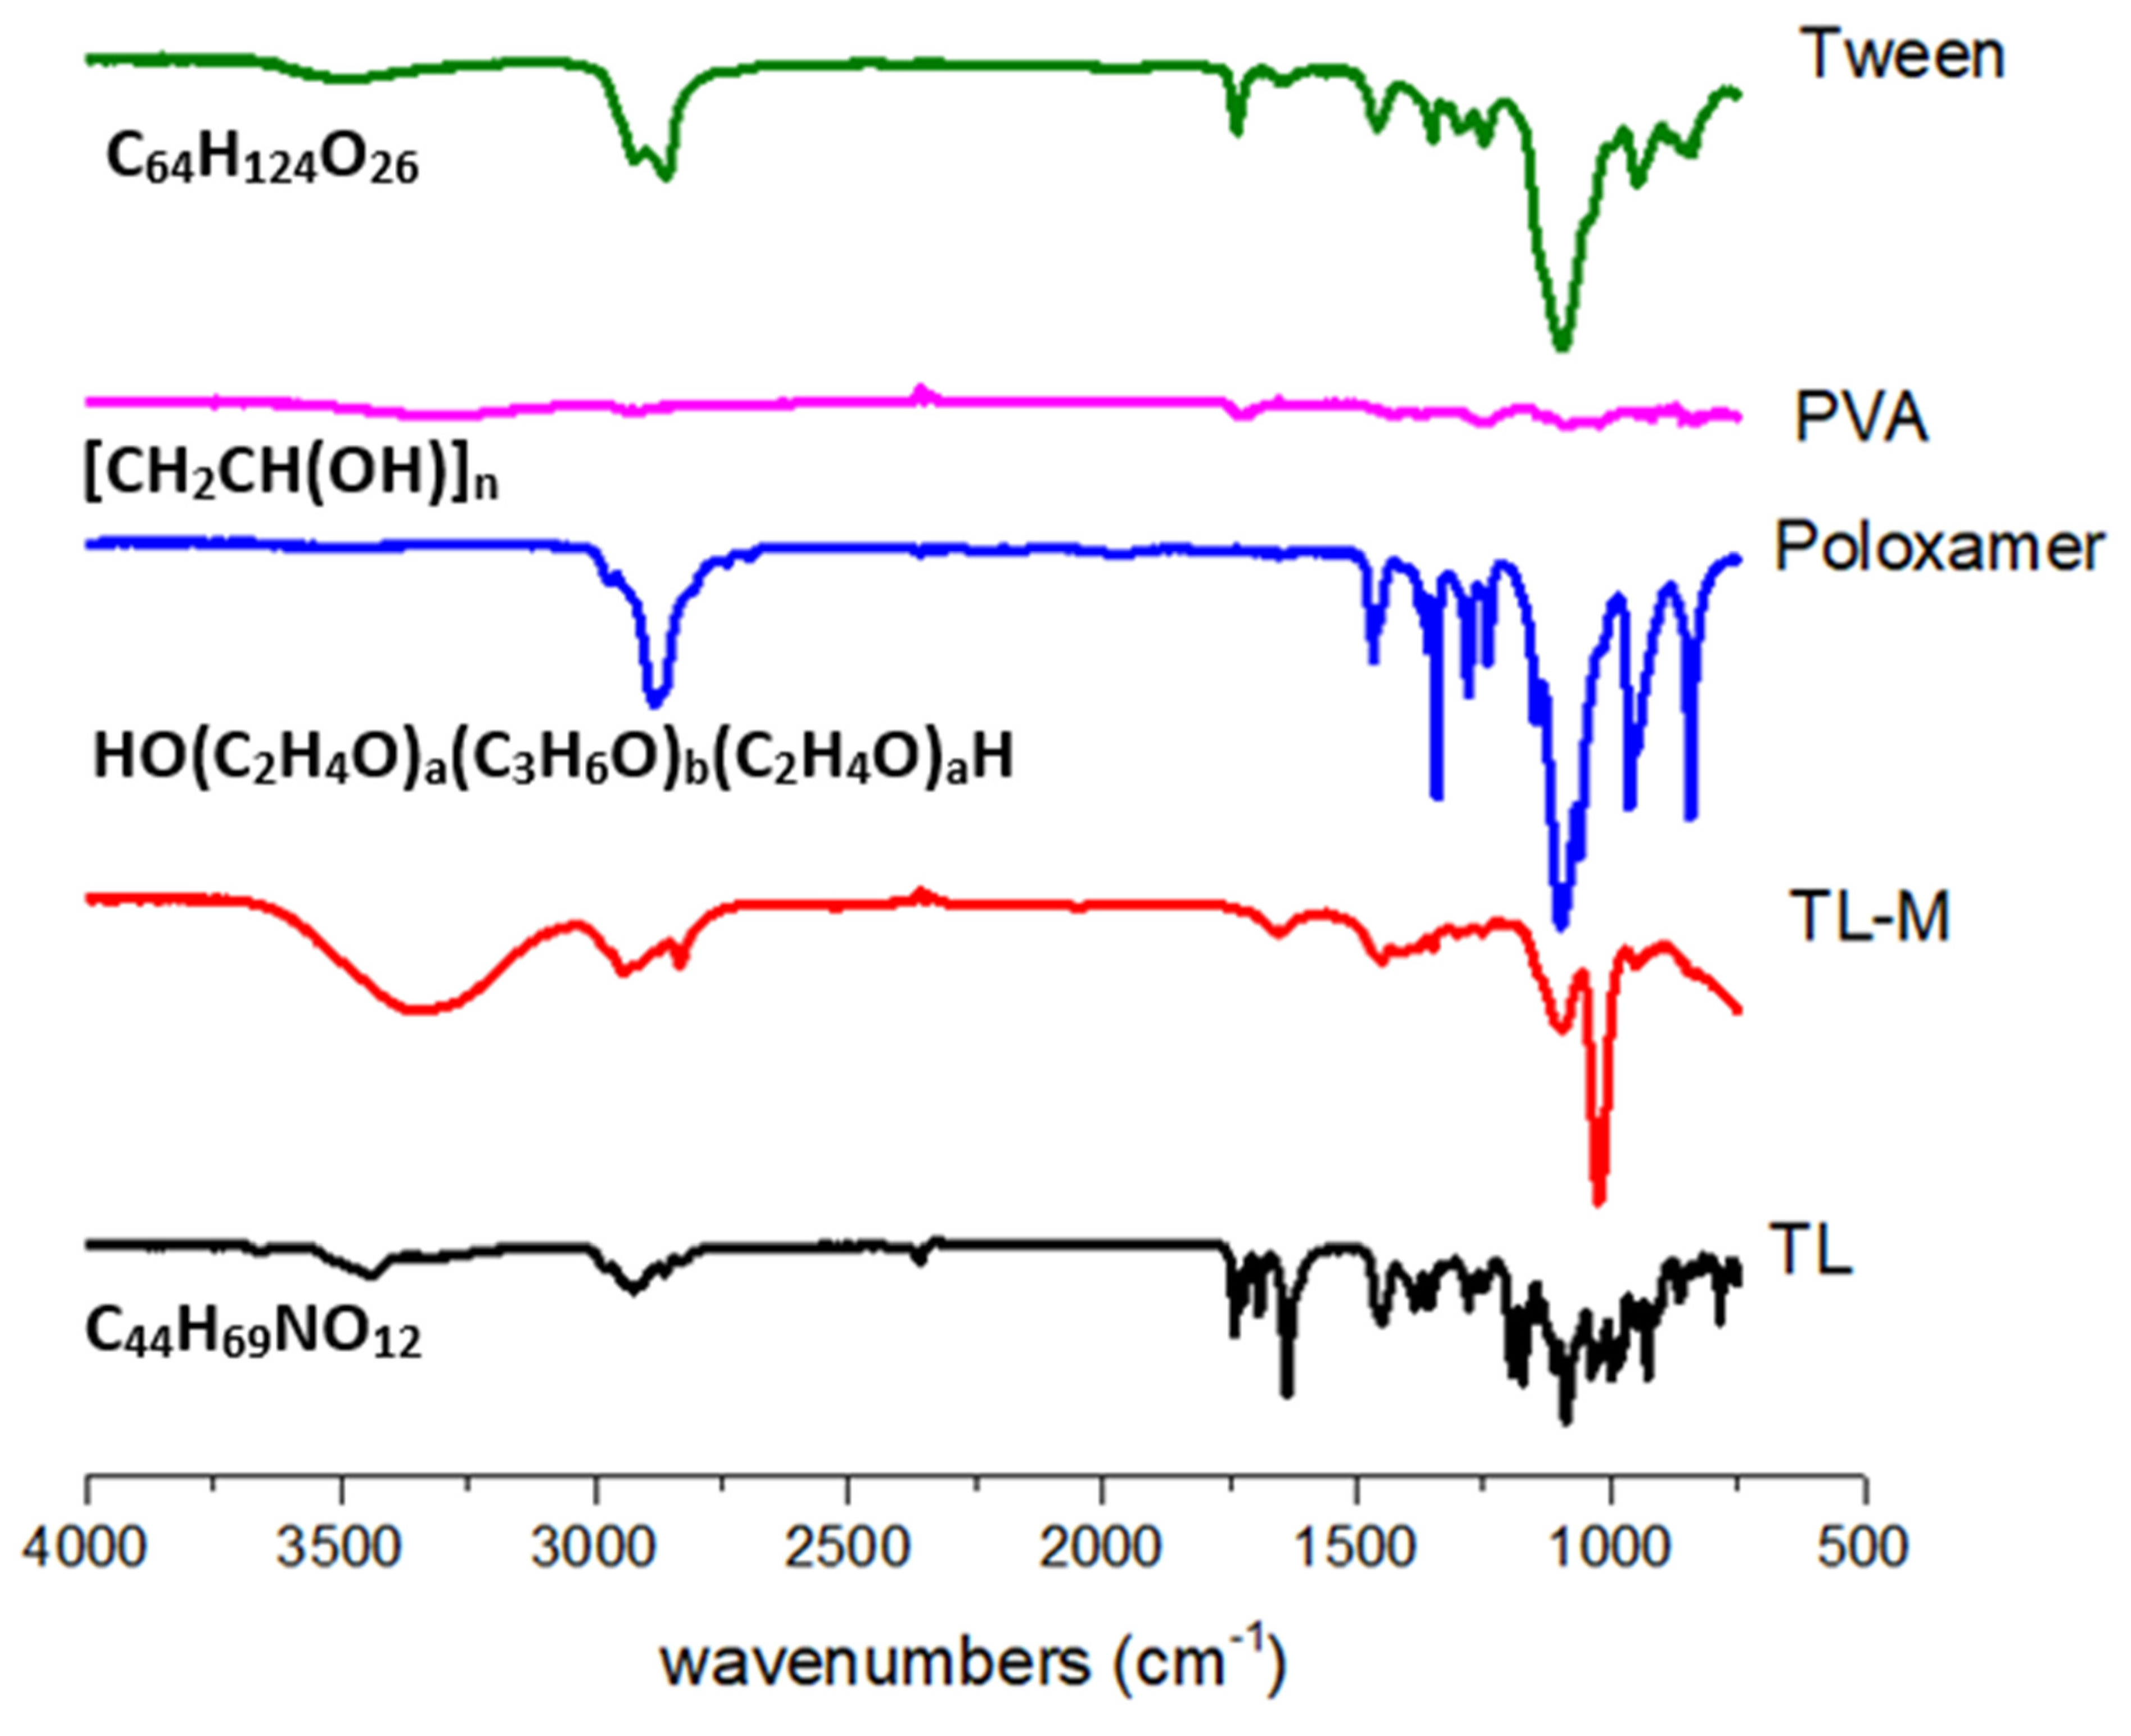
2.2. FTIR Analysis
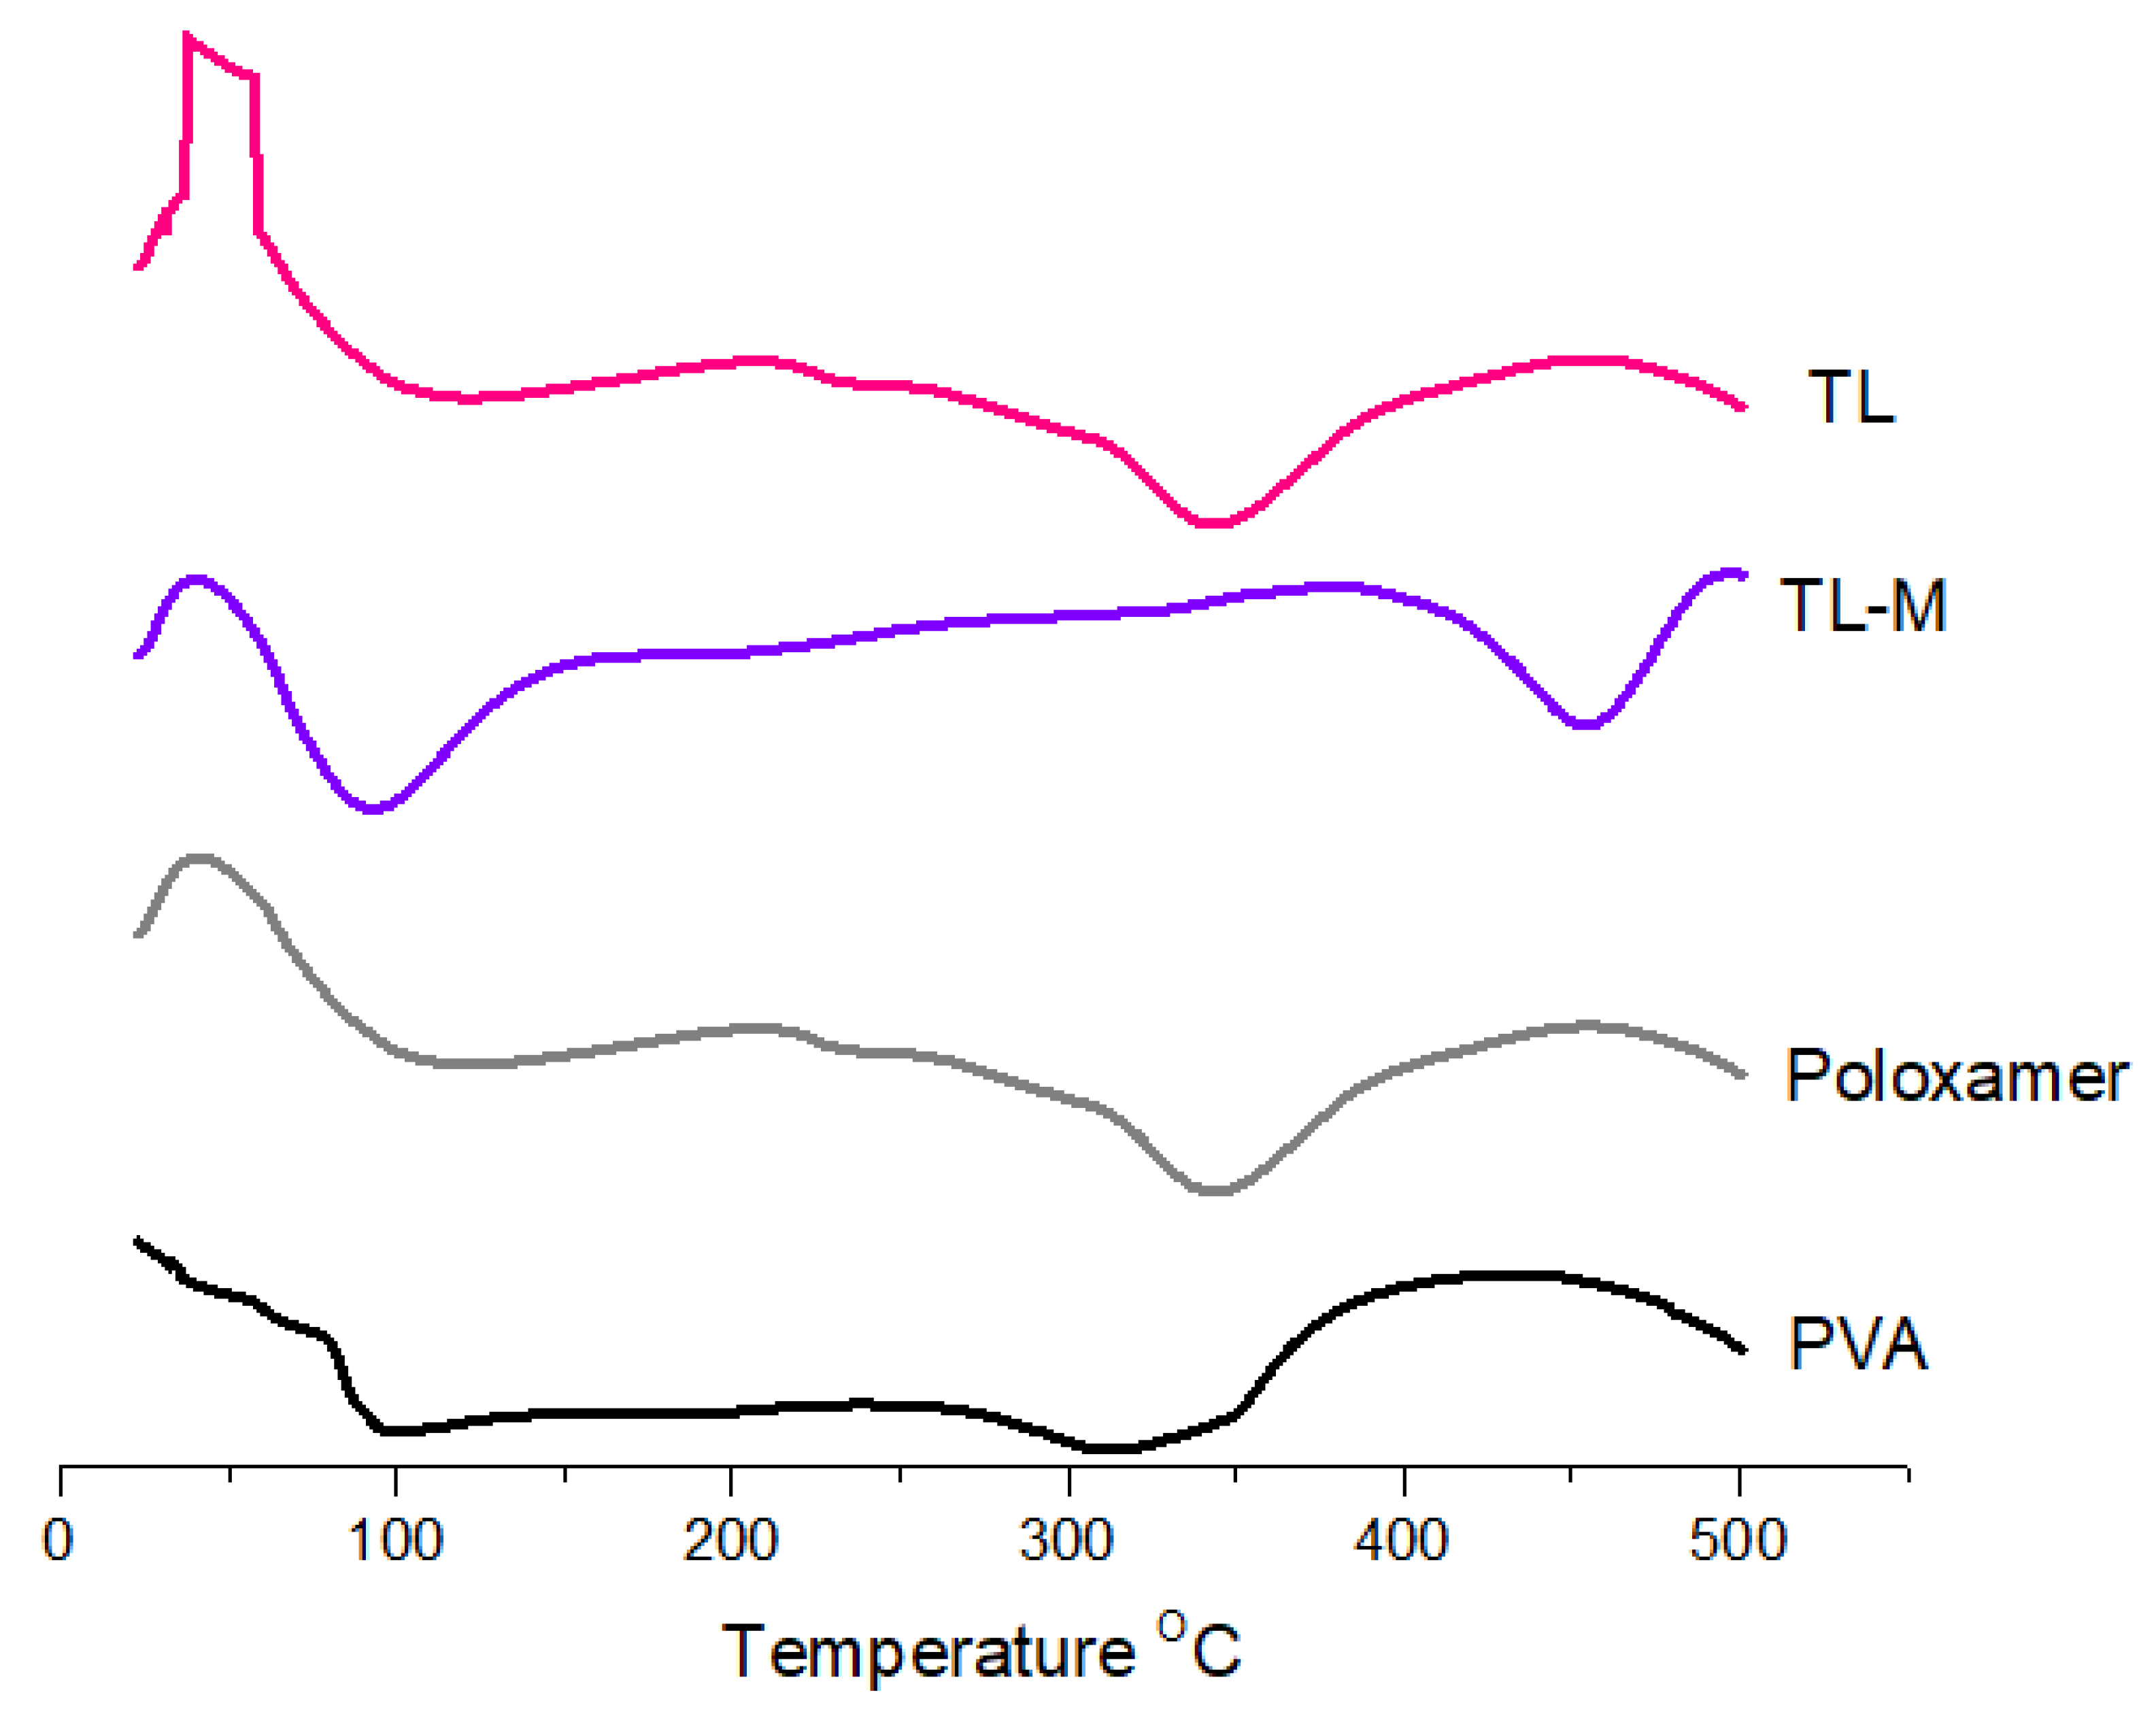
2.3. DSC Analysis
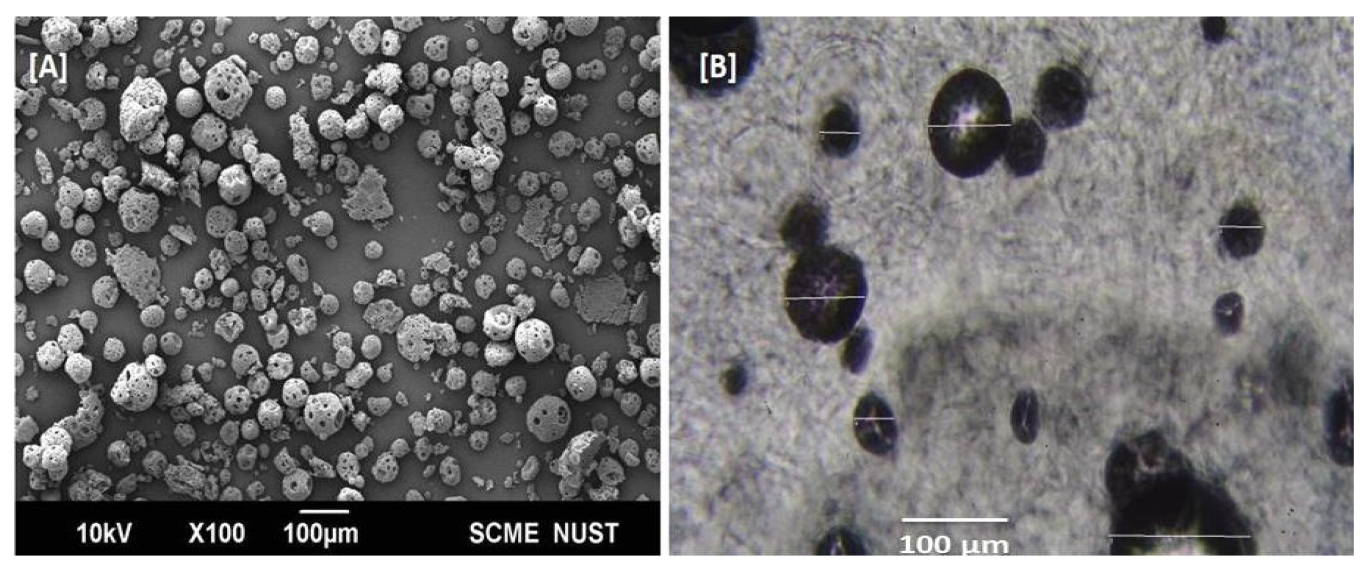
2.4. Morphology Analyses
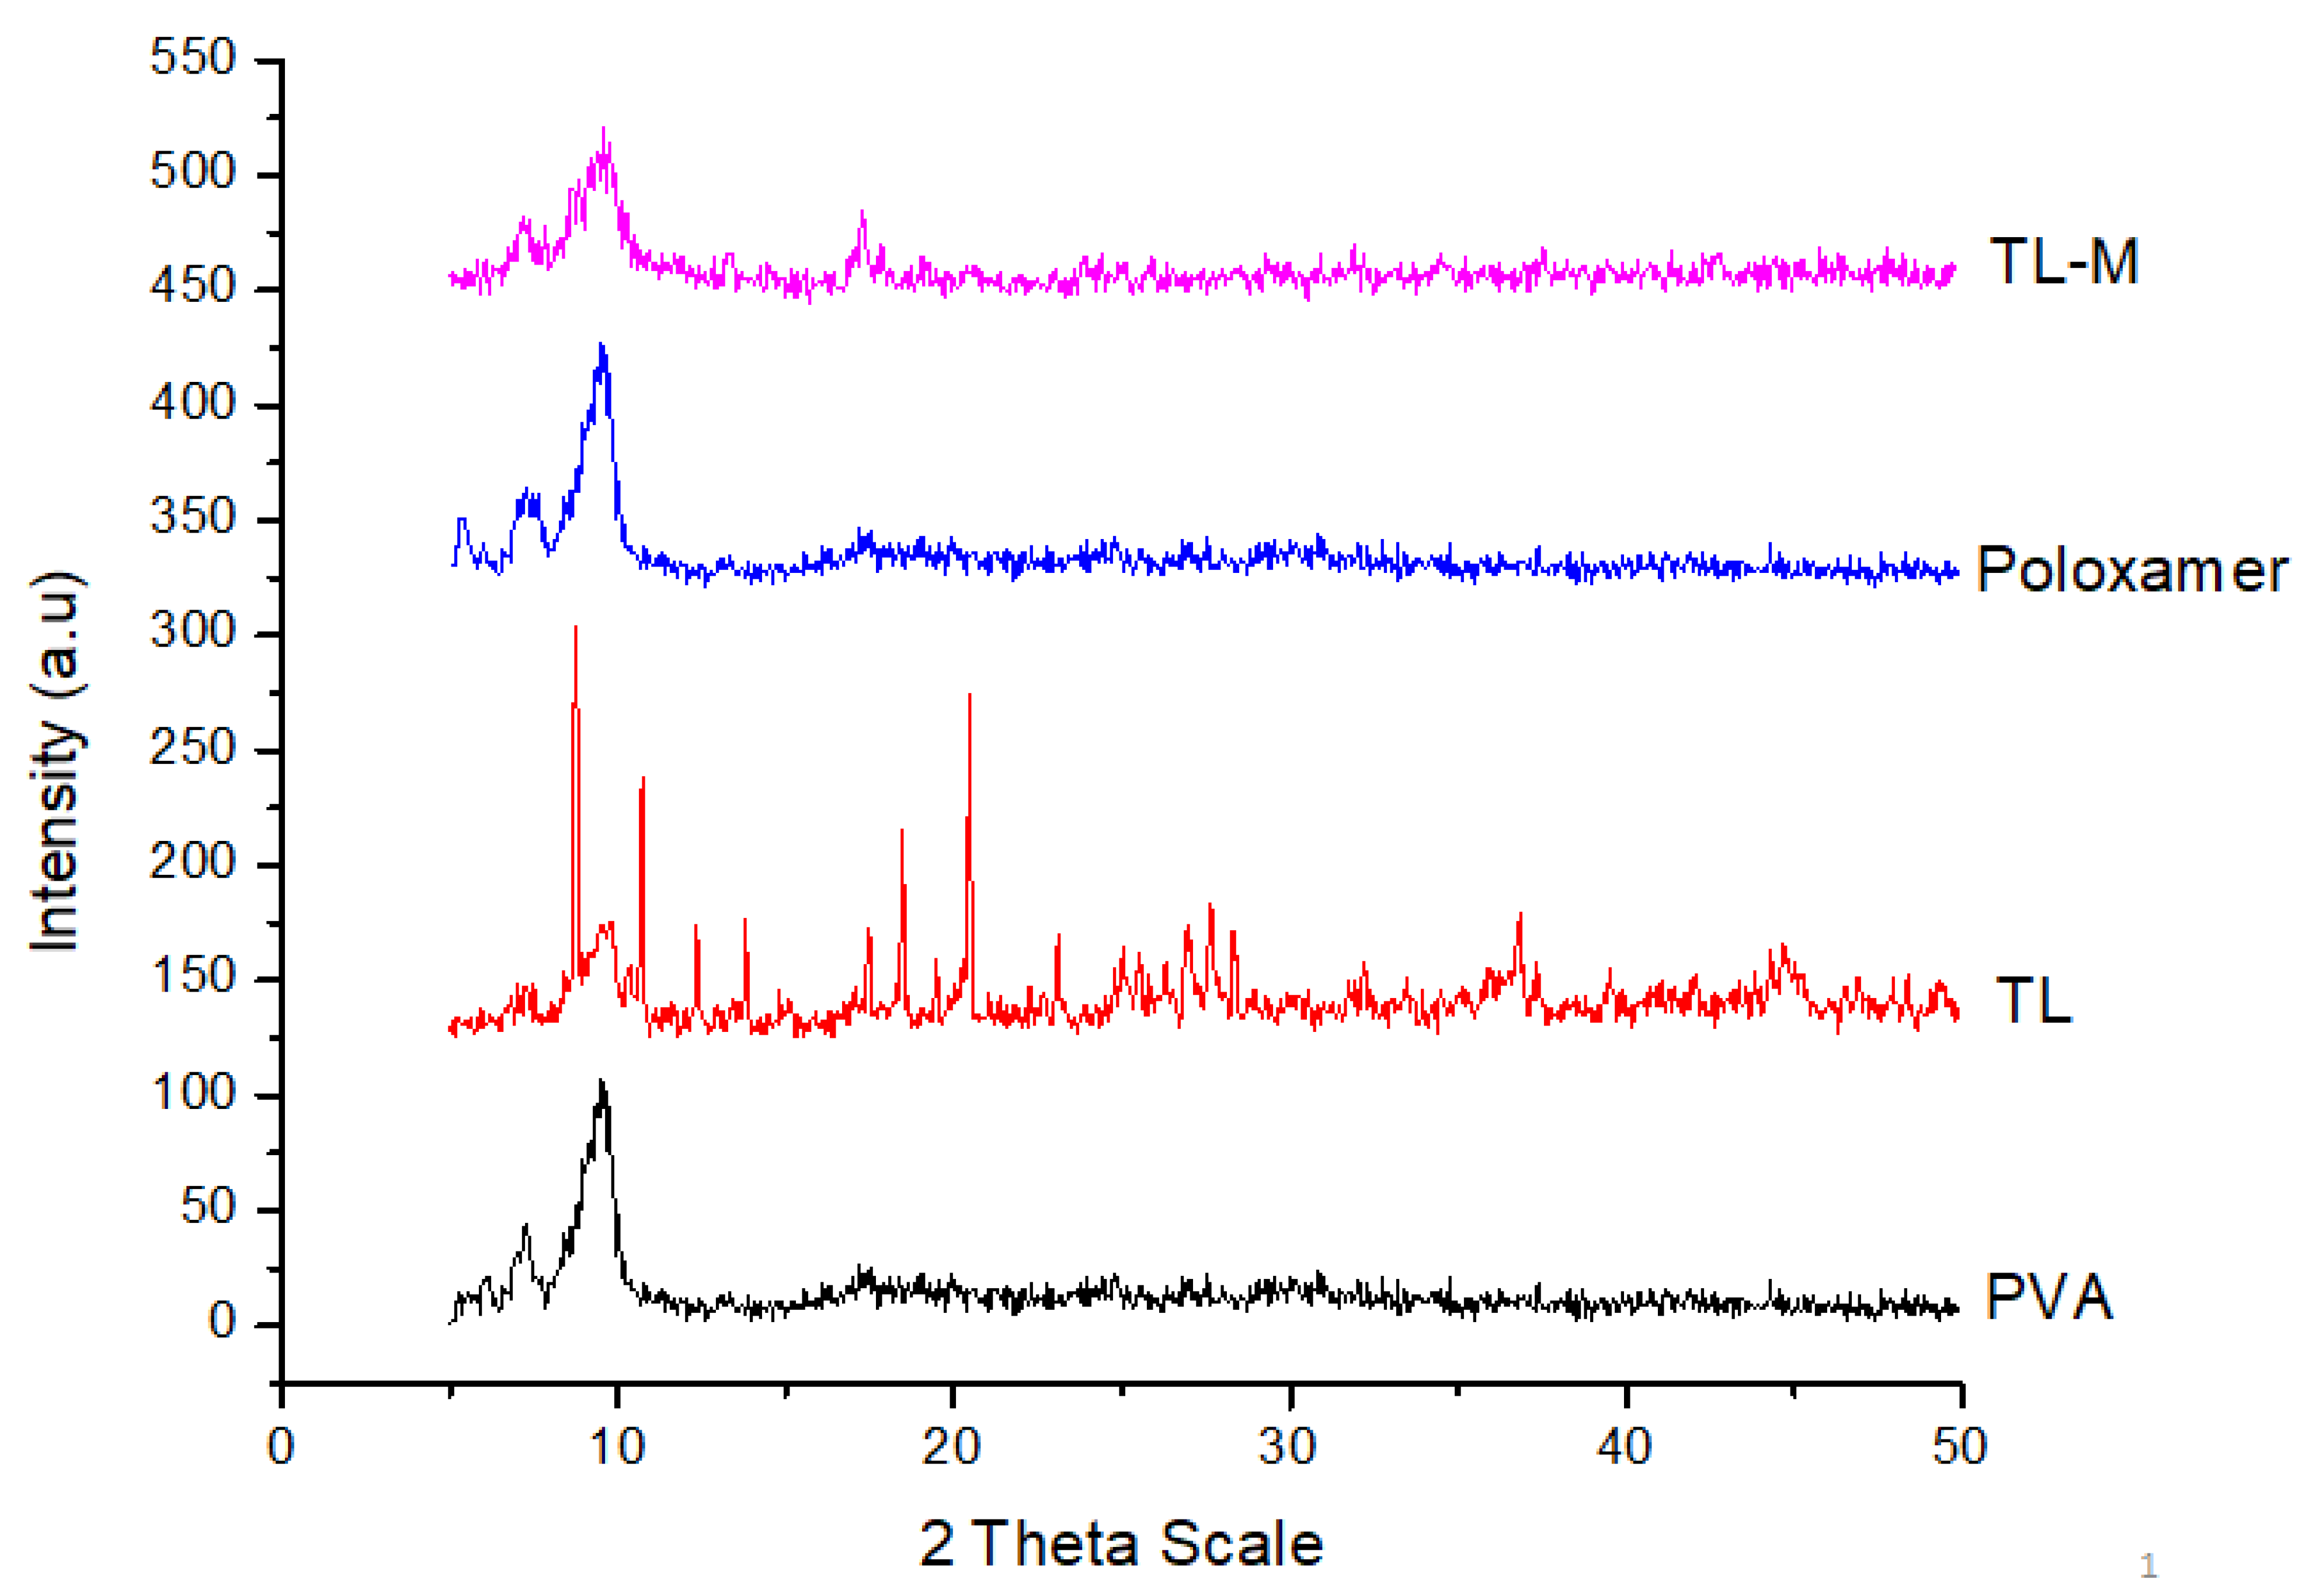
2.5. Powder X-ray Diffraction Study (PXRD)
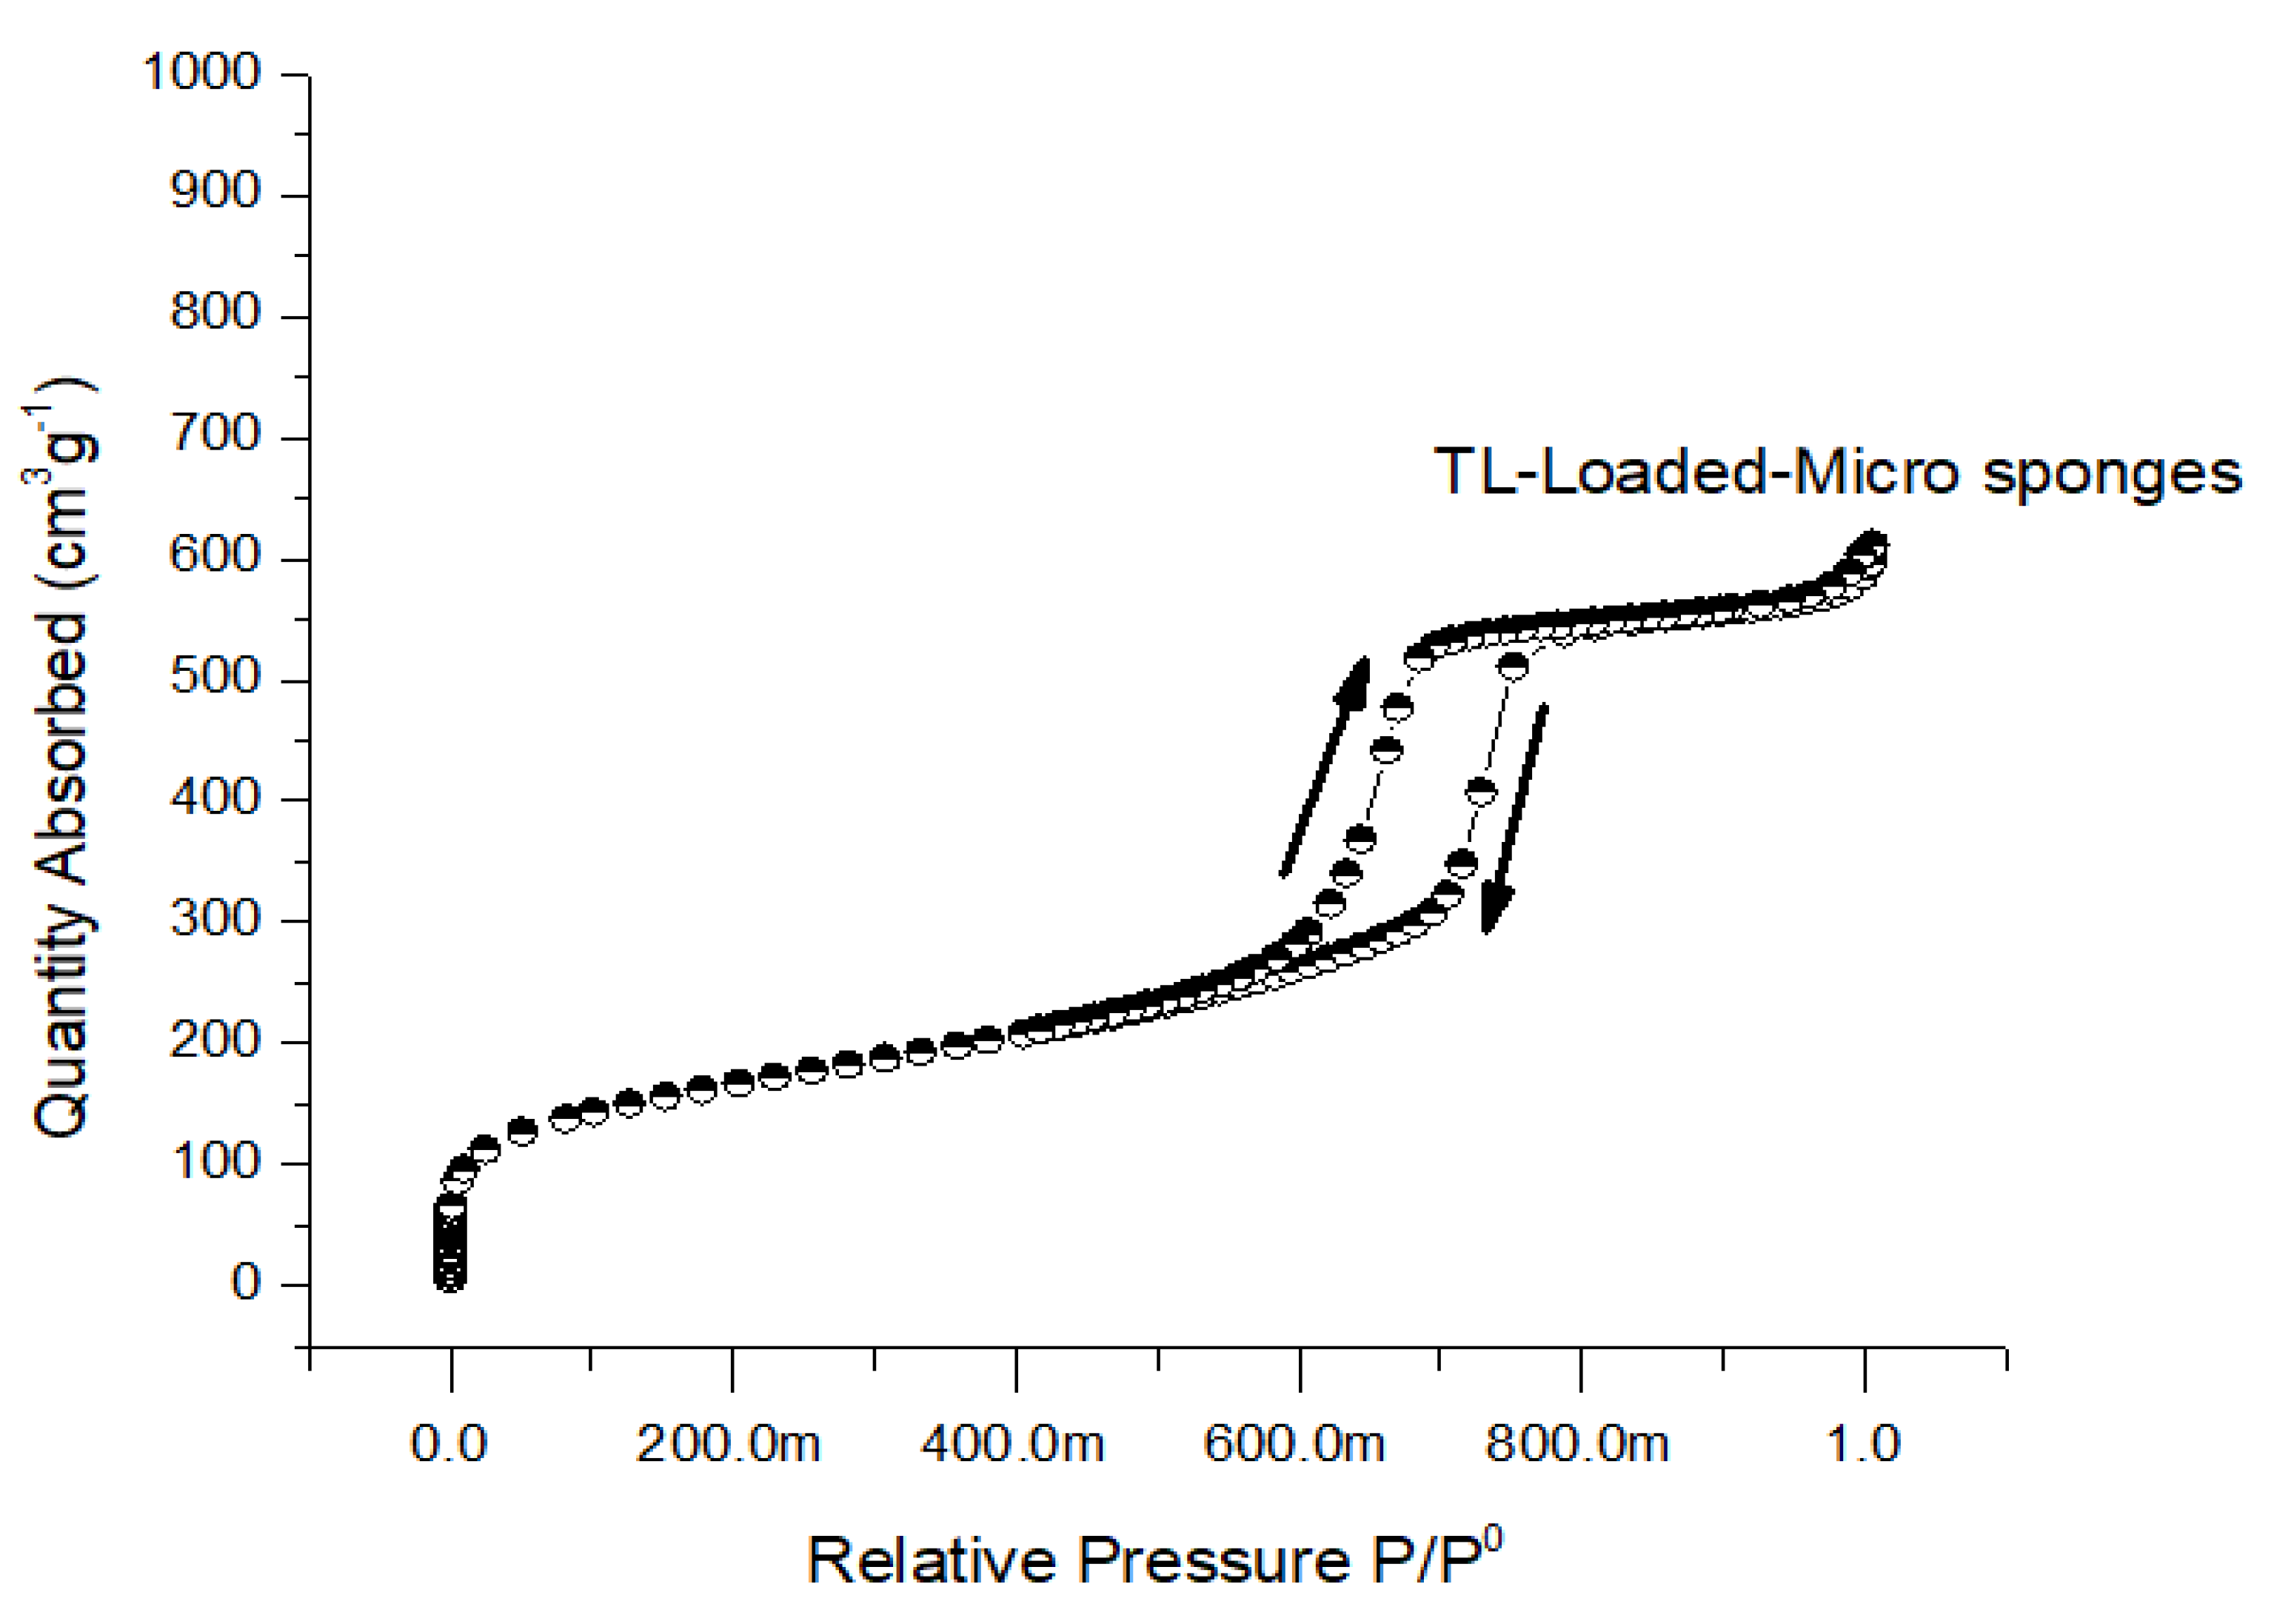
2.6. Nitrogen Adsorption–Desorption Analysis
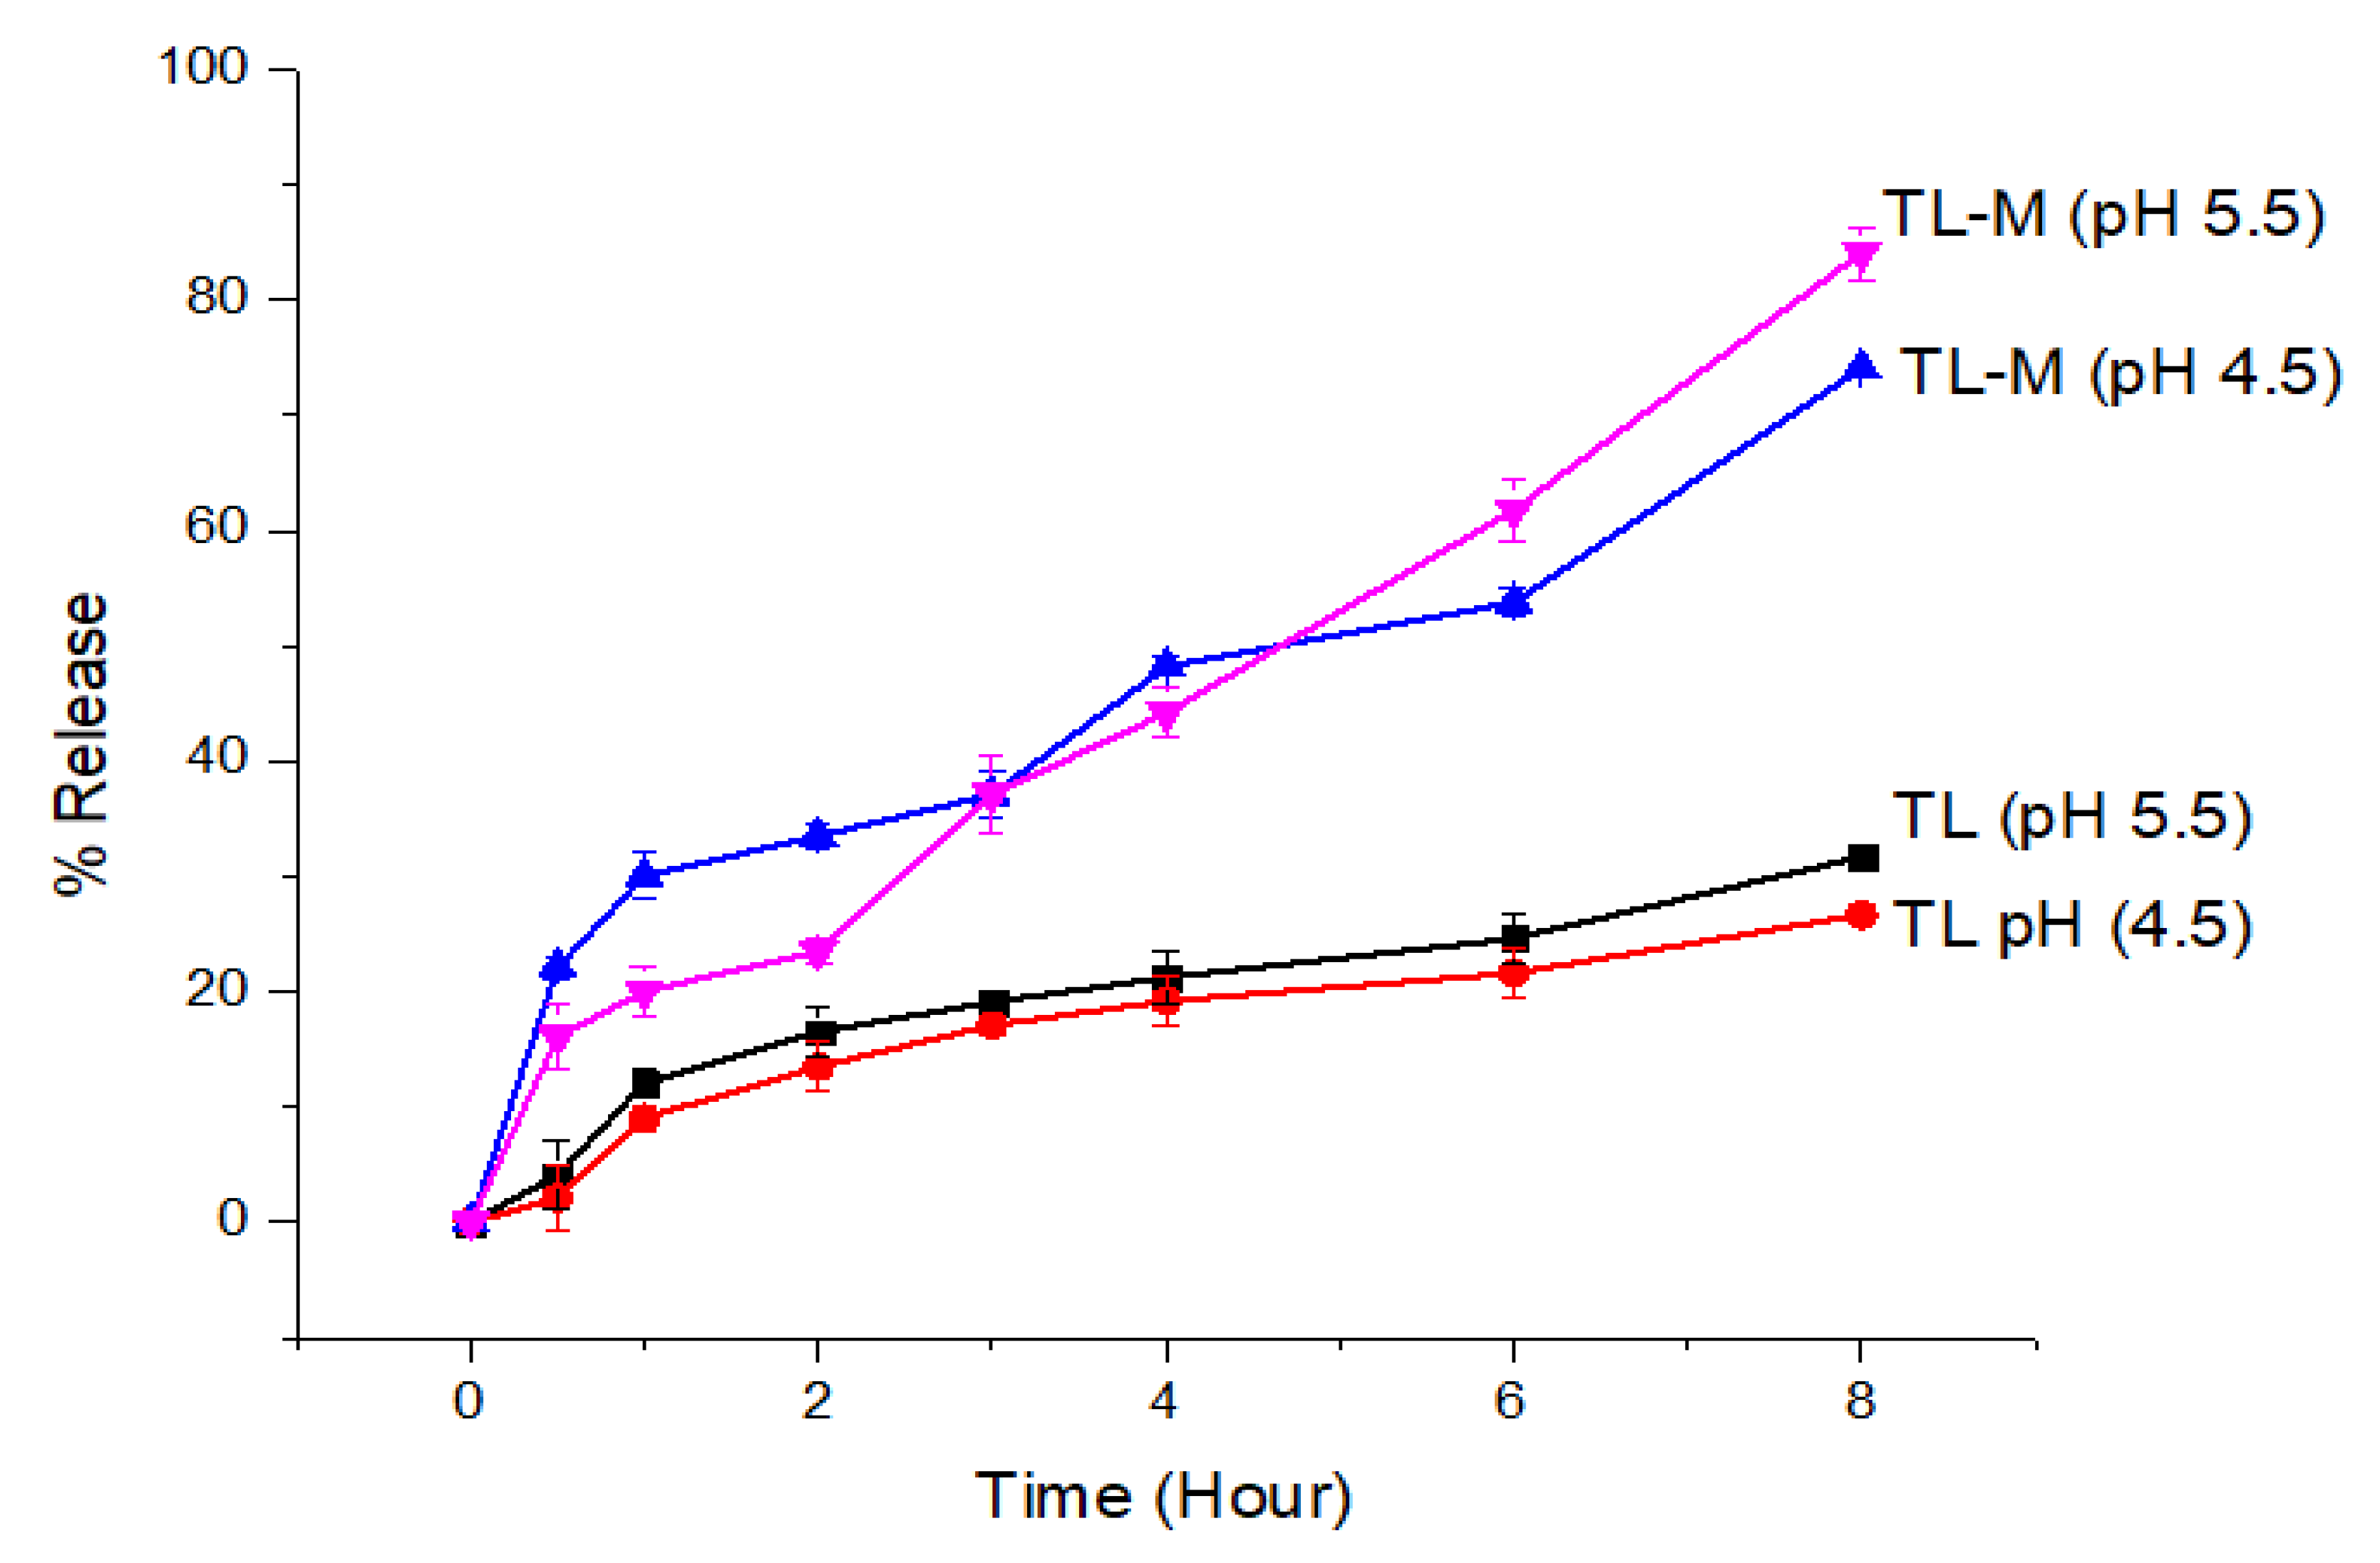
2.7. In Vitro Drug Release Study
2.8. Kinetic Modeling
2.9. Physical Appearance, Viscosity, Spreadability and pH Determination of TL-MG
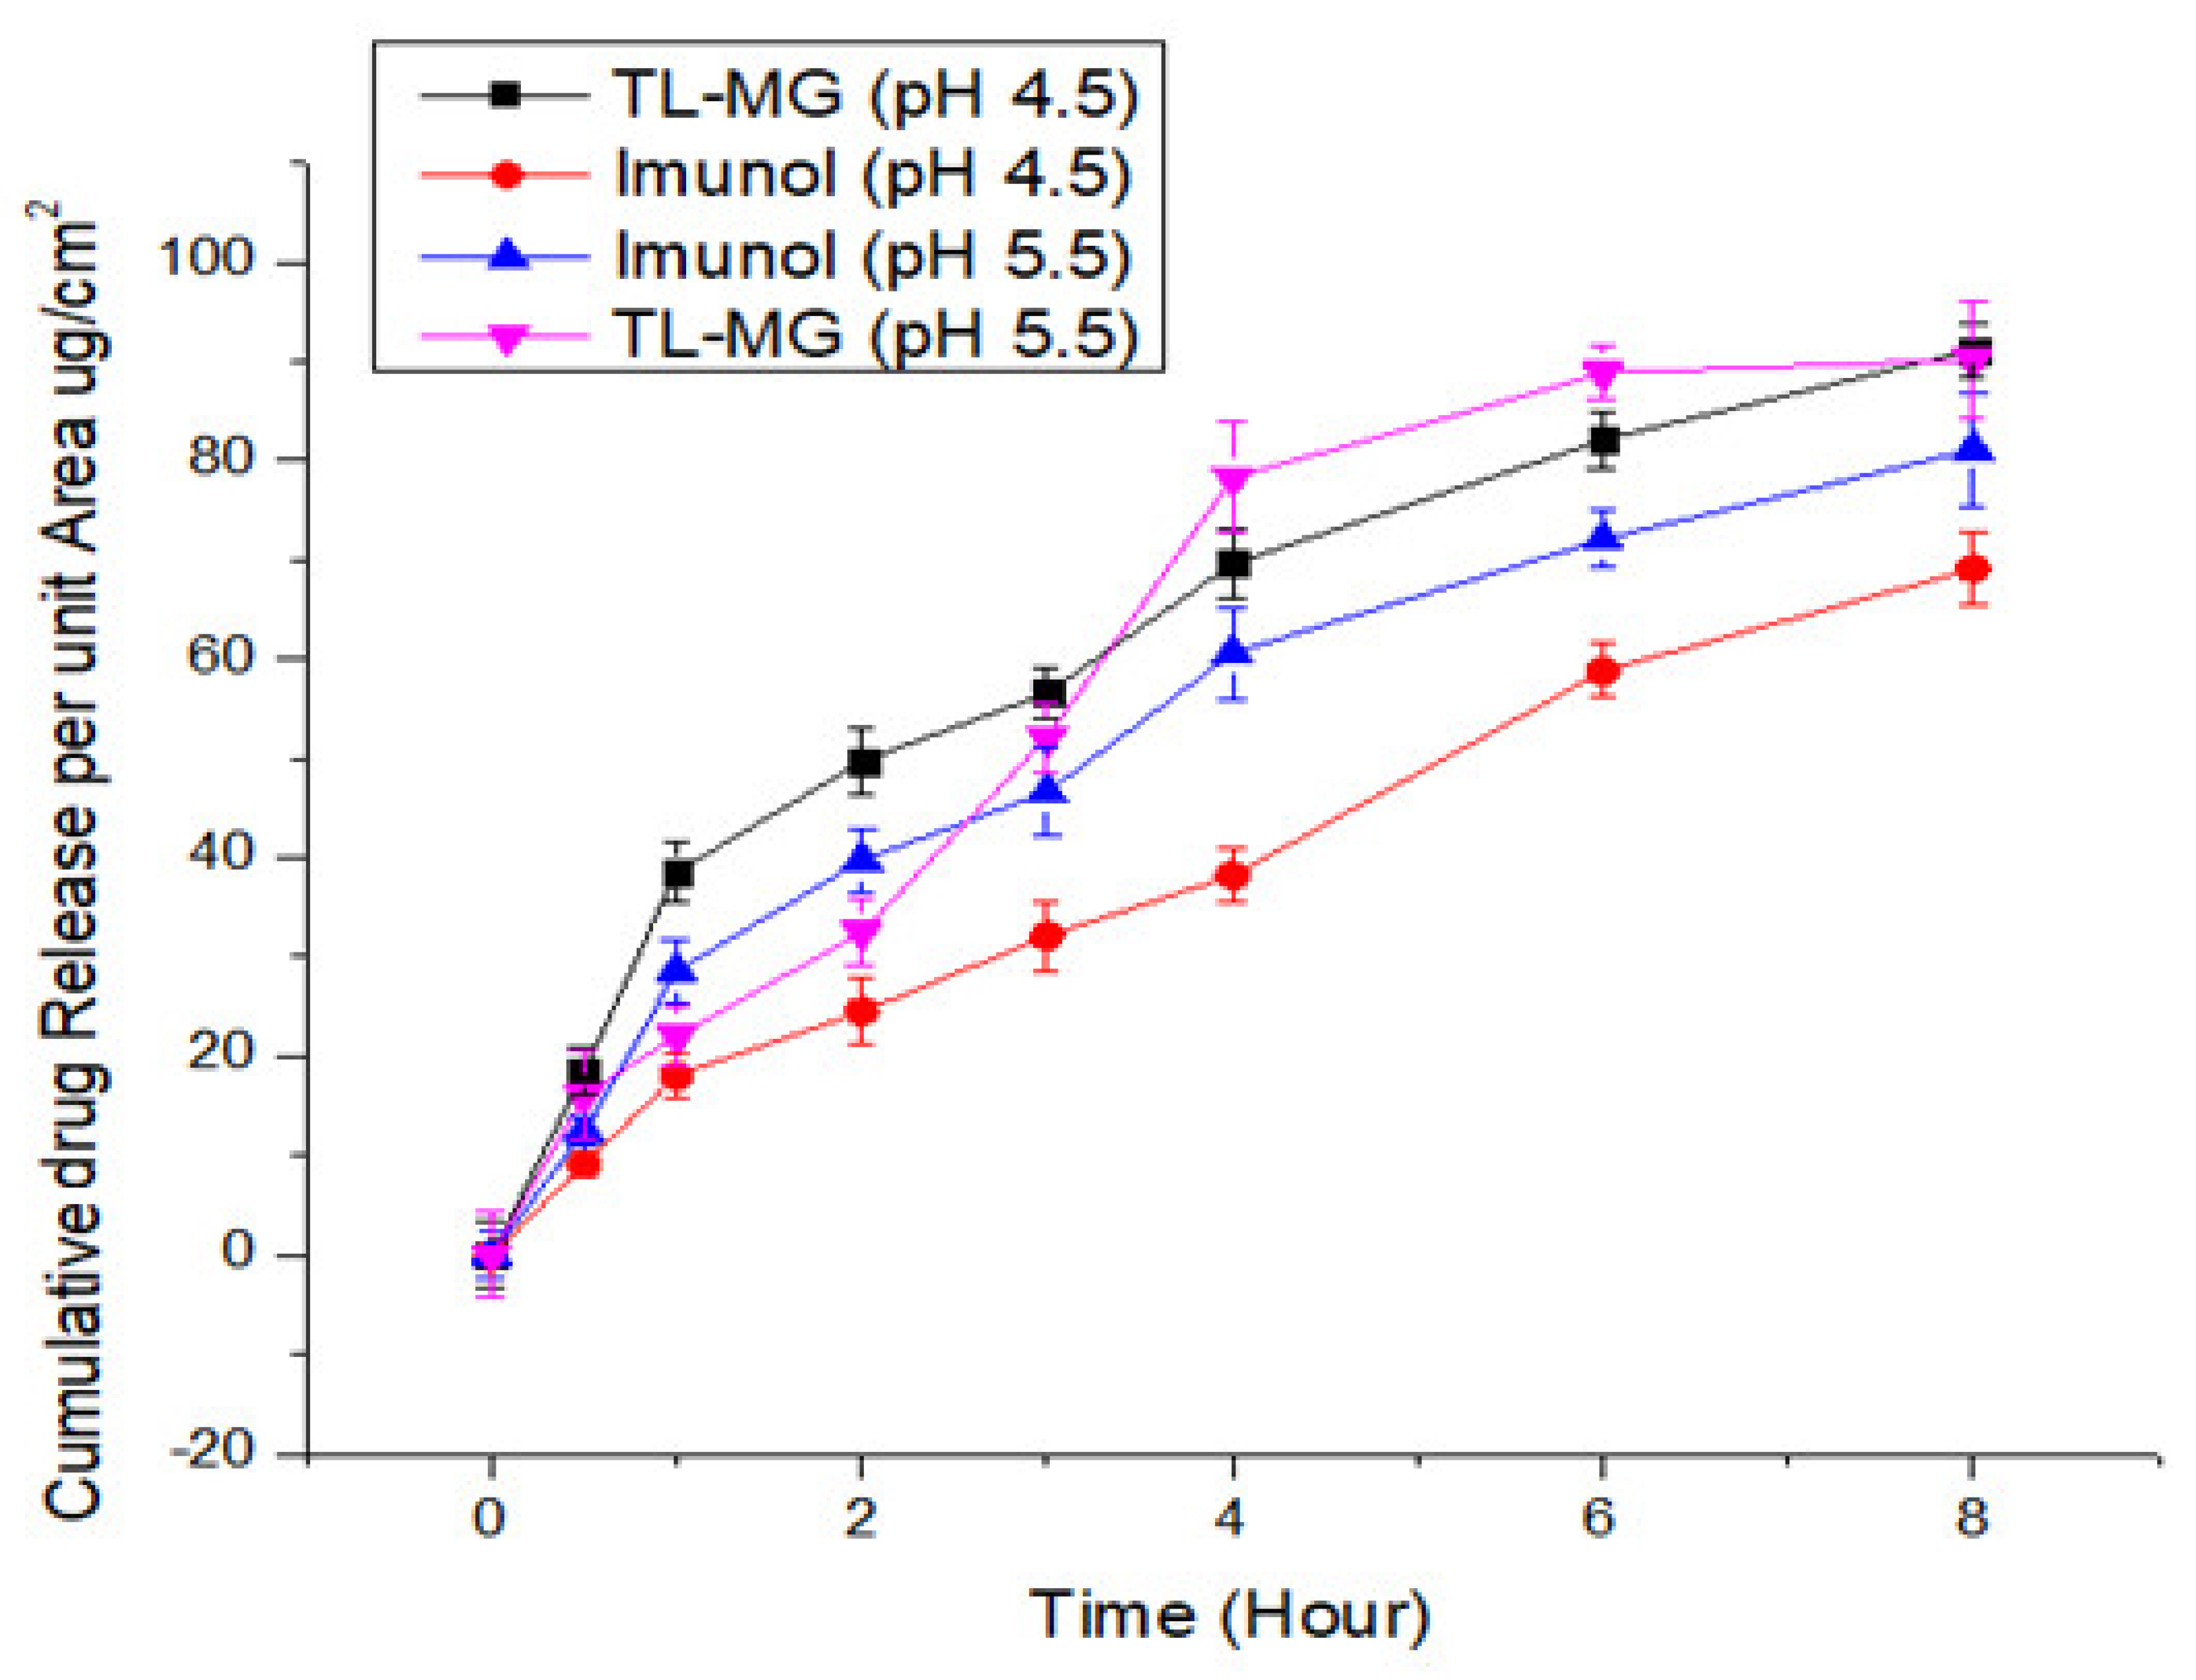
2.10. In Vitro Diffusion Studies of TL-MG
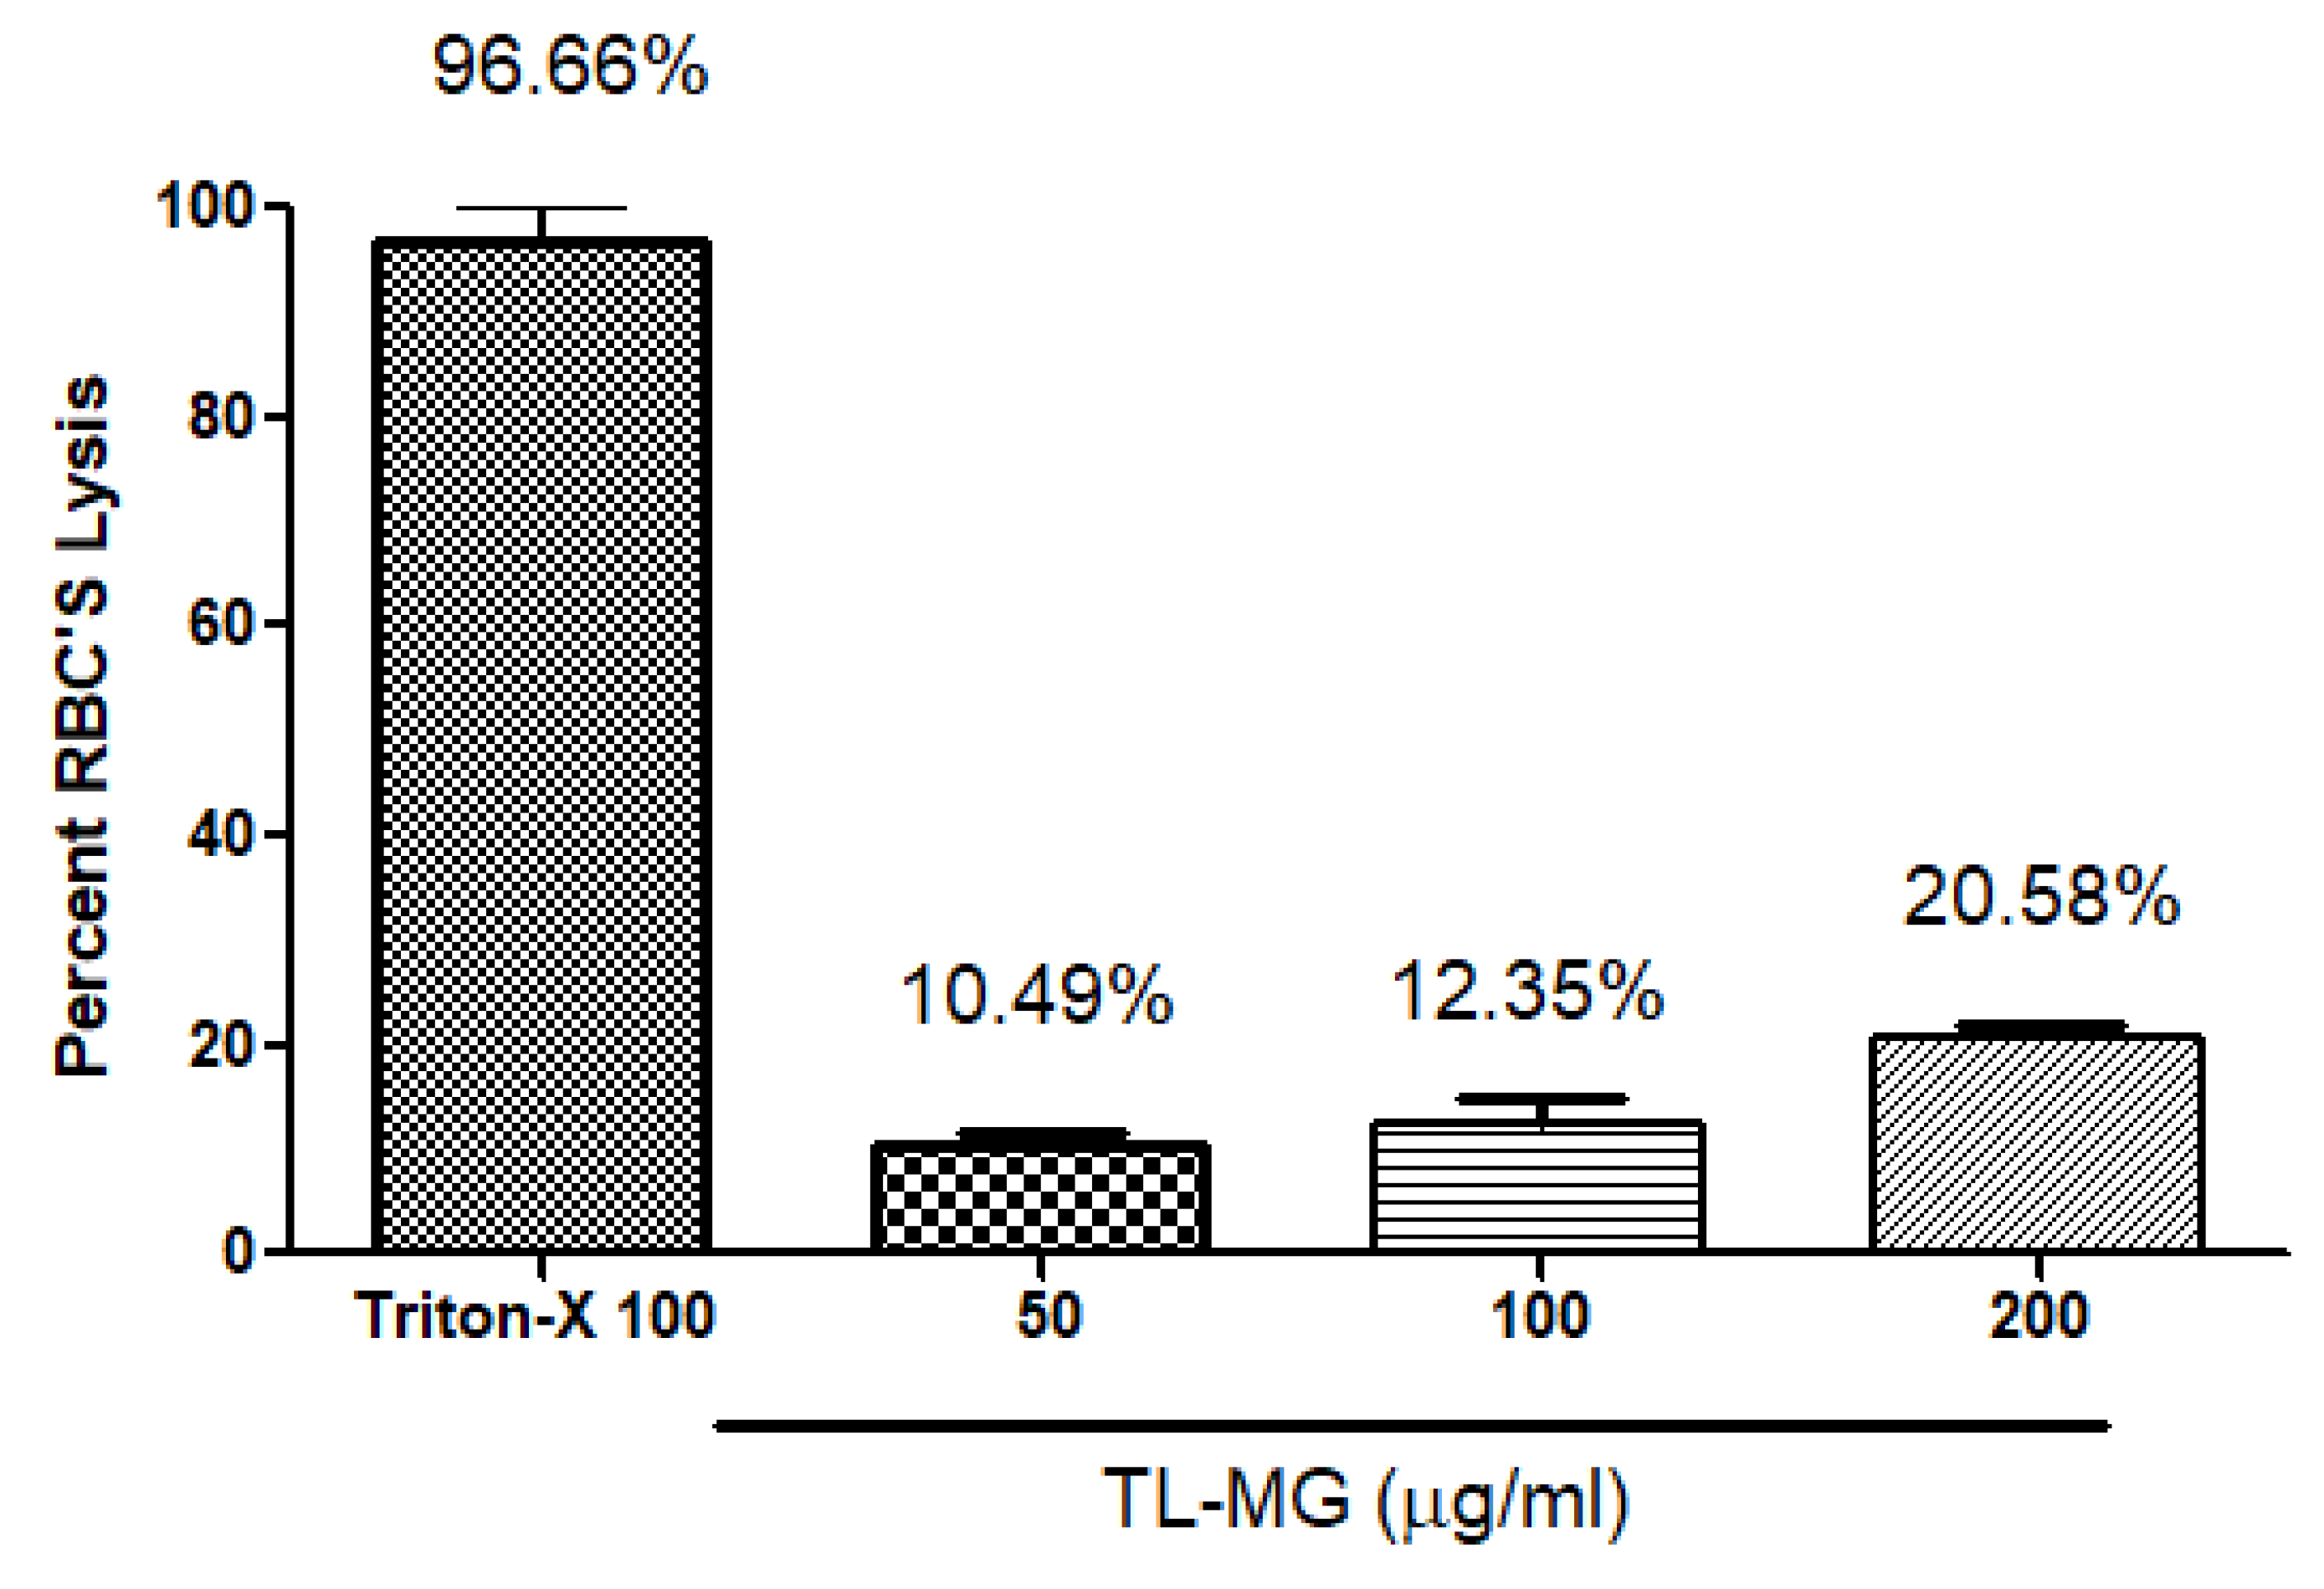
2.11. Hemolysis Investigations
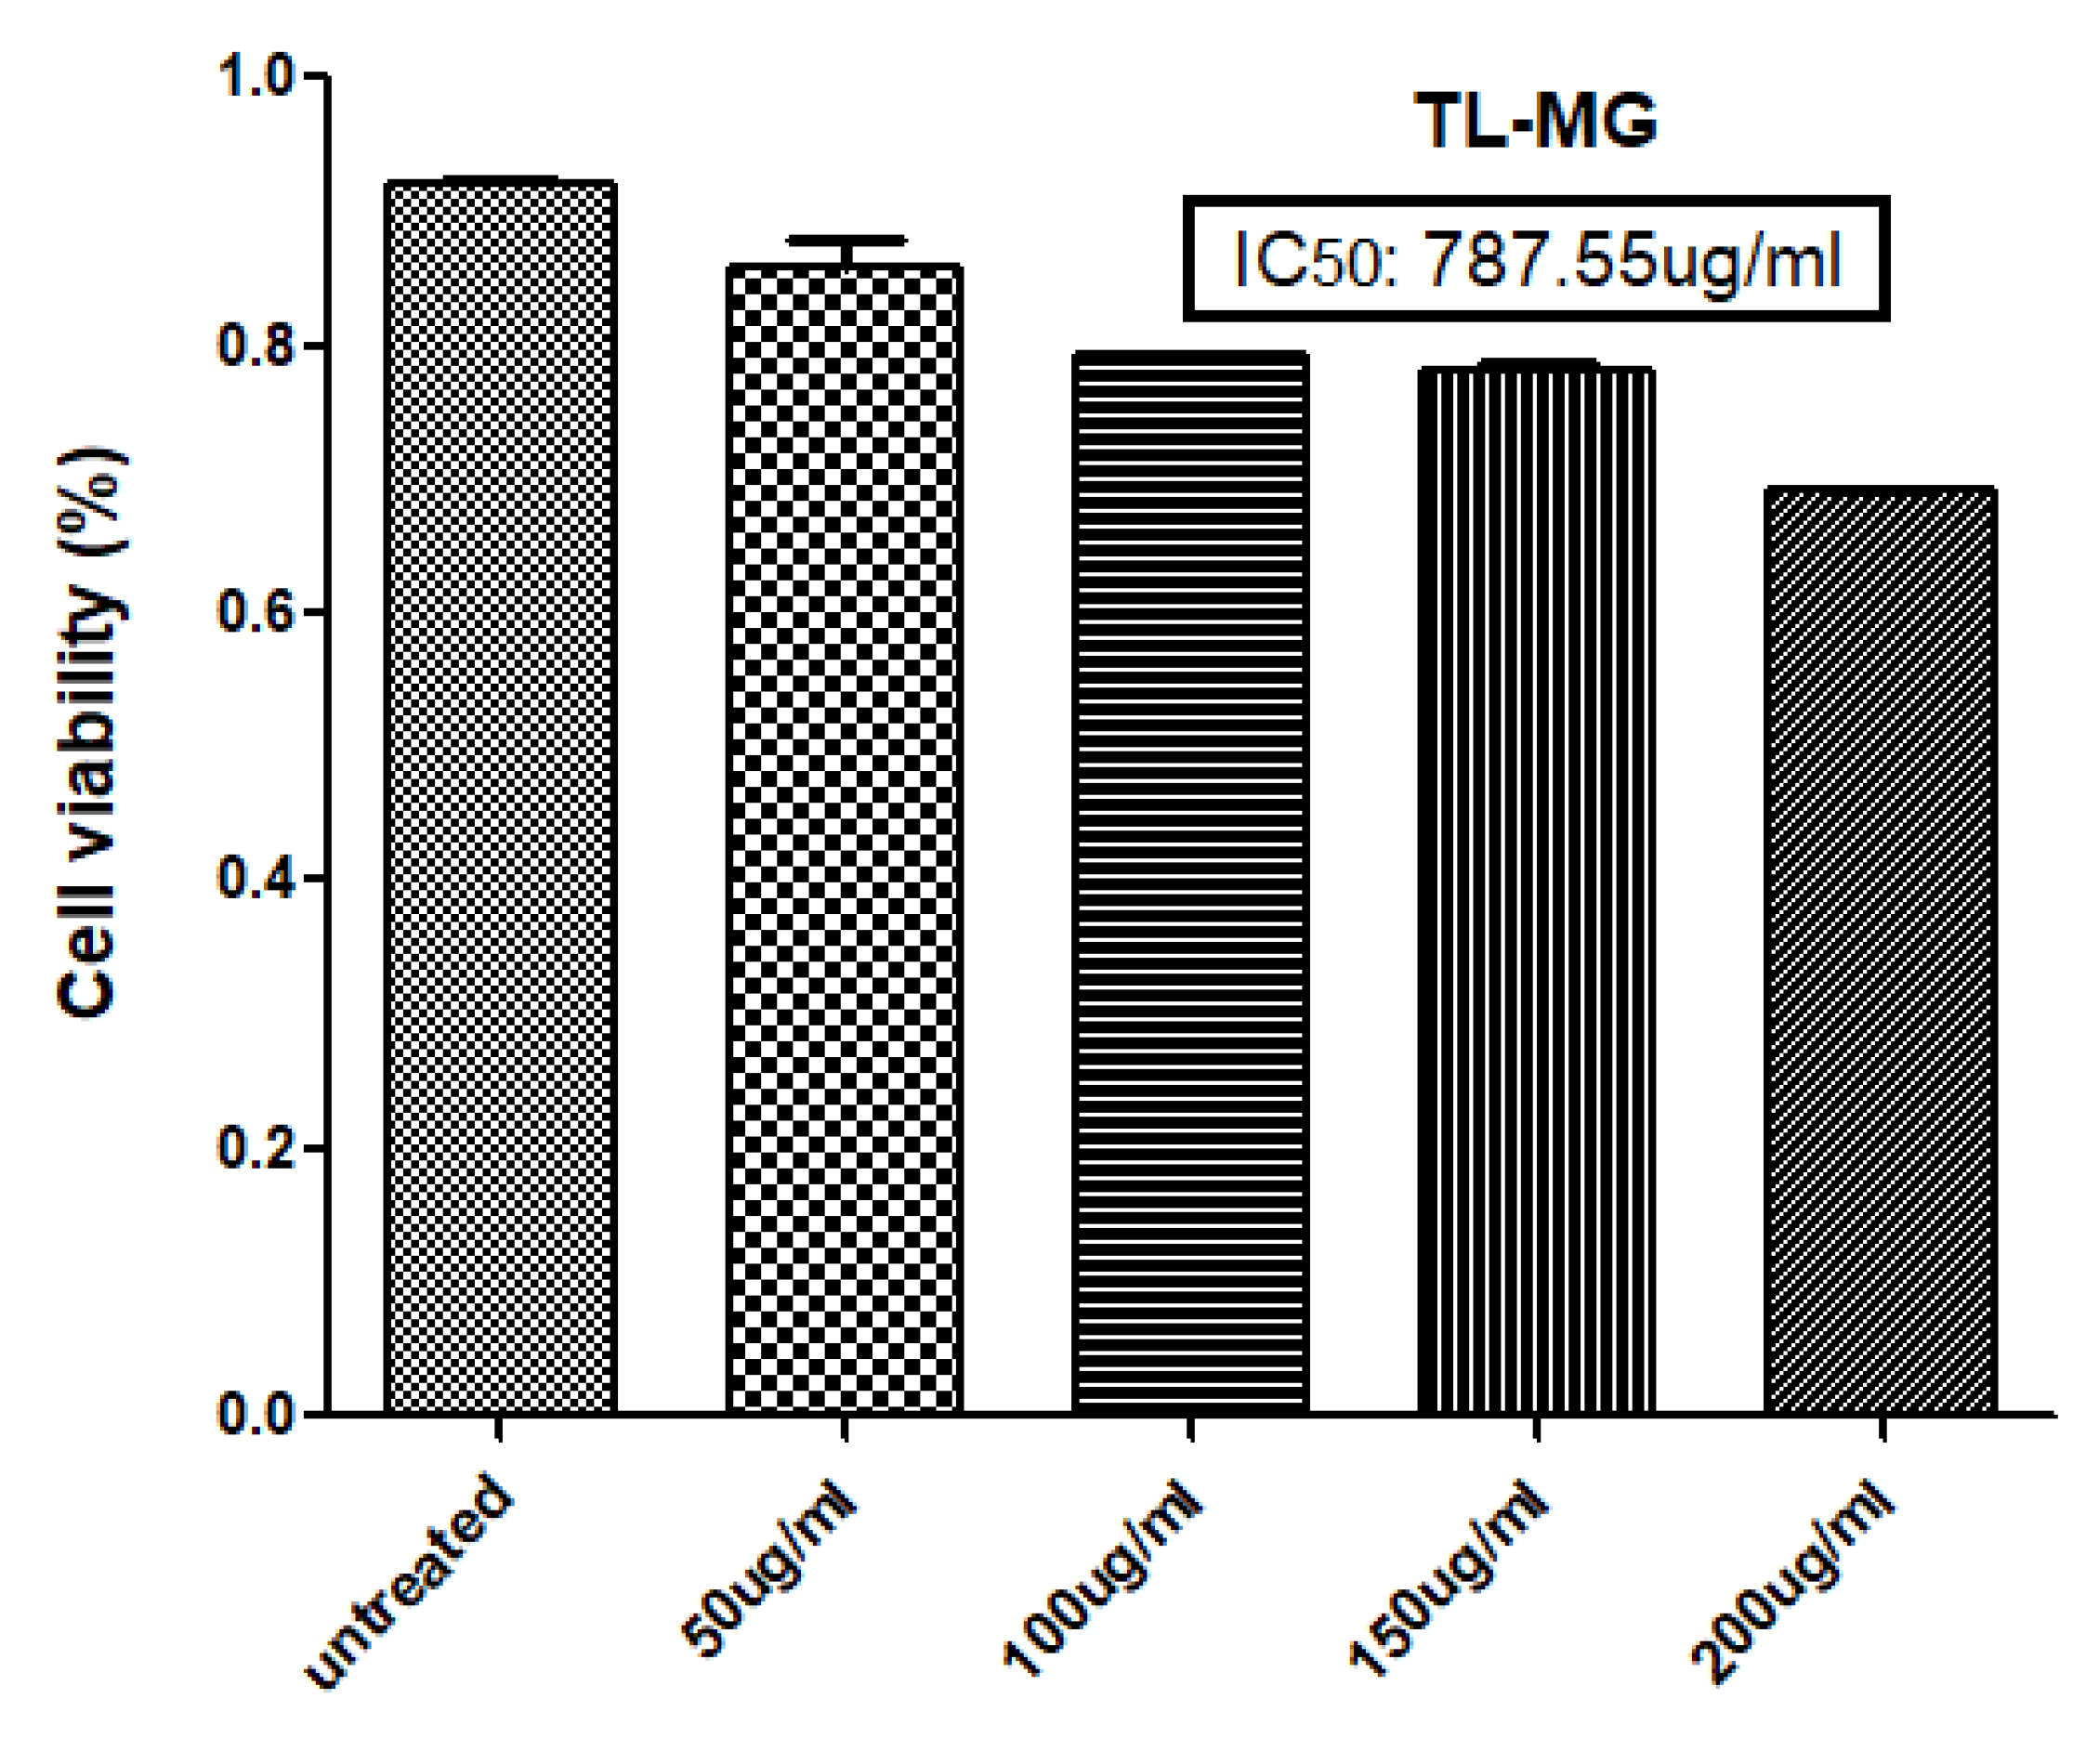
2.12. In Vitro Cell Viability Testing
2.13. Acute Toxicity Studies
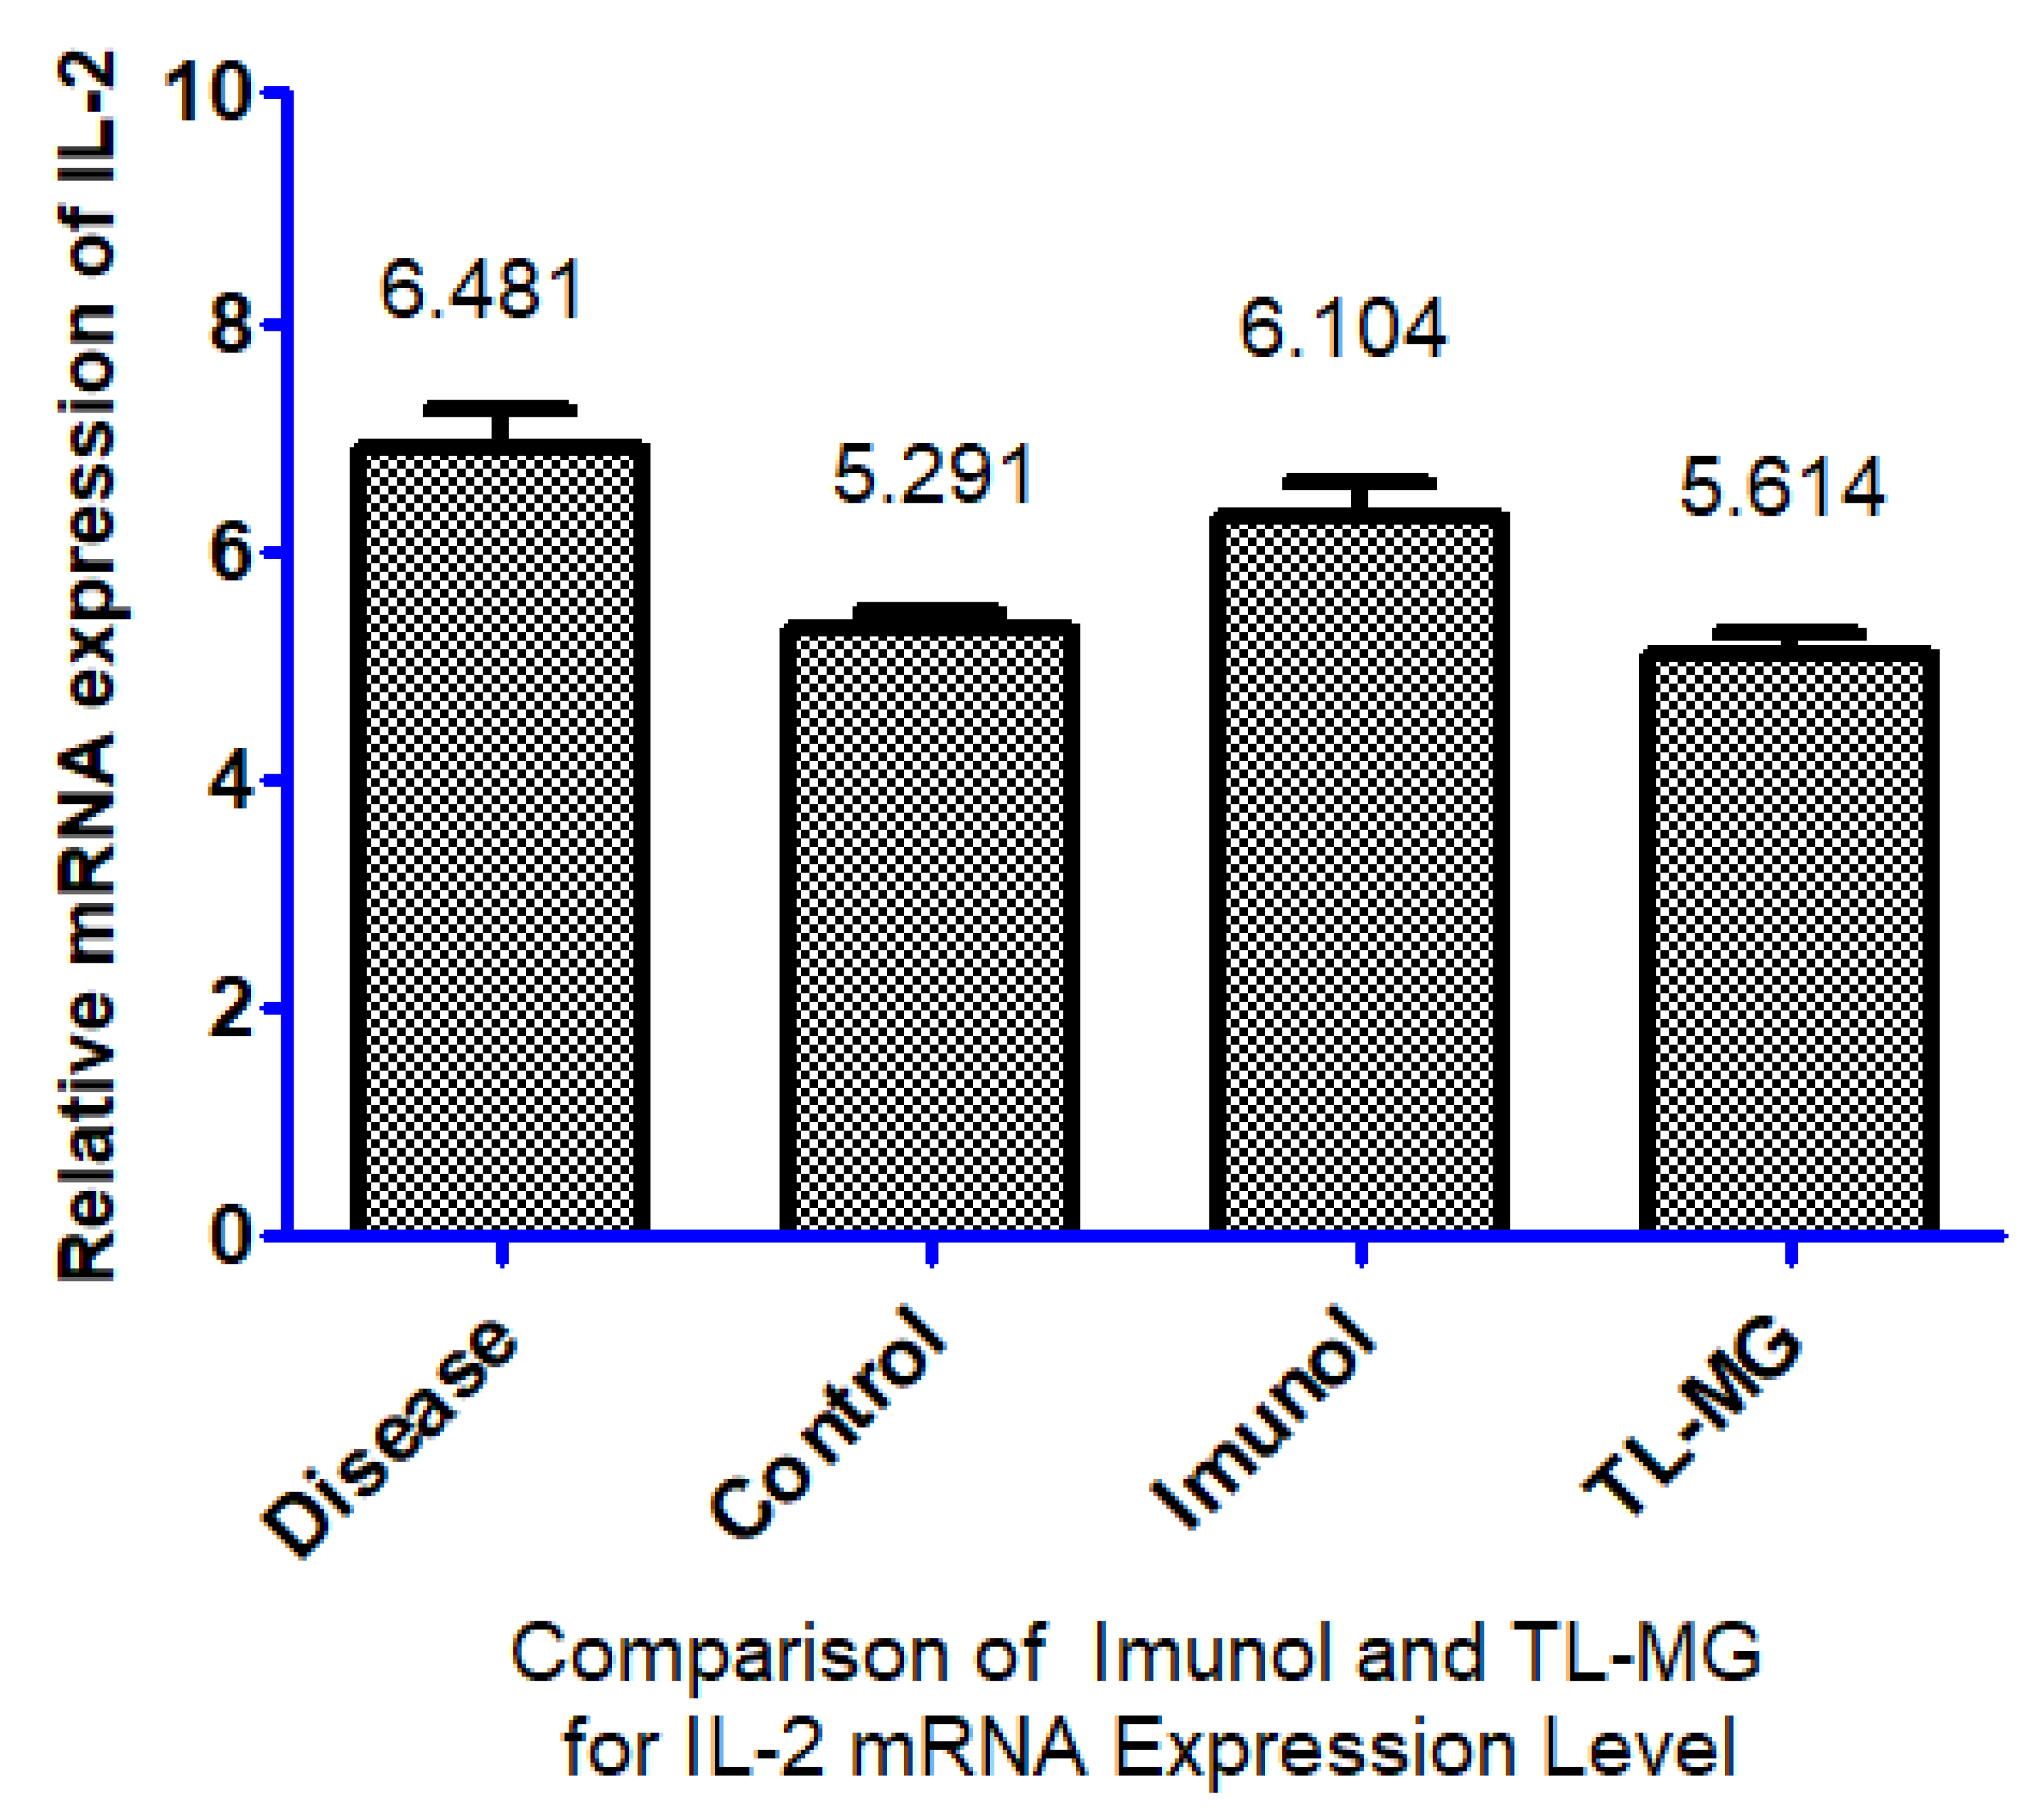
2.14. Effect of TL-MG on IL-2 mRNA Expression Levels
3. Conclusions
4. Materials and Methods
4.1. Materials
4.2. Fabrication of Microsponges
4.3. Characterization of Microsponges
4.3.1. Entrapment Efficiency and Yield
4.3.2. Photon Correlation Spectroscopy (PCS)
4.3.3. FTIR Spectroscopy
4.3.4. Differential Scanning Calorimetry (DSC) Study
4.3.5. Powder X-ray Diffraction (XRD)
4.3.6. Microscopic Study
4.3.7. Nitrogen Adsorption–Desorption Analysis
4.3.8. In Vitro Release Study
4.3.9. Kinetic Modeling
Zero Order
First-Order
Higuchi Model
Hixson Crowell Model
Korsmeyer-Peppas Model
4.3.10. Physical Appearance, Viscosity, Spreadability, and pH Determination of TL-MG
4.3.11. In Vitro Diffusion Studies of TL-MG
4.3.12. In Vitro Cell Viability Studies of TL-MG
4.3.13. Hemolytic Investigations of TL-MG
4.3.14. Acute Toxicity Studies of TL-MG
4.3.15. Determination of Proinflammatory Cytokine IL-2 mRNA Expression
Author Contributions
Funding
Institutional Review Board Statement
Informed Consent Statement
Data Availability Statement
Acknowledgments
Conflicts of Interest
References
- Jeong, W.Y.; Kwon, M.; Choi, H.E.; Kim, K.S. Recent advances in transdermal drug delivery systems: A review. Biomater. Res. 2021, 25, 1–15. [Google Scholar] [CrossRef] [PubMed]
- Roohnikan, M.; Laszlo, E.; Babity, S.; Brambilla, D. A snapshot of transdermal and topical drug delivery research in Canada. Pharmaceutics 2019, 11, 256. [Google Scholar] [CrossRef]
- Peña-Juárez, M.; Guadarrama-Escobar, O.R.; Escobar-Chávez, J.J. Transdermal delivery systems for biomolecules. J. Pharm. Innov. 2022, 17, 319–332. [Google Scholar] [CrossRef]
- Zaid Alkilani, A.; McCrudden, M.T.; Donnelly, R.F. Transdermal drug delivery: Innovative pharmaceutical developments based on disruption of the barrier properties of the stratum corneum. Pharmaceutics 2015, 7, 438–470. [Google Scholar] [CrossRef]
- Akhtar, N.; Singh, V.; Yusuf, M.; Khan, R.A. Non-invasive drug delivery technology: Development and current status of transdermal drug delivery devices, techniques and biomedical applications. Biomed. Eng./Biomed. Tech. 2020, 65, 243–272. [Google Scholar] [CrossRef] [PubMed]
- Oktay, S.; Alemdar, N. Electrically controlled release of 5-fluorouracil from conductive gelatin methacryloyl-based hydrogels. J. Appl. Polym. Sci. 2019, 136, 46914. [Google Scholar] [CrossRef]
- Shuvo, S.B.; Swapnil, S.I.; Alam, T.B.; Abid, R.; Ferdous, J. The Effects of Anatomical Positions on Transdermal Insulin Delivery Model using Microneedle Patch. Preprint, May 2021. [Google Scholar] [CrossRef]
- Biharee, A.; Bhartiya, S.; Yadav, A.; Thareja, S.; Jain, A.K. Microsponges as Drug Delivery System: Past, Present, and Future Perspectives. Curr. Pharm. Des. 2023, 29, 1026–1045. [Google Scholar] [CrossRef]
- Mahant, S.; Kumar, S.; Nanda, S.; Rao, R. Microsponges for dermatological applications: Perspectives and challenges. Asian J. Pharm. Sci. 2020, 15, 273–291. [Google Scholar] [CrossRef]
- Osmani, R.A.M.; Aloorkar, N.H.; Ingale, D.J.; Kulkarni, P.K.; Hani, U.; Bhosale, R.R.; Dev, D.J. Microsponges based novel drug delivery system for augmented arthritis therapy. Saudi Pharm. J. 2015, 23, 562–572. [Google Scholar] [CrossRef]
- Devi, N.; Kumar, S.; Prasad, M.; Rao, R. Eudragit RS100 based microsponges for dermal delivery of clobetasol propionate in psoriasis management. J. Drug Deliv. Sci. Technol. 2020, 55, 101347. [Google Scholar] [CrossRef]
- Pradhan, S.K. Microsponges as the versatile tool for drug delivery system. Int. J. Res. Pharm. Chem. 2011, 1, 243–258. [Google Scholar]
- Aloorkar, N.; Kulkarni, A.; Ingale, D.; Patil, R. Microsponges as innovative drug delivery systems. Int. J. Pharm. Sci. Nanotechnol. 2012, 5, 1597–1606. [Google Scholar]
- Kaity, S.; Maiti, S.; Ghosh, A.K.; Pal, D.; Ghosh, A.; Banerjee, S. Microsponges: A novel strategy for drug delivery system. J. Adv. Pharm. Technol. Res. 2010, 1, 283. [Google Scholar] [CrossRef]
- Junqueira, M.V.; Calçado, S.C.; de Castro-Hoshino, L.V.; Baesso, M.L.; Szarpak-Jankowska, A.; Auzely-Velty, R.; Bruschi, M.L. Influence of the ethanol/dichloromethane ratio on the preparation of microsponges composed of ethylcellulose and Eudragit or HPMCphthalate for hydrophilic drug delivery. J. Mol. Liq. 2020, 303, 112633. [Google Scholar] [CrossRef]
- Danaei, M.; Dehghankhold, M.; Ataei, S.; Hasanzadeh Davarani, F.; Javanmard, R.; Dokhani, A.; Khorasani, S.; Mozafari, M. Impact of particle size and polydispersity index on the clinical applications of lipidic nanocarrier systems. Pharmaceutics 2018, 10, 57. [Google Scholar] [CrossRef]
- Saha, I.; Palak, A.; Rai, V.K. Relevance of NLC-gel and microneedling-assisted tacrolimus ointment against severe psoriasiform: In vitro dermal retention kinetics, in vivo activity and drug distribution. J. Drug Deliv. Sci. Technol. 2022, 71, 103272. [Google Scholar] [CrossRef]
- Alam, M.; Rizwanullah, M.; Mir, S.R.; Amin, S. Statistically Optimized Tacrolimus and Thymoquinone Co-Loaded Nanostructured Lipid Carriers Gel for Improved Topical Treatment of Psoriasis. Gels 2023, 9, 515. [Google Scholar] [CrossRef]
- Rai, V.K.; Roy, A.; Sharma, A.; Rath, G.; Kar, B.; Ghosh, G.; Pradhan, D.; Halder, J. Development and Pharmaceutical Evaluation of Azelaic Acid and Vitamin E Oil-Based Nanoemulgel of Tacrolimus for Topical Application in Plaque Psoriasis. J. Pharm. Innov. 2023, 1–10. [Google Scholar] [CrossRef]
- Menezes, M.C.S.; Buzelin, M.; Nunes, C.B.; Alberti, L.R. Tacrolimus action pathways in an ointment base for hypertrophic scar prevention in a rabbit ear model. An. Bras. Dermatol. 2021, 96, 429–435. [Google Scholar] [CrossRef]
- Prajapati, M.; Eiriksson, F.F.; Loftsson, T. Stability characterization, kinetics and mechanism of tacrolimus degradation in cyclodextrin solutions. Int. J. Pharm. 2020, 586, 119579. [Google Scholar] [CrossRef]
- Guo, Y.m.; Abumiya, M.; Yamashita, T.; Ubukawa, K.; Takahashi, N. Pharmacokinetics of tacrolimus coadministered with letermovir in allogeneic hematopoietic stem cell transplantation patients. Clin. Pharmacol. Drug Dev. 2019, 8, 411–412. [Google Scholar] [CrossRef] [PubMed]
- Badhe, R.V.; Bijukumar, D.; Chejara, D.R.; Mabrouk, M.; Choonara, Y.E.; Kumar, P.; du Toit, L.C.; Kondiah, P.P.; Pillay, V. A composite chitosan-gelatin bi-layered, biomimetic macroporous scaffold for blood vessel tissue engineering. Carbohydr. Polym. 2017, 157, 1215–1225. [Google Scholar] [CrossRef] [PubMed]
- Alex, A.T.; Joseph, A.; Shavi, G.; Rao, J.V.; Udupa, N. Development and evaluation of carboplatin-loaded PCL nanoparticles for intranasal delivery. Drug Deliv. 2016, 23, 2144–2153. [Google Scholar] [CrossRef] [PubMed]
- Liu, Y.-D.; Zhang, Q.; Yu, X.-H.; Liu, J.-G.; Han, Y.-C. Increasing the content of β phase of poly (9, 9-dioctylfluorene) by synergistically controlling solution aggregation and extending film-forming time. Chin. J. Polym. Sci. 2019, 37, 664–673. [Google Scholar] [CrossRef]
- Hanif, S.; Sarfraz, R.M.; Syed, M.A.; Mahmood, A.; Minhas, M.U.; Irfan, M. Development and optimization of tibezonium iodide and lignocaine hydrochloride containing novel mucoadhesive buccal tablets: A pharmacokinetic investigation among healthy humans. Drug Dev. Ind. Pharm. 2021, 47, 1209–1222. [Google Scholar] [CrossRef]
- Hanif, S.; Sarfraz, R.M.; Syed, M.A.; Ali, S.; Iqbal, Z.; Shakir, R.; Iqbal, J. Formulation and evaluation of chitosan-based polymeric biodegradable mucoadhesive buccal delivery for locally acting drugs: In vitro, ex vivo and in vivo volunteers characterization. Lat. Am. J. Pharm. 2021, 40, 670–681. [Google Scholar]
- Zhu, H.-Y.; Tian, F.; Li, X.-H.; Qiu, H.-B.; Wang, J. Crystallization and phase behavior in block copolymer solution: An in situ small angle X-ray scattering study. Chin. J. Polym. Sci. 2019, 37, 1162–1168. [Google Scholar] [CrossRef]
- Khan, K.U.; Minhas, M.U.; Sohail, M.; Badshah, S.F.; Abdullah, O.; Khan, S.; Munir, A.; Suhail, M. Synthesis of PEG-4000-co-poly (AMPS) nanogels by cross-linking polymerization as highly responsive networks for enhancement in meloxicam solubility. Drug Dev. Ind. Pharm. 2021, 47, 465–476. [Google Scholar] [CrossRef]
- Brunella, V.; Jadhav, S.A.; Miletto, I.; Berlier, G.; Ugazio, E.; Sapino, S.; Scalarone, D. Hybrid drug carriers with temperature-controlled on–off release: A simple and reliable synthesis of PNIPAM-functionalized mesoporous silica nanoparticles. React. Funct. Polym. 2016, 98, 31–37. [Google Scholar] [CrossRef]
- Razzaq, S.; Syed, M.A.; Irfan, M.; Khan, I.; Sarfraz, R.M.; Shakir, R.; Ali, S.; Iqbal, Z.; Niaz, Y.; Mujtaba, S.H. Optimization of metronidazole SR buccal tablet for gingivitis using genetic algorithm. Pak. J. Pharm. Sci. 2021, 34, 2149–2158. [Google Scholar]
- Zhang, Y.; Huo, M.; Zhou, J.; Zou, A.; Li, W.; Yao, C.; Xie, S. DDSolver: An add-in program for modeling and comparison of drug dissolution profiles. AAPS J. 2010, 12, 263–271. [Google Scholar] [CrossRef] [PubMed]
- Barkat, K.; Ahmad, M.; Usman Minhas, M.; Khalid, I.; Nasir, B. Development and characterization of pH-responsive polyethylene glycol-co-poly (methacrylic acid) polymeric network system for colon target delivery of oxaliplatin: Its acute oral toxicity study. Adv. Polym. Technol. 2018, 37, 1806–1822. [Google Scholar] [CrossRef]
- Khalid, I.; Ahmad, M.; Minhas, M.U.; Barkat, K. Preparation and characterization of alginate-PVA-based semi-IPN: Controlled release pH-responsive composites. Polym. Bull. 2018, 75, 1075–1099. [Google Scholar] [CrossRef]
- Barkat, K.; Ahmad, M.; Minhas, M.U.; Khalid, I. Oxaliplatin-loaded crosslinked polymeric network of chondroitin sulfate-co-poly (methacrylic acid) for colorectal cancer: Its toxicological evaluation. J. Appl. Polym. Sci. 2017, 134, 45312. [Google Scholar] [CrossRef]
- Khalid, I.; Ahmad, M.; Usman Minhas, M.; Barkat, K.; Sohail, M. Cross-Linked Sodium Alginate-g-Poly (Acrylic Acid) Structure: A Potential Hydrogel Network for Controlled Delivery of Loxoprofen Sodium. Adv. Polym. Technol. 2018, 37, 985–995. [Google Scholar] [CrossRef]
- Dash, S.; Murthy, P.N.; Nath, L.; Chowdhury, P. Kinetic modeling on drug release from controlled drug delivery systems. Acta Pol. Pharm. 2010, 67, 217–223. [Google Scholar]
- Hindustan Abdul, A.; Golla Bala, A.; Chintaginjala, H.; Manchikanti, S.P.; Kamsali, A.; Dasari, R.R. Equator Assessment of Nanoparticles Using the Design- Expert Software. Int. J. Pharm. Sci. Nanotechnol. 2019, 13, 4766–4772. [Google Scholar] [CrossRef]
- Mosmann, T. Rapid colorimetric assay for cellular growth and survival: Application to proliferation and cytotoxicity assays. J. Immunol. Methods 1983, 65, 55–63. [Google Scholar] [CrossRef]
- Patel, S.; Gheewala, N.; Suthar, A.; Shah, A. In-vitro cytotoxicity activity of Solanum nigrum extract against Hela cell line and Vero cell line. Int. J. Pharm. Pharm. Sci. 2009, 1, 38–46. [Google Scholar]
- Assadi, Z.; Emtiazi, G.; Zarrabi, A. Novel synergistic activities of tetracycline copper oxide nanoparticles integrated into chitosan micro particles for delivery against multiple drug resistant strains: Generation of reactive oxygen species (ROS) and cell death. J. Drug Deliv. Sci. Technol. 2018, 44, 65–70. [Google Scholar] [CrossRef]
- Erum, A.; Bashir, S.; Saghir, S.; Tulain, U.R.; Saleem, U.; Nasir, M.; Kanwal, F.; Hayat Malik, M.N. Acute toxicity studies of a novel excipient arabinoxylan isolated from Ispaghula (Plantago ovata) husk. Drug Chem. Toxicol. 2015, 38, 300–305. [Google Scholar] [CrossRef] [PubMed]
- Mehmood, Y.; Shahid, H.; Tariq, A.; Ali, S.O. Efficacy and safety of a new mometasone furoate nasal spray formulation in patients with acute rhinosinusitis: A randomized clinical trial. Ital. J. Med. 2022, 16, 10–14. [Google Scholar] [CrossRef]
- Mehmood, Y.; Khan, I.U.; Shahzad, Y.; Khan, R.U.; Khalid, S.H.; Yousaf, A.M.; Hussain, T.; Asghar, S.; Khalid, I.; Asif, M. Amino-decorated mesoporous silica nanoparticles for controlled sofosbuvir delivery. Eur. J. Pharm. Sci. 2020, 143, 105184. [Google Scholar] [CrossRef]
- Mehmood, Y.; Khan, I.U.; Shahzad, Y.; Khan, R.U.; Iqbal, M.S.; Khan, H.A.; Khalid, I.; Yousaf, A.M.; Khalid, S.H.; Asghar, S. In-vitro and in-vivo evaluation of velpatasvir-loaded mesoporous silica scaffolds. A prospective carrier for drug bioavailability enhancement. Pharmaceutics 2020, 12, 307. [Google Scholar] [CrossRef] [PubMed]
- Ghumman, S.A.; Bashir, S.; Noreen, S.; Khan, A.M.; Riffat, S.; Abbas, M. Polymeric microspheres of okra mucilage and alginate for the controlled release of oxcarbazepine: In vitro & in vivo evaluation. Int. J. Biol. Macromol. 2018, 111, 1156–1165. [Google Scholar] [PubMed]
- He, W.; Hu, X.; Jiang, W.; Liu, R.; Zhang, D.; Zhang, J.; Li, Z.; Luan, Y. Rational design of a new self-codelivery system from redox-sensitive camptothecin–cytarabine conjugate assembly for effectively synergistic anticancer therapy. Adv. Healthc. Mater. 2017, 6, 1700829. [Google Scholar] [CrossRef]
- Sharma, P.; Dube, B.; Sawant, K. Synthesis of cytarabine lipid drug conjugate for treatment of meningeal leukemia: Development, characterization and in vitro cell line studies. J. Biomed. Nanotechnol. 2012, 8, 928–937. [Google Scholar] [CrossRef]
- Mansur, H.S.; Oréfice, R.L.; Mansur, A.A. Characterization of poly (vinyl alcohol)/poly (ethylene glycol) hydrogels and PVA-derived hybrids by small-angle X-ray scattering and FTIR spectroscopy. Polymer 2004, 45, 7193–7202. [Google Scholar] [CrossRef]
- de Alvarenga Pinto Cotrim, M.; Mottin, A.C.; Ayres, E. Preparation and characterization of okra mucilage (Abelmoschus esculentus) edible films. In Macromolecular Symposia; Wiley Online Library: Hoboken, NJ, USA, 2016. [Google Scholar]
- Liu, L.; Li, J.; Zhao, M.-H.; Xu, H.; Li, L.-S.; Wang, S.-N. Loading of tacrolimus containing lipid based drug delivery systems into mesoporous silica for extended release. Asian J. Pharm. Sci. 2016, 11, 751–759. [Google Scholar] [CrossRef][Green Version]
- Tiwari, A.; Mishra, M.K.; Shukla, A.; Yadav, S.K. Microsponge: An augmented drug delivery system. Am. J. PharmTech Res. 2016, 6, 80–95. [Google Scholar]
- Li, Y.; Liu, Y.; Ma, R.; Xu, Y.; Zhang, Y.; Li, B.; An, Y.; Shi, L. A G-quadruplex hydrogel via multicomponent self-assembly: Formation and zero-order controlled release. ACS Appl. Mater. Interfaces 2017, 9, 13056–13067. [Google Scholar] [CrossRef] [PubMed]
- Xu, W.; Ling, P.; Zhang, T. Toward immunosuppressive effects on liver transplantation in rat model: Tacrolimus loaded poly (ethylene glycol)-poly (D, L-lactide) nanoparticle with longer survival time. Int. J. Pharm. 2014, 460, 173–180. [Google Scholar] [CrossRef] [PubMed]
- He, Y.; Majid, K.; Maqbool, M.; Hussain, T.; Yousaf, A.M.; Khan, I.U.; Mehmood, Y.; Aleem, A.; Arshad, M.S.; Younus, A. Formulation and characterization of lornoxicam-loaded cellulosic-microsponge gel for possible applications in arthritis. Saudi Pharm. J. 2020, 28, 994–1003. [Google Scholar] [CrossRef]
- Treenate, P.; Monvisade, P. In vitro drug release profiles of pH-sensitive hydroxyethylacryl chitosan/sodium alginate hydrogels using paracetamol as a soluble model drug. Int. J. Biol. Macromol. 2017, 99, 71–78. [Google Scholar] [CrossRef]
- Opatha, S.A.T.; Titapiwatanakun, V.; Boonpisutiinant, K.; Chutoprapat, R. Preparation, Characterization and Permeation Study of Topical Gel Loaded with Transfersomes Containing Asiatic Acid. Molecules 2022, 27, 4865. [Google Scholar] [CrossRef] [PubMed]
- Omar, M.M.; Hasan, O.A.; El Sisi, A.M. Preparation and optimization of lidocaine transferosomal gel containing permeation enhancers: A promising approach for enhancement of skin permeation. Int. J. Nanomed. 2019, 14, 1551. [Google Scholar] [CrossRef] [PubMed]
- Badshah, S.F.; Akhtar, N.; Minhas, M.U.; Khan, K.U.; Khan, S.; Abdullah, O.; Naeem, A. Porous and highly responsive cross-linked β-cyclodextrin based nanomatrices for improvement in drug dissolution and absorption. Life Sci. 2021, 267, 118931. [Google Scholar] [CrossRef]


| Models | Fitted Equation * | R2 |
|---|---|---|
| Zero order | Q = 4.2863t + 4.5843 | 0.9429 |
| First order | Q = −0.1209t + 0.0813 | 0.8091 |
| Higuchi | Q = 26.783t1/2 − 23.2163 | 0.8931 |
| Korsmeyer-Peppas | Q = 7.3821t0.85 − 2.0263 | 0.9650 |
| Hixson Crowell | (1 − Q)1/3 = 0.03819t + 0.9107 | 0.8732 |
| Formulation | Clarity | pH | Homogeneity | Viscosity (Cpi) |
|---|---|---|---|---|
| TL-MG | Clear | 5.5 | Good | 8712 |
| Commercial product | Clear | 6.1 | Good | 5235 |
| Parameters | Group 1 | Group 2 | Group 3 |
|---|---|---|---|
| (TL-MG) | (Control) | (Imunol) | |
| Hb (10–15) g/dL | 11.8 ± 0.98 | 12.2 ± 0.78 | 12.3 ± 1.21 |
| WBCs × 109/L | 6.2 ± 0.45 | 5.2 ± 0.98 | 6.5 ± 0.24 |
| RBCs × 106/mm3 | 5.42 ± 0.42 | 5.76 ± 0.78 | 5.99 ± 1.11 |
| Platelets × 109/L | 248 ± 8.90 | 286 ± 8.90 | 272 ± 9.35 |
| Monocytes (%) | 03 ± 0.05 | 07 ± 0.78 | 09 ± 0.78 |
| Neutrophils (%) | 40 ± 2.98 | 40 ± 1.26 | 56 ± 1.26 |
| Lymphocytes (%) | 52 ± 7.39 | 50 ± 2.90 | 60 ± 2.78 |
| Eosinophils | 02 ± 0.021 | 03 ± 0.06 | 02 ± 0.04 |
| Blood sugar random mg/dL | 71 ± 0.85 | 52 ± 3.89 | 72 ± 2.89 |
| Uric Acid (Serum)mg/dL | 8.4 ± 0.34 | 5.96 ± 1.08 | 7.9 ± 1.21 |
| Ingredients | Quantities |
|---|---|
| TL (mg) | 50 |
| Poloxamer (mg) | 100 |
| PVA (mg) | 100 |
| Tween 60 (mL) | 5 |
| Triethanolamine (mL) | Q.S |
| Ethanol (mL) | 10 |
| Carbopol (g) | 1 |
| Distilled water (mL) | 100 |
Disclaimer/Publisher’s Note: The statements, opinions and data contained in all publications are solely those of the individual author(s) and contributor(s) and not of MDPI and/or the editor(s). MDPI and/or the editor(s) disclaim responsibility for any injury to people or property resulting from any ideas, methods, instructions or products referred to in the content. |
© 2023 by the authors. Licensee MDPI, Basel, Switzerland. This article is an open access article distributed under the terms and conditions of the Creative Commons Attribution (CC BY) license (https://creativecommons.org/licenses/by/4.0/).
Share and Cite
Mehmood, Y.; Shahid, H.; ul Huq, U.I.; Rafeeq, H.; Khalid, H.M.B.; Uddin, M.N.; Kazi, M. Microsponge-Based Gel Loaded with Immunosuppressant as a Simple and Valuable Strategy for Psoriasis Therapy: Determination of Pro-Inflammatory Response through Cytokine IL-2 mRNA Expression. Gels 2023, 9, 871. https://doi.org/10.3390/gels9110871
Mehmood Y, Shahid H, ul Huq UI, Rafeeq H, Khalid HMB, Uddin MN, Kazi M. Microsponge-Based Gel Loaded with Immunosuppressant as a Simple and Valuable Strategy for Psoriasis Therapy: Determination of Pro-Inflammatory Response through Cytokine IL-2 mRNA Expression. Gels. 2023; 9(11):871. https://doi.org/10.3390/gels9110871
Chicago/Turabian StyleMehmood, Yasir, Hira Shahid, Umar Inzamam ul Huq, Hamza Rafeeq, Hafiz Muhammad Bilal Khalid, Mohammad N. Uddin, and Mohsin Kazi. 2023. "Microsponge-Based Gel Loaded with Immunosuppressant as a Simple and Valuable Strategy for Psoriasis Therapy: Determination of Pro-Inflammatory Response through Cytokine IL-2 mRNA Expression" Gels 9, no. 11: 871. https://doi.org/10.3390/gels9110871
APA StyleMehmood, Y., Shahid, H., ul Huq, U. I., Rafeeq, H., Khalid, H. M. B., Uddin, M. N., & Kazi, M. (2023). Microsponge-Based Gel Loaded with Immunosuppressant as a Simple and Valuable Strategy for Psoriasis Therapy: Determination of Pro-Inflammatory Response through Cytokine IL-2 mRNA Expression. Gels, 9(11), 871. https://doi.org/10.3390/gels9110871