
Swelling and Antimicrobial Activity Characterization of a GO-Reinforced Gelatin—Whey Hydrogel

 ,
,  ,
, 
 ,
,  and
and
Abstract
1. Introduction
2. Results and Discussion
2.1. Swelling Behavior
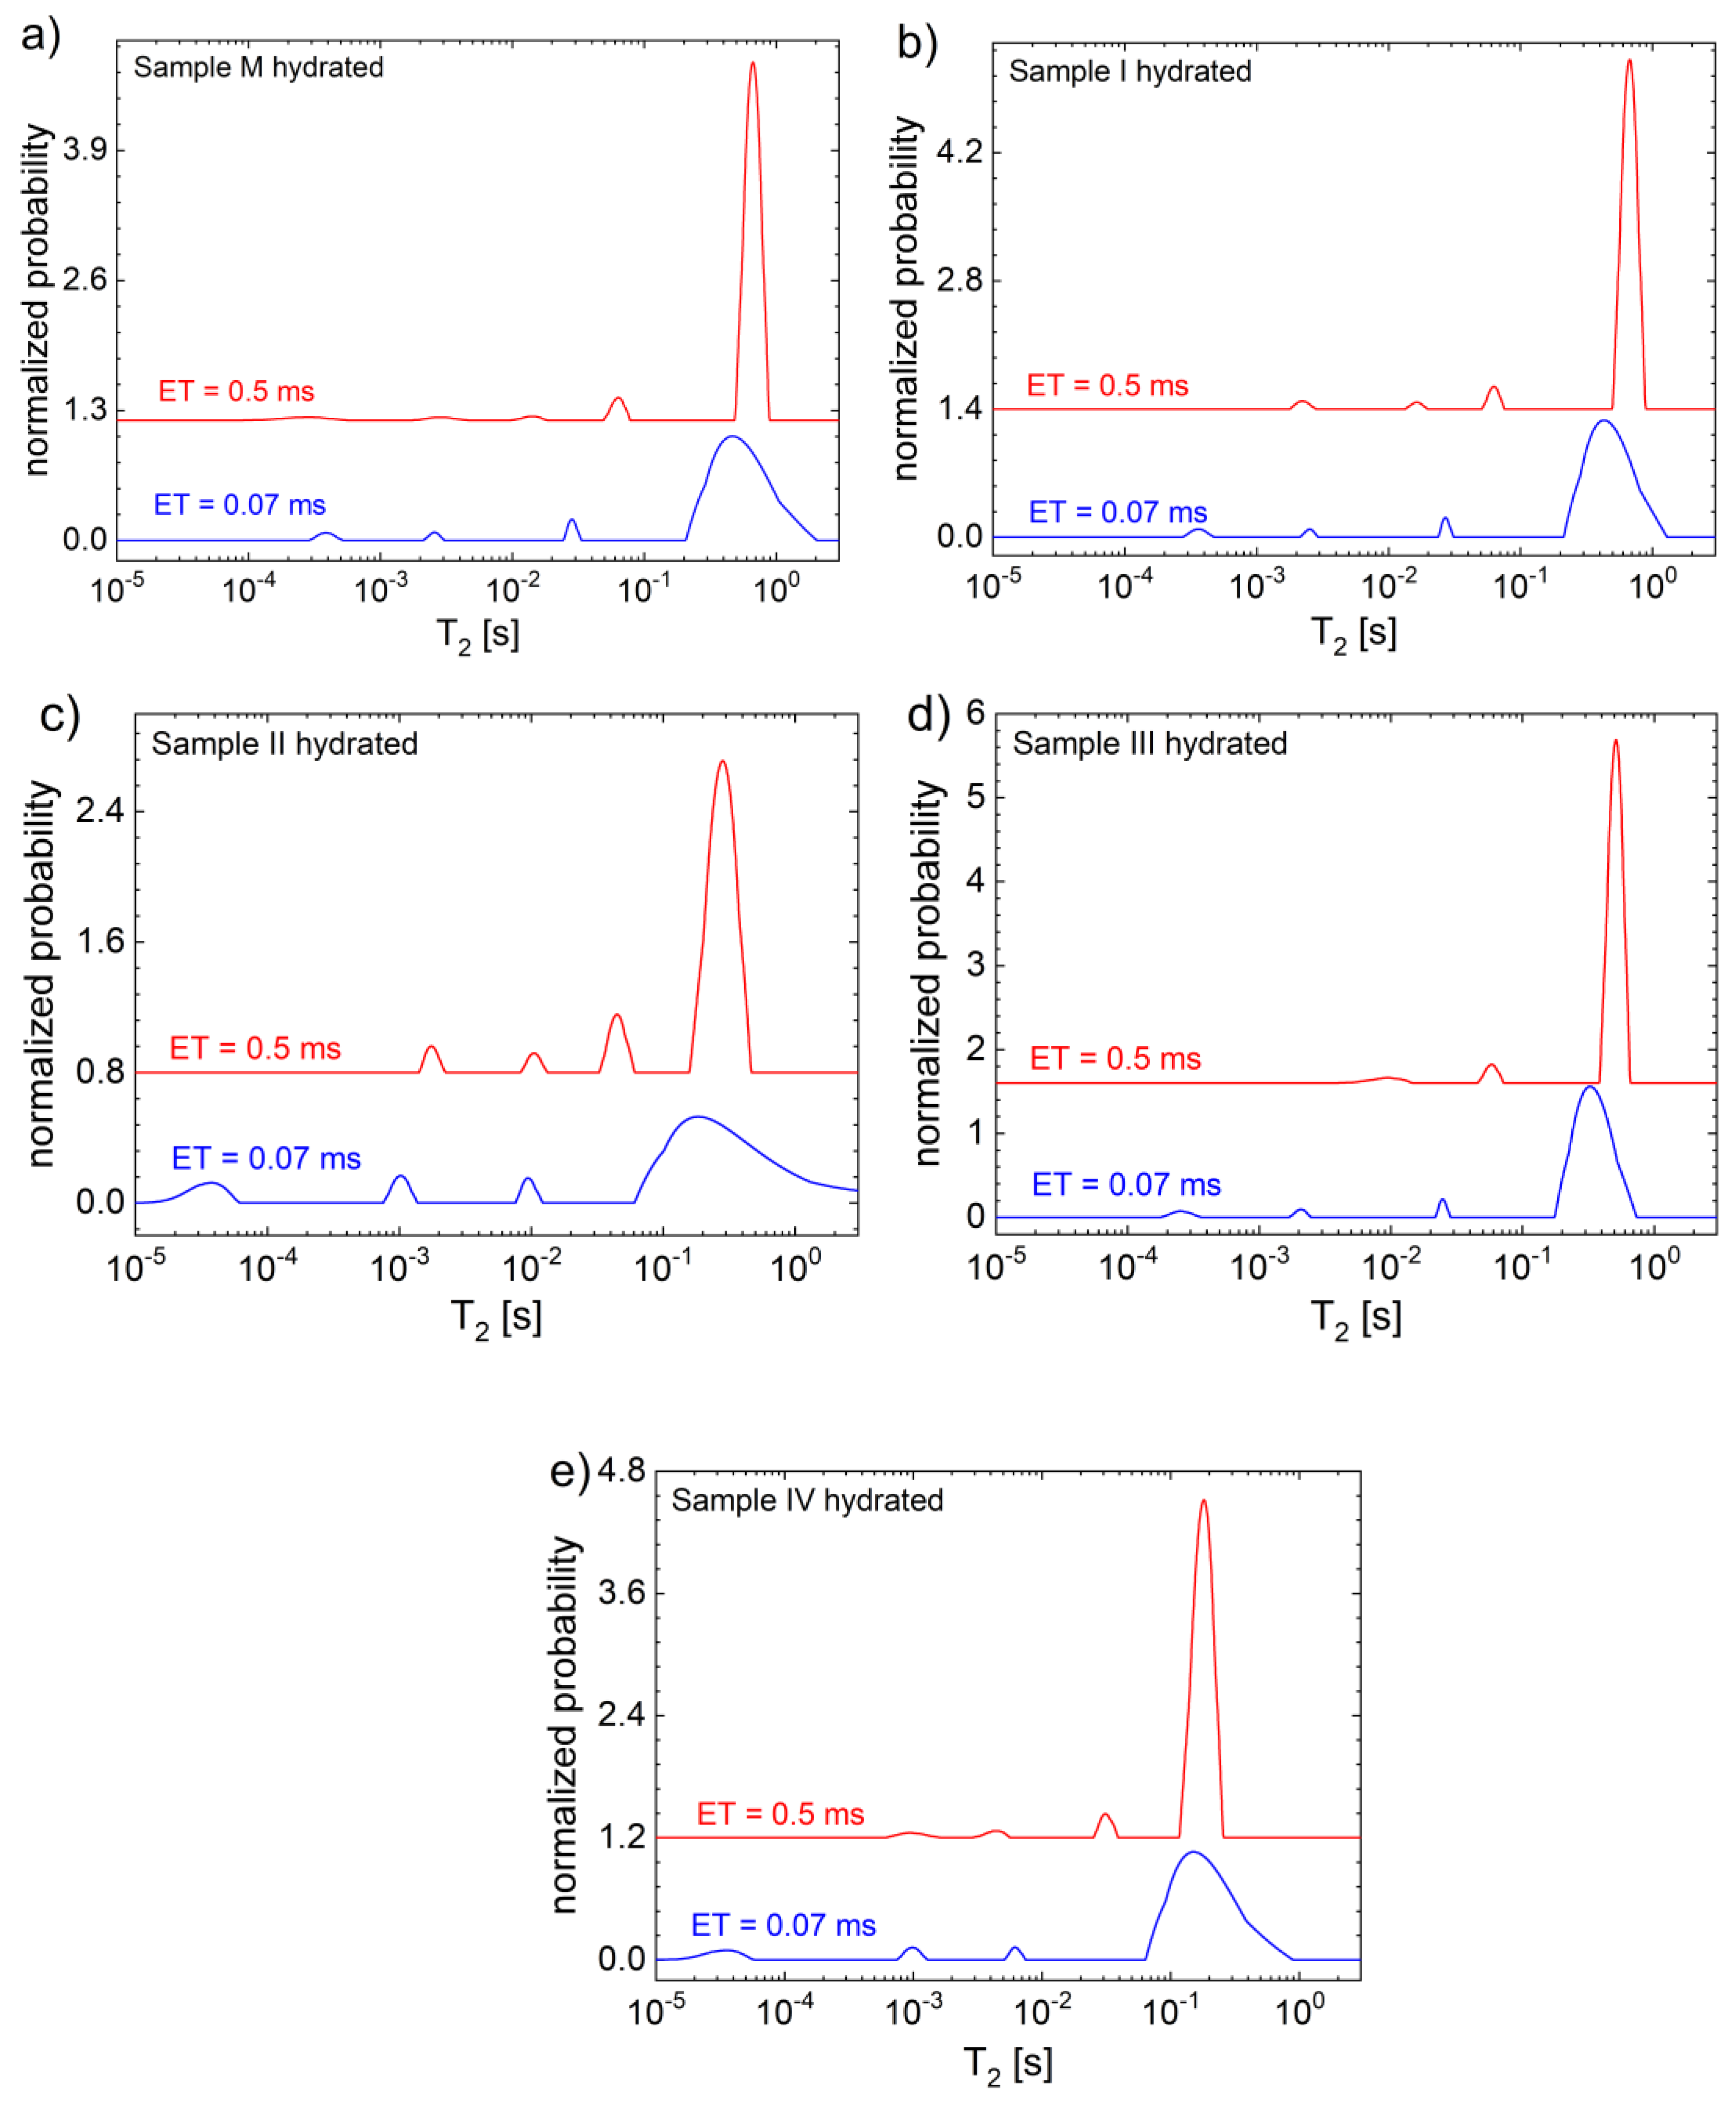
2.2. H NMR Relaxometry
2.3. Antimicrobial Activity
3. Conclusions
4. Materials and Methods
4.1. Materials
4.2. Hydrogel Preparation
4.3. Swelling Kinetics
4.4. H NMR Relaxometry
4.5. Antimicrobial Activity
Author Contributions
Funding
Institutional Review Board Statement
Informed Consent Statement
Data Availability Statement
Acknowledgments
Conflicts of Interest
References
- Roy, S.; Rhim, J.-W. Gelatin-Based Film Integrated with Copper Sulfide Nanoparticles for Active Packaging Applications. Appl. Sci. 2021, 11, 6307. [Google Scholar] [CrossRef]
- Manikandan, N.A.; Pakshirajan, K.; Pugazhenthi, G. Preparation and characterization of environmentally safe and highly biodegradable microbial polyhydroxybutyrate (PHB) based graphene nanocomposites for potential food packaging applications. Int. J. Biol. Macromol. 2020, 154, 866–877. [Google Scholar] [CrossRef] [PubMed]
- Abdalkarim, S.Y.H.; Chen, L.-M.; Yu, H.-Y.; Li, F.; Chen, X.; Zhou, Y.; Tam, K.C. Versatile nanocellulose-based nanohybrids: A promising-new class for active packaging applications. Int. J. Biol. Macromol. 2021, 182, 1915–1930. [Google Scholar] [CrossRef] [PubMed]
- Rossa, V.; Ferreira, L.E.M.; Vasconcelos, S.d.C.; Shimabukuro, E.T.T.; Madriaga, V.G.d.C.; Paula Carvalho, A.; Pergher, S.B.C.; da Silva, F.d.C.; Francisco Ferreira, V.; Junior, C.A.C.; et al. Nanocomposites based on the graphene family for food packaging: Historical perspective, preparation methods, and properties. RSC Adv. 2022, 12, 14084–14111. [Google Scholar] [CrossRef]
- Trusek, A.; Dworakowska, D.; Czyzewska, K. 3D enzymatic preparations with graphene oxide flakes and hydrogel to obtain lactose-free products. Food Bioprod. Process. 2020, 121, 224–229. [Google Scholar] [CrossRef]
- Mostafavi, F.S.; Zaeim, D. 2020 Agar-based edible films for food packaging applications-A review. Int. J. Biol. Macromol. 2020, 159, 1165–1176. [Google Scholar] [CrossRef]
- Al-Tayyar, N.A.; Youssef, A.M.; Al-Hindi, R. Antimicrobial food packaging based on sustainable Bio-based materials for reducing foodborne Pathogens: A review. Food Chem. 2020, 310, 125915. [Google Scholar] [CrossRef]
- de Carvalho, A.P.A.; Junior, C.A.C. Green strategies for active food packagings: A systematic review on active properties of graphene-based nanomaterials and biodegradable polymers. Trends Food Sci. Technol. 2020, 103, 130–143. [Google Scholar] [CrossRef]
- Han, L.F.; Tan, C.P.; Zawawi, R.M.; Nur Hanani, Z.A. Effect of sonication time and heat treatment on the structural and physical properties of chitosan/graphene oxide nanocomposite films. Food Packag. Shelf Life 2021, 28, 100663. [Google Scholar] [CrossRef]
- Arfat, Y.A.; Ahmed, J.; Ejaz, M.; Mullah, M. Polylactide/graphene oxide nanosheets/clove essential oil composite films for potential food packaging applications. Int. J. Biol. Macromol. 2018, 107, 194–203. [Google Scholar] [CrossRef]
- Barbolina, I.; Woods, C.R.; Lozano, N.; Kostarelos, K.; Novoselov, K.S.; Roberts, I.S. Purity of graphene oxide determines its antibacterial activity. 2D Mater. 2016, 3, 025025. [Google Scholar] [CrossRef]
- Asghar, A.; Nazir, A.; Maan, A.; Abdullah, A. Chapter 13—Food gels: Gelling process and new applications. In Advances in Food Rheology and Its Applications, 2nd ed.; Ahmed, J., Basu, S., Eds.; Woodhead Publishing: Sawston, UK, 2023; pp. 365–384. [Google Scholar]
- Agarwal, P.; Tripathy, D.B.; Gupta, A.; Kuanr, B.K. Polymeric Biomaterials: Fabrication, Properties and Applications; CRC Press: Boca Raton, FL, USA, 2023. [Google Scholar]
- Zinoviadou, K.G.; Koutsoumanis, K.P.; Biliaderis, C.G. Physical and thermo-mechanical properties of whey protein isolate films containing antimicrobials, and their effect against spoilage flora of fresh beef. Food Hydrocoll. 2010, 24, 49–59. [Google Scholar] [CrossRef]
- Min, S.; Harris, L.J.; Krochta, J.M. Antimicrobial effects of lactoferrin, lysozyme, and the lactoperoxidase system and edible whey protein films incorporating the lactoperoxidase system against Salmonella enterica and Escherichia coli O157: H7. J. Food Sci. 2005, 70, m332–m338. [Google Scholar] [CrossRef]
- Suppakul, P.; Miltz, J.; Sonneveld, K.; Bigger, S.W. Active packaging technologies with an emphasis on antimicrobial packaging and its applications. J. Food Sci. 2003, 68, 408–420. [Google Scholar] [CrossRef]
- Yildirim, S.; Röcker, B.; Pettersen, M.K.; Nilsen-Nygaard, J.; Ayhan, Z.; Rutkaite, R.; Radusin, T.; Suminska, P.; Marcos, B.; Coma, V. Active packaging applications for food. Compr. Rev. Food Sci. Food Saf. 2018, 17, 165–199. [Google Scholar] [CrossRef]
- Ramos, O.L.; Pereira, R.N.; Rodrigues, R.; Teixeira, J.A.; Vicente, A.A.; Malcata, F.X. Physical effects upon whey protein aggregation for nano-coating production. Food Res. Int. 2014, 66, 344–355. [Google Scholar] [CrossRef]
- Janjarasskul, T.; Tananuwong, K.; Krochta, J.M. Whey Protein Film with Oxygen Scavenging Function by Incorporation of Ascorbic Acid. J. Food Sci. 2011, 76, E561–E568. [Google Scholar] [CrossRef]
- Alizadeh Sani, M.; Ehsani, A.; Hashemi, M. Whey protein isolate/cellulose nanofibre/TiO2 nanoparticle/rosemary essential oil nanocomposite film: Its effect on microbial and sensory quality of lamb meat and growth of common foodborne pathogenic bacteria during refrigeration. Int. J. Food Microbiol. 2017, 251, 8–14. [Google Scholar] [CrossRef]
- Karimi, N.; Alizadeh, A.; Almasi, H.; Hanifian, S. Preparation and characterization of whey protein isolate/polydextrose-based nanocomposite film incorporated with cellulose nanofiber and L. plantarum: A new probiotic active packaging system. LWT 2020, 121, 108978. [Google Scholar] [CrossRef]
- Sooch, B.S.; Mann, M.K. Nanoreinforced biodegradable gelatin based active food packaging film for the enhancement of shelf life of tomatoes (Solanum lycopersicum L.). Food Control 2021, 130, 108322. [Google Scholar] [CrossRef]
- Purcea Lopes, P.M.; Moldovan, D.; Moldovan, M.; Carpa, R.; Saroşi, C.; Păşcuţă, P.; Mazilu Moldovan, A.; Fechete, R.; Popescu, V. New Composite Hydrogel Based on Whey and Gelatin Crosslinked with Copper Sulphate. Materials 2022, 15, 2611. [Google Scholar] [CrossRef] [PubMed]
- Asdagh, A.; Karimi Sani, I.; Pirsa, S.; Amiri, S.; Shariatifar, N.; Eghbaljoo-Gharehgheshlaghi, H.; Shabahang, Z.; Taniyan, A. Production and Characterization of Nanocomposite Film Based on Whey Protein Isolated/Copper Oxide Nanoparticles Containing Coconut Essential Oil and Paprika Extract. J. Polym. Environ. 2021, 29, 335–349. [Google Scholar] [CrossRef]
- Azevedo, V.M.; Dias, M.V.; de Siqueira Elias, H.H.; Fukushima, K.L.; Silva, E.K.; de Deus Souza Carneiro, J.; de Fátima Ferreira Soares, N.; Borges, S.V. Effect of whey protein isolate films incorporated with montmorillonite and citric acid on the preservation of fresh-cut apples. Food Res. Int. 2018, 107, 306–313. [Google Scholar] [CrossRef]
- Chang, S.; Wang, J.; Xu, N.; Wang, S.; Cai, H.; Liu, Z.; Wang, X. Facile Construction of Hybrid Hydrogels with High Strength and Biocompatibility for Cranial Bone Regeneration. Gels 2022, 8, 745. [Google Scholar] [CrossRef]
- Suhail, M.; Khan, A.; Rosenholm, J.M.; Minhas, M.U.; Wu, P.-C. Fabrication and Characterization of Diclofenac Sodium Loaded Hydrogels of Sodium Alginate as Sustained Release Carrier. Gels 2021, 7, 10. [Google Scholar] [CrossRef] [PubMed]
- Kurakula, M.; Naveen, N.R.; Patel, B.; Manne, R.; Patel, D.B. Preparation, Optimization and Evaluation of Chitosan-Based Avanafil Nanocomplex Utilizing Antioxidants for Enhanced Neuroprotective Effect on PC12 Cells. Gels 2021, 7, 96. [Google Scholar] [CrossRef] [PubMed]
- Wu, L.; Niu, W.; Wang, Q.; Yang, Q.; Song, J.; Guo, Q.; Gong, W.; Kang, X.; Nishinari, K.; Zhao, M. Microstructure determined the gel properties of gelatin/dextran more than the macrophase separation. Food Hydrocoll. 2023, 135, 108116. [Google Scholar] [CrossRef]
- Babaei, J.; Mohammadian, M.; Madadlou, A. Gelatin as texture modifier and porogen in egg white hydrogel. Food Chem. 2019, 270, 189–195. [Google Scholar] [CrossRef]
- Martin, A.H.; Bakhuizen, E.; Ersch, C.; Urbonaite, V.; de Jongh, H.H.J.; Pouvreau, L. Gelatin increases the coarseness of whey protein gels and impairs water exudation from the mixed gel at low temperatures. Food Hydrocoll. 2016, 56, 236–244. [Google Scholar] [CrossRef]
- Yan, J.; Li, S.; Chen, G.; Ma, C.; McClements, D.J.; Liu, X.; Liu, F. Formation, physicochemical properties, and comparison of heat- and enzyme-induced whey protein-gelatin composite hydrogels. Food Hydrocoll. 2022, 137, 108384. [Google Scholar] [CrossRef]
- Piao, Y.; Chen, B. Synthesis and mechanical properties of double cross-linked gelatin-graphene oxide hydrogels. Int. J. Biol. Macromol. 2017, 101, 791–798. [Google Scholar] [CrossRef] [PubMed]
- Barra, A.; Santos, J.D.C.; Silva, M.R.F.; Nunes, C.; Ruiz-Hitzky, E.; Gonçalves, I.; Yildirim, S.; Ferreira, P.; Marques, P.A.A.P. Graphene Derivatives in Biopolymer-Based Composites for Food Packaging Applications. Nanomaterials 2020, 10, 2077. [Google Scholar] [CrossRef] [PubMed]
- Panzavolta, S.; Bracci, B.; Gualandi, C.; Focarete, M.L.; Treossi, E.; Kouroupis-Agalou, K.; Rubini, K.; Bosia, F.; Brely, L.; Pugno, N.M.; et al. Structural reinforcement and failure analysis in composite nanofibers of graphene oxide and gelatin. Carbon 2014, 78, 566–577. [Google Scholar] [CrossRef]
- Fechete, R.; Morar, I.A.; Moldovan, D.; Chelcea, R.I.; Crainic, R.; Nicoară, S.C. Fourier and Laplace-like low-field NMR spectroscopy: The perspectives of multivariate and artificial neural networks analyses. J. Magn. Reson. 2021, 324, 106915. [Google Scholar] [CrossRef] [PubMed]
- Chelcea, R.I.; Fechete, R.; Culea, E.; Demco, D.E.; Blümich, B. Distributions of transverse relaxation times for soft-solids measured in strongly inhomogeneous magnetic fields. J. Magn. Reson. 2009, 196, 178–190. [Google Scholar] [CrossRef] [PubMed]
- Asim, N.; Súait, M.S.; Badiei, M.; Mohammad, M.; Akhtaruzzaman, M.; Rajabi, A.; Amin, N.; Ghazali, M.J. Perspectives in biopolymer/graphene-based composite application: Advances, challenges, and recommendations. Nanotechnol. Rev. 2022, 11, 1525–1554. [Google Scholar] [CrossRef]
- Popescu, V.; Molea, A.; Moldovan, M.; Lopes, P.M.; Mazilu Moldovan, A.; Popescu, G.L. The Influence of Enzymatic Hydrolysis of Whey Proteins on the Properties of Gelatin-Whey Composite Hydrogels. Materials 2021, 14, 3507. [Google Scholar] [CrossRef]
- Lopes, P.M.P.; Popescu, V. Development and evaluation of a whey and gelatin film filled with copper nanoparticles synthesized by an eco-friendly method. Mater. Methods Technol. 2022, 16, 325–333. [Google Scholar]
- Wichchukit, S.; Oztop, M.H.; McCarthy, M.J.; McCarthy, K.L. Whey protein/alginate beads as carriers of a bioactive component. Food Hydrocoll. 2013, 33, 66–73. [Google Scholar] [CrossRef]
- Makovec, J.A.; Ruegg, D.P.L. Antimicrobial resistance of bacteria isolated from dairy cow milk samples submitted for bacterial culture: 8,905 samples (1994–2001). J. Am. Vet. Med. Assoc. 2003, 222, 1582–1589. [Google Scholar] [CrossRef]
- Bodea, I.M.; Cătunescu, G.M.; Pop, C.R.; Fiț, N.I.; David, A.P.; Dudescu, M.C.; Stănilă, A.; Rotar, A.M.; Beteg, F.I. Antimicrobial Properties of Bacterial Cellulose Films Enriched with Bioactive Herbal Extracts Obtained by Microwave-Assisted Extraction. Polymers 2022, 14, 1435. [Google Scholar] [CrossRef] [PubMed]
- Semeniuc, C.A.; Pop, C.R.; Rotar, A.M. Antibacterial activity and interactions of plant essential oil combinations against Gram-positive and Gram-negative bacteria. J. Food Drug Anal. 2017, 25, 403–408. [Google Scholar] [CrossRef] [PubMed]


| Time (min) | Swelling Degree (g/g) | ||||
|---|---|---|---|---|---|
| M | I | II | III | IV | |
| 60 | 1.6011 | 1.9960 | 1.8685 | 1.9846 | 1.8525 |
| 120 | 1.8555 | 2.1486 | 2.1509 | 2.3936 | 2.0603 |
| 240 | 2.2254 | 2.3820 | 2.5495 | 2.5556 | 2.3852 |
| 300 | 2.3353 | 2.4935 | 2.6507 | 2.6737 | 2.4908 |
| 1440 | 3.0603 | 2.9316 | 2.8867 | 2.9131 | 2.8918 |
| 2880 | 3.1581 | 3.1775 | 3.0415 | 2.9251 | 2.8670 |
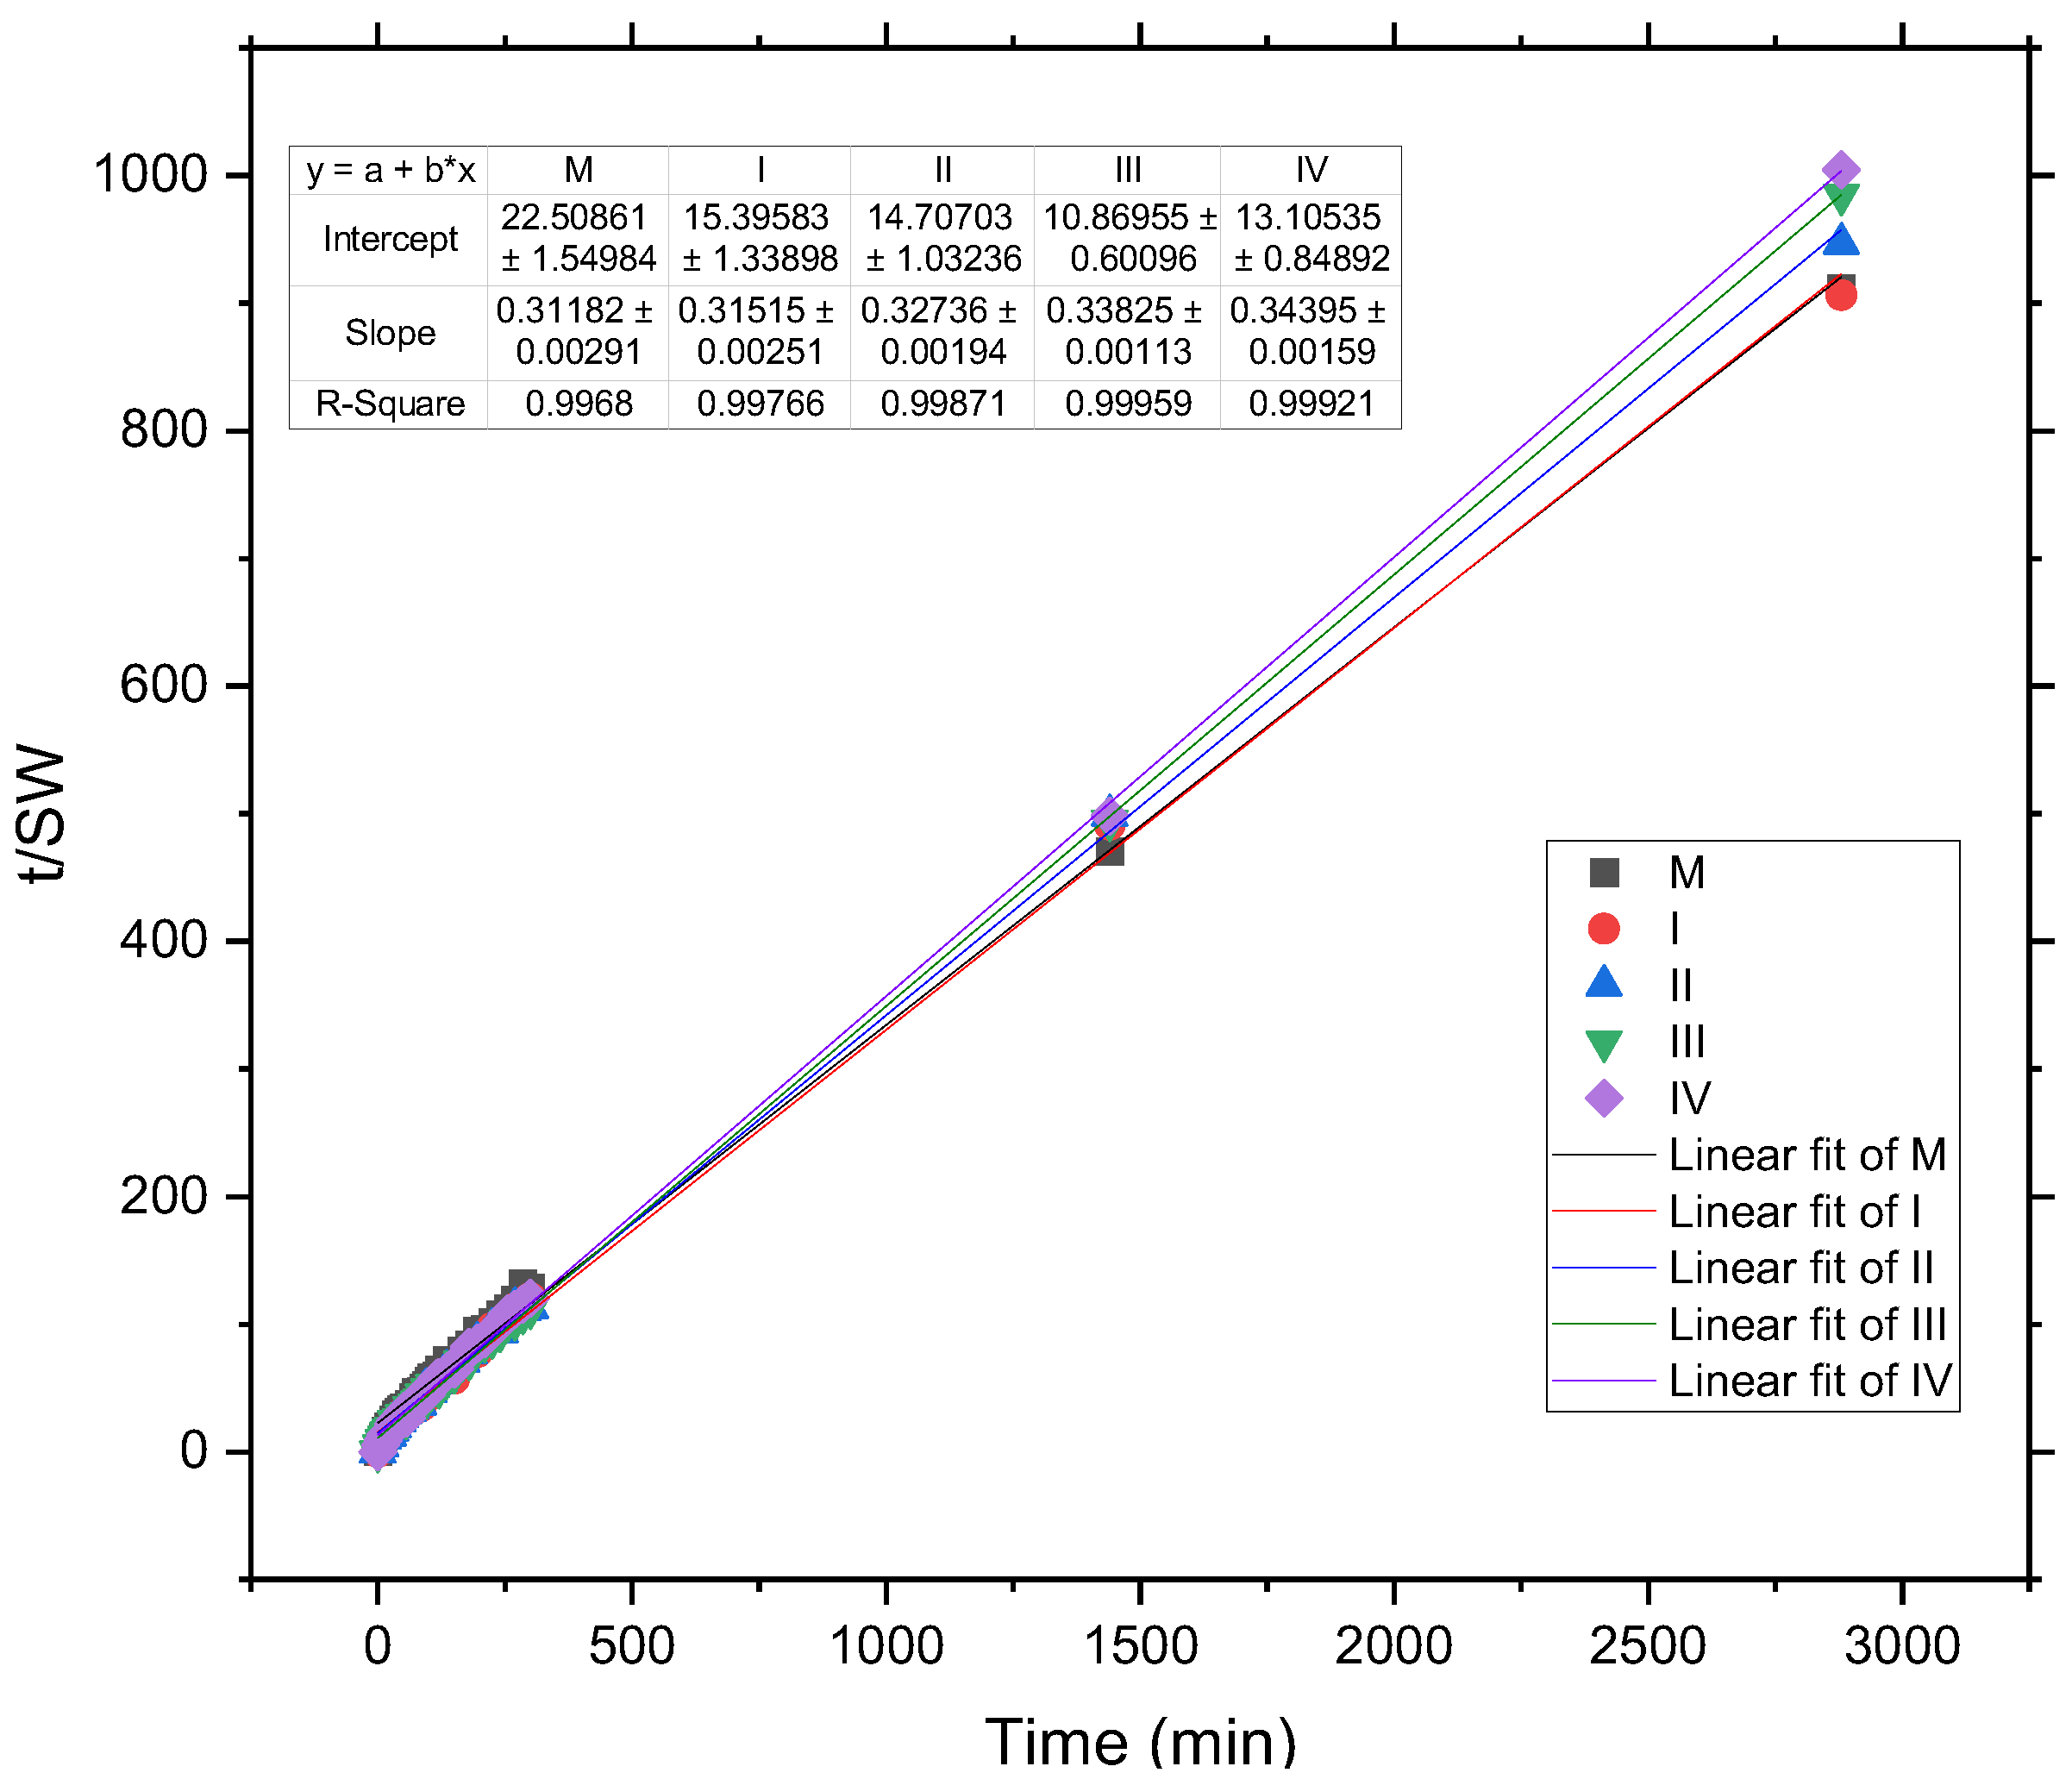
| Slope | SWe Calculated | SWe Experimental | Intercept | K | |
|---|---|---|---|---|---|
| M | 0.31 | 3.21 | 3.16 | 12.26 | 0.03 |
| I | 0.32 | 3.17 | 3.18 | 8.21 | 0.04 |
| II | 0.33 | 3.05 | 3.04 | 9.43 | 0.03 |
| III | 0.34 | 2.96 | 2.93 | 8.44 | 0.04 |
| IV | 0.34 | 2.91 | 2.87 | 8.56 | 0.04 |
| Bacterial Strain | Sample Code * | ||||
|---|---|---|---|---|---|
| M | I | II | III | IV | |
| Escherichia coli ATCC 25922 | 0 | 0 | 9.7 ± 0.141 | 12.5 ± 0.212 | 13.7 ± 0.07 |
| Salmonella enteritidis ATCC 13076 | 0 | 0 | 10.5 ± 0.035 | 12.5 ± 0.212 | 13.5 ± 0.141 |
| Listeria monocytogenes ATCC 19114 | 0 | 0 | 0 | 10.5 ± 0.141 | 12.00 ± 0.00 |
Disclaimer/Publisher’s Note: The statements, opinions and data contained in all publications are solely those of the individual author(s) and contributor(s) and not of MDPI and/or the editor(s). MDPI and/or the editor(s) disclaim responsibility for any injury to people or property resulting from any ideas, methods, instructions or products referred to in the content. |
© 2022 by the authors. Licensee MDPI, Basel, Switzerland. This article is an open access article distributed under the terms and conditions of the Creative Commons Attribution (CC BY) license (https://creativecommons.org/licenses/by/4.0/).
Share and Cite
Lopes, P.M.P.; Moldovan, D.; Fechete, R.; Prodan, D.; Pop, C.R.; Rotar, A.M.; Popescu, V. Swelling and Antimicrobial Activity Characterization of a GO-Reinforced Gelatin—Whey Hydrogel. Gels 2023, 9, 18. https://doi.org/10.3390/gels9010018
Lopes PMP, Moldovan D, Fechete R, Prodan D, Pop CR, Rotar AM, Popescu V. Swelling and Antimicrobial Activity Characterization of a GO-Reinforced Gelatin—Whey Hydrogel. Gels. 2023; 9(1):18. https://doi.org/10.3390/gels9010018
Chicago/Turabian StyleLopes, Pompilia Mioara Purcea, Dumitriţa Moldovan, Radu Fechete, Doina Prodan, Carmen Rodica Pop, Ancuța M. Rotar, and Violeta Popescu. 2023. "Swelling and Antimicrobial Activity Characterization of a GO-Reinforced Gelatin—Whey Hydrogel" Gels 9, no. 1: 18. https://doi.org/10.3390/gels9010018
APA StyleLopes, P. M. P., Moldovan, D., Fechete, R., Prodan, D., Pop, C. R., Rotar, A. M., & Popescu, V. (2023). Swelling and Antimicrobial Activity Characterization of a GO-Reinforced Gelatin—Whey Hydrogel. Gels, 9(1), 18. https://doi.org/10.3390/gels9010018