
Compatibility Evaluation of In-Depth Profile Control Agents for Low-Permeability Fractured Reservoirs
Abstract
:1. Introduction
2. Results and Discussion
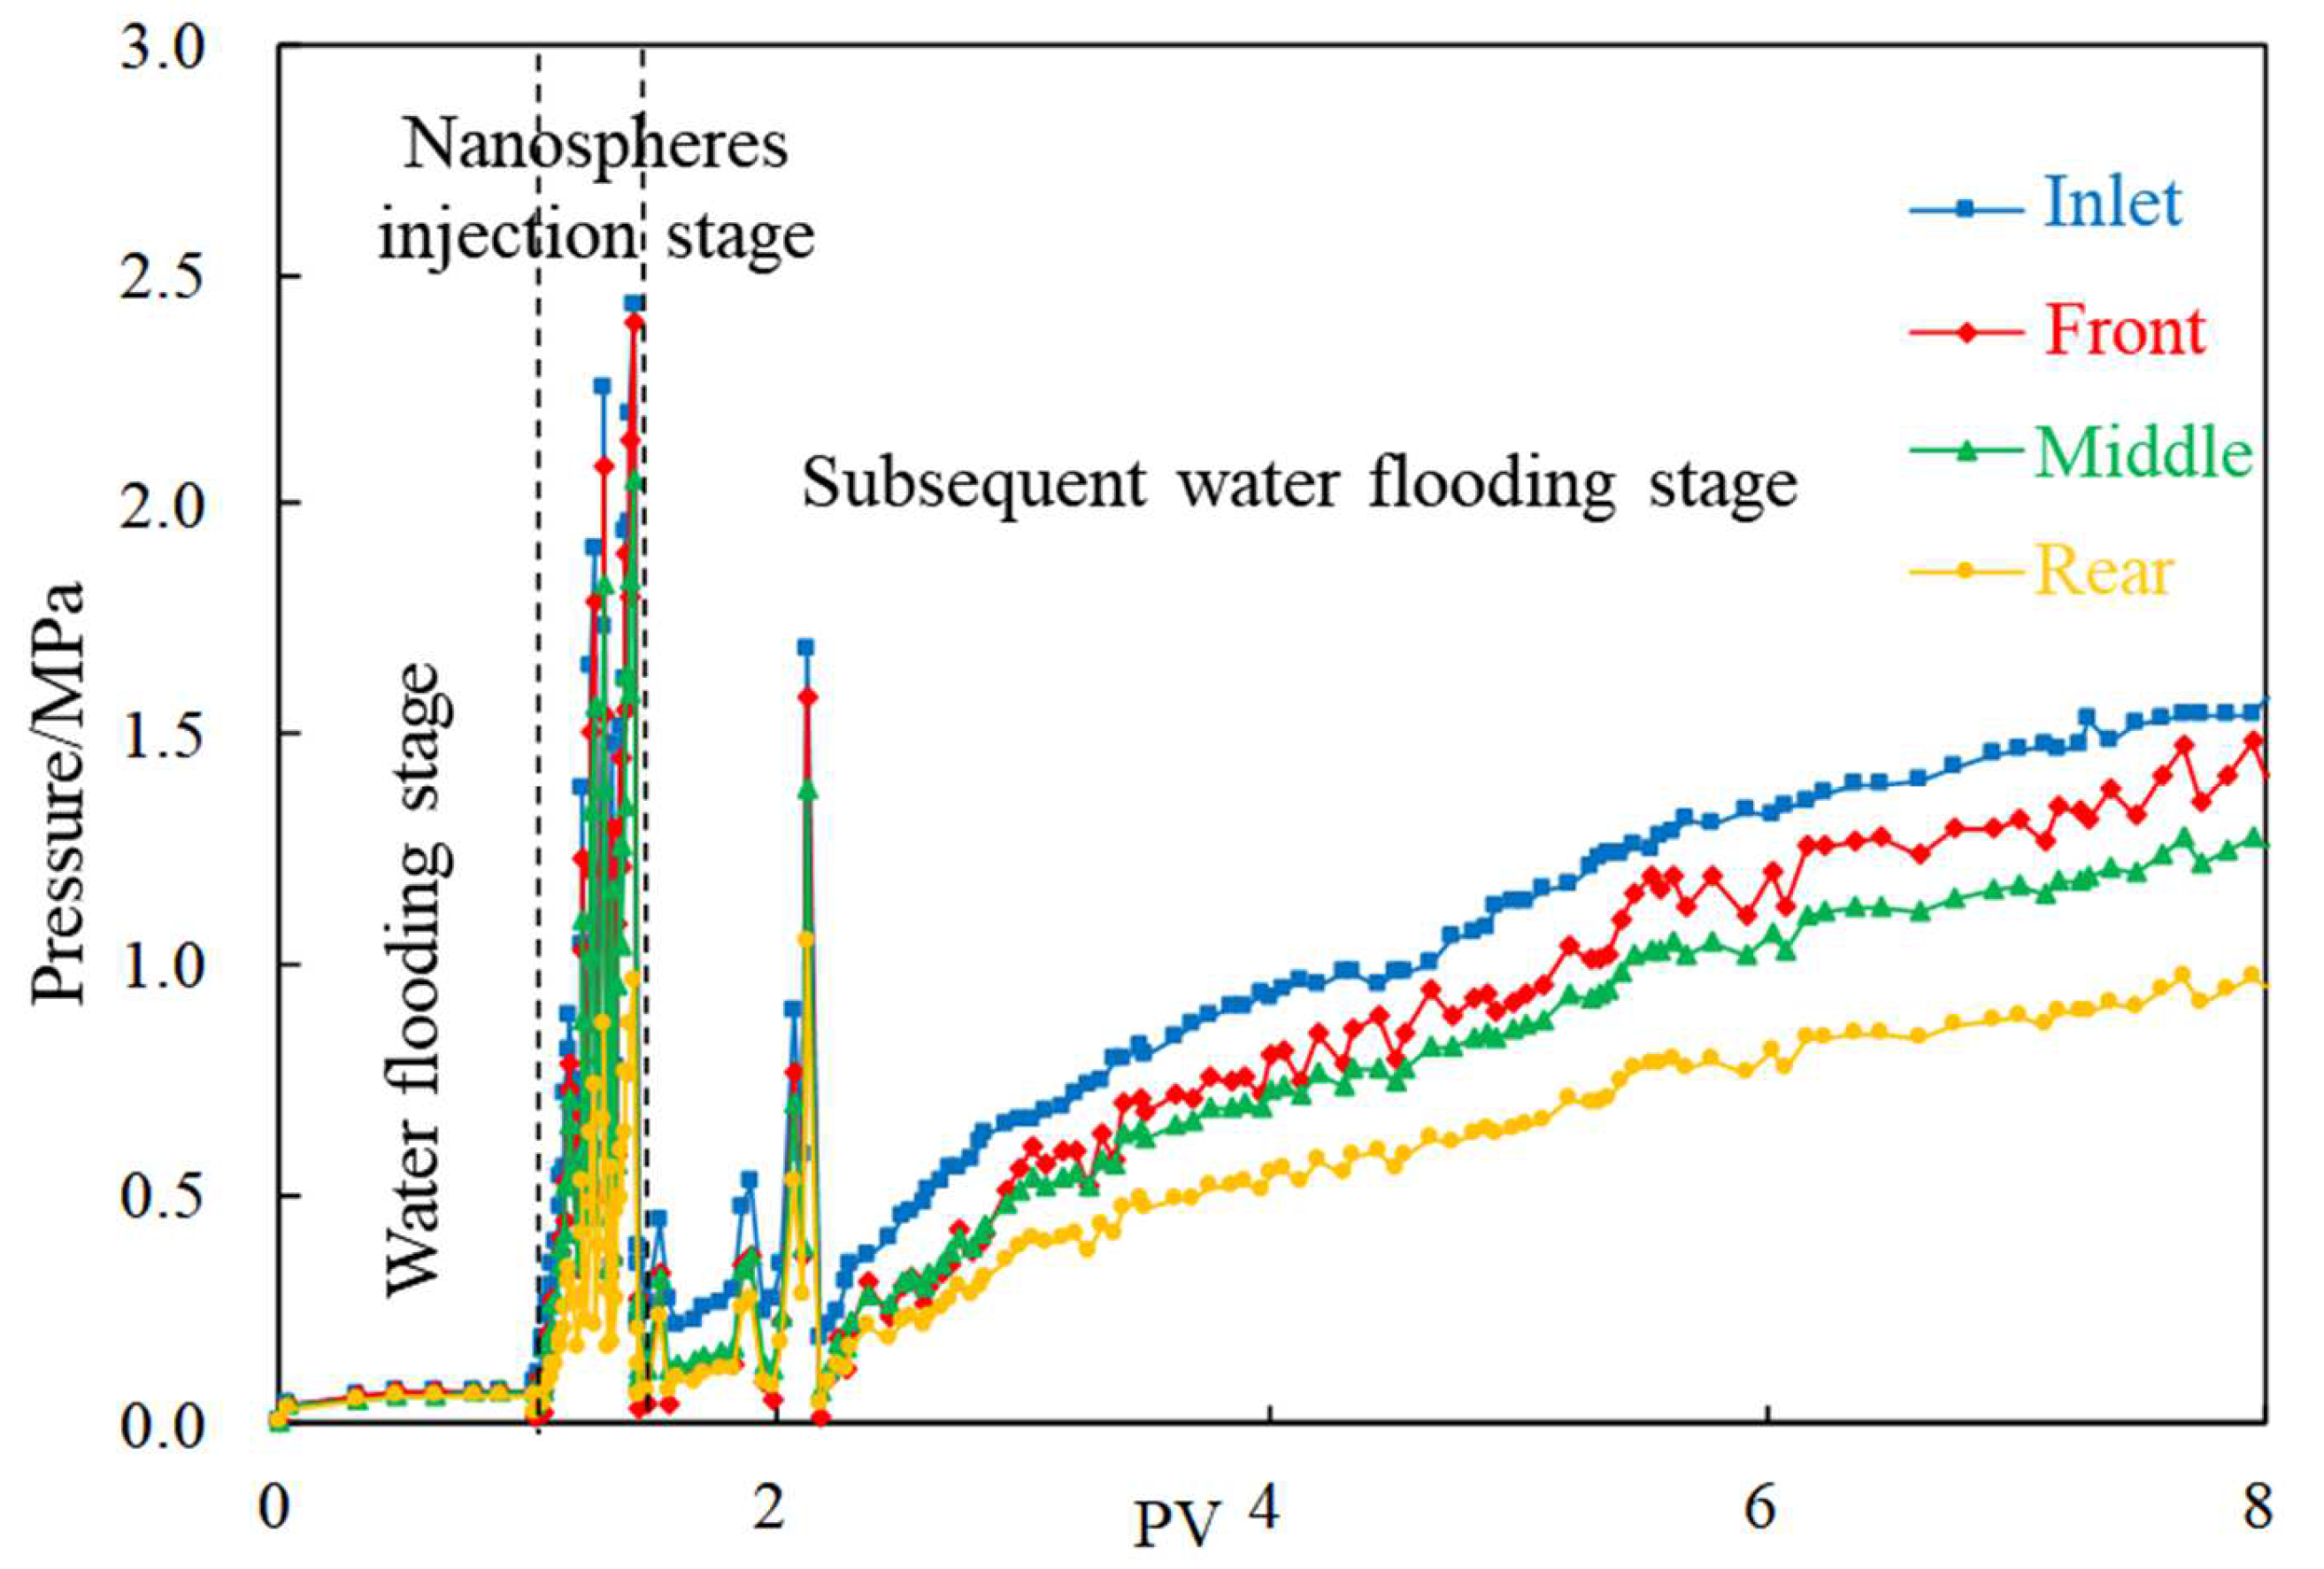
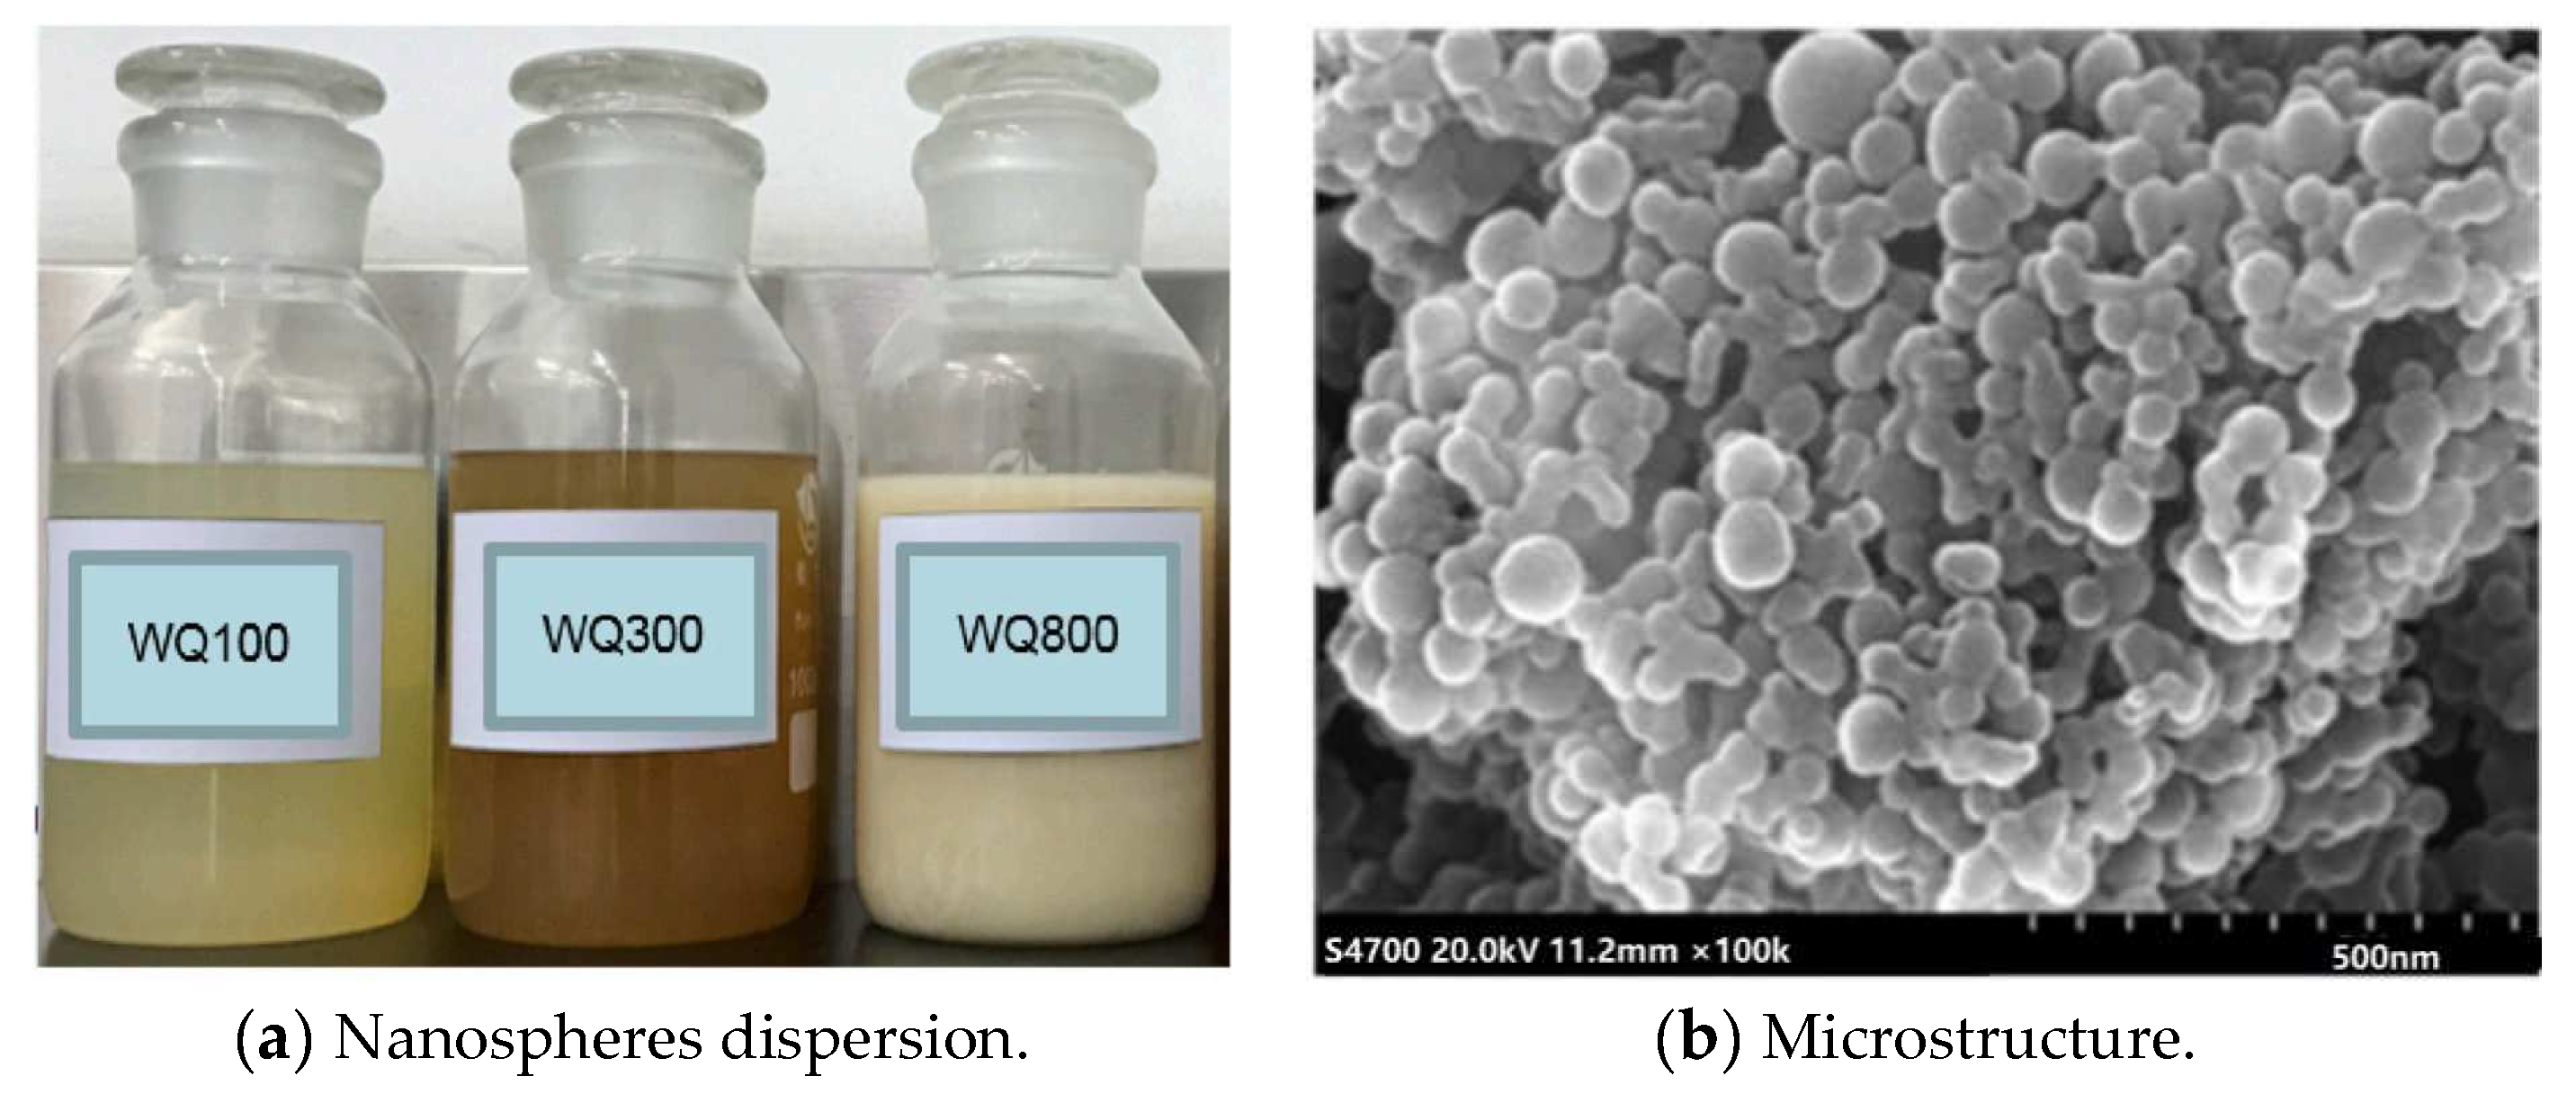
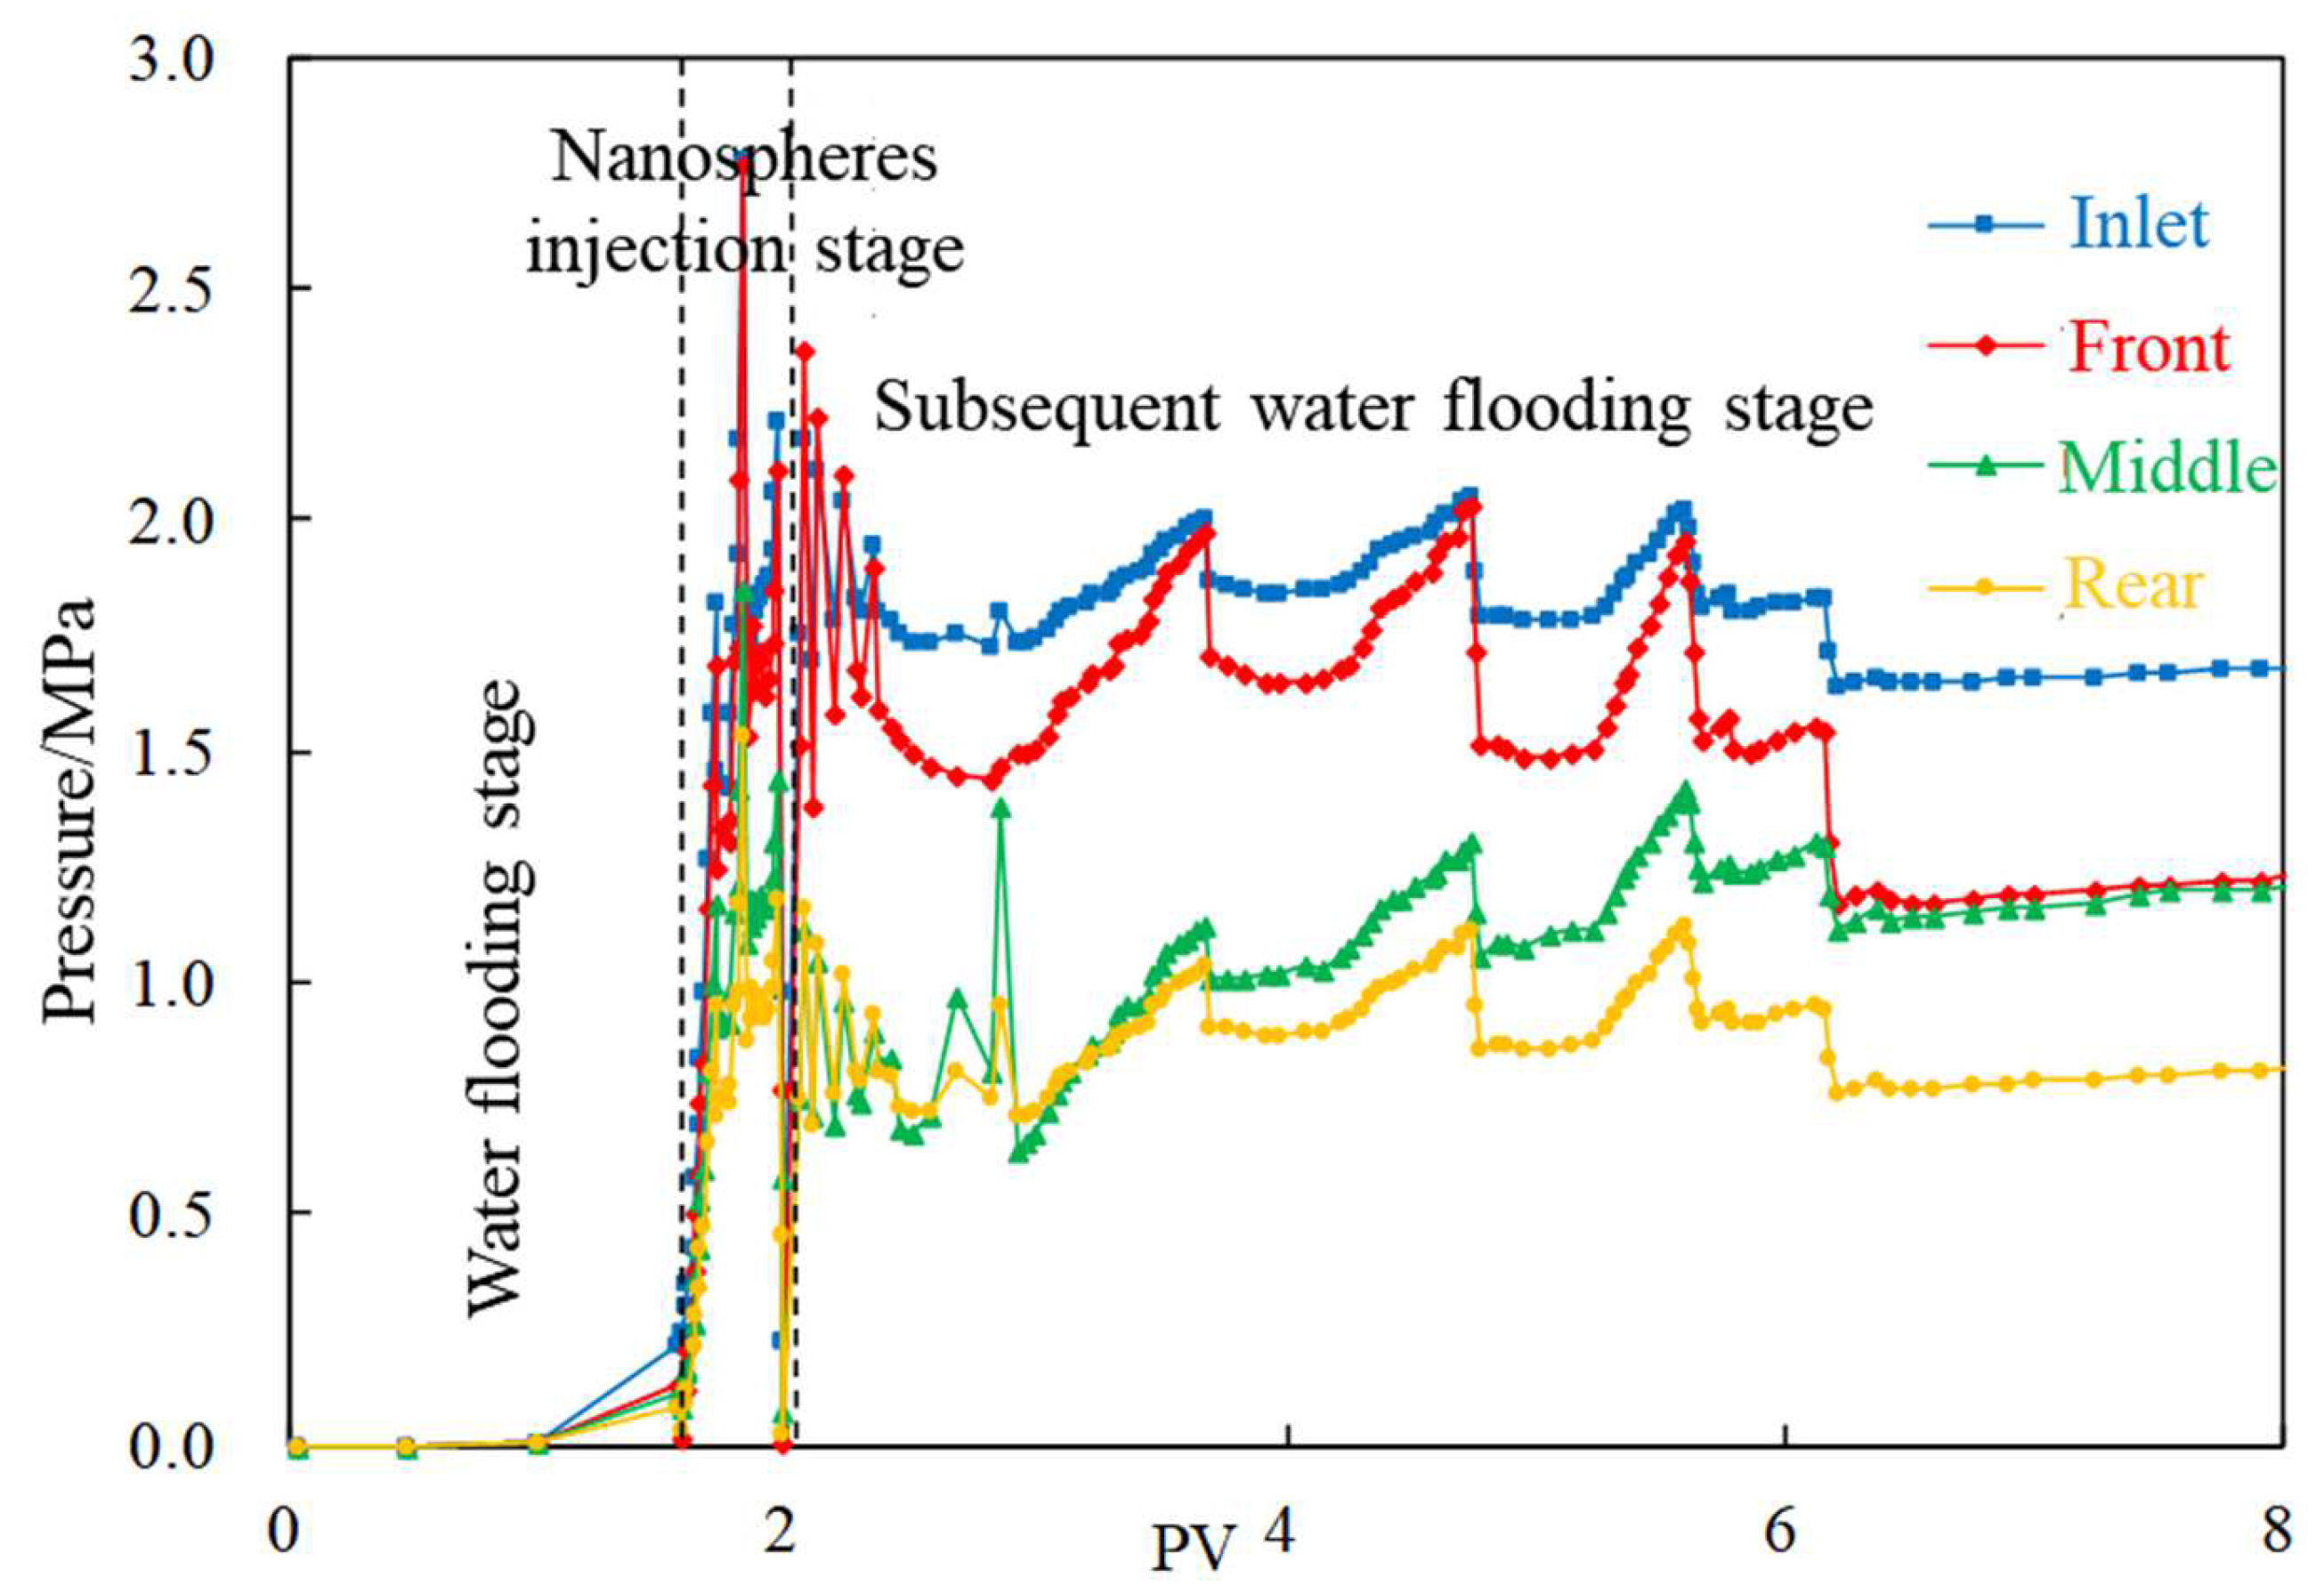
2.1. Nanospheres
- (1)
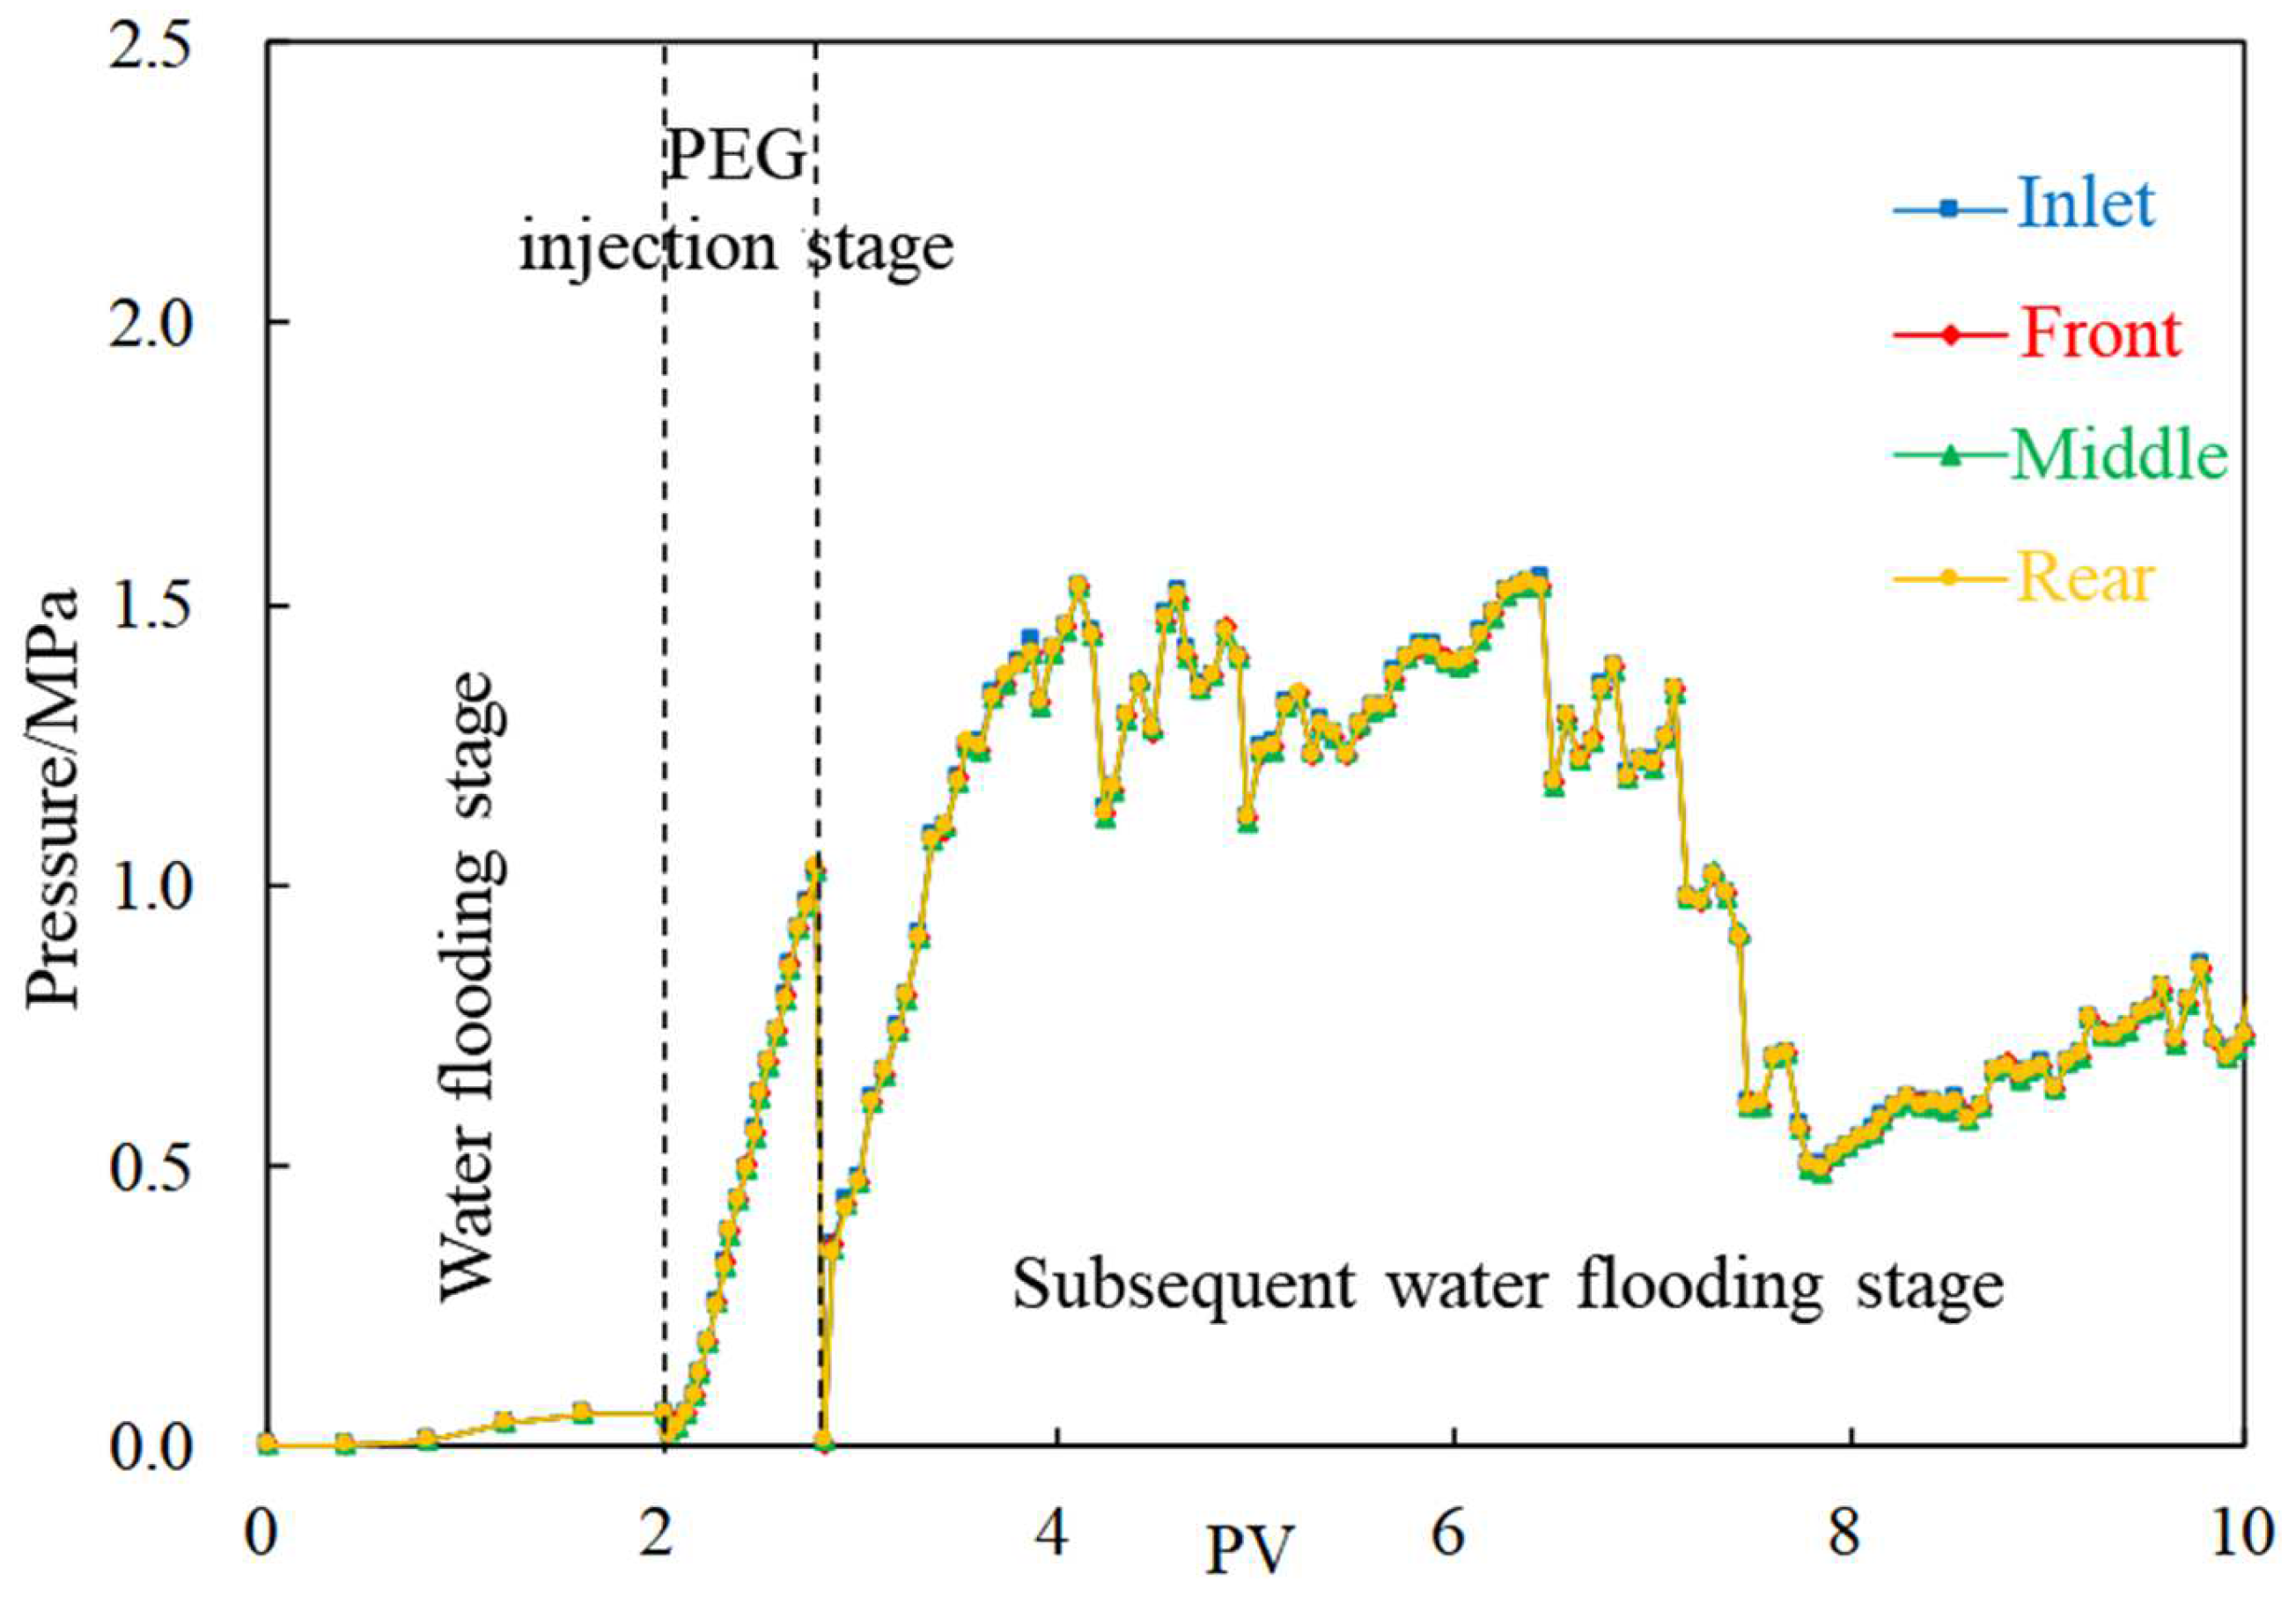
- Water flooding stage: With the increase in injection volume, the pressures at the four measuring taps along the injection direction begin to rise, and the lifting law of each tap is consistent. The initial pressure increases rapidly, whereas it gradually flattens out in the later stage, and finally stabilizes around 0.1 MPa after a cumulative injection of 1 PV.
- (2)
- Nanospheres injection stage: The pressure at each pressure measuring tap rises rapidly, among which the pressure at the front increases to more than 2 MPa, whereas the pressure at the other pressure measuring taps decreased successively.
- (3)
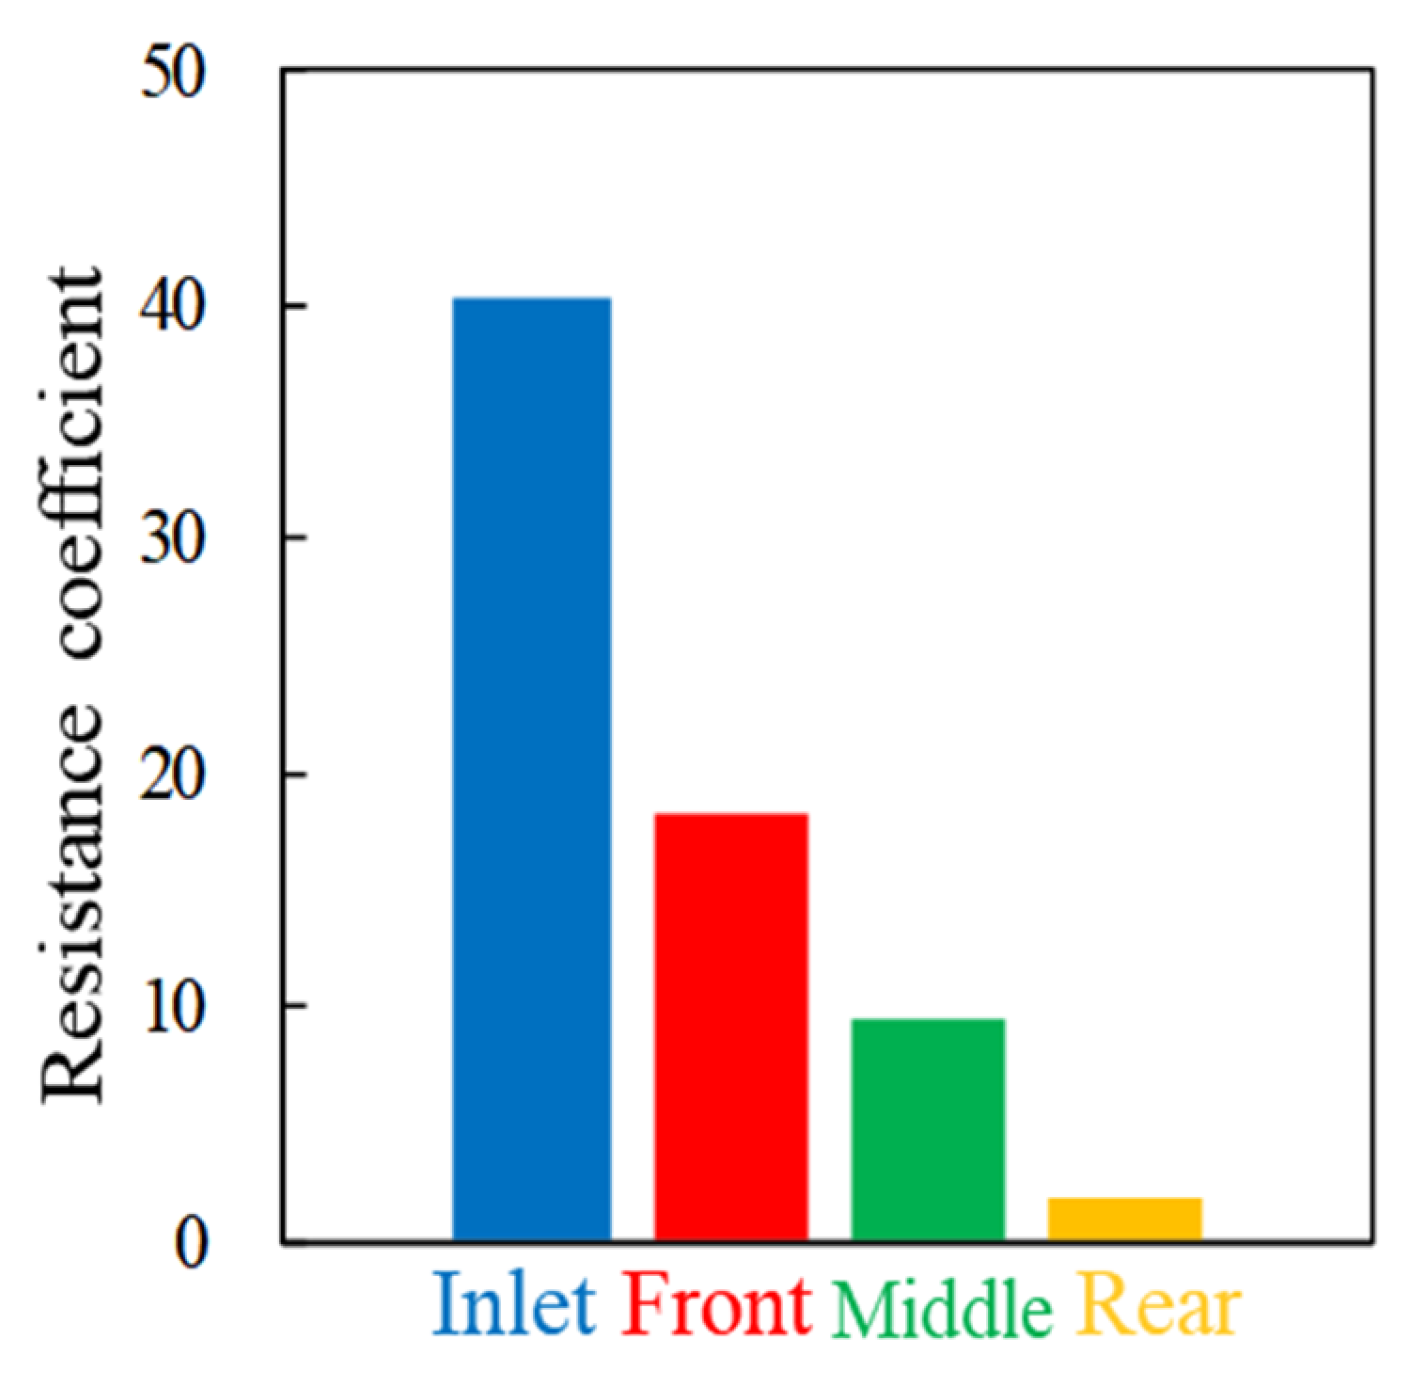
- Subsequent water flooding stage: The pressure fluctuates to a certain extent, indicating that the flow direction of injected water changes in the core under the influence of nanospheres. Subsequently, the pressure rises steadily. When the water is injected at about 6.5 PV in the subsequent water flooding stage, the front pressure reaches 1.5 MPa, and the pressure drop of each section in the front is approximately equal, whereas the rear pressure drop is higher, reflecting that the nanospheres migrate to the depth of core.
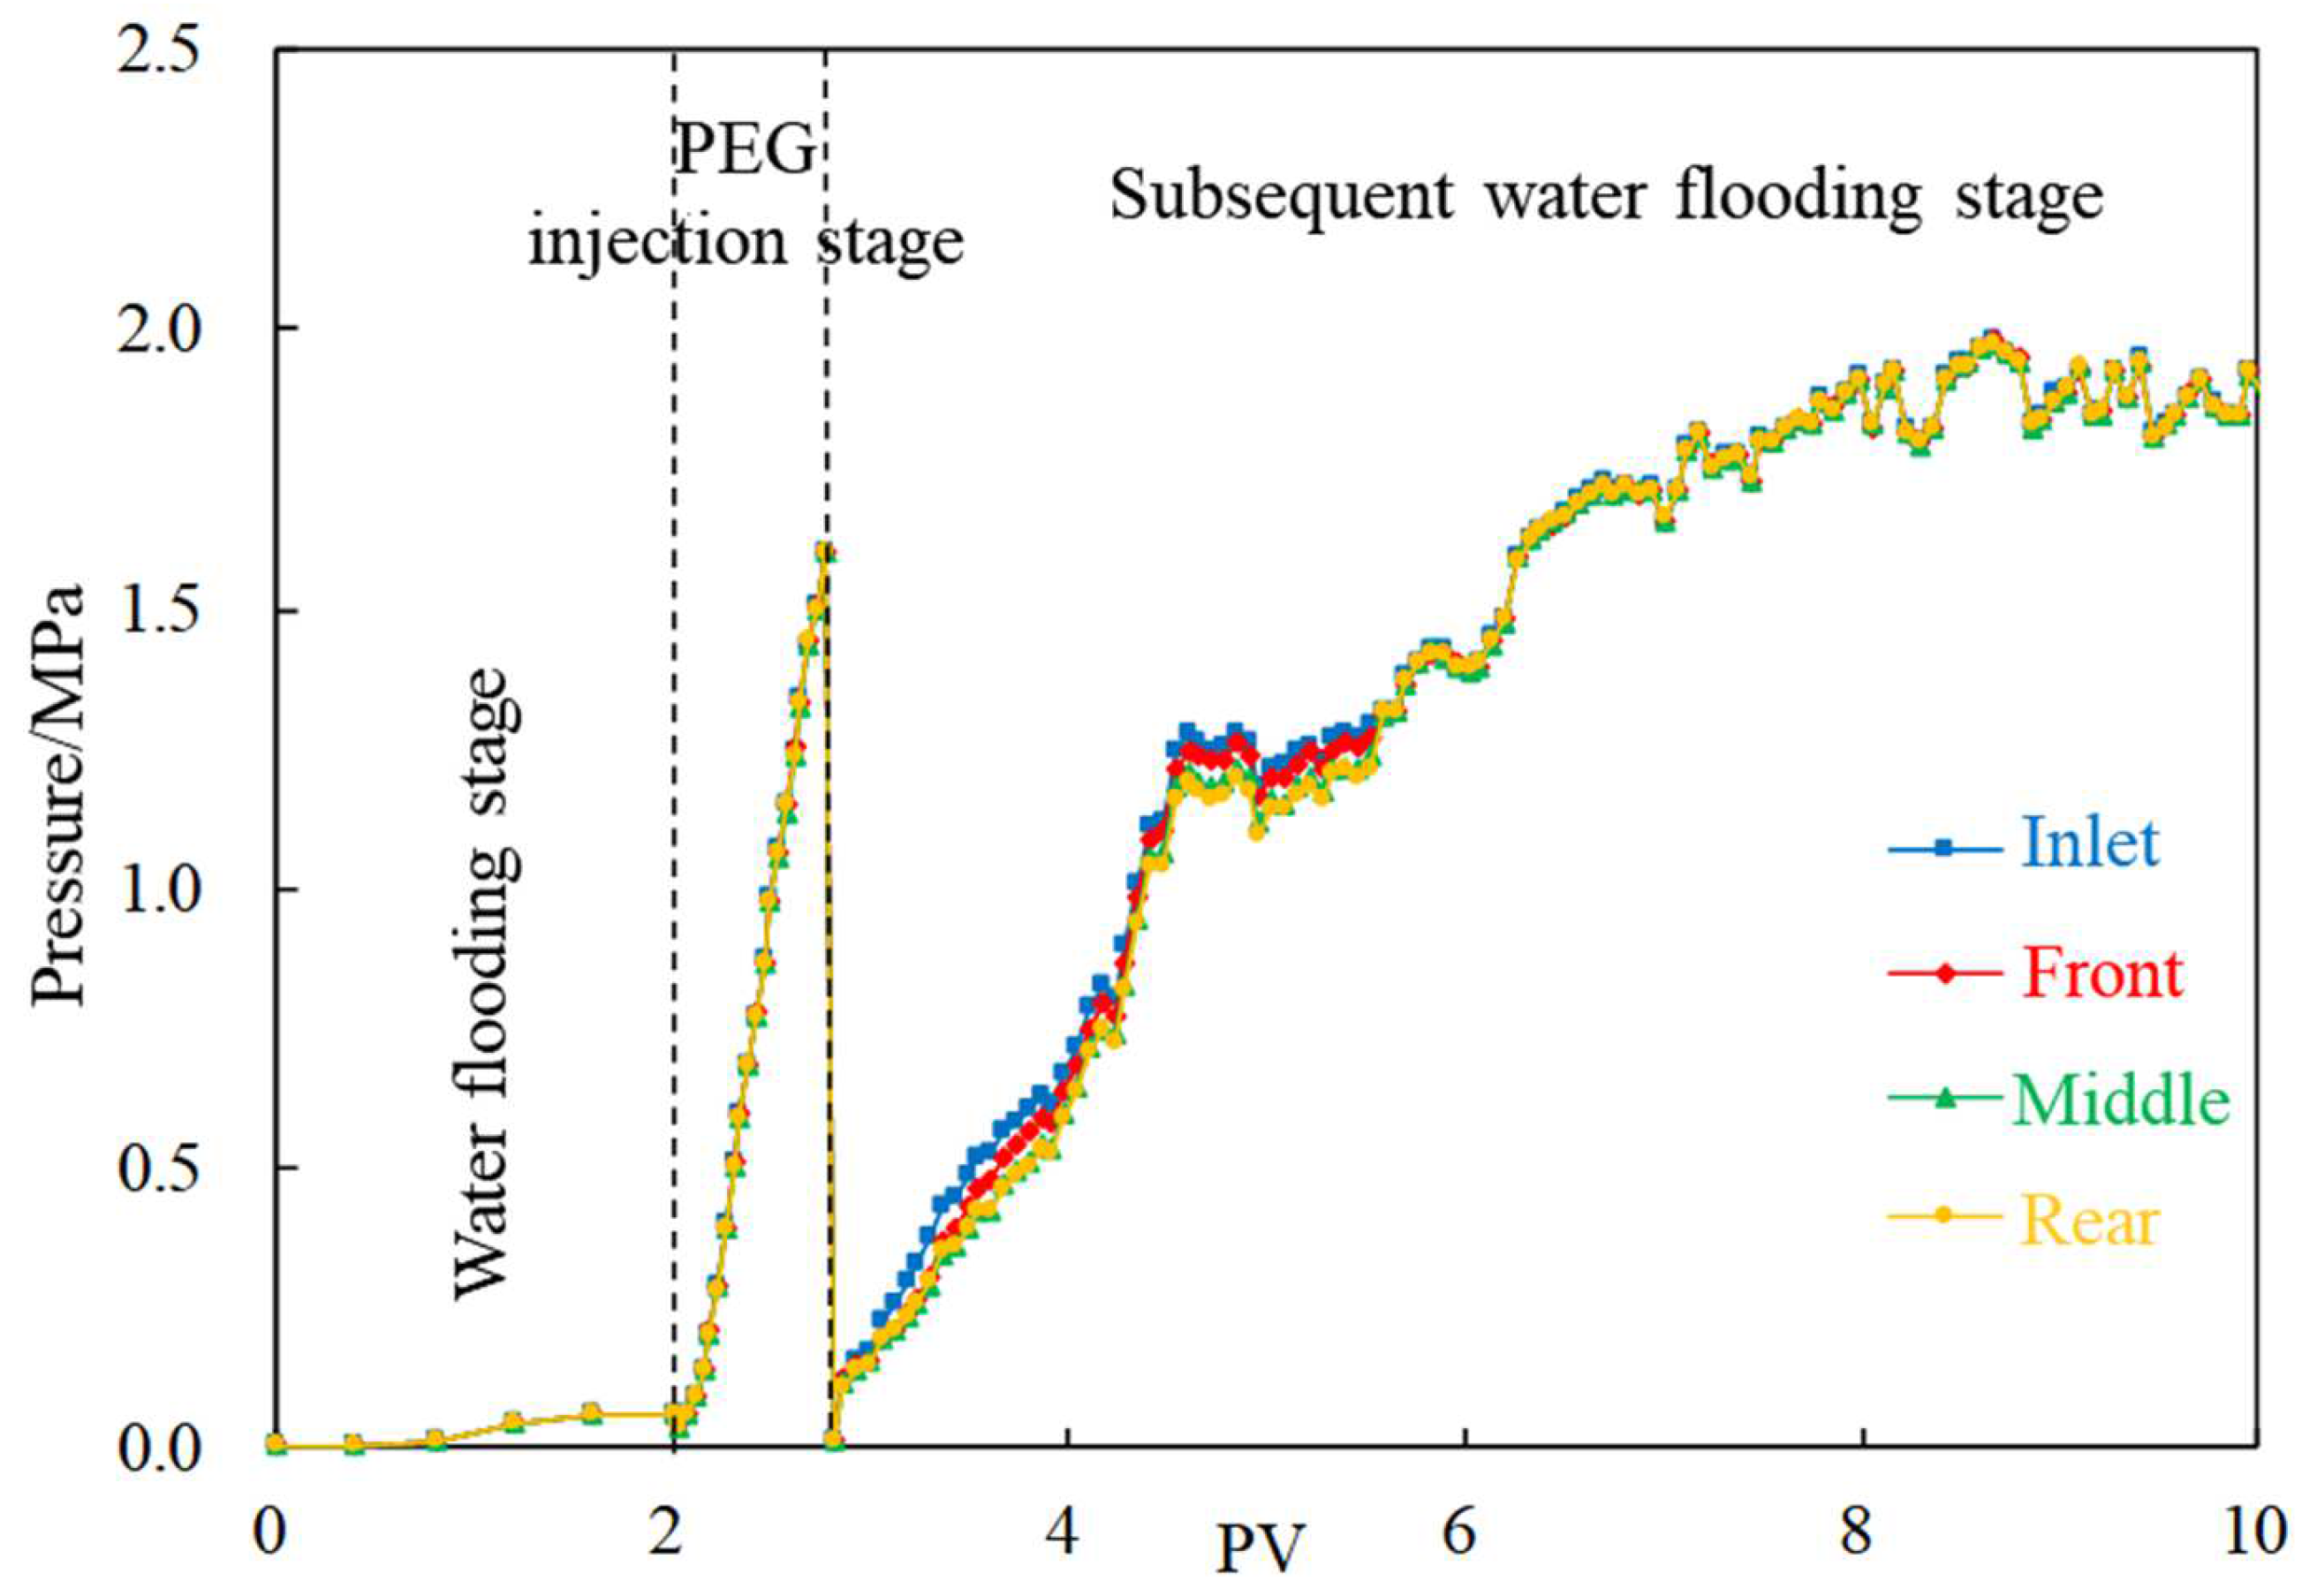
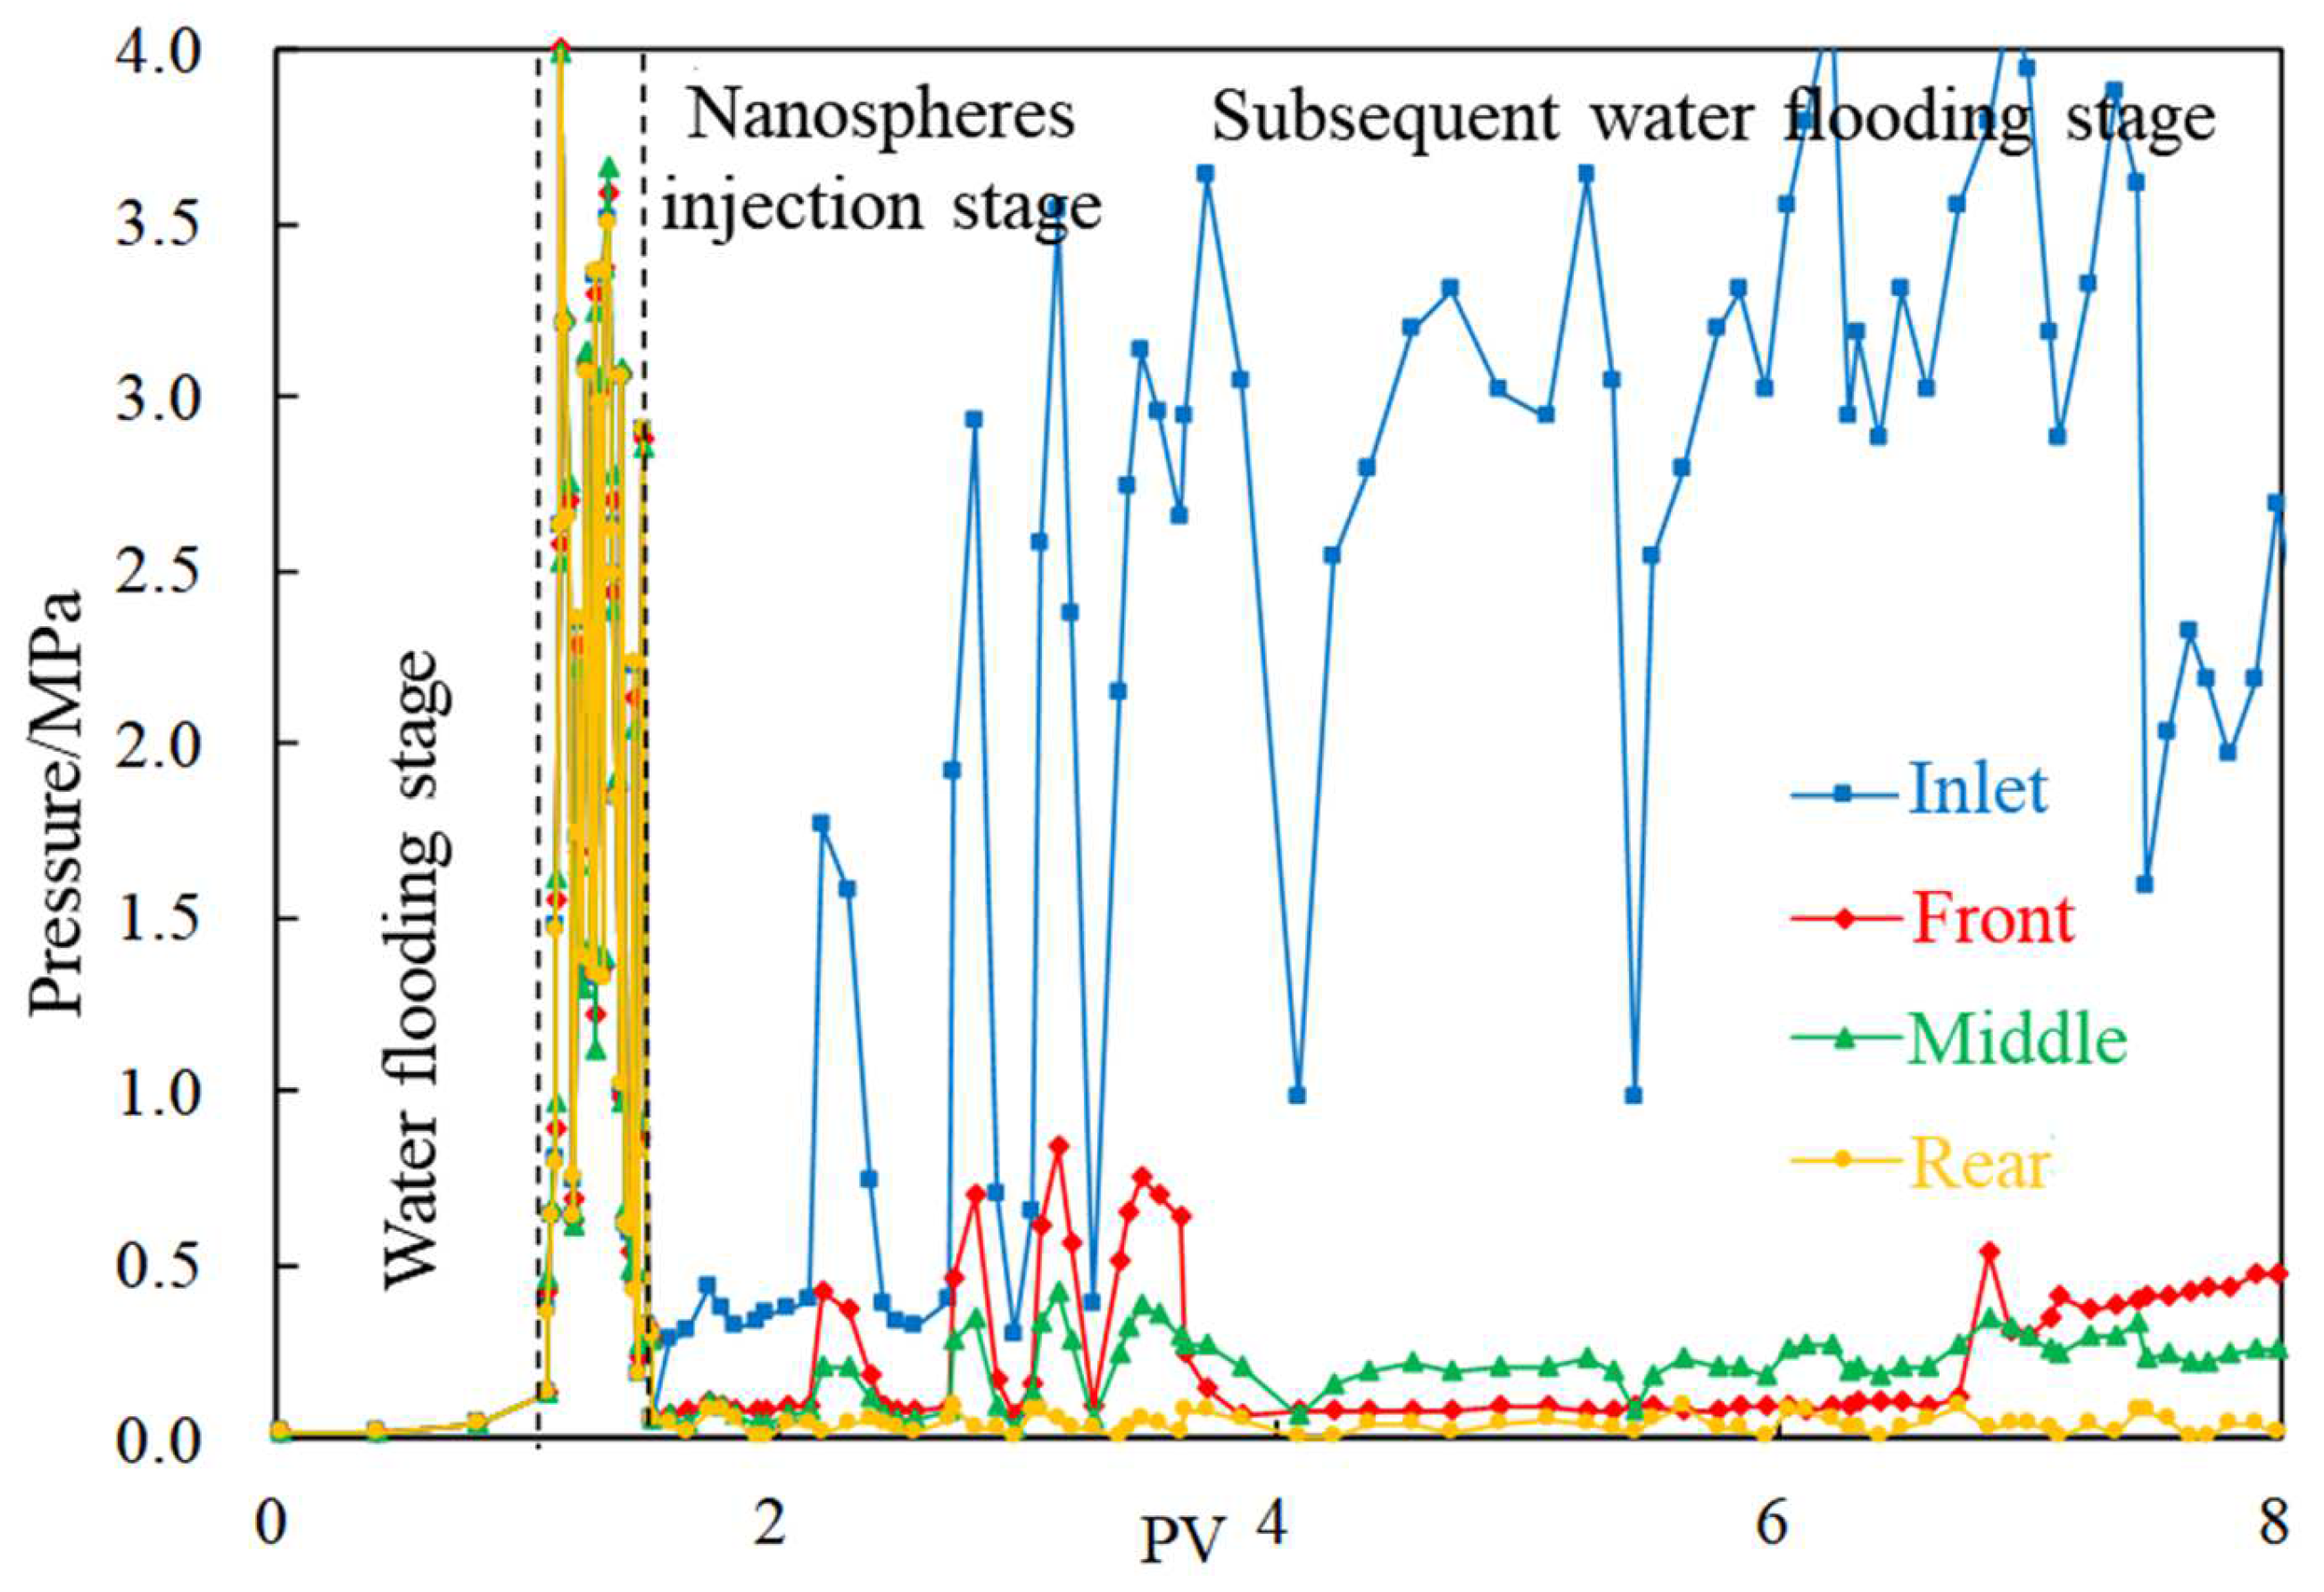
2.2. Single-Phase Gel Particle (PEG)
- (1)
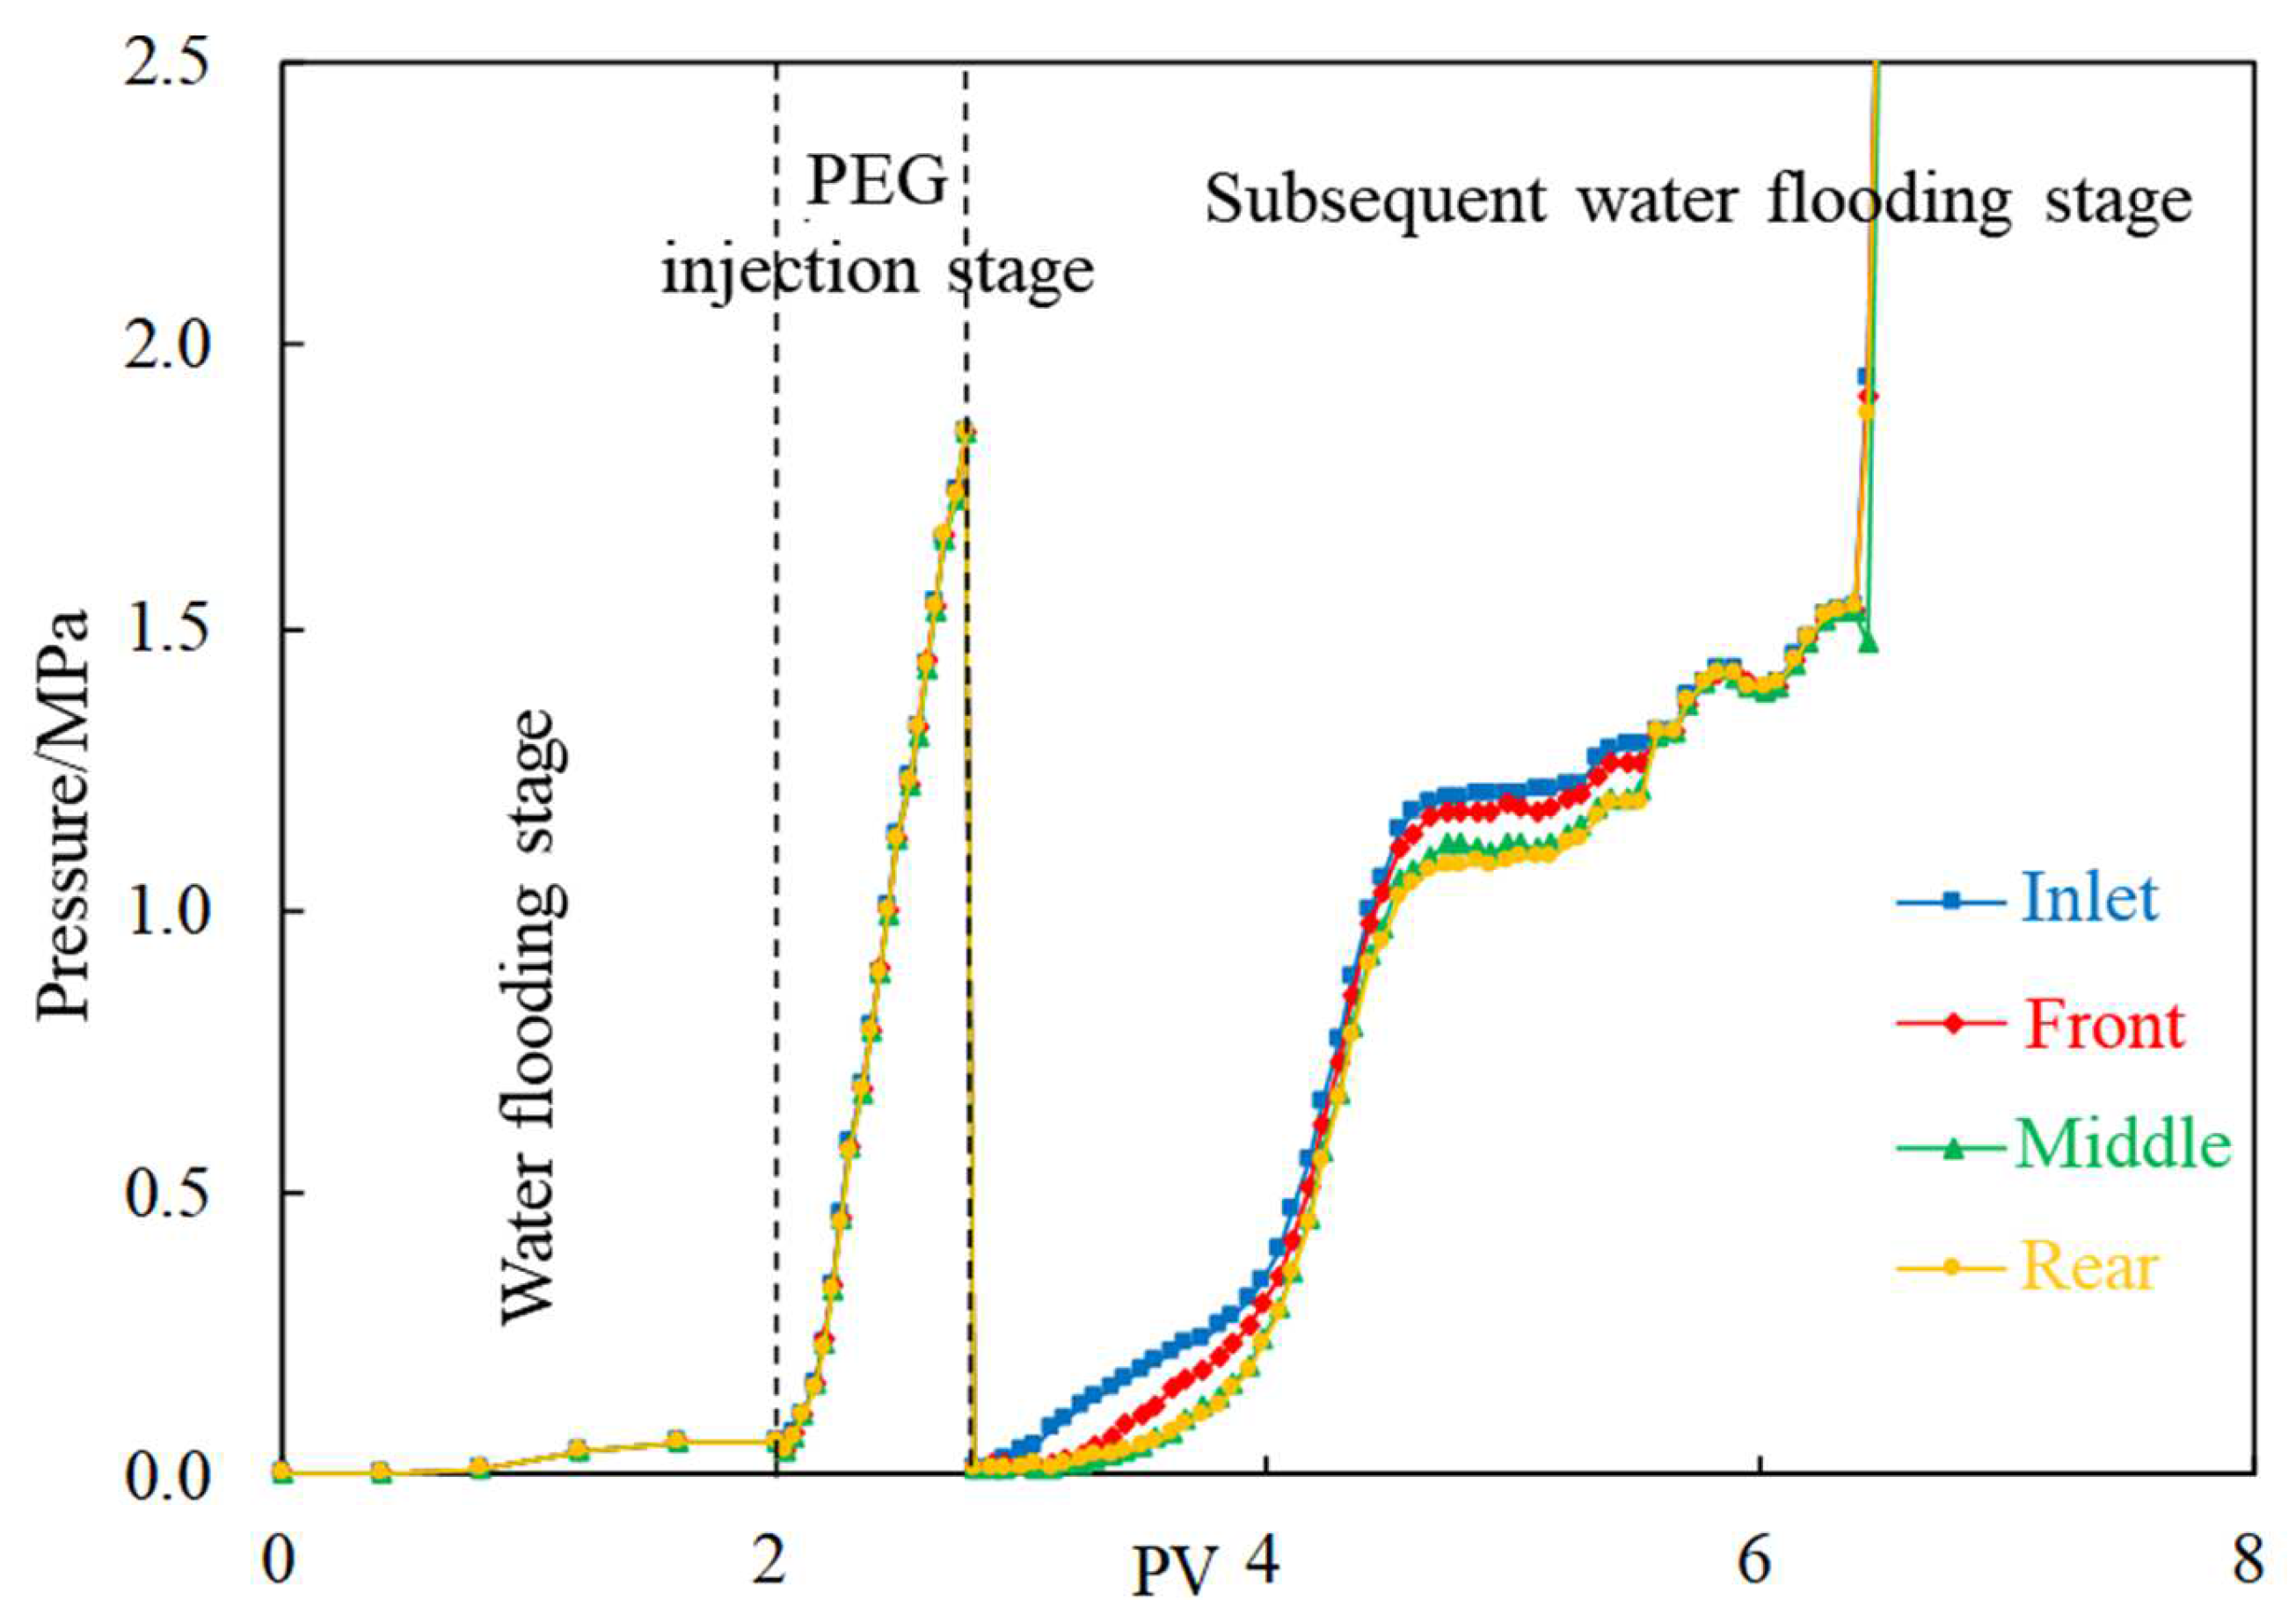
- Water flooding stage: With the increase in injection volume, the pressures at the four measuring taps along the injection direction began to rise, and the lifting law of each tap is consistent. The initial pressure increases rapidly while gradually flattening out in the later stage, and finally stabilized around 0.1 MPa after cumulative injection of 1 PV.
- (2)
- PEG injection stage: The pressure at each pressure measuring tap rose rapidly, reaching a maximum of more than 1.5 MPa.
- (3)
- Subsequent water flooding stage: The pressure rose steadily after frequent fluctuations, and finally stabilized at about 1.8 MPa.
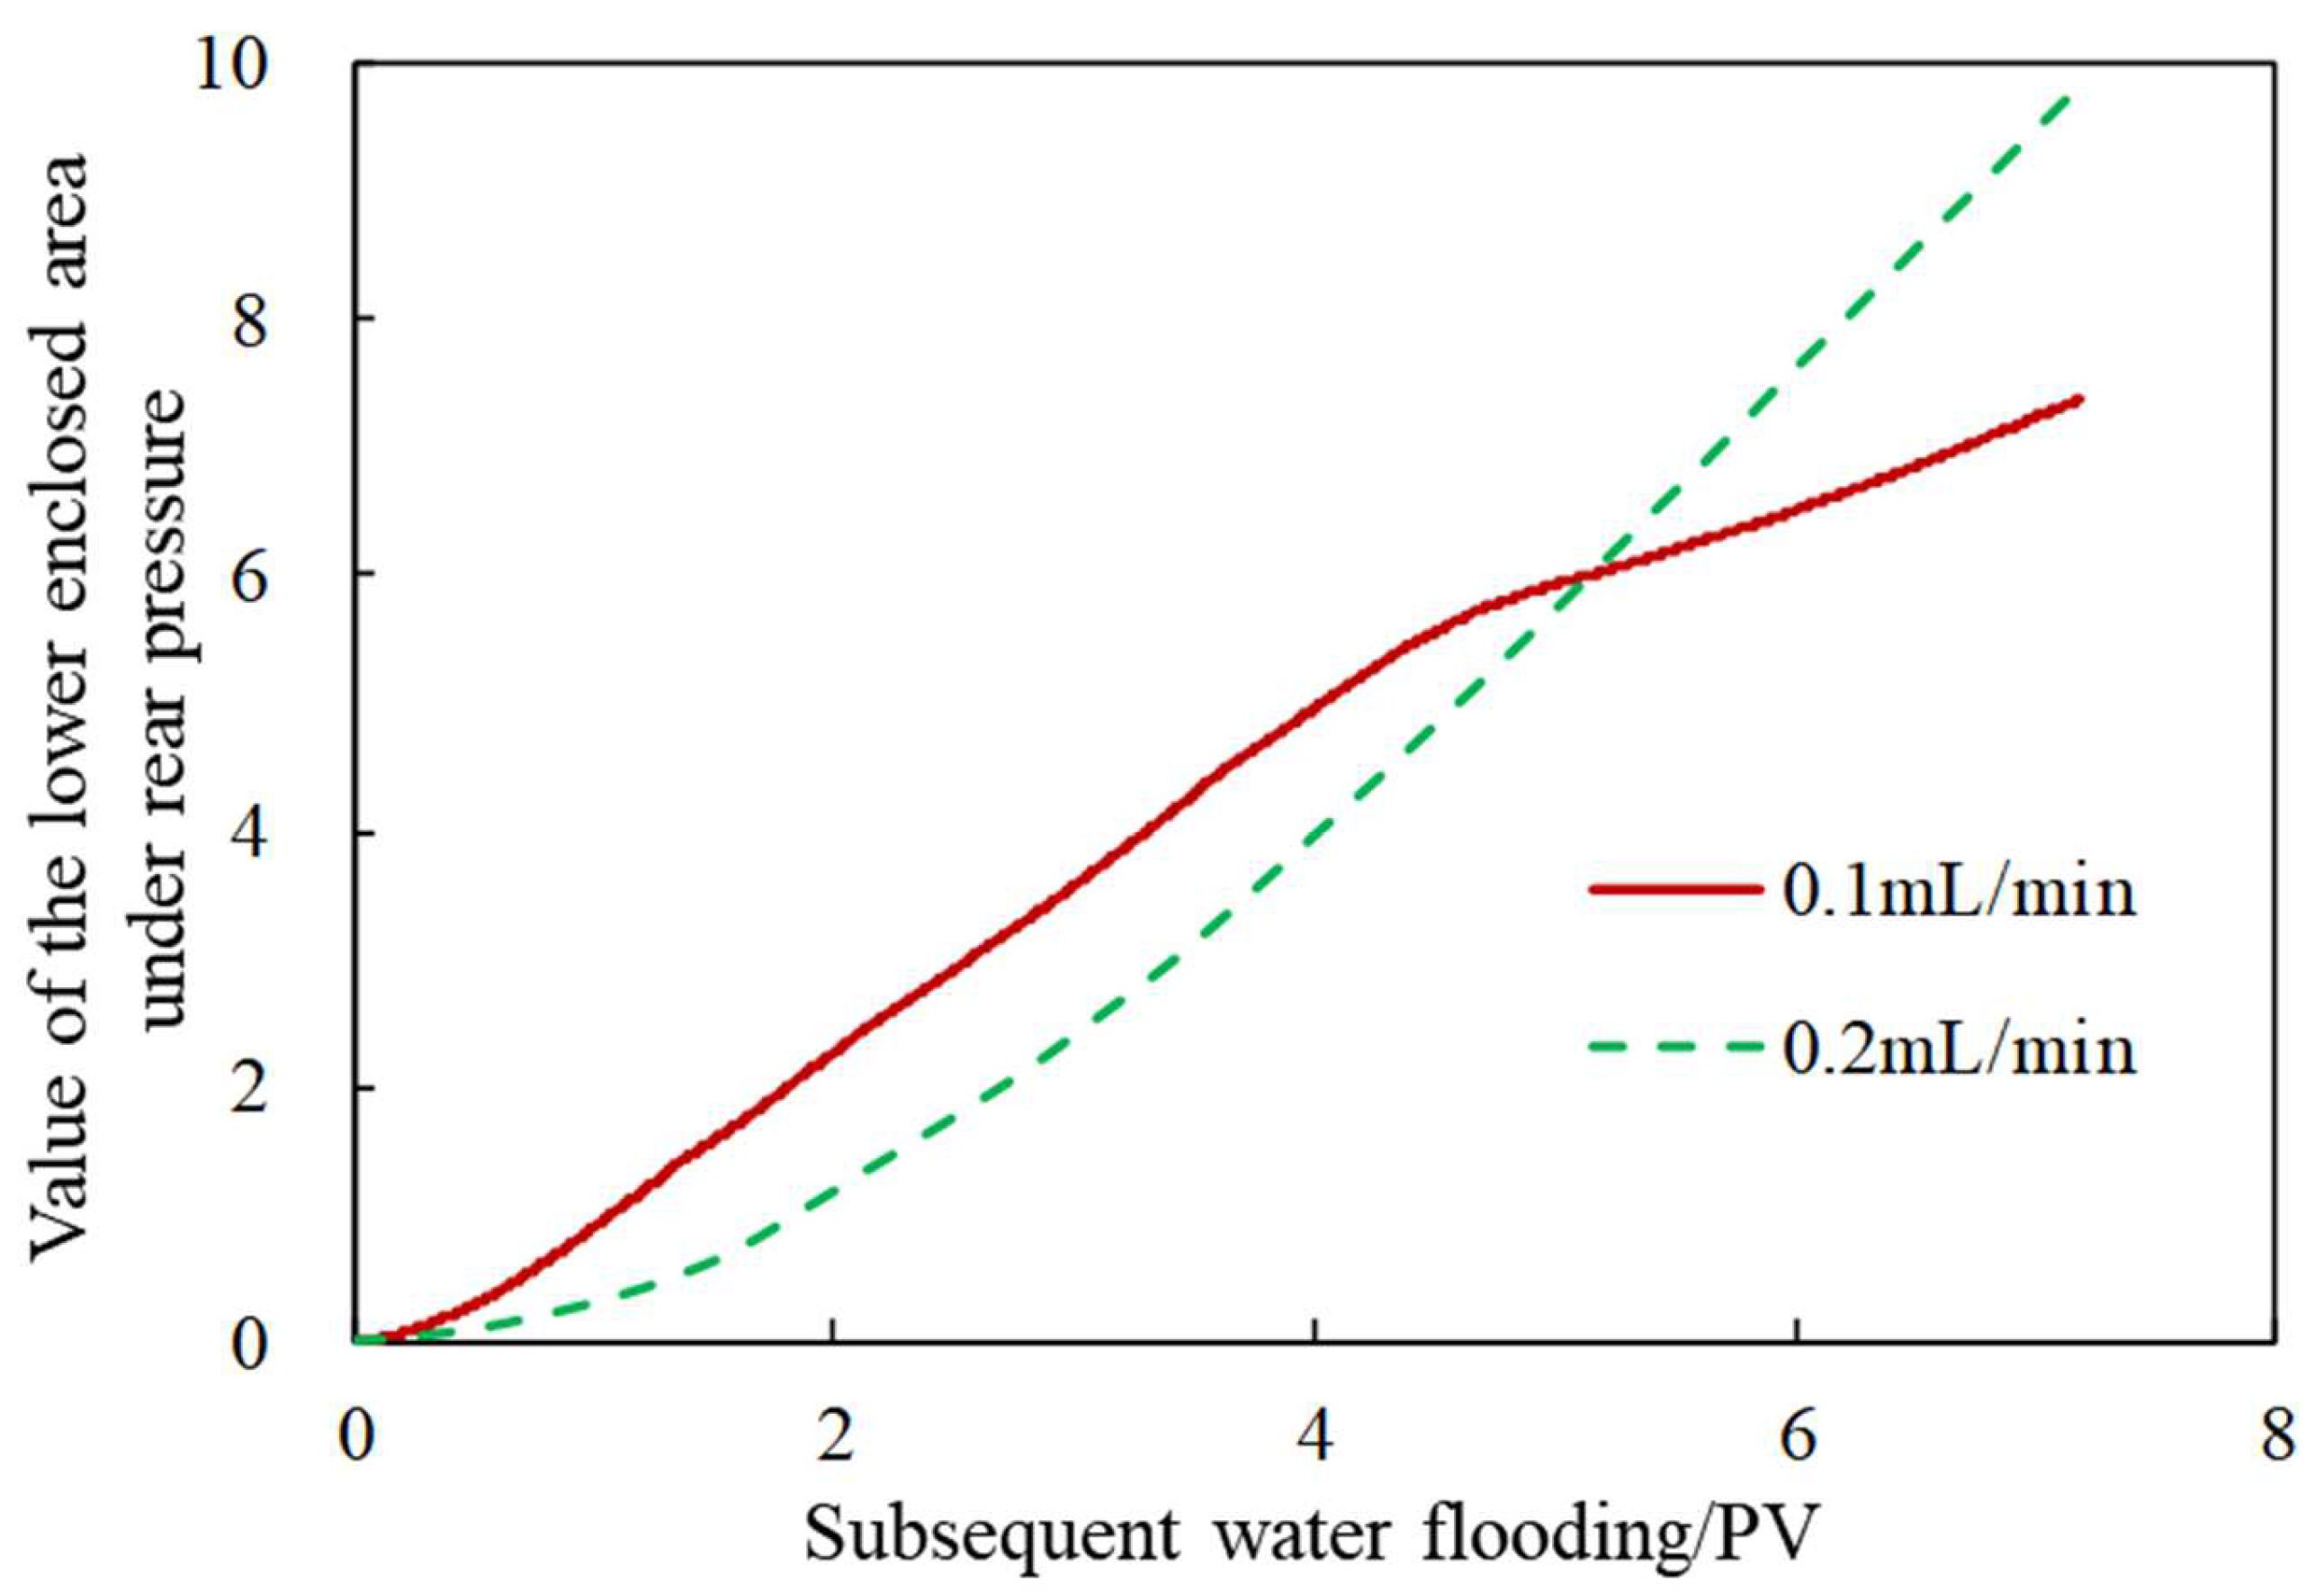
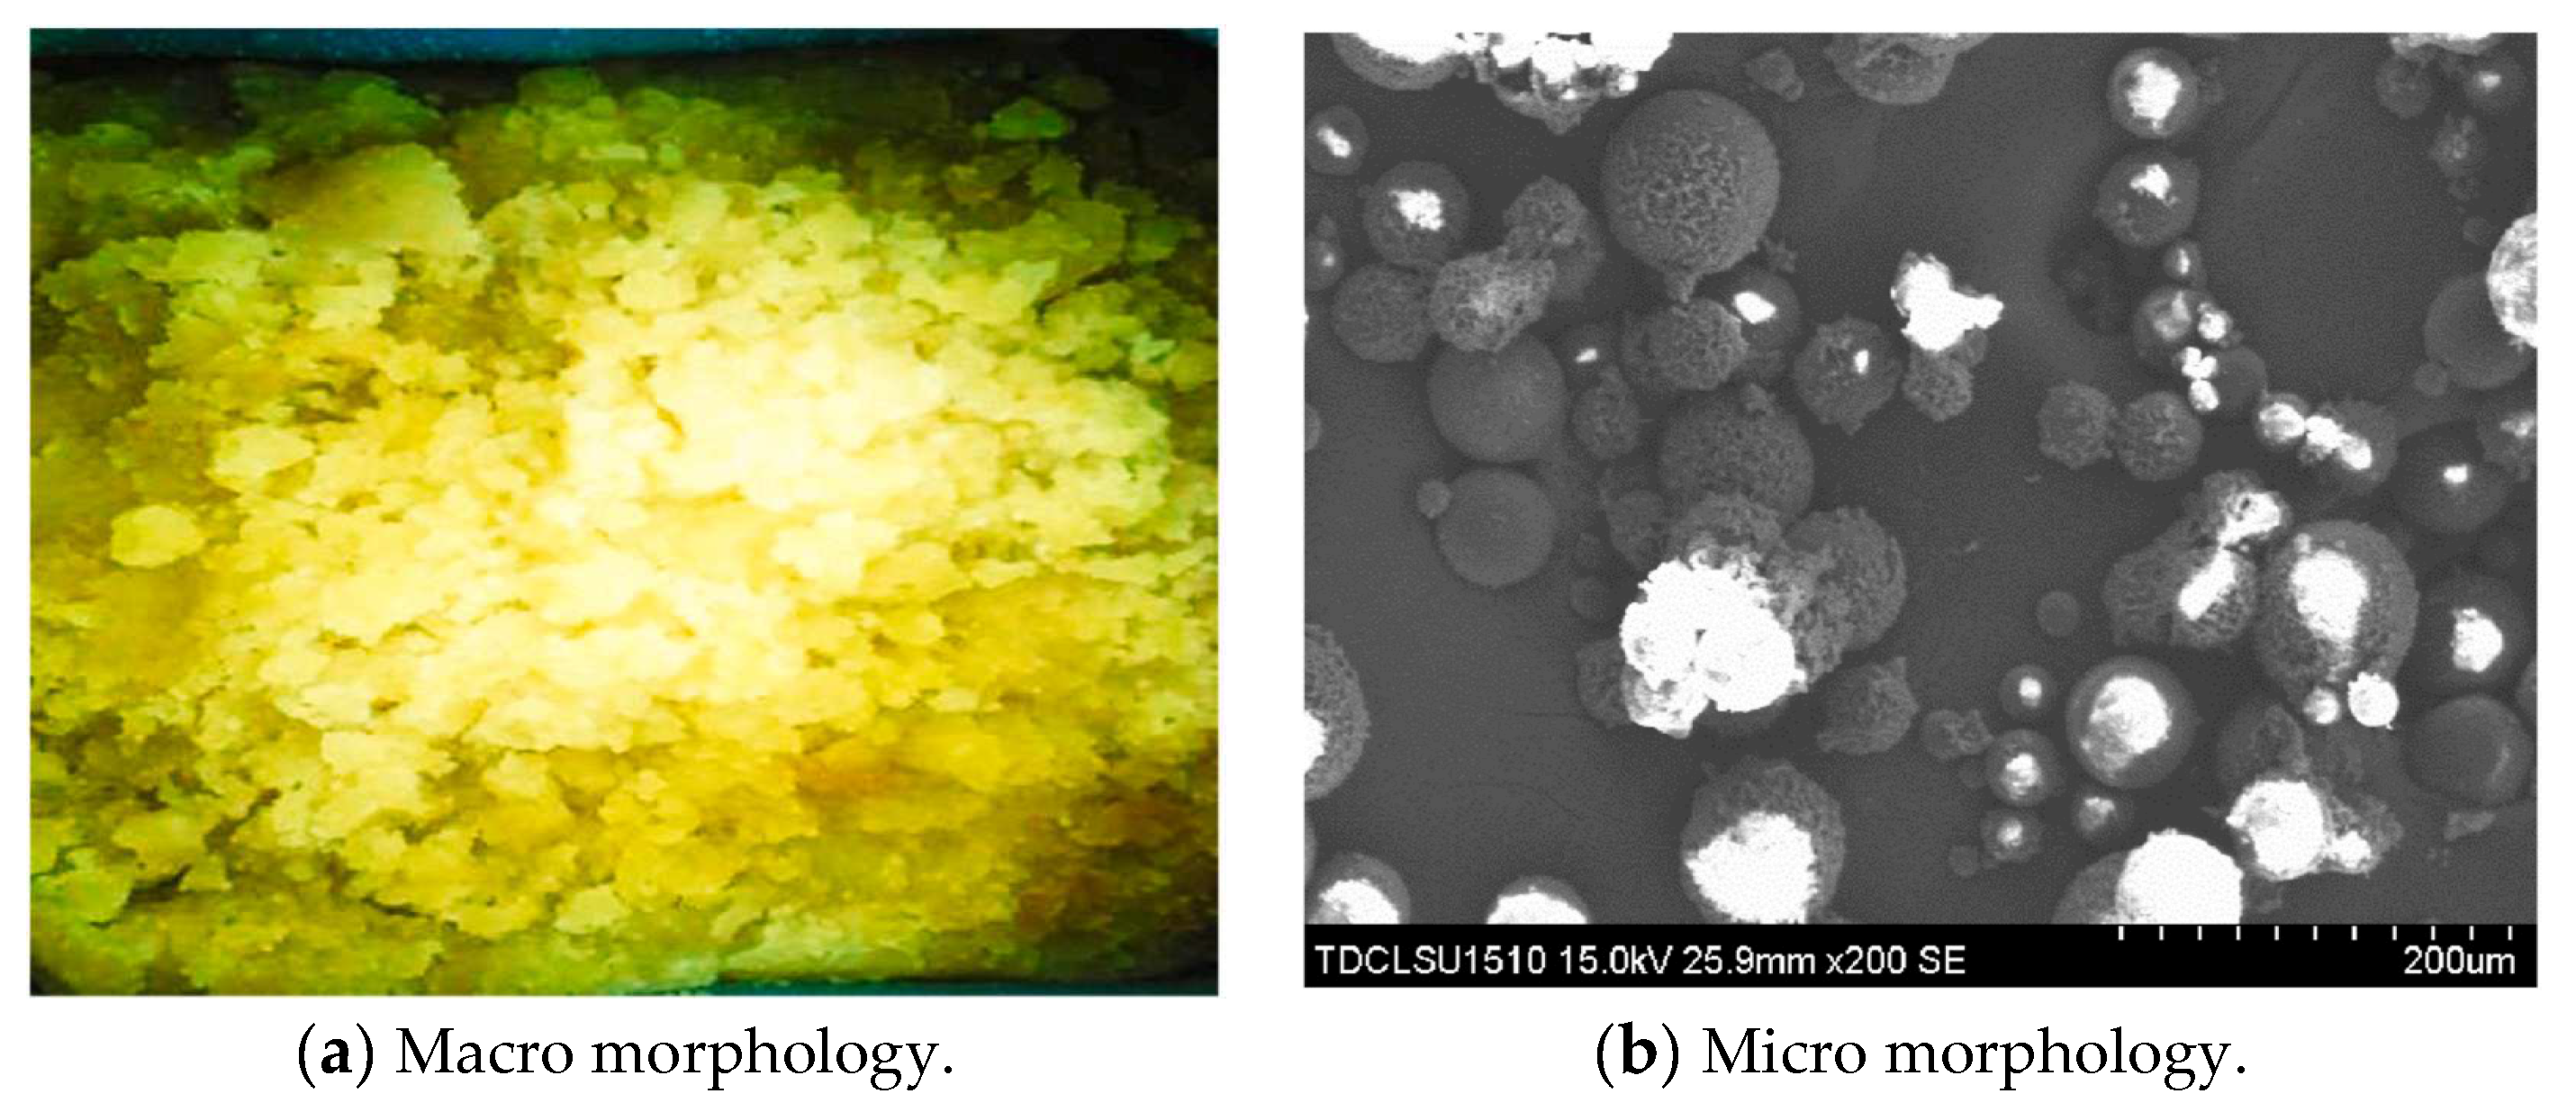
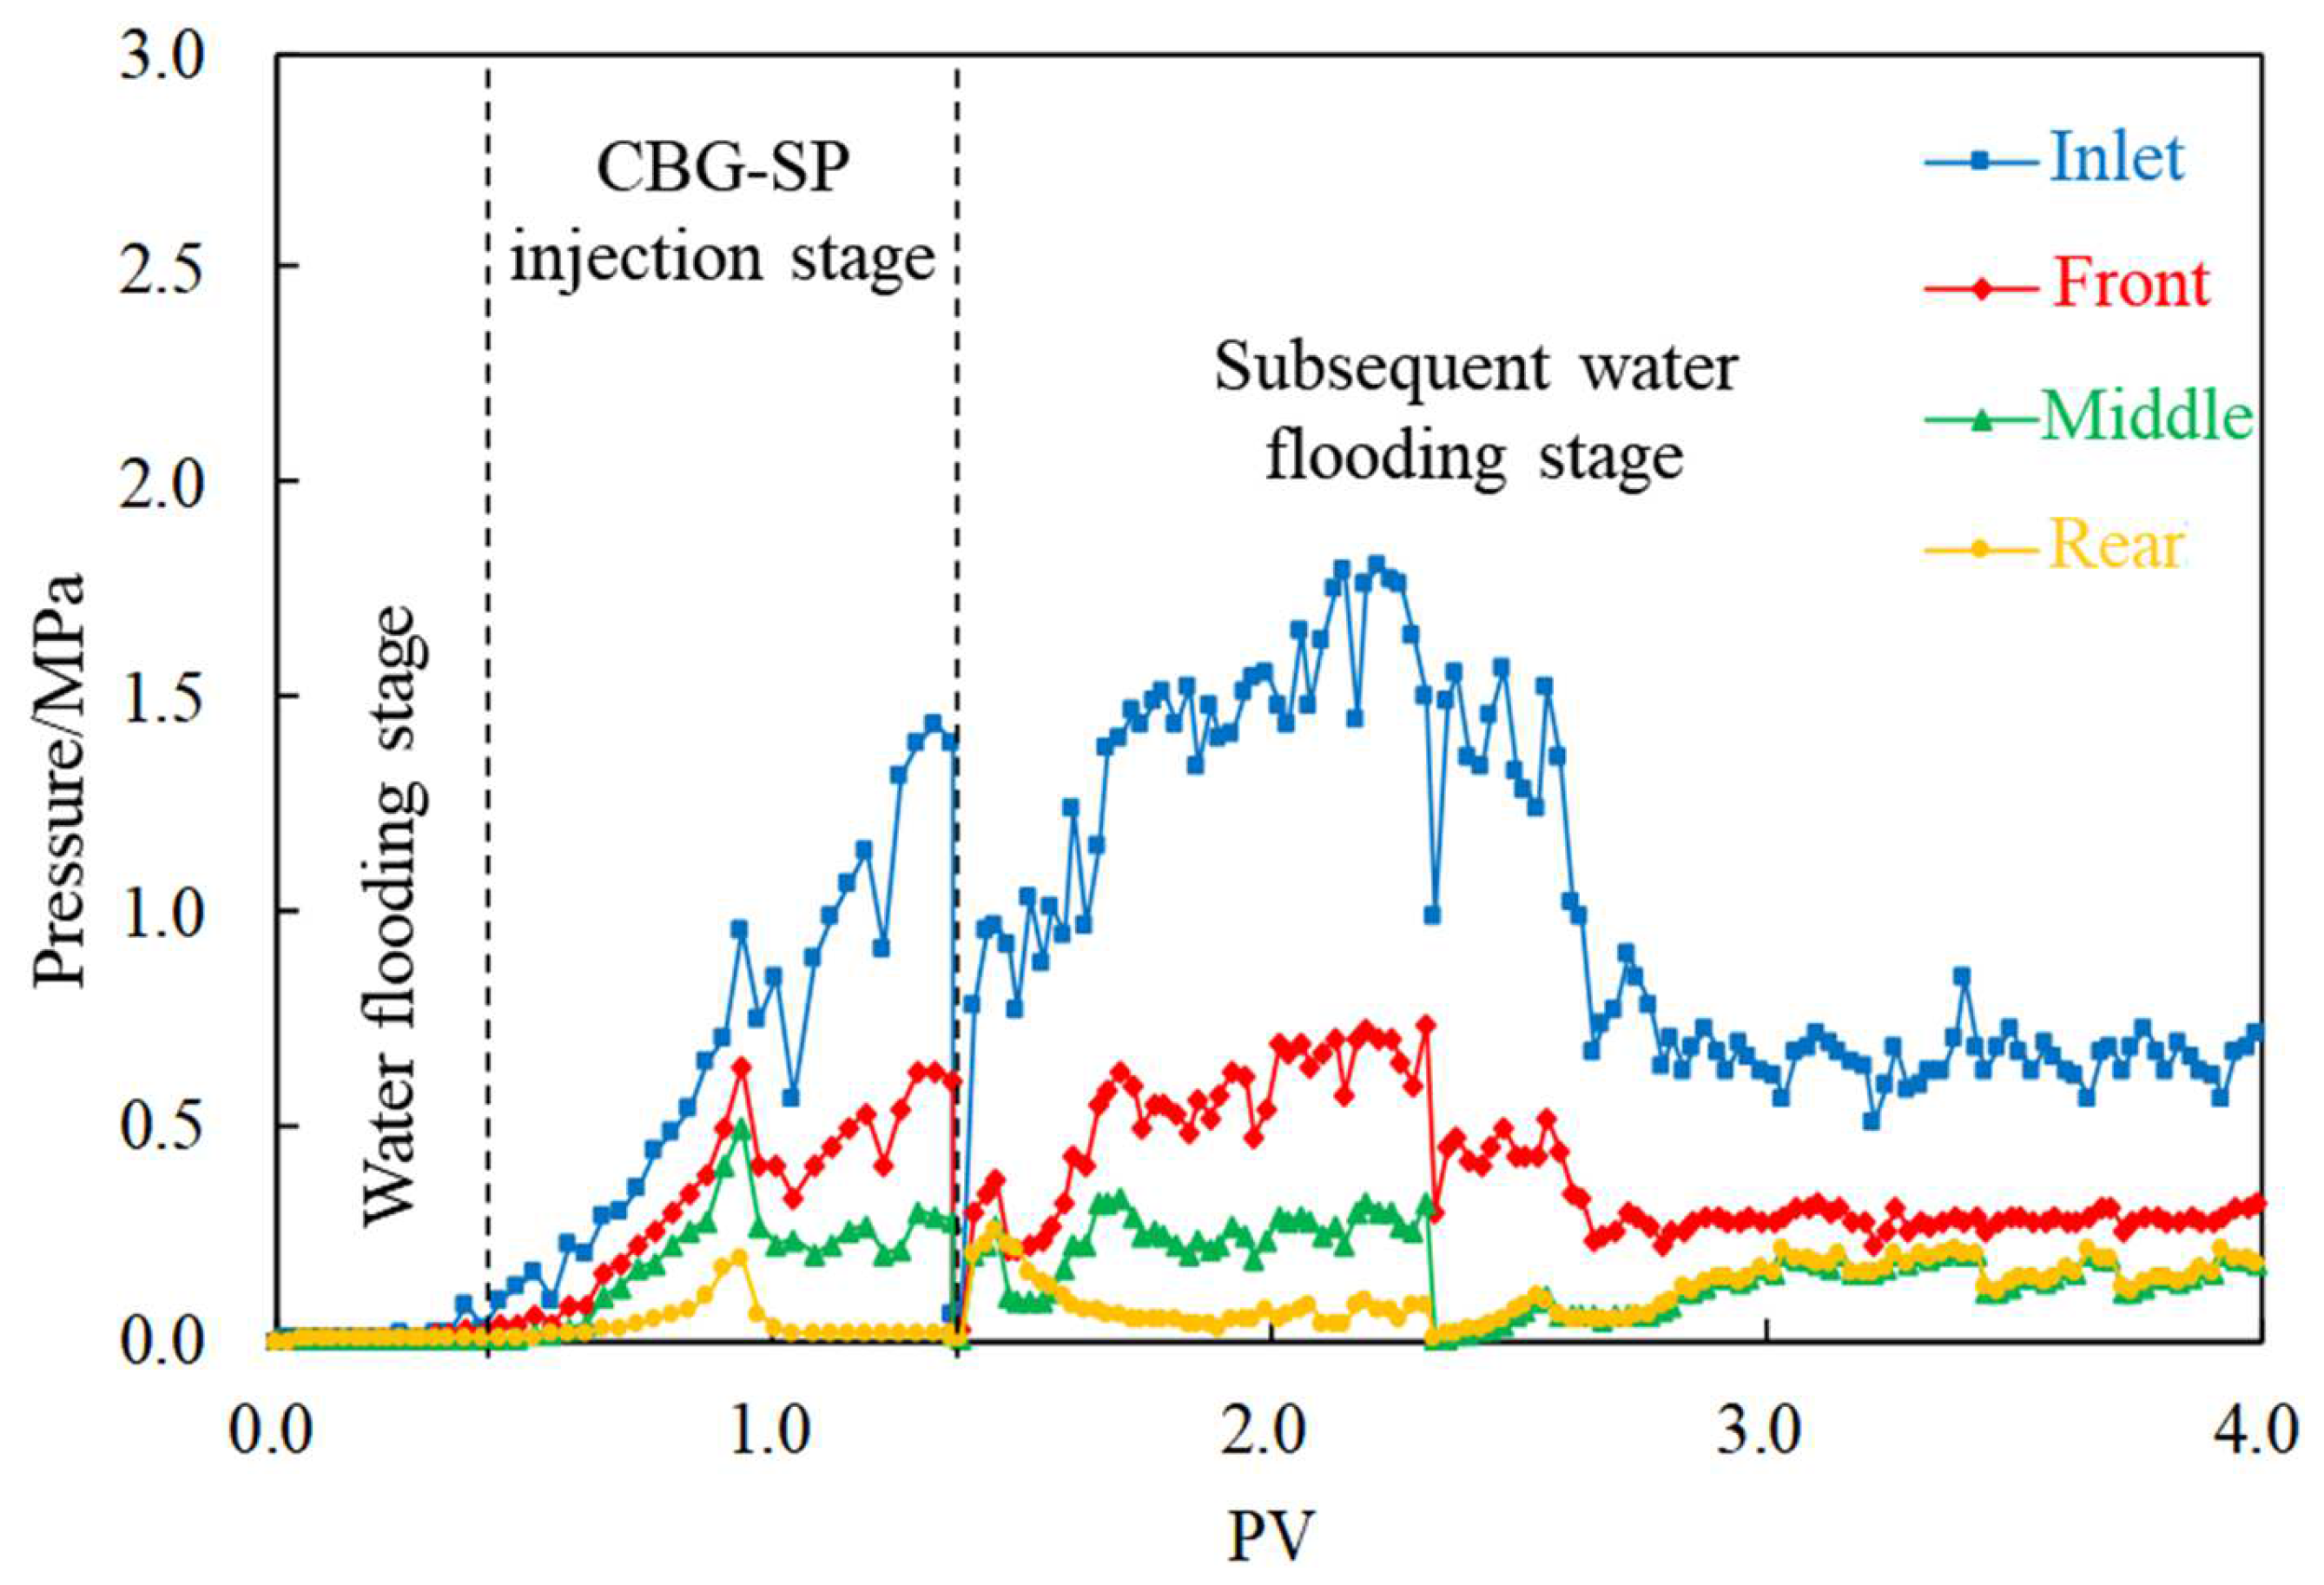
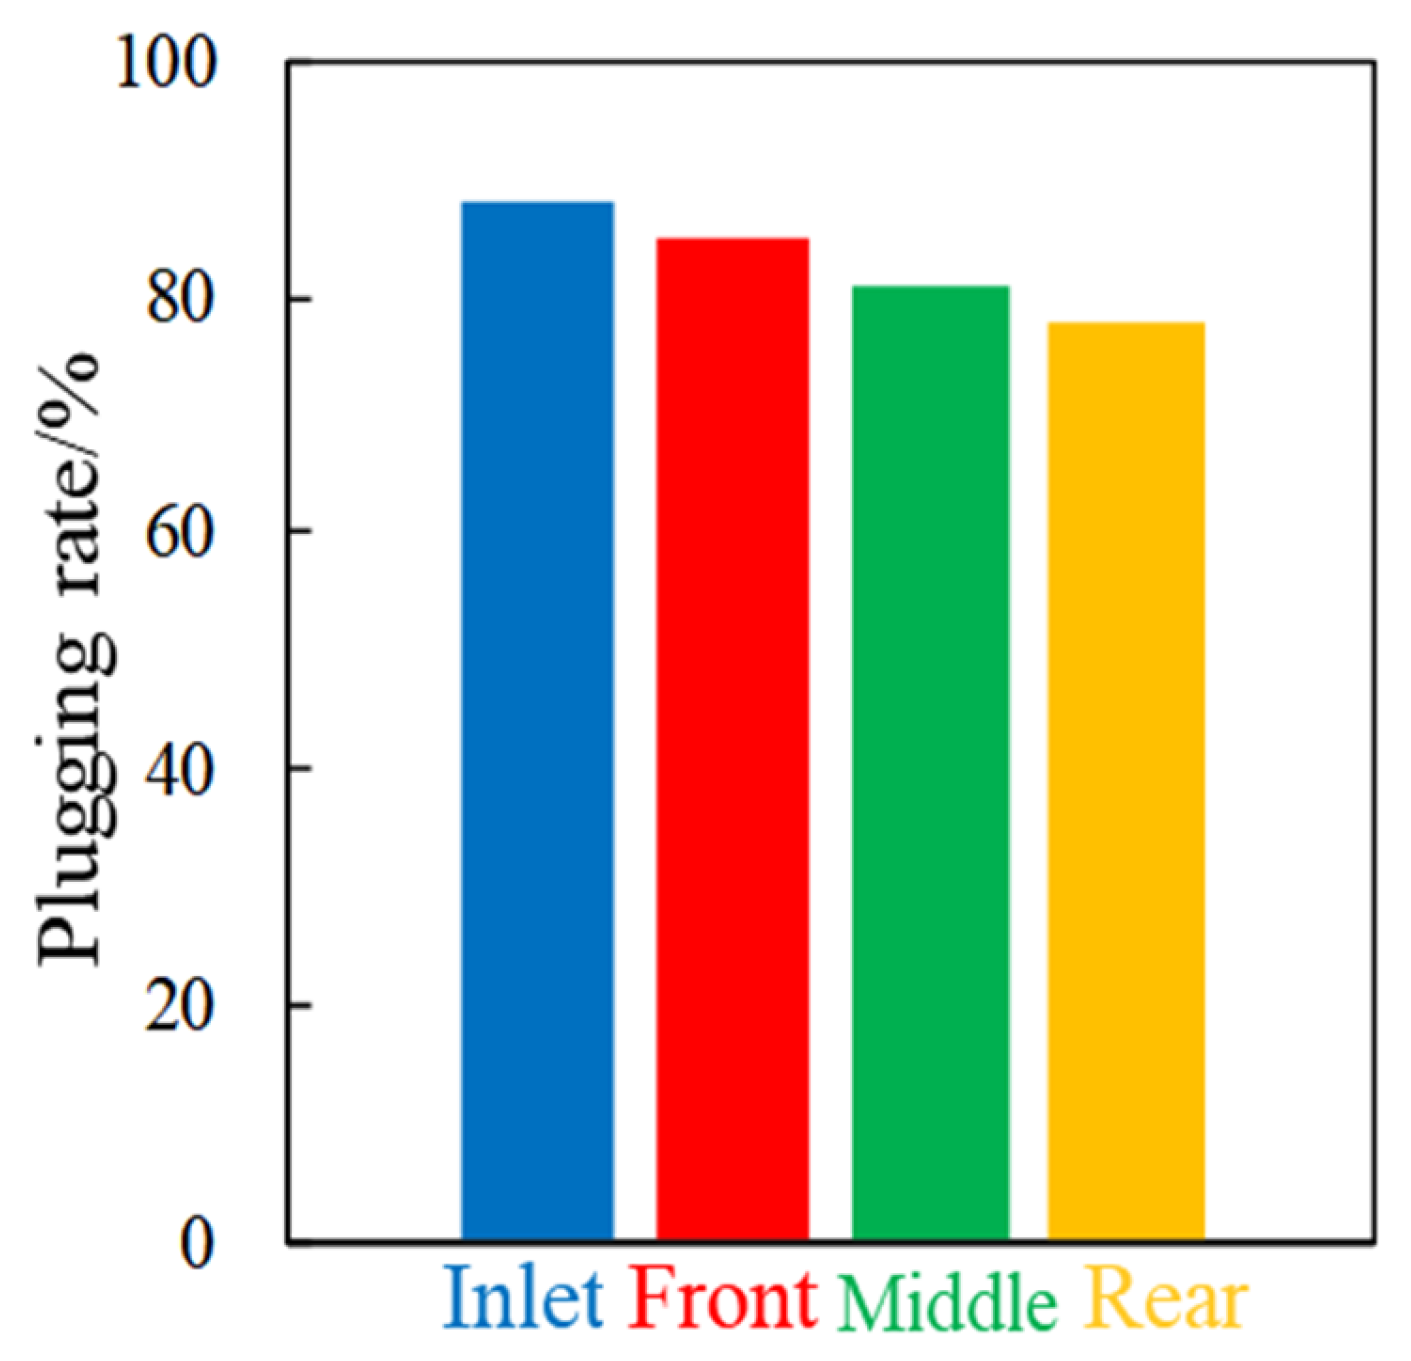
2.3. Cross-Linked Bulk Gel and Swelling Particle (CBG-SP)
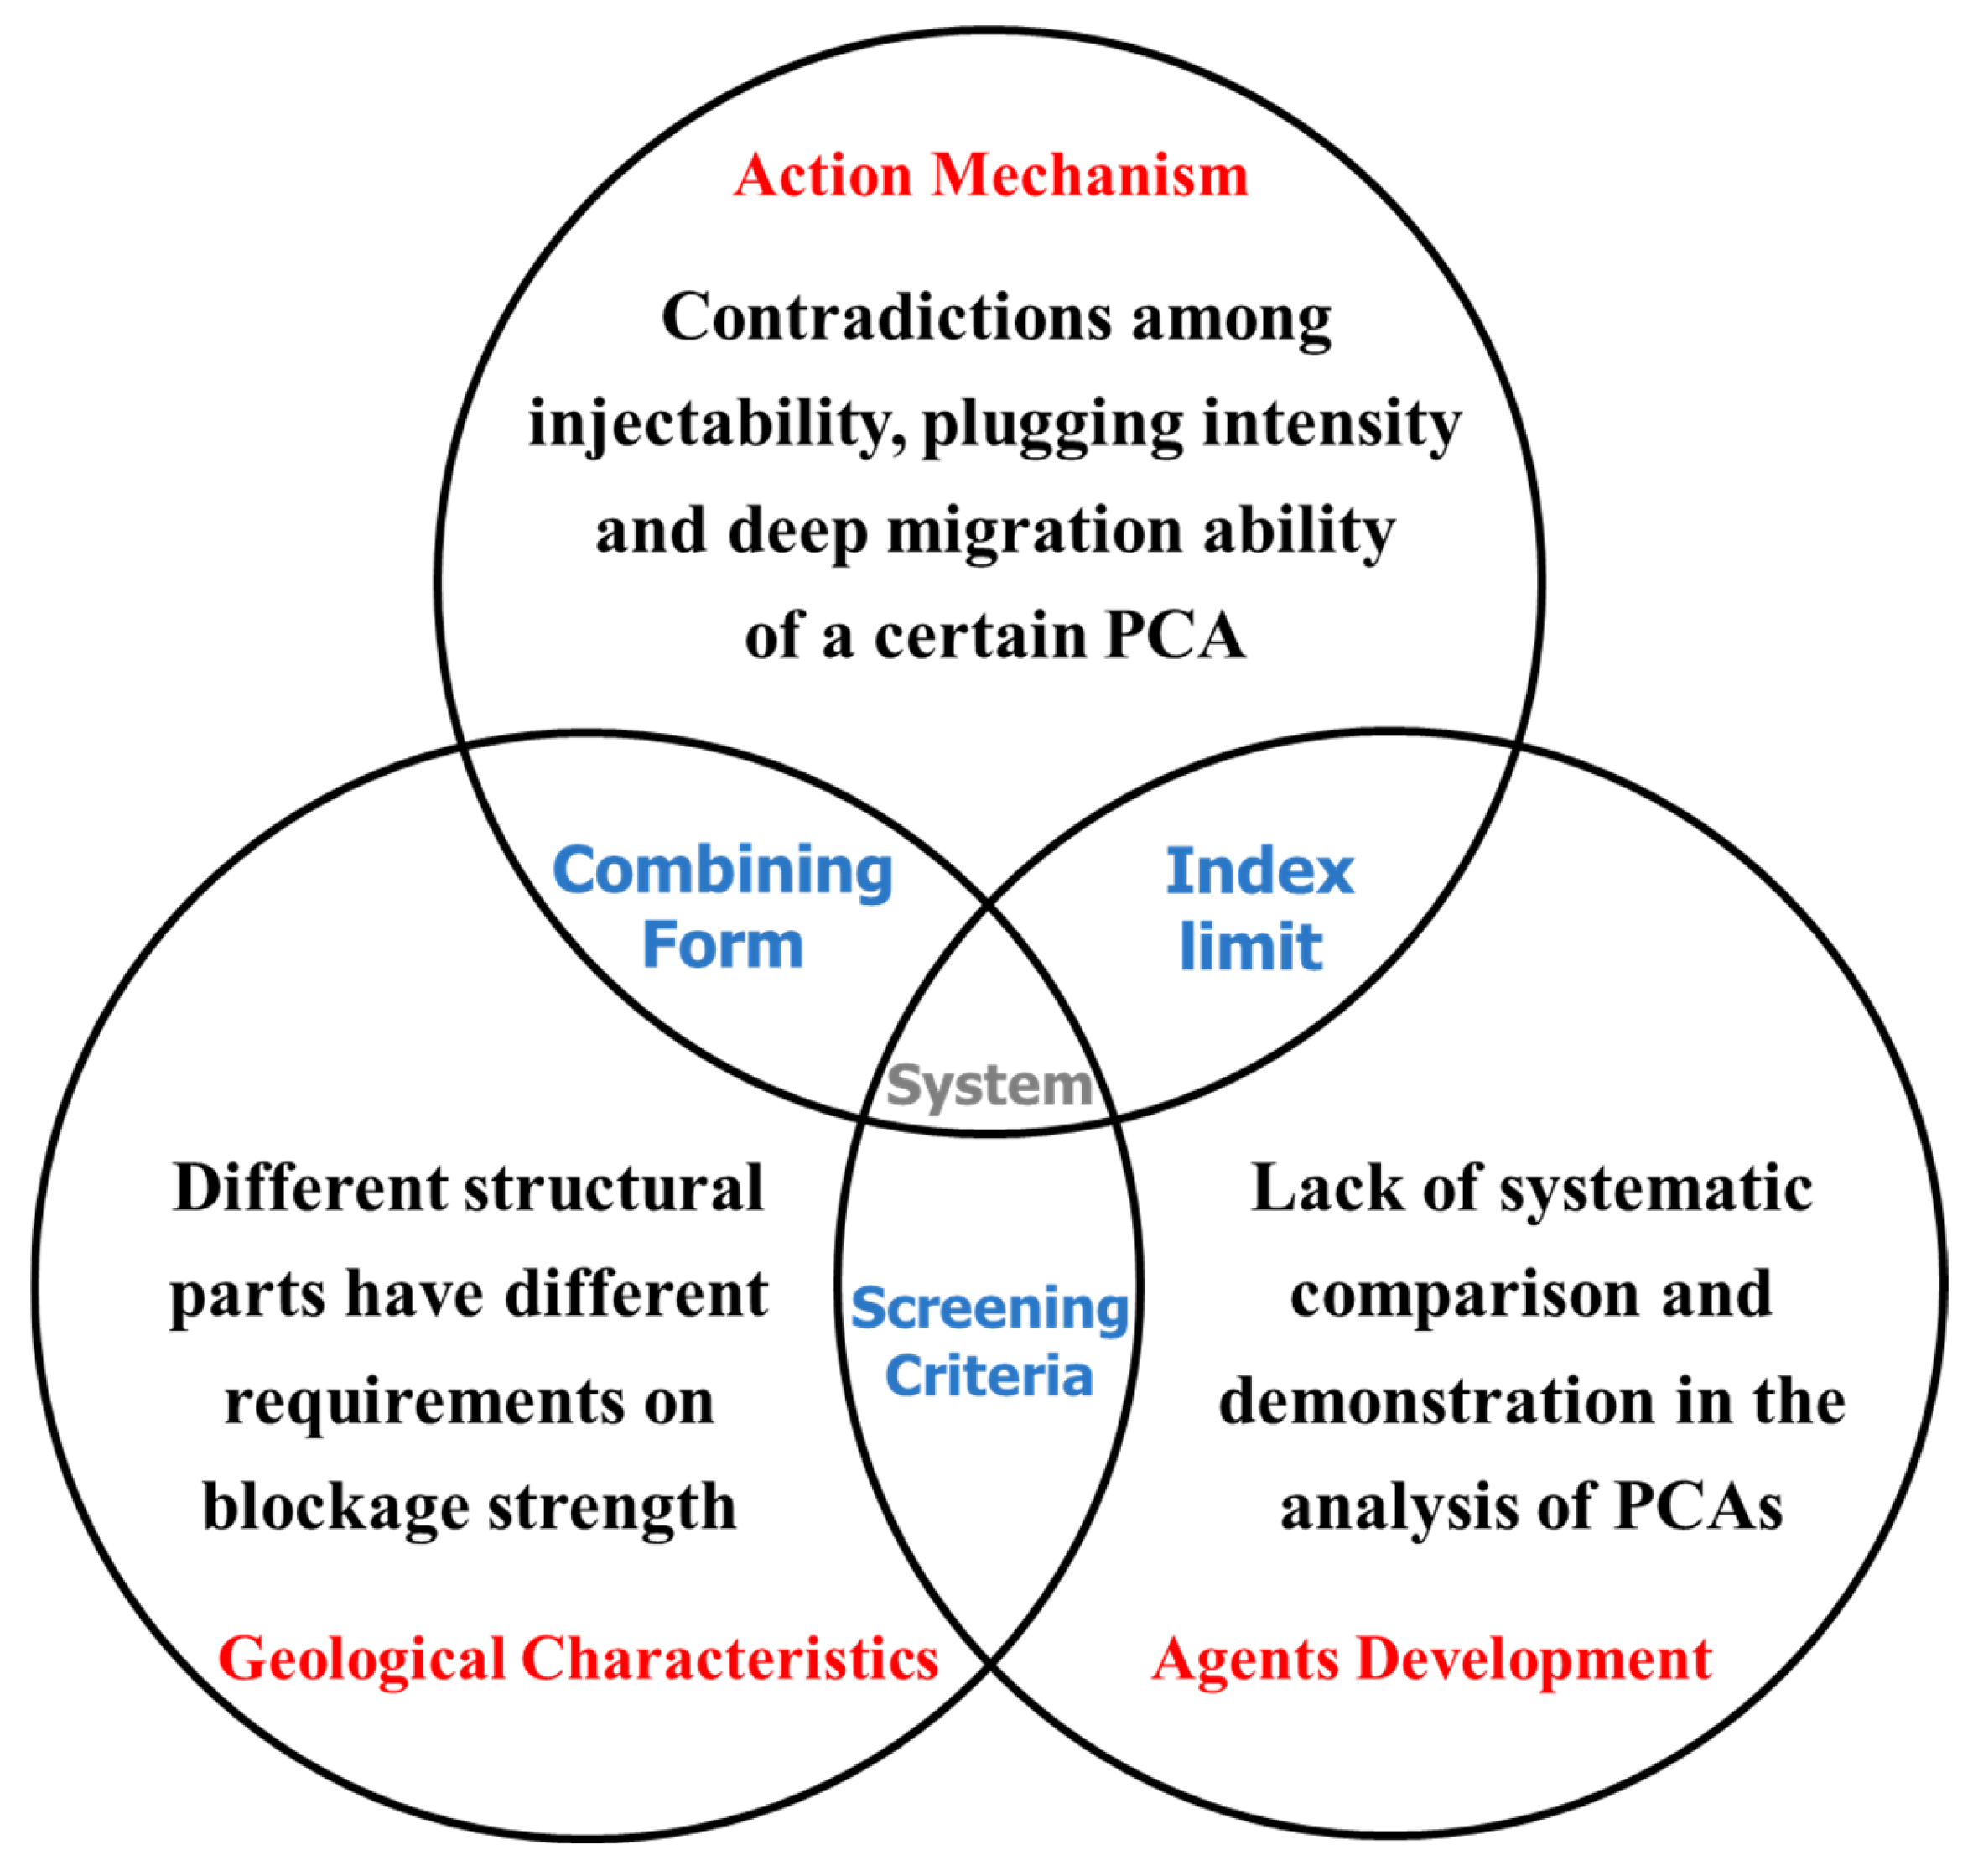
2.4. Application Criteria
2.4.1. Type Selection of PCAs
- (1)
- After a long period of production and development, the well (inner zone) has a very high permeability value, which can play the high intensity characteristics of CBG, allowing it can play the role of “blocking” near the borehole. SP has good shear resistance and elasticity, which can be used to adjust the water injection profile in borehole zones, so as to take the effect of “controlling”. The slug combination of CBG and SP can be used to block fractures.
- (2)
- In the depth of wells (outer zone), the permeability decreases significantly, and the in-depth displacing is very important. It is necessary to use nanospheres with low viscosity and good injectability to give full play to the advantages of controllable particle size and adjustable expansion multiple, and select appropriate particle size for matching, and migrate to the deep formation step by step for profile control.
- (3)
- As a bridge between inner and outer zones, PEG forms a physical barrier relying on high temperature resistance, salt resistance, good injectability and dispersion, playing the effect of “blocking and controlling”.
2.4.2. Parameters Matching
3. Conclusions
- (1)
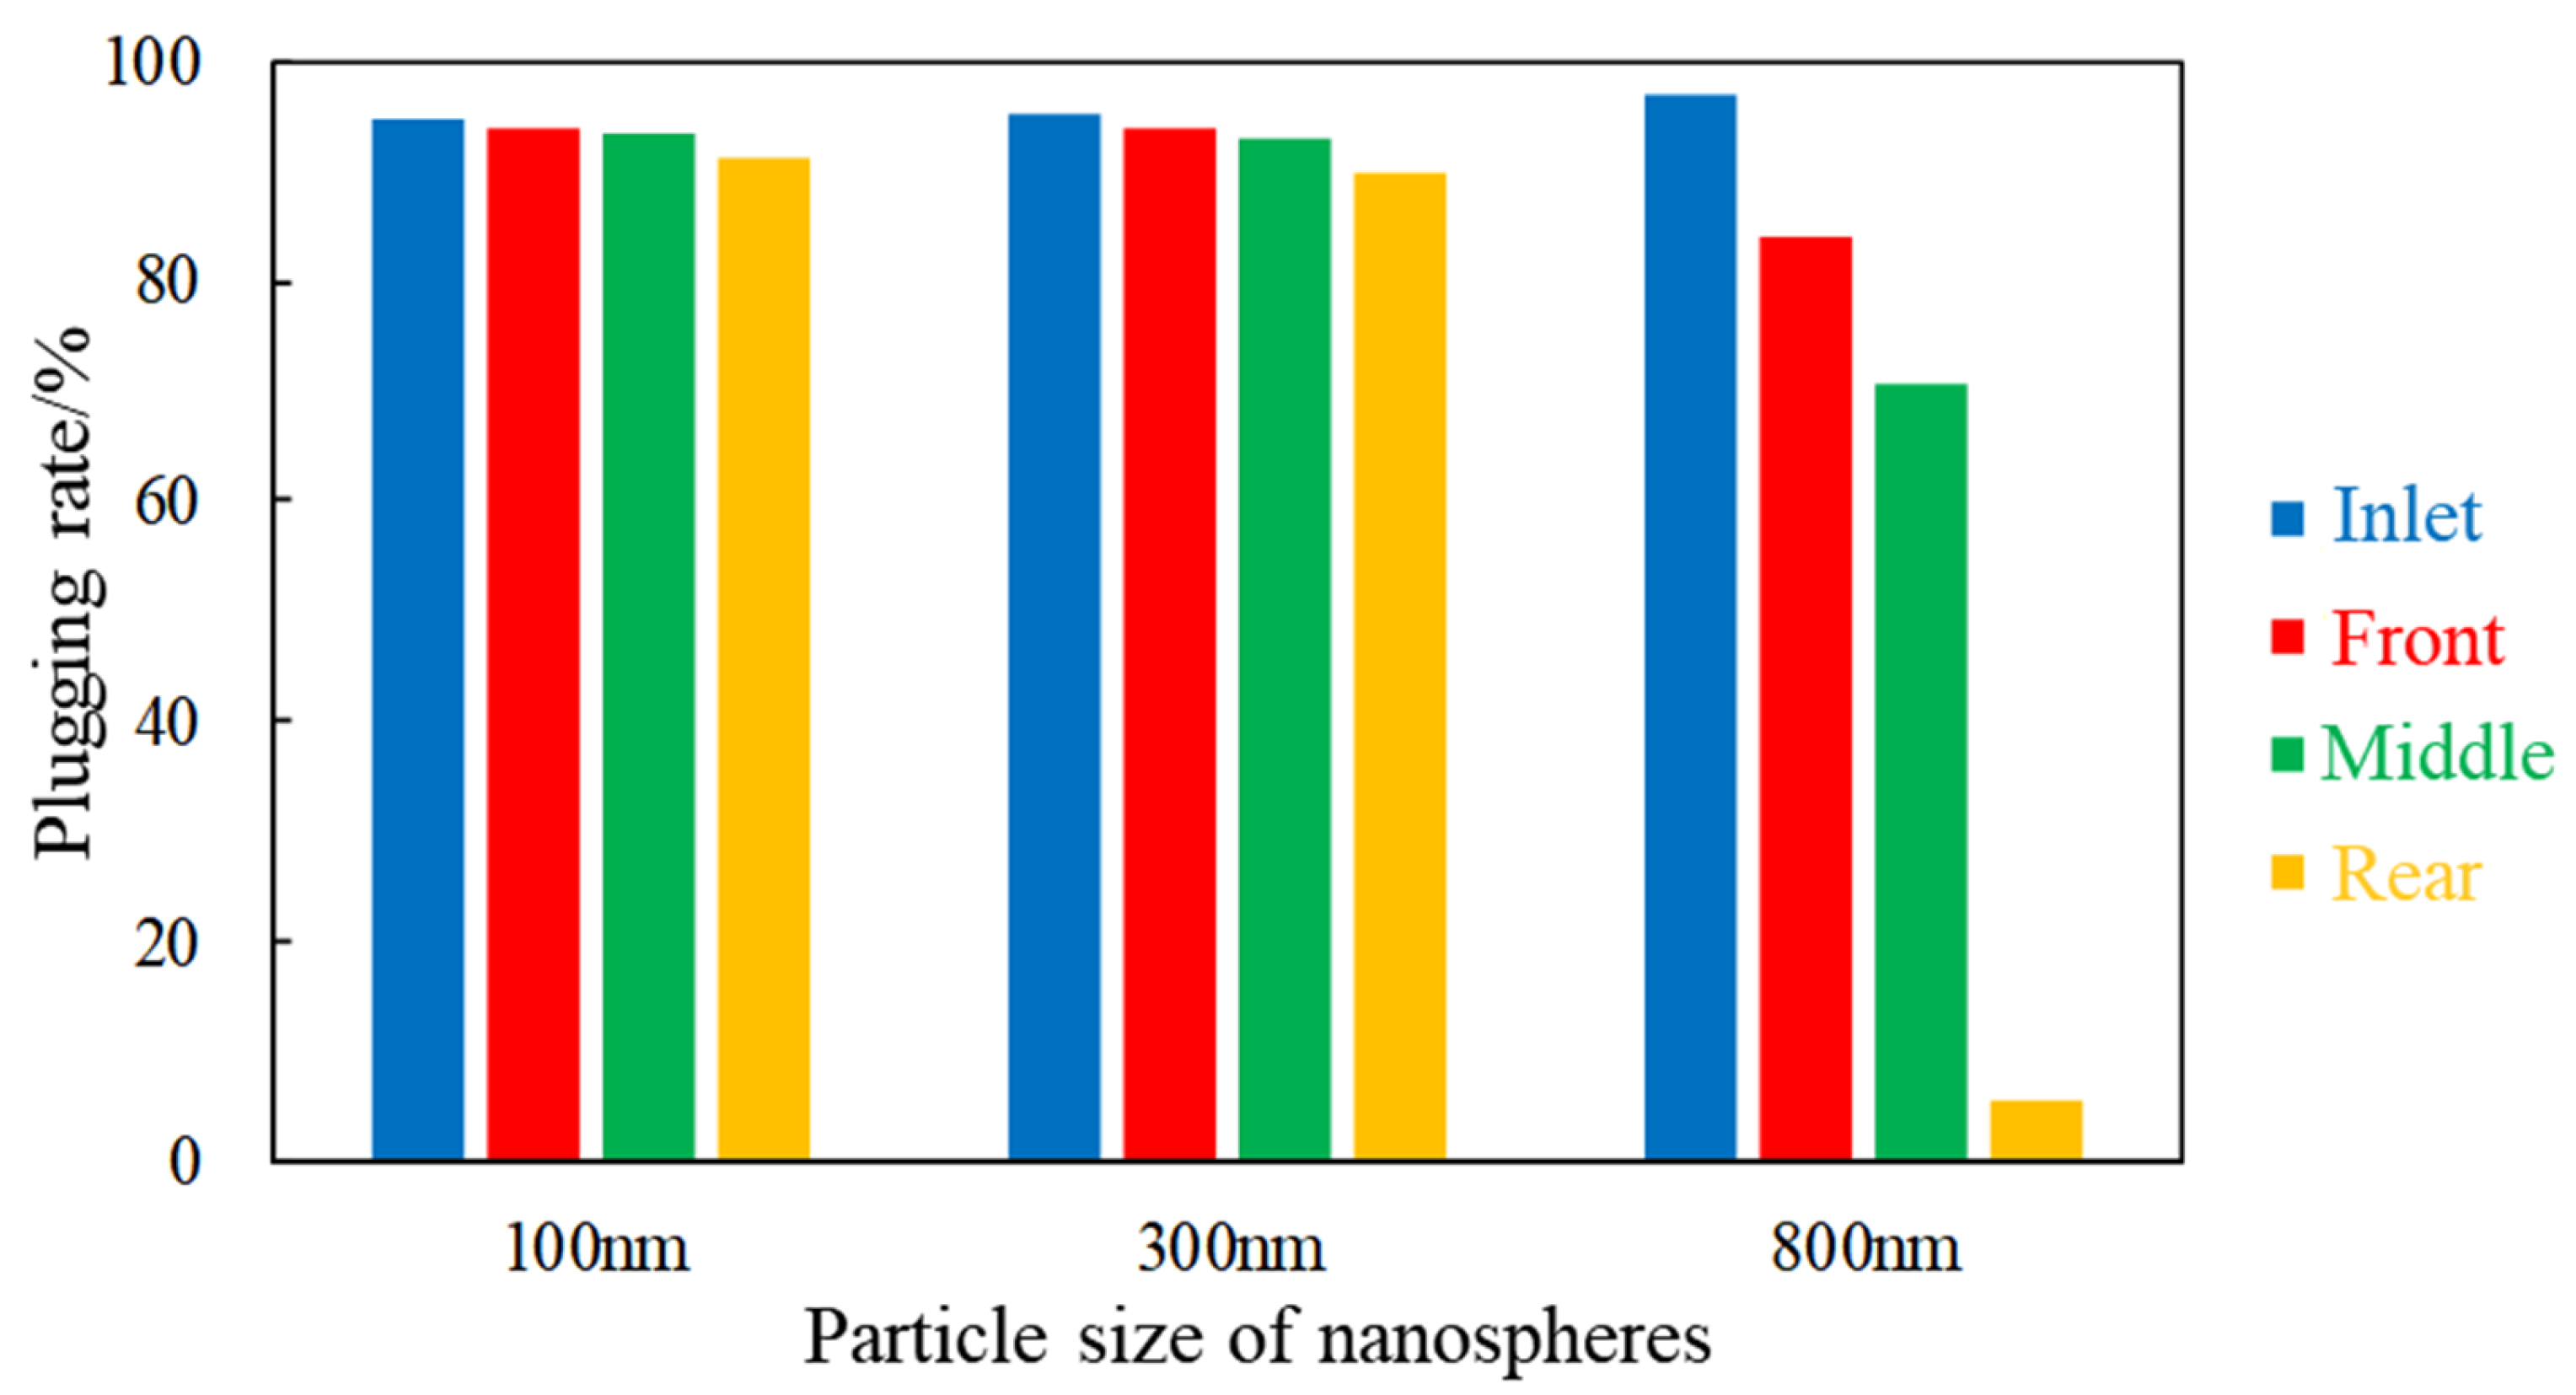
- The experimental results of nanospheres show that the particle size is an important factor affecting the effect of profile control in the low-permeability fractured reservoirs. Among the nanospheres with three different sizes that are selected in this paper, small particles (100 nm) show relatively excellent profile control effect. The reasonable injection parameters in technology are as follows: the injection rate is 0.3 mL/min, the injection volume is 0.4–0.5 PV, the injection concentration is about 0.4%.
- (2)
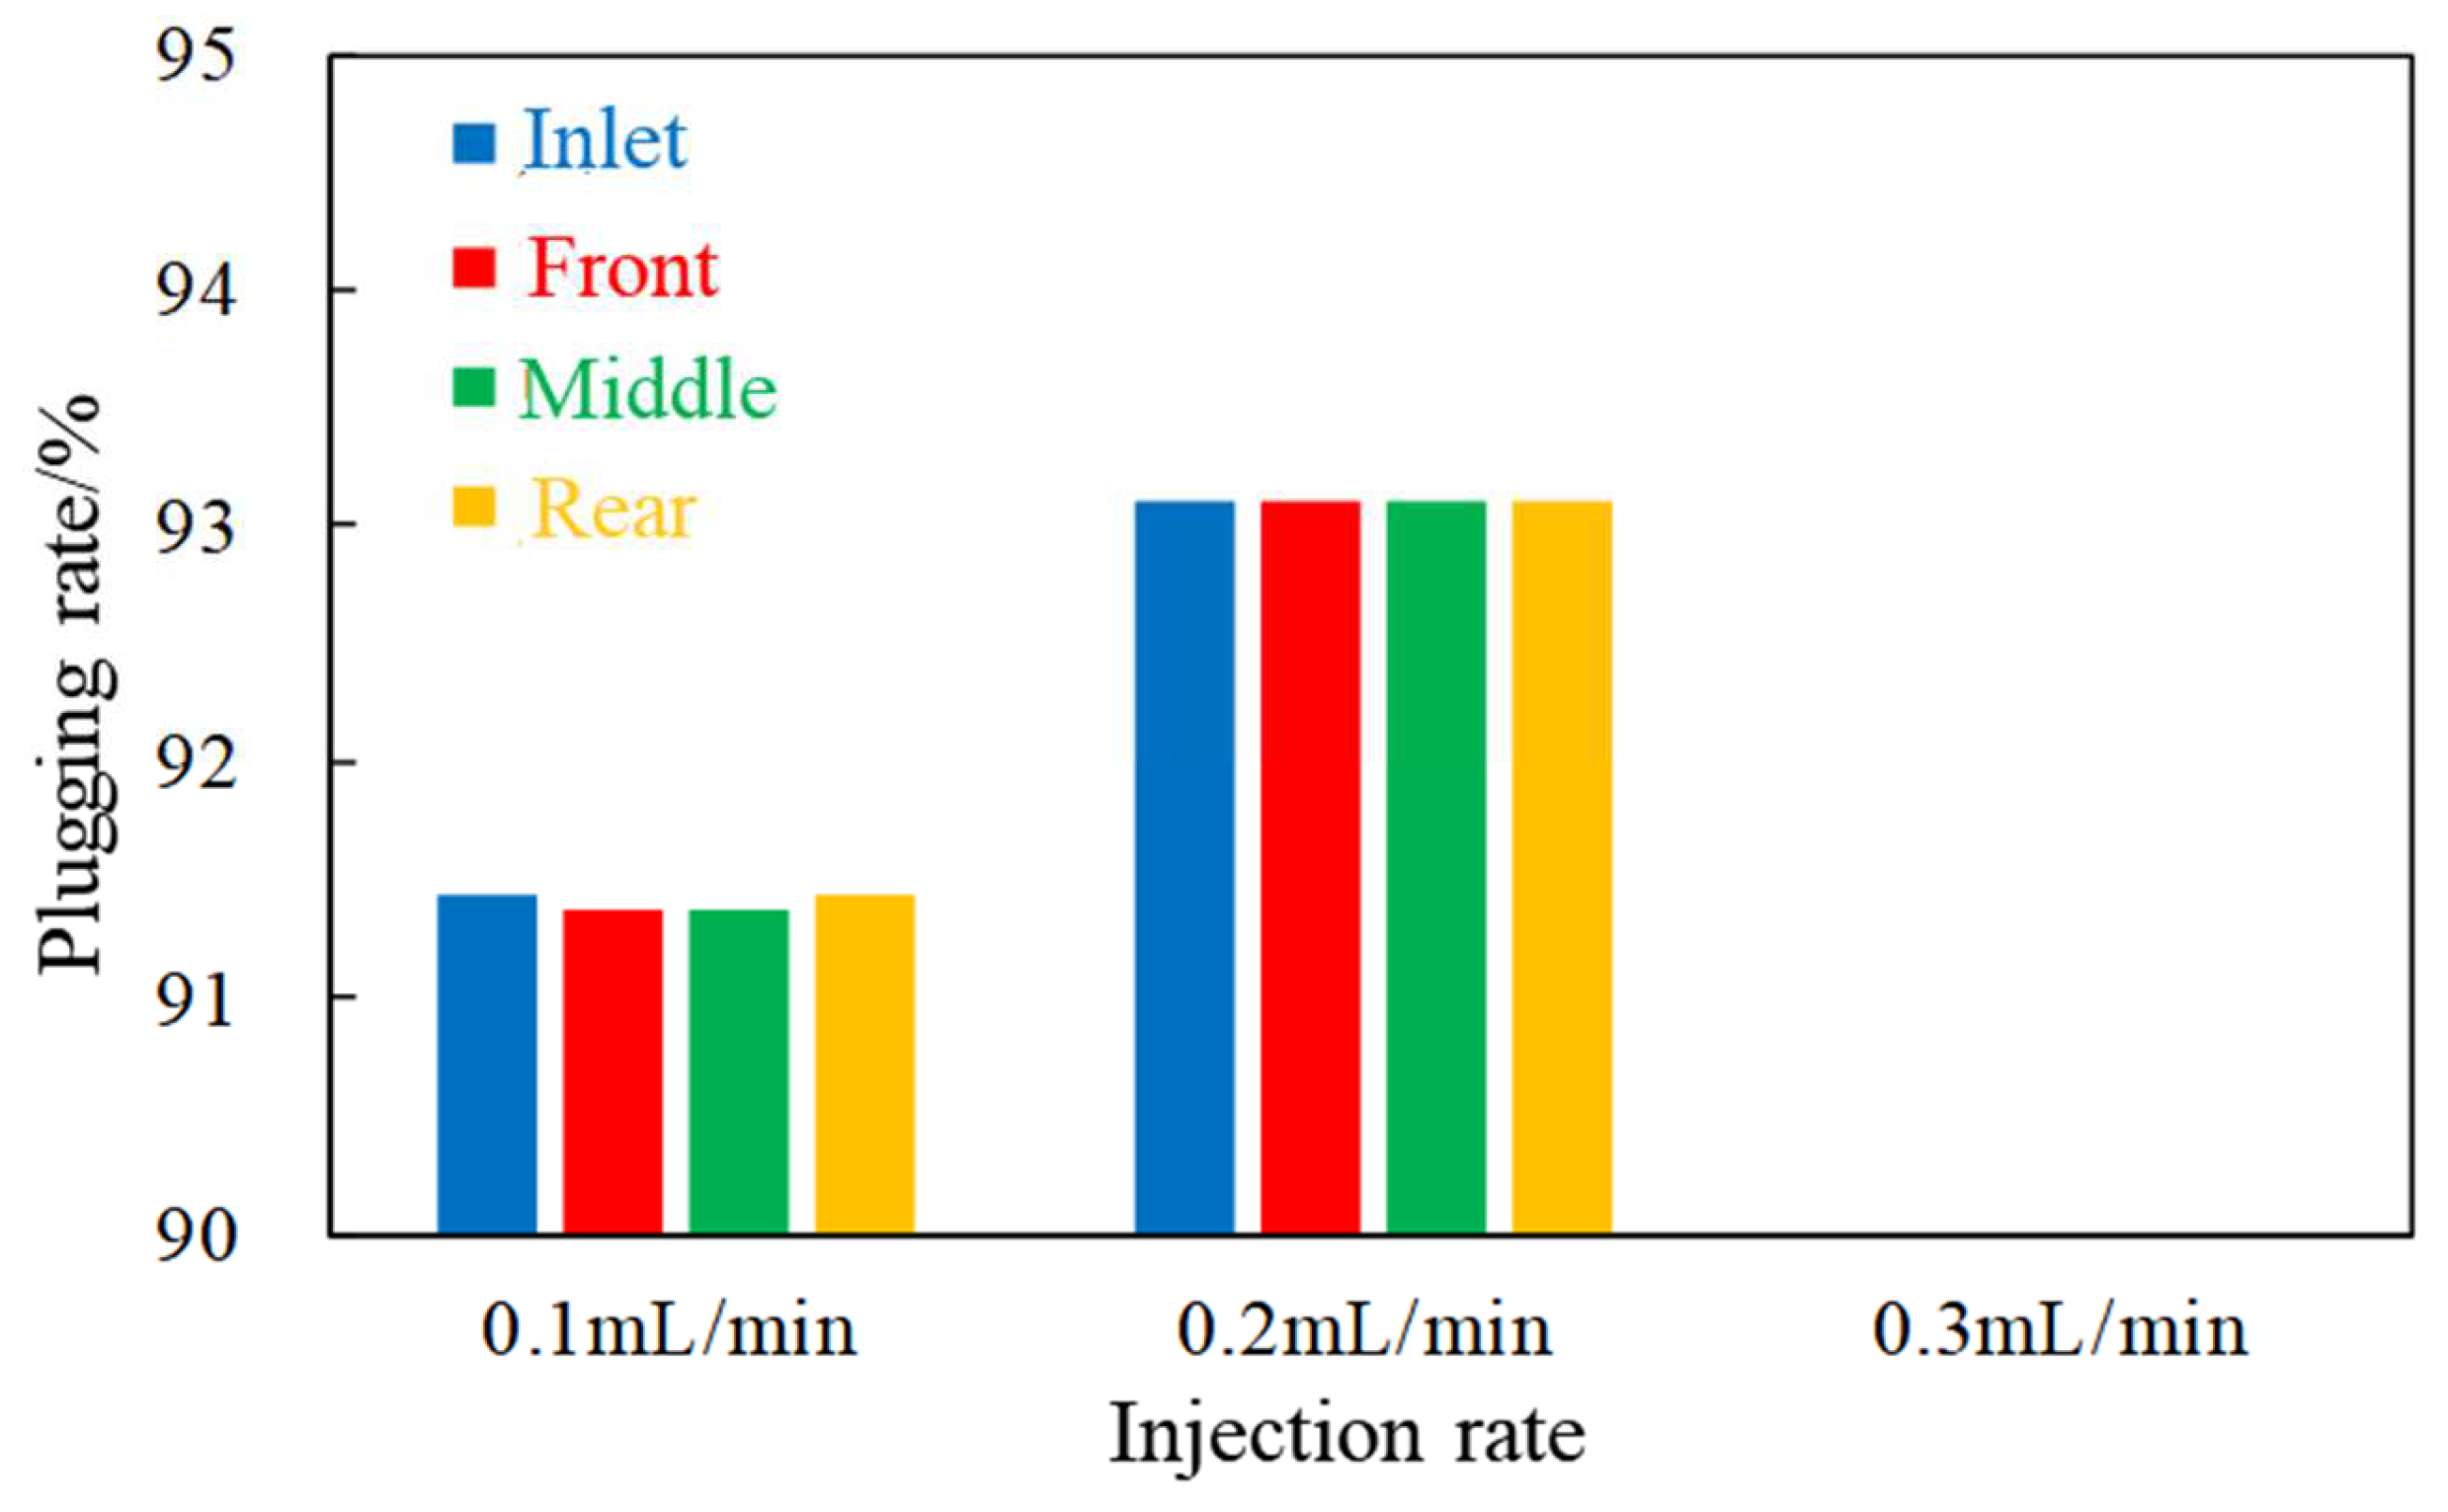
- The experimental results of PEG show that PEG is suitable to play the role of “blocking and controlling” in the low-permeability fractured reservoirs. The reasonable injection parameters in technology are as follows: the injection rate is 0.2 mL/min, the injection volume is 0.8–1.0 PV, the injection concentration is 0.5%, among which the injection rate has a significant impact on the effect of this kind of agent.
- (3)
- The experimental results of CBG-SP show that this system can achieve the effect of “blocking and displacing” near the well zone in the low-permeability fractured reservoirs. The reasonable injection parameters in technology are as follows: the injection rate is 0.3 mL/min, the injection volume is 1.0 PV, the injection concentration of CBG is 0.2% HPAM + 0.2% Cr3+ cross-linked agent, and the injection concentration of SP is 0.1% HPAM + 0.5% SP.
- (4)
- In the implementation of in-depth profile control, according to the actual situation of the well group, the slug form with nanospheres or PEG can be used as the main body, or the synergistic effect of all the four kinds of PCAs that are selected in this paper can be used as the composite slug, which are injected to further improve the effect of increasing oil production and reducing water cut.
4. Methodology
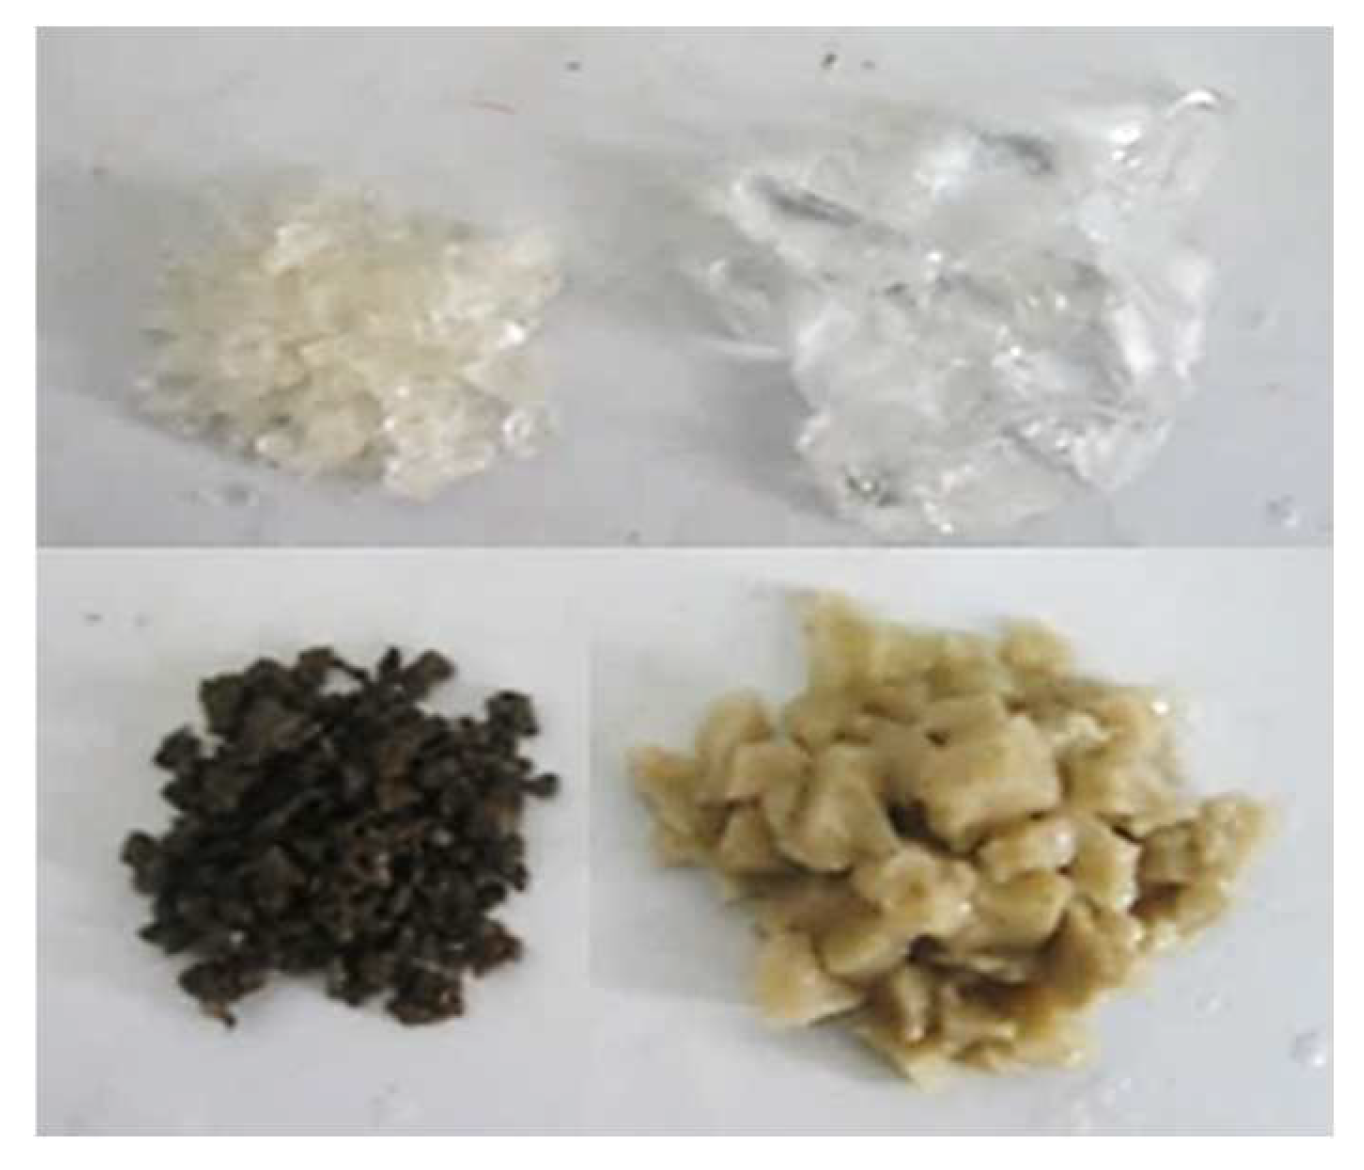
4.1. Materials
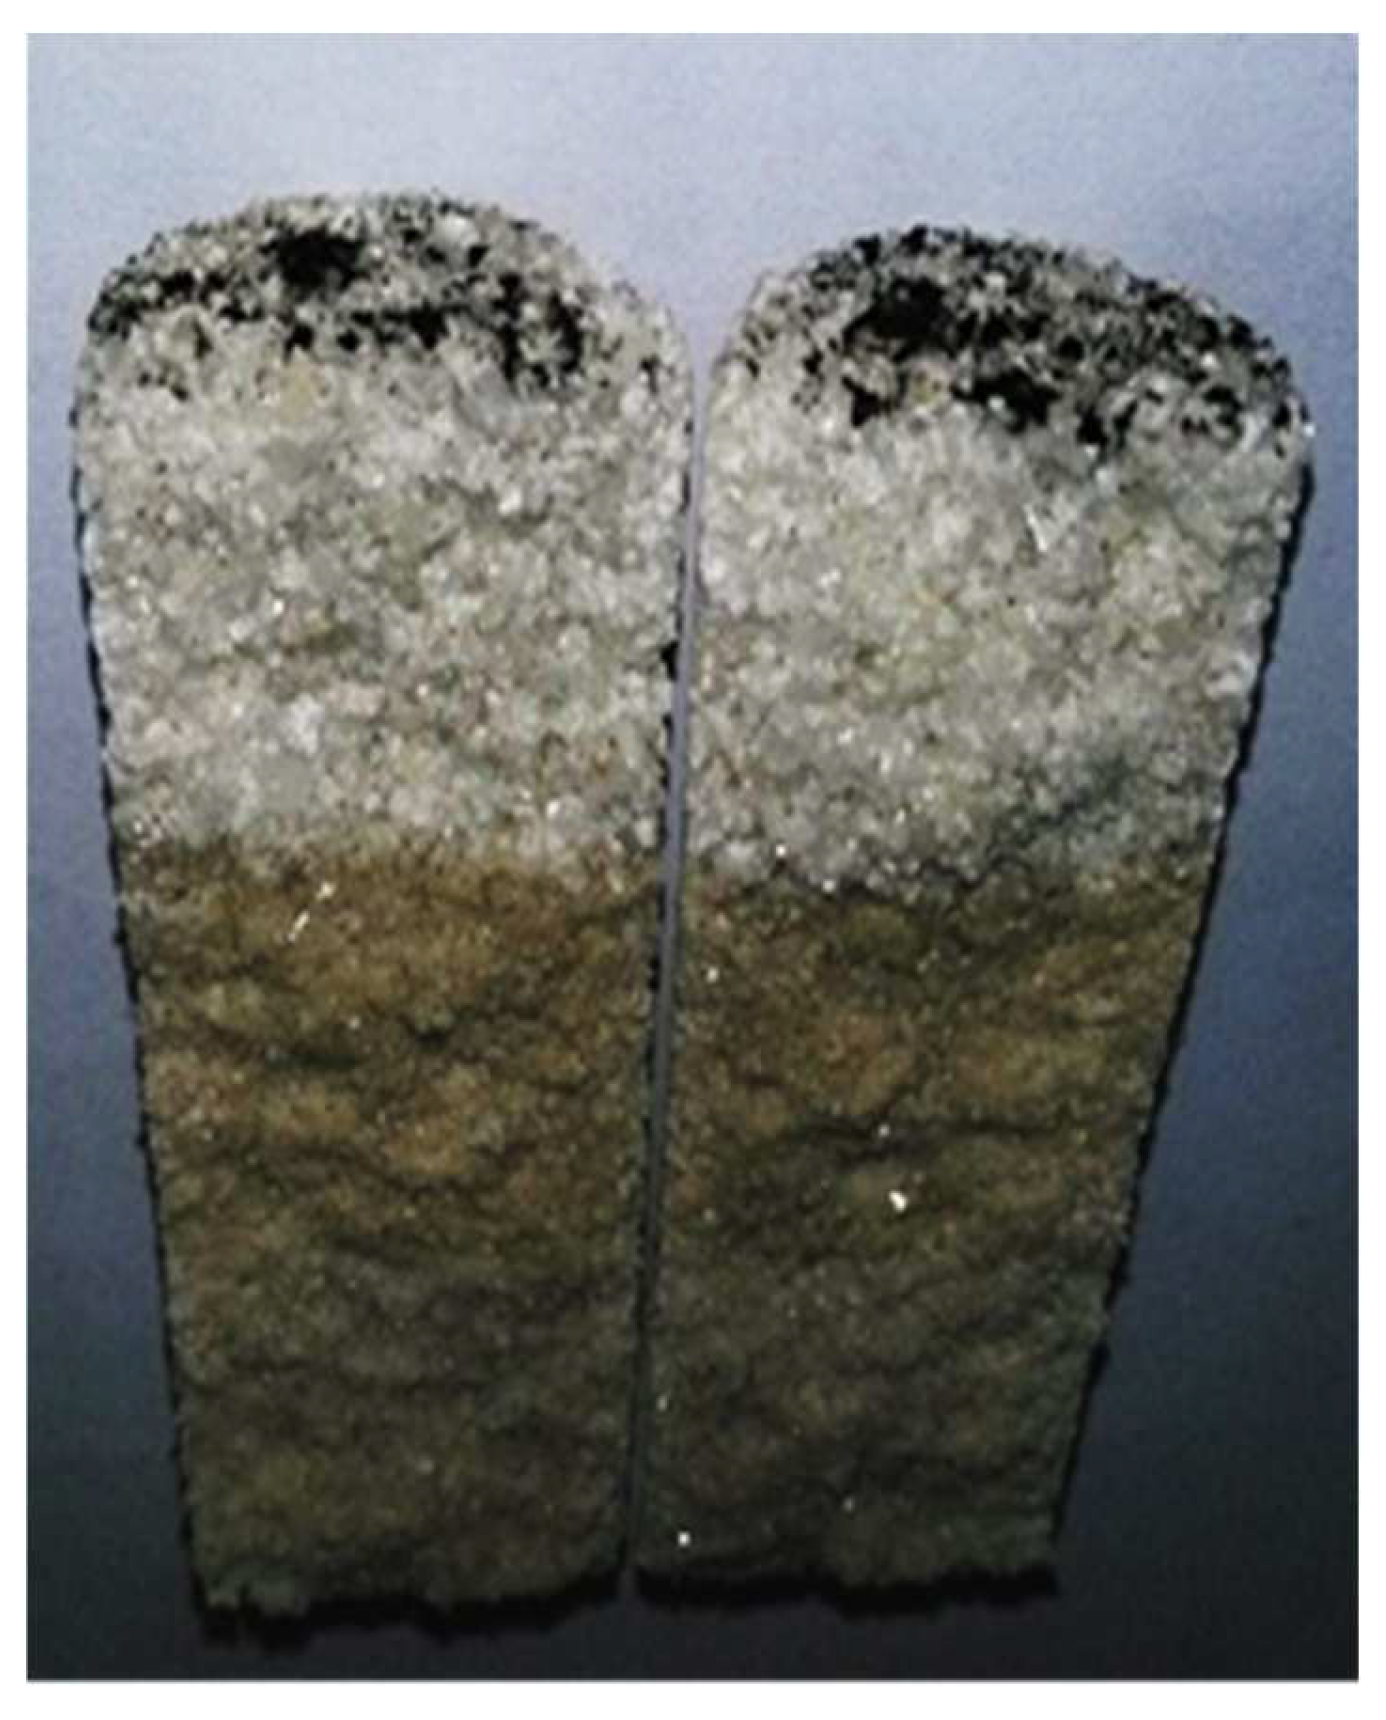
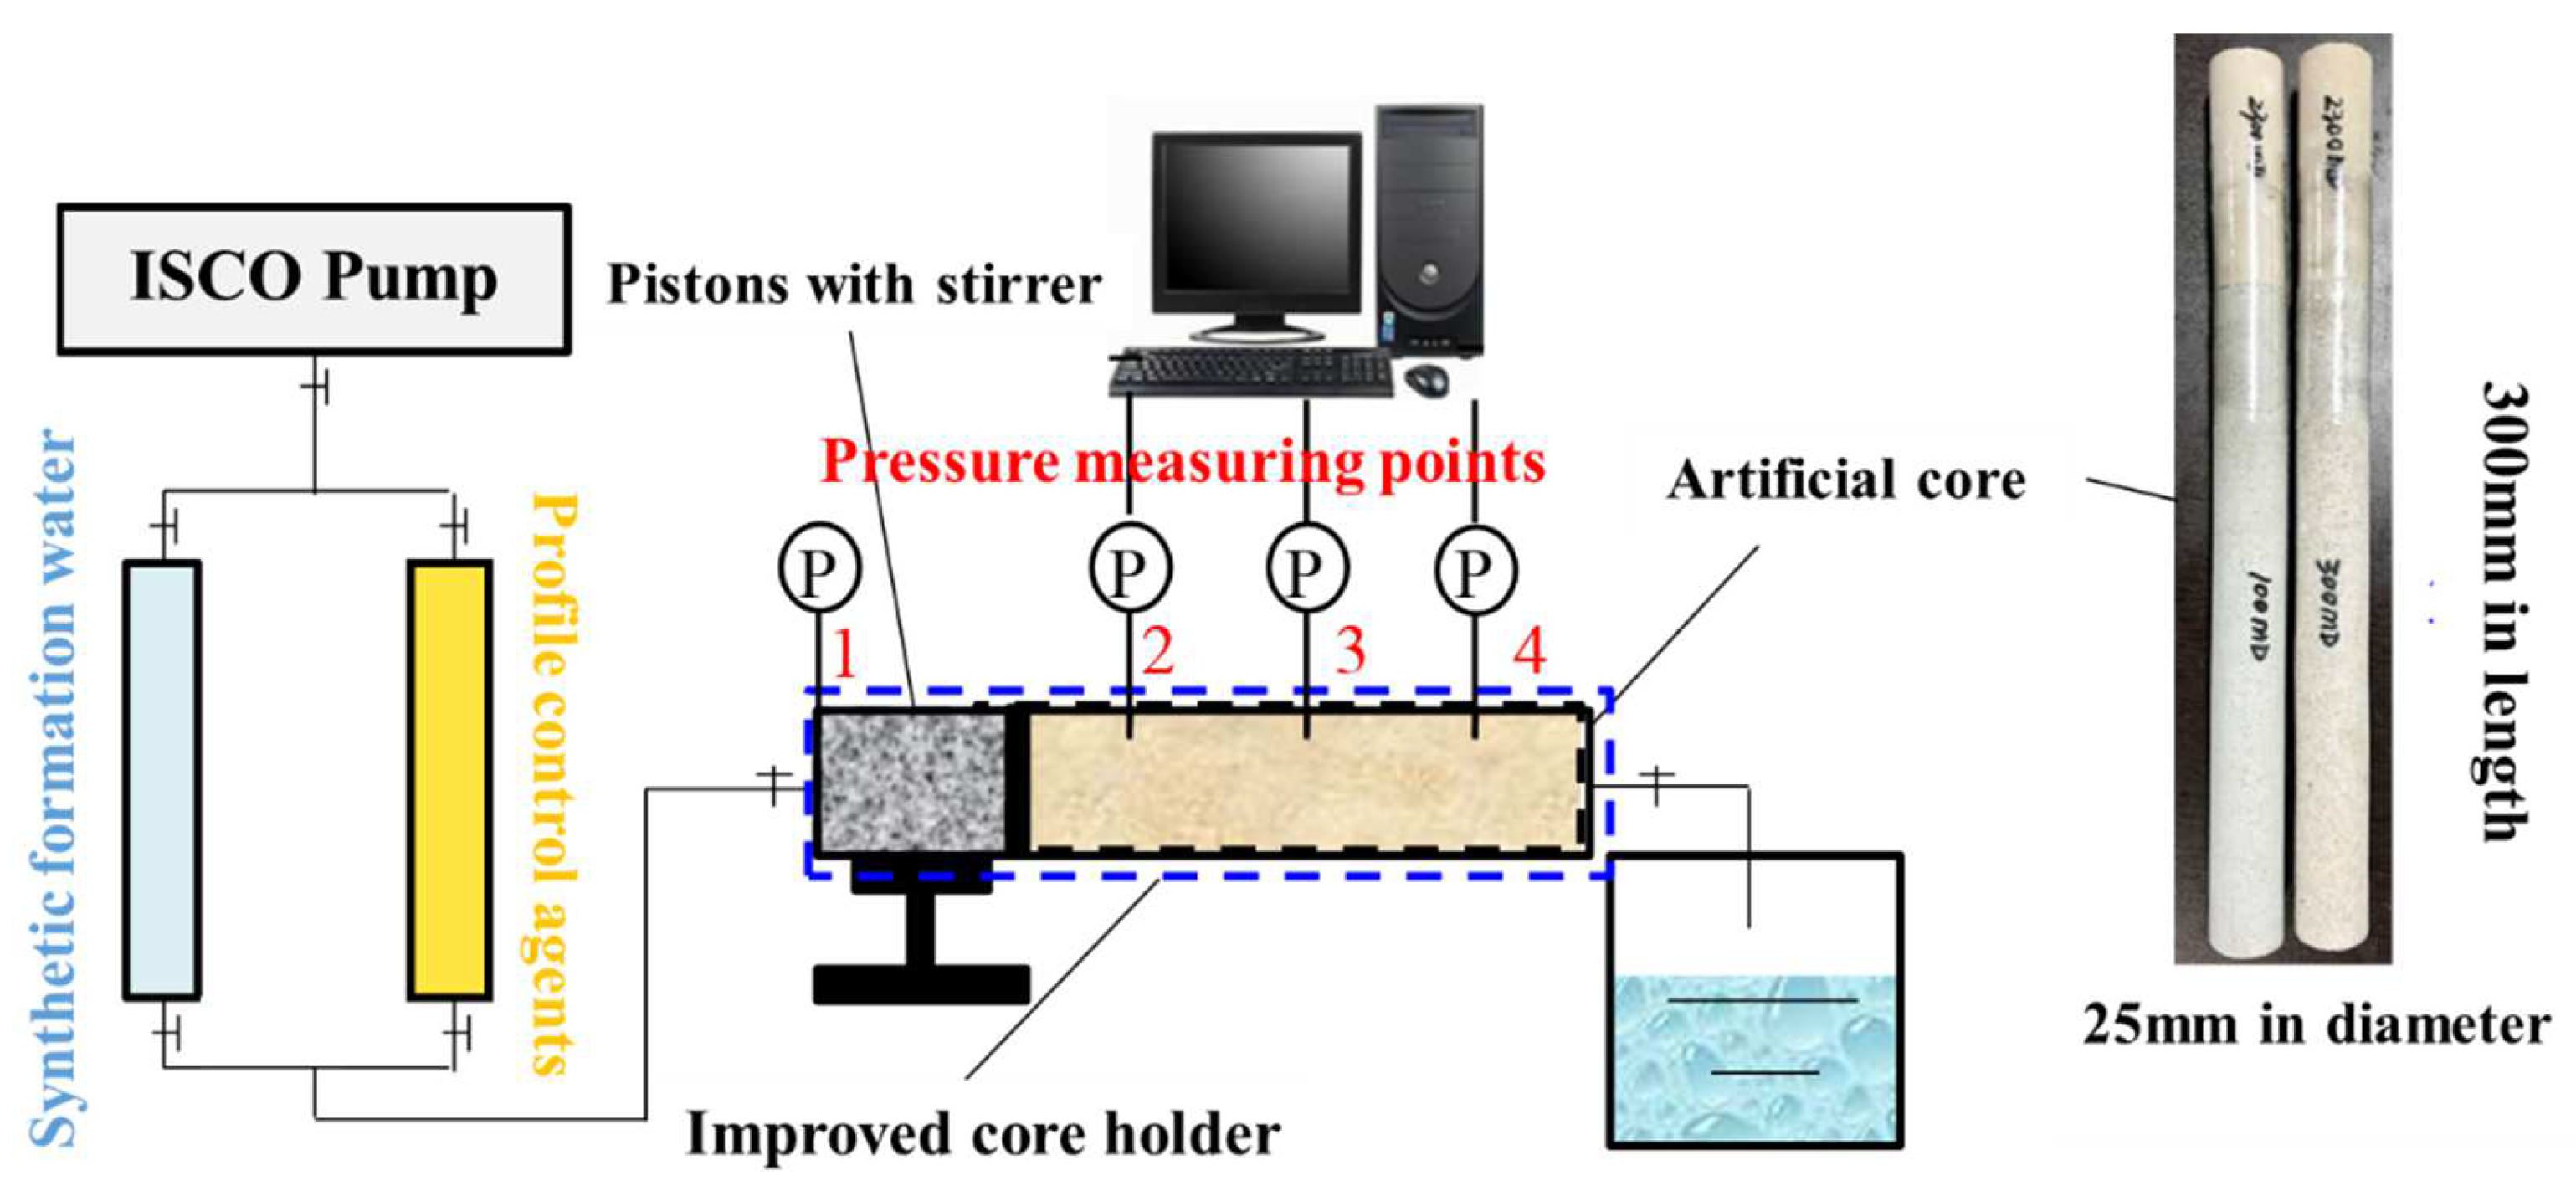
4.2. Equipment
4.3. Experimental Procedure
- (1)
- Preparation stage: The artificial cores are made according to the permeability values required by the experiments and weighed in advance, install and test experimental devices (pipelines, pressure sensors, etc.). The PCAs are prepared, and the simulated formation water is synthesized.
- (2)
- Water flooding stage: Vacuumize the core and saturate the formation water at a constant rate of 1mL/min. After the displacement pressure difference and the discharge fluid at the outlet are stabilized, the initial water phase permeability is calculated according to Darcy’s Law. The weight of the core is weighed, and the pore volume and porosity of the model are calculated.
- (3)
- PCAs injection stage: PCAs are injected at a constant rate, and the values of each pressure gauge along the path are recorded every 10 s, in which the change of injection pressure with time can be used to investigate its injectability. The confining pressure was 20 Mpa. After injecting about 1 PV, the injection is stopped, and the model is placed in a thermostat to form gel (or expand) at the reservoir temperature. At this stage, the resistance factor Fr can be calculated under a certain velocity:
- (4)
- Subsequent water flooding stage:
Author Contributions
Funding
Institutional Review Board Statement
Informed Consent Statement
Data Availability Statement
Conflicts of Interest
References
- Wang, K. Deep Profile Modification Technology and Quality Control of Low-Permeability Reservoirs. Technol. Superv. Pet. Ind. 2012, 28, 28–30. [Google Scholar]
- Gu, X. Performance of Profile Control and Oil Displacement Agent in Chuankou Low-Permeability Oil Reservior; Xi’an Shiyou University: Xi’an, China, 2010. [Google Scholar]
- Yang, L.; Hou, J.; Song, X. Plugging Indepth Macroporous Flowage Channels in Low-Permeability and Low Temperature Sandstone Reservoirs. Oilfield Chem. 2006, 4, 337–340. [Google Scholar]
- Li, Y.; Li, Y.; Peng, Y.; Yu, Y. Water shutoff and profile control in China over 60 years. Oil Drill. Prod. Technol. 2019, 41, 773–787. [Google Scholar]
- Zhou, Z.; Zhao, J.; Zhou, T.; Huang, Y. Study on In-depth Profile Control System of Low-permeability Reservoir in Block H of Daqing Oil Field. J. Pet. Sci. Eng. 2017, 157, 1192–1196. [Google Scholar] [CrossRef]
- Li, J.; Yang, H.; Qiao, Y.; Fan, Z.; Chen, W.; Jiang, H. Laboratory Evaluations of Fiber-based Treatment for In-depth Profile Control. J. Pet. Sci. Eng. 2018, 171, 271–288. [Google Scholar] [CrossRef]
- Zhao, G.; You, Q.; Tao, J.; Gu, C.; Aziz, H.; Ma, L.; Dai, C. Preparation and Application of a Novel Phenolic Resin Dispersed Particle Gel for In-depth Profile Control in Low Permeability Reservoirs. J. Pet. Sci. Eng. 2018, 161, 703–714. [Google Scholar] [CrossRef]
- Li, J.; Wang, Z.; Yang, H.; Wu, T.; Wu, H.; Wang, H.; Yu, F.; Jiang, H. Compatibility evaluation of in-depth profile control agents in dominant channels of low-permeability reservoirs. J. Pet. Sci. Eng. 2020, 194, 107529. [Google Scholar] [CrossRef]
- Zhao, X.; Chen, Z.; Chen, W.; Ma, H.; Zhai, D.; Ren, Z. The current research situation and development trend of particle profile-control plugging agents. Oil Drill. Prod. Technol. 2015, 37, 105–112. [Google Scholar]
- Barkman, J.H.; Davidson, D.H. Measuring Water Quality and Predicting Well Impairment. J. Pet. Technol. 1972, 24, 865–873. [Google Scholar] [CrossRef]
- Xu, X.; Wang, Y.; He, H.; Li, D.; Qi, Z. Research Advances in Influencing Factors of Dynamic Gelling Process of Cross-linked Polymer System in Porous Media. Oilfield Chem. 2014, 31, 315–316. [Google Scholar]
- Dai Caili, Z.C.; Yifei, L.; Qing, Y.; Ying, T.; Chuan, W.; Chaohui, S. Matching principle and in-depth profile control mechanism between elastic dispersed particle gel and pore throat. Acta Pet. Sin. 2018, 39, 427–434. [Google Scholar]
- Yun, Y. Research of Injection Wells Deep Profile Technology in Xifeng Oilfield; Xi’an Shiyou University: Xi’an, China, 2012. [Google Scholar]
- Li, Y.; Liu, Y.; Bai, B.; Liu, G. Research on water plugging and profile control technology of bulk swelling particles. Oil Drill. Prod. Technol. 1999, 1999, 65–68+114. [Google Scholar] [CrossRef]
- Jiang, H.; Ye, Z.; Yang, X. Simulation experimental study on temporary plugging rule of fractured reservoir. China Offshore Oil Gas 2005, 17, 41–43. [Google Scholar]
- Liu, J.; Liu, T.; Wang, Y.; Zhao, Y.; Yan, H. Application of the Volume Expansion Grain and Gel System in Low-Permeability and Fractured Reservoirs. Adv. Fine Petrochem. 2018, 19, 8–12. [Google Scholar]
- Bai, B. Basic Research on Application of Pre-Crosslinked Gel Particles in Deep Profile Control; China University of Geosciences: Beijing, China, 2003. [Google Scholar]
- Chen, Z. Research on the Matching Relation between the Diameter of Elastical Particle and Permeability of the Formation; China University of Petroleum (East China): Qingdao, China, 2016. [Google Scholar]
- Pan, Y.; Liao, S.; Yang, S.; Dinar, N.; Li, M.; Li, C. Research on Nanomaterials in Oilfield for Oil Recovery Enhancent. Materials 2021, 40, 210–217. [Google Scholar]
- He, J.; Zhu, X.; Li, L.; Kou, W.; Wu, C.; Sun, S.; Xue, W. Performance evaluation and field application of single-phase gel in Huaqing ultra low-permeability reservoir. In Proceedings of the International Field Exploration and Development Conference, Qingdao, China, 16–18 September 2021; Volume I, pp. 767–773. [Google Scholar]
- Xu, R. Evaluation of Plugging Effect of Gel Particles Based on Low Field Nuclear Magnetic Resonance Technology; Xi’an Shiyou University: Xi’an, China, 2020. [Google Scholar]
- Zhang, Q.; Li, G.; Fu, M.; Zuo, J.; Hu, X.; Chen, L. Review on the syneresis of polymer gel for water shutoff. Appl. Chem. Ind. 2019, 48, 970–974. [Google Scholar]
- Shang, X.; Dong, C.; Huang, F.; Xiong, C.; Wei, F. Migration and plugging mechanisms of polymer gel in 3D fractured media. J. China Univ. Pet. 2021, 45, 171–178. [Google Scholar]
- Zhang, J.; Wang, R. Study on influencing factors of blocking performance of bulk swelling particle profile control agent. Chem. Eng. 2020, 34, 69–72+58. [Google Scholar]
- Alhuraishawy, A.K.; Bai, B.; Wei, M. Combined ionically modified seawater and microgels to improve oil recovery in fractured carbonate reservoirs. J. Pet. Sci. Eng. 2018, 162, 434–445. [Google Scholar] [CrossRef]
- Wang, K.; Fang, J.C.; Wu, X.M. Performance Evaluation of Polymer Microspheres for Profile Control and Oil Displacement. Appl. Mech. Mater. 2014, 4, 541–542. [Google Scholar] [CrossRef]
- Ren, H. Research on Optimization and Evaluation of Deep Profile Control and Displacement Technology with Nano-Micro Microspheres; Southwest Petroleum University: Chengdu, China, 2016. [Google Scholar]
- Dong, J. Development and Evaluation of Lignin and Polyacrylamide Profile Control Agents; Heilongjiang University: Harbin, China, 2001. [Google Scholar]
- Yadav, U.S.; Mahto, V. In Situ Gelation Study of Organically Crosslinked Polymer Gel System for Profile Modification Jobs. Arab. J. Eng. 2014, 39, 5229–5235. [Google Scholar] [CrossRef]
- Zhao, Q. Study on Performance Evaluation Method and Applicable Conditions of Gel Profile Control Agents; Northeast Petroleum University: Daqing, China, 2004. [Google Scholar]
- Zhang, B. The Research of Applied Technology for Profile Control before Polymer Flooding; Daqing Petroleum Institute: Daqing, China, 2008. [Google Scholar]
- Lou, Y.; Zhu, W.Y.; Zhang, X.L.; Long, Y.Q. Effect of Salinity and Temperature on Swelling Behavior of Nano/Micro Polymer Particle. Appl. Mech. Mater. 2013, 448–453, 3993–3997. [Google Scholar] [CrossRef]
- Suzuki, A.; Okabe, N.; Suzuki, H. Effects of guest microparticles on the swelling behavior of polyacrylamide gels. J. Polym. Sci. Part B Polym. Phys. 2005, 43, 1696–1704. [Google Scholar] [CrossRef]
- Niu, L.; Li, J.; Liu, C.; Sun, Q. Evaluation on Reservoir Adaptability of Hydrophilic Volume Expansion Grain. Math. Pract. Theory 2016, 46, 151–161. [Google Scholar]
- Zhang, H. Optimized on Organic Chromium Gel/Volume Expansion Particle Combinated Flooding Adjustment System and Research on Oil Displacement Efficiency; Liaoning University of Technology: Jinzhou, China, 2013. [Google Scholar]


| Content | Year | |||
|---|---|---|---|---|
| 2016 | 2017 | 2018 | 2019 | |
| Number of wells using microspheres | 230 | 445 | 3518 | 3036 |
| Number of wells using PEG | 11 | 100 | 897 | 718 |
| Number of wells using CBG-SP | 552 | 714 | 637 | 334 |
| The total oil increment/t | 109,400 | 132,200 | 437,000 | 380,180 |
| The total water reduction/m³ | 127,600 | 150,100 | 458,200 | 388,360 |
| Gradation | Permeability /mD | Average Radius of Pore Throat/μm | Diameter Ratio of Microspheres to Pore Throat | Plugging Efficiency/% |
|---|---|---|---|---|
| D > 1/3 D | 1410 | 6.11 | 0.327 | 33.3 |
| 1/3 D < d < 1/7 D | 3000 | 8.94 | 0.223 | 26.4 |
| D < 1/7 D | 5000 | 12.00 | 0.167 | 25.0 |
| Category | Advantages | Disadvantages | Function |
|---|---|---|---|
| Nanosphere | Good hydration performance; particle size and expansion volume can be adjusted [19] | Poor dispersibility; fragile and easy to break | Displacing in the depth |
| PEG | Single component, effectively simplify the liquid preparation; small particle size; good dispersibility and injectivity; high resistance to temperature and salt [20,21] | Relatively high cost | Blocking, and controlling at central zone |
| CBG | Strong blocking capacity after cross-linking; the gel still has an oil displacement effect after shearing | Difficult to control gelation time and gelation quality; multiple components included with complex treatment process; high risk of underground gelation due to differential adsorption; poor salt resistance, easy to hydrolyze, short validity [22,23] | Blocking at near bore zone |
| SP | Good elasticity; good temperature resistance and shear resistance [16,24] | Poor suspensibility and injectivity; limited migration distance; need to be carried by polymer | Controlling at near bore zone |
| Category | Injectability | Plugging Intensity | Deep Migration Ability |
|---|---|---|---|
| Cross-linked bulk gel | Mediocre | Favorable | Mediocre |
| Swelling particles | Inferior | Favorable | Inferior |
| Bentonite | Favorable | Inferior | Mediocre |
| Profile Control Agent | Reservoir Parameters | Injection Volume, Injection Concentration | Injection Velocity | Nanospheres Size |
|---|---|---|---|---|
| Nanosphere | Matrix permeability <10 mD; Fracture aperture is about 0.2 mm | 0.4 PV, 0.4% | 0.3 mL/min | 100 nm |
| 300 nm | ||||
| 800 nm |
| Core Number | Porosity/% | Permeability /mD | Fracture Aperture /mm | Research Parameters | Initial Parameters |
|---|---|---|---|---|---|
| A-1 | 12.40 | 0.89 | 0.2 | 100 nm | 0.3 mL/min, 0.4 PV, 0.4% |
| A-2 | 12.94 | 1.07 | 0.2 | 300 nm | |
| A-3 | 12.13 | 1.20 | 0.2 | 800 nm |
| Stage | Section | Flow Rate /(mL/min) | Pressure Difference /MPa | Residual Resistance Coefficient |
|---|---|---|---|---|
| Water flooding | Inlet-Rear | 1 | 0.013 | - |
| Subsequent Water flooding (100 nm) | Inlet | 0.3 | 1.614 | 19.22 |
| Front | 0.3 | 1.406 | 16.73 | |
| Middle | 0.3 | 1.268 | 15.09 | |
| Rear | 0.3 | 0.955 | 11.37 | |
| Subsequent Water flooding (300 nm) | Inlet | 0.3 | 1.724 | 20.53 |
| Front | 0.3 | 1.337 | 15.92 | |
| Middle | 0.3 | 1.169 | 13.91 | |
| Rear | 0.3 | 0.835 | 9.94 | |
| Subsequent Water flooding (800 nm) | Inlet | 0.3 | 2.879 | 34.28 |
| Front | 0.3 | 0.522 | 6.21 | |
| Middle | 0.3 | 0.288 | 3.43 | |
| Rear | 0.3 | 0.089 | 1.06 |
| Profile Control Agent | Reservoir Parameters | Injection Volume | Injection Concentration | Injection Velocity |
|---|---|---|---|---|
| PEG | Matrix permeability <10 mD; Fracture aperture is about 0.2 mm | 0.8 PV | 0.5% | 0.1 mL/min |
| 0.2 mL/min | ||||
| 0.3 mL/min |
| Core Number | Porosity/% | Permeability /mD | Fracture Aperture /mm | Research Parameters | Initial Parameters |
|---|---|---|---|---|---|
| B-1 | 11.47 | 1.39 | 0.2 | 0.1 mL/min | 0.8 PV, 0.5% |
| B-2 | 12.02 | 1.55 | 0.2 | 0.2 mL/min | |
| B-3 | 12.15 | 2.28 | 0.2 | 0.3 mL/min |
| Profile Control Agent | Reservoir Parameters | Injection Volume | Injection Concentration | Injection Velocity |
|---|---|---|---|---|
| CBG-SP | Matrix permeability < 10 mD; Fracture aperture is about 0.2 mm | 0.5 PV (50%–70% SP + 30%–50% CBG) | 0.2% HPAM + 0.2% Cr3+ + 0.5% SP | 0.1 mL/min |
| Core Number | Porosity/% | Permeability /mD | Fracture Aperture /mm | Research Parameters | Initial Parameters |
|---|---|---|---|---|---|
| C-1 | 13.41 | 3.05 | 0.2 | 0.1 mL/min | 0.5 PV, 0.5% |
| Type | Effect of PCA in the Low-Permeability Fractured Reservoir | |
|---|---|---|
| Nanospheres | 100 nm | Excellent |
| 300 nm | Favorable | |
| 800 nm | Mediocre | |
| PEG | Excellent | |
| CBG-SP | Favorable | |
| Slug I | Contents | Slug II | Contents | Slug III | Contents |
|---|---|---|---|---|---|
| Pre-slug | Water injection | Pre-slug | Water injection | Pre-slug | PEG |
| Main slug | PEG | Main slug | 100 nm nanosphere | Main slug | CBG-SP |
| Displacement slug | Displacement (50 m3) | Displacement slug | Displacement (100 m3) | Displacement slug | 100 nm nanosphere |
| Type | Appropriate Injection Volume | Appropriate Injection Concentration | Appropriate Injection Rate |
|---|---|---|---|
| 100 nm nanosphere | 0.4~0.5 PV | 0.4% | 0.3 mL/min |
| PEG | 0.8~1 PV | 0.5% | 0.1–0.2 mL/min |
| CBG-SP | 0.5 PV | 0.5% | 0.1 mL/min |
| Parameters | Value |
|---|---|
| Dissolution Time/h | ≤2 |
| Solid Content/% | ≥88 |
| Hydrolysis Degree/% | 20–30 |
| Viscosity-average Molecular Weight/×106 | ≥17.0 |
| Performance Parameters | Value |
|---|---|
| Solid Content/% | ≥30 |
| Mass Expansion Multiple | 7–20 |
| Compressive Strength/N | ≥500 |
| Salt Resistance (Mass Expansion Multiple in Synthetic Formation Water) | 5–10 |
| Temperature Resistance (Strength retention after immersion in simulated formation water under formation temperature for 6 months)/% | ≥80 |
| Material Name | Types |
|---|---|
| Nanospheres dispersion | The particle size includes 100 nm, 300 nm and 800 nm The solid content is 20% |
| Single-phase gel particle (PEG) | Gel content ≥ 85.0% |
| Polyacrylamide | Solid content ≥ 88% |
| Chromium cross-linked agent | Cr3+ content ≥ 3.0% |
| Swelling particle (SP) | Solid content ≥ 30% |
| Deionized water | Provided by the laboratory of College of petroleum engineering, China University of Petroleum (Beijing, China) |
| Sodium Chloride (NaCl) | AR, Produced by Beijing Yili Fine Chemicals Co., Ltd. (Beijing, China) |
| Sodium Carbonate (Na2CO3) | AR, Produced by Modern Oriental (Beijing) Technology Development Co., Ltd. (Beijing, China) |
| Calcium Chloride (CaCl2) | AR, Produced by Modern Oriental (Beijing) Technology Development Co., Ltd. (Beijing, China) |
| Artificial core | Laboratory of College of Petroleum Engineering, China University of Petroleum (Beijing, China) |
| Equipment Name | Types |
|---|---|
| Thermostat | Jiangsu Hai’an Huada Petroleum Instrument Factory |
| electrothermal blowing dry box | Jiangsu Hai’an Huada Petroleum Instrument Factory |
| ISCO pump | Jiangsu Hai’an Huada Petroleum Instrument Factory |
| Electric magnetic stirrer | Jiangsu Hai’an Huada Petroleum Instrument Factory |
| High pressure core holder | TY-4: Length 300 mm, Diameter 25 mm |
| Constant-flux pump | 2PB00D, Range 0~10 mL/min, 40 MPa |
| Intermediate container, electronic balance, six-way valve, vernier caliper, beaker, measuring cylinder, glass rod, spoon, dropper, weighing paper, etc. | |
| Number | Problems | Solutions |
|---|---|---|
| 1 | PCAs are easy to sink when injected under static conditions. | Use pistons with stirrer. |
| 2 | PCAs are easy to block the pipeline and lead to abnormal injection. | Use threaded pipeline with inner diameter of 6 mm. |
| 3 | Conventional short cores cannot fully study the migration ability of PCAs. | Use 300 mm long core and holder. |
Publisher’s Note: MDPI stays neutral with regard to jurisdictional claims in published maps and institutional affiliations. |
© 2022 by the authors. Licensee MDPI, Basel, Switzerland. This article is an open access article distributed under the terms and conditions of the Creative Commons Attribution (CC BY) license (https://creativecommons.org/licenses/by/4.0/).
Share and Cite
Li, X.; Wang, J.; Ni, J.; Fu, L.; Xu, A.; Zhao, L. Compatibility Evaluation of In-Depth Profile Control Agents for Low-Permeability Fractured Reservoirs. Gels 2022, 8, 575. https://doi.org/10.3390/gels8090575
Li X, Wang J, Ni J, Fu L, Xu A, Zhao L. Compatibility Evaluation of In-Depth Profile Control Agents for Low-Permeability Fractured Reservoirs. Gels. 2022; 8(9):575. https://doi.org/10.3390/gels8090575
Chicago/Turabian StyleLi, Xuanran, Jincai Wang, Jun Ni, Libing Fu, Anzhu Xu, and Lun Zhao. 2022. "Compatibility Evaluation of In-Depth Profile Control Agents for Low-Permeability Fractured Reservoirs" Gels 8, no. 9: 575. https://doi.org/10.3390/gels8090575
APA StyleLi, X., Wang, J., Ni, J., Fu, L., Xu, A., & Zhao, L. (2022). Compatibility Evaluation of In-Depth Profile Control Agents for Low-Permeability Fractured Reservoirs. Gels, 8(9), 575. https://doi.org/10.3390/gels8090575