
Enhanced Oil Recovery Mechanism and Technical Boundary of Gel Foam Profile Control System for Heterogeneous Reservoirs in Changqing


Abstract
:1. Introduction
2. Experiments and Methods
2.1. Static Performance Evaluation Experiment of Plugging System
2.1.1. Gel Plugging Agent
- Pre-crosslinking gel particle
- 2.
- Gel
2.1.2. Foam
2.1.3. Binary/Ternary Complex System
- Pre-crosslinking gel particles
- 2.
- Enhanced gels with pre-crosslinking gel particle
- 3.
- Enhanced foam with pre-crosslinking gel particles and gels
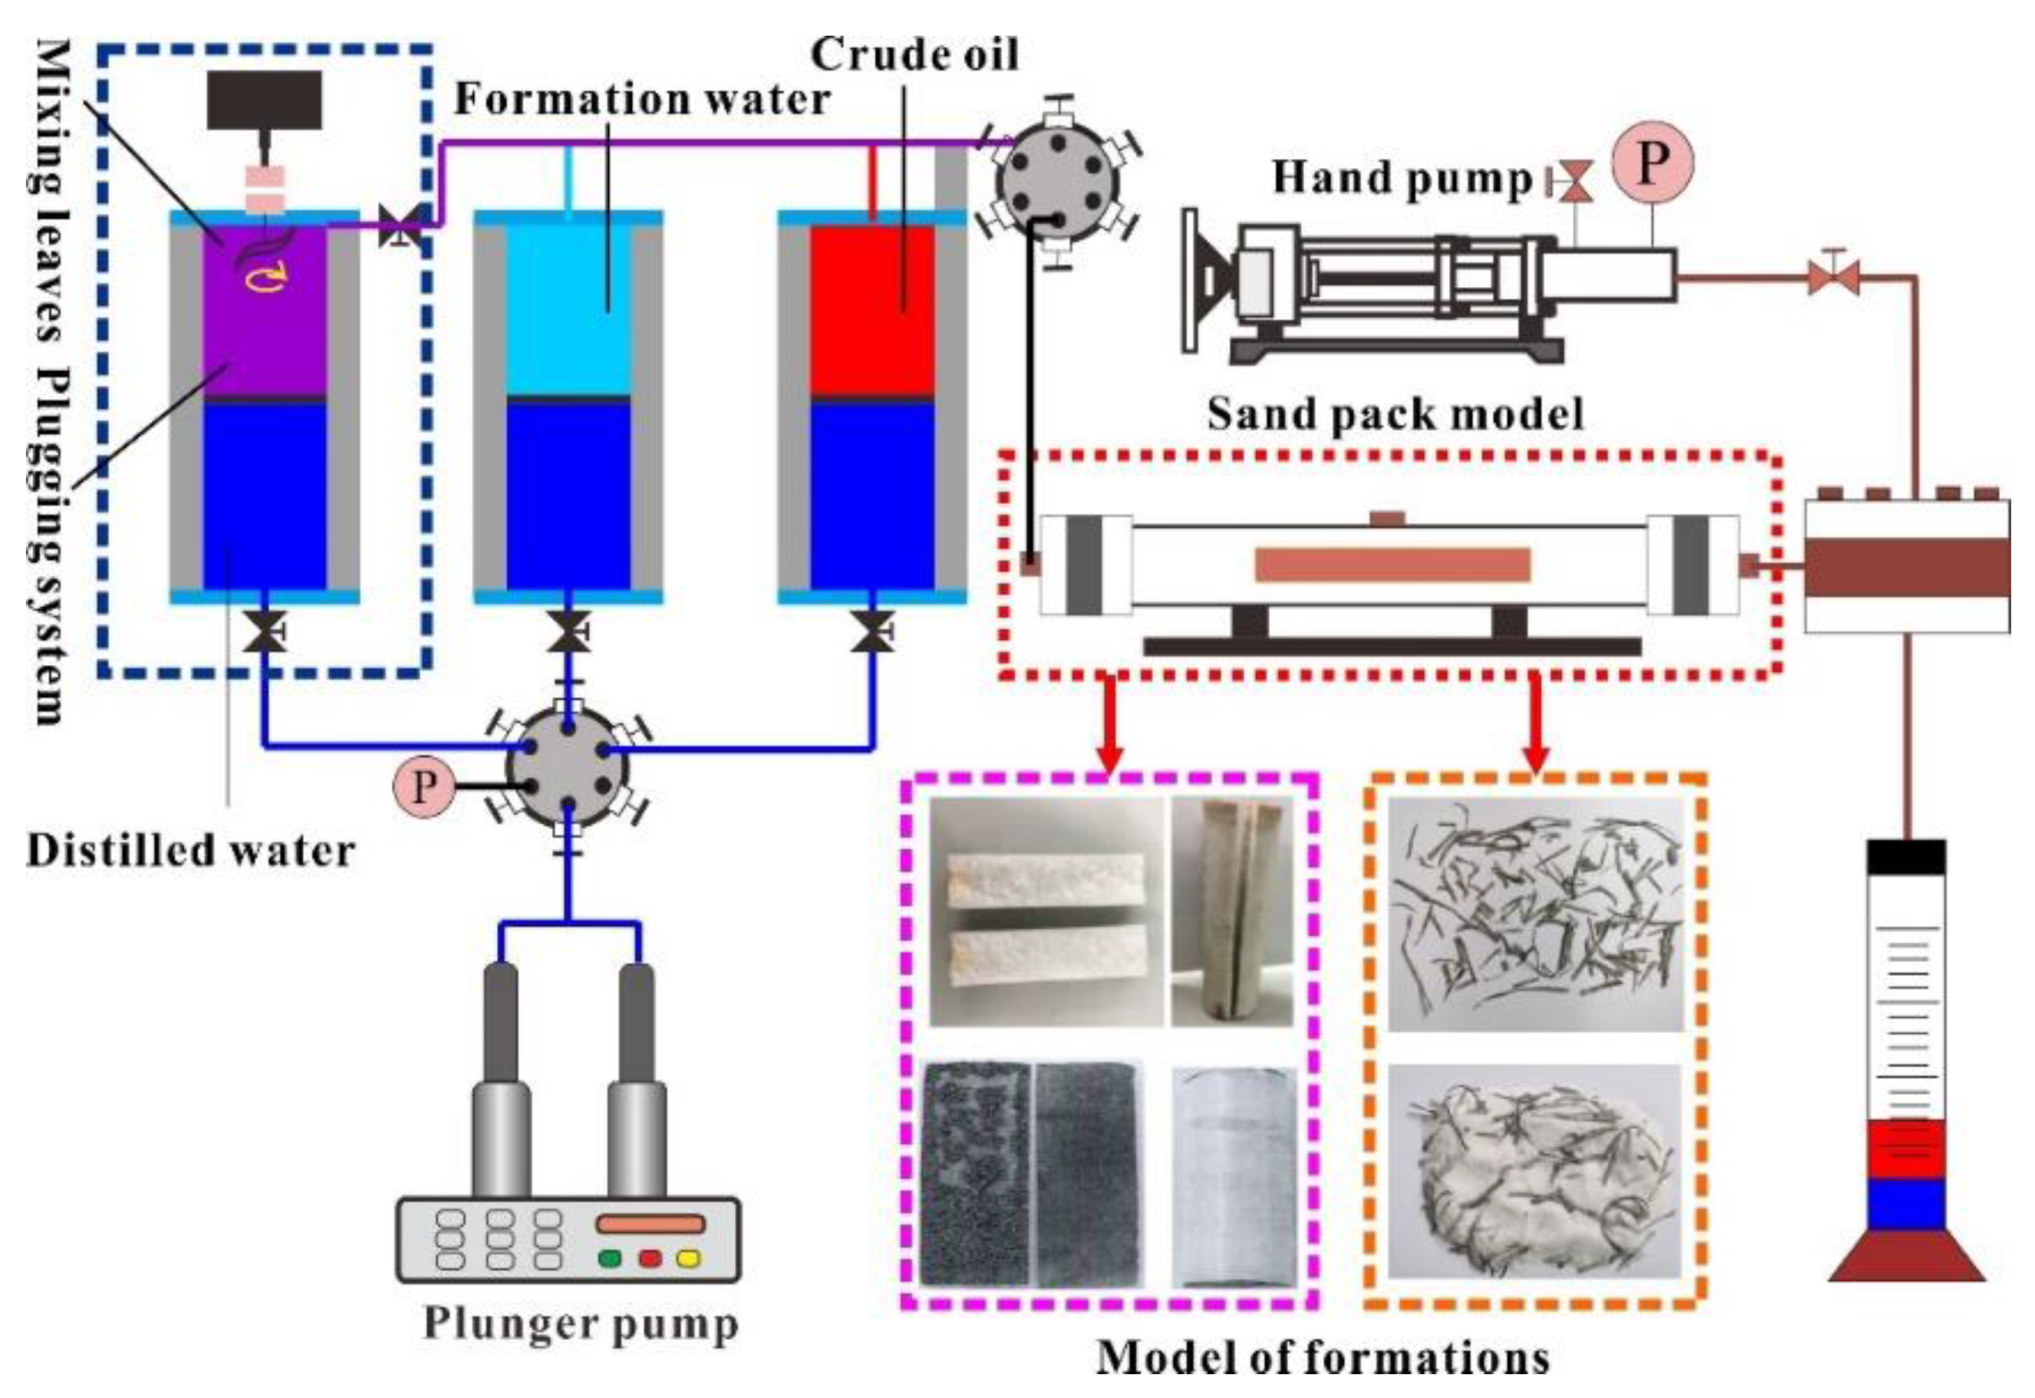
2.2. Physical Simulation Model Construction
2.3. Plugging EOR Mechanisms and Performance
3. Results and Discussion
3.1. Static Performance of Plugging System
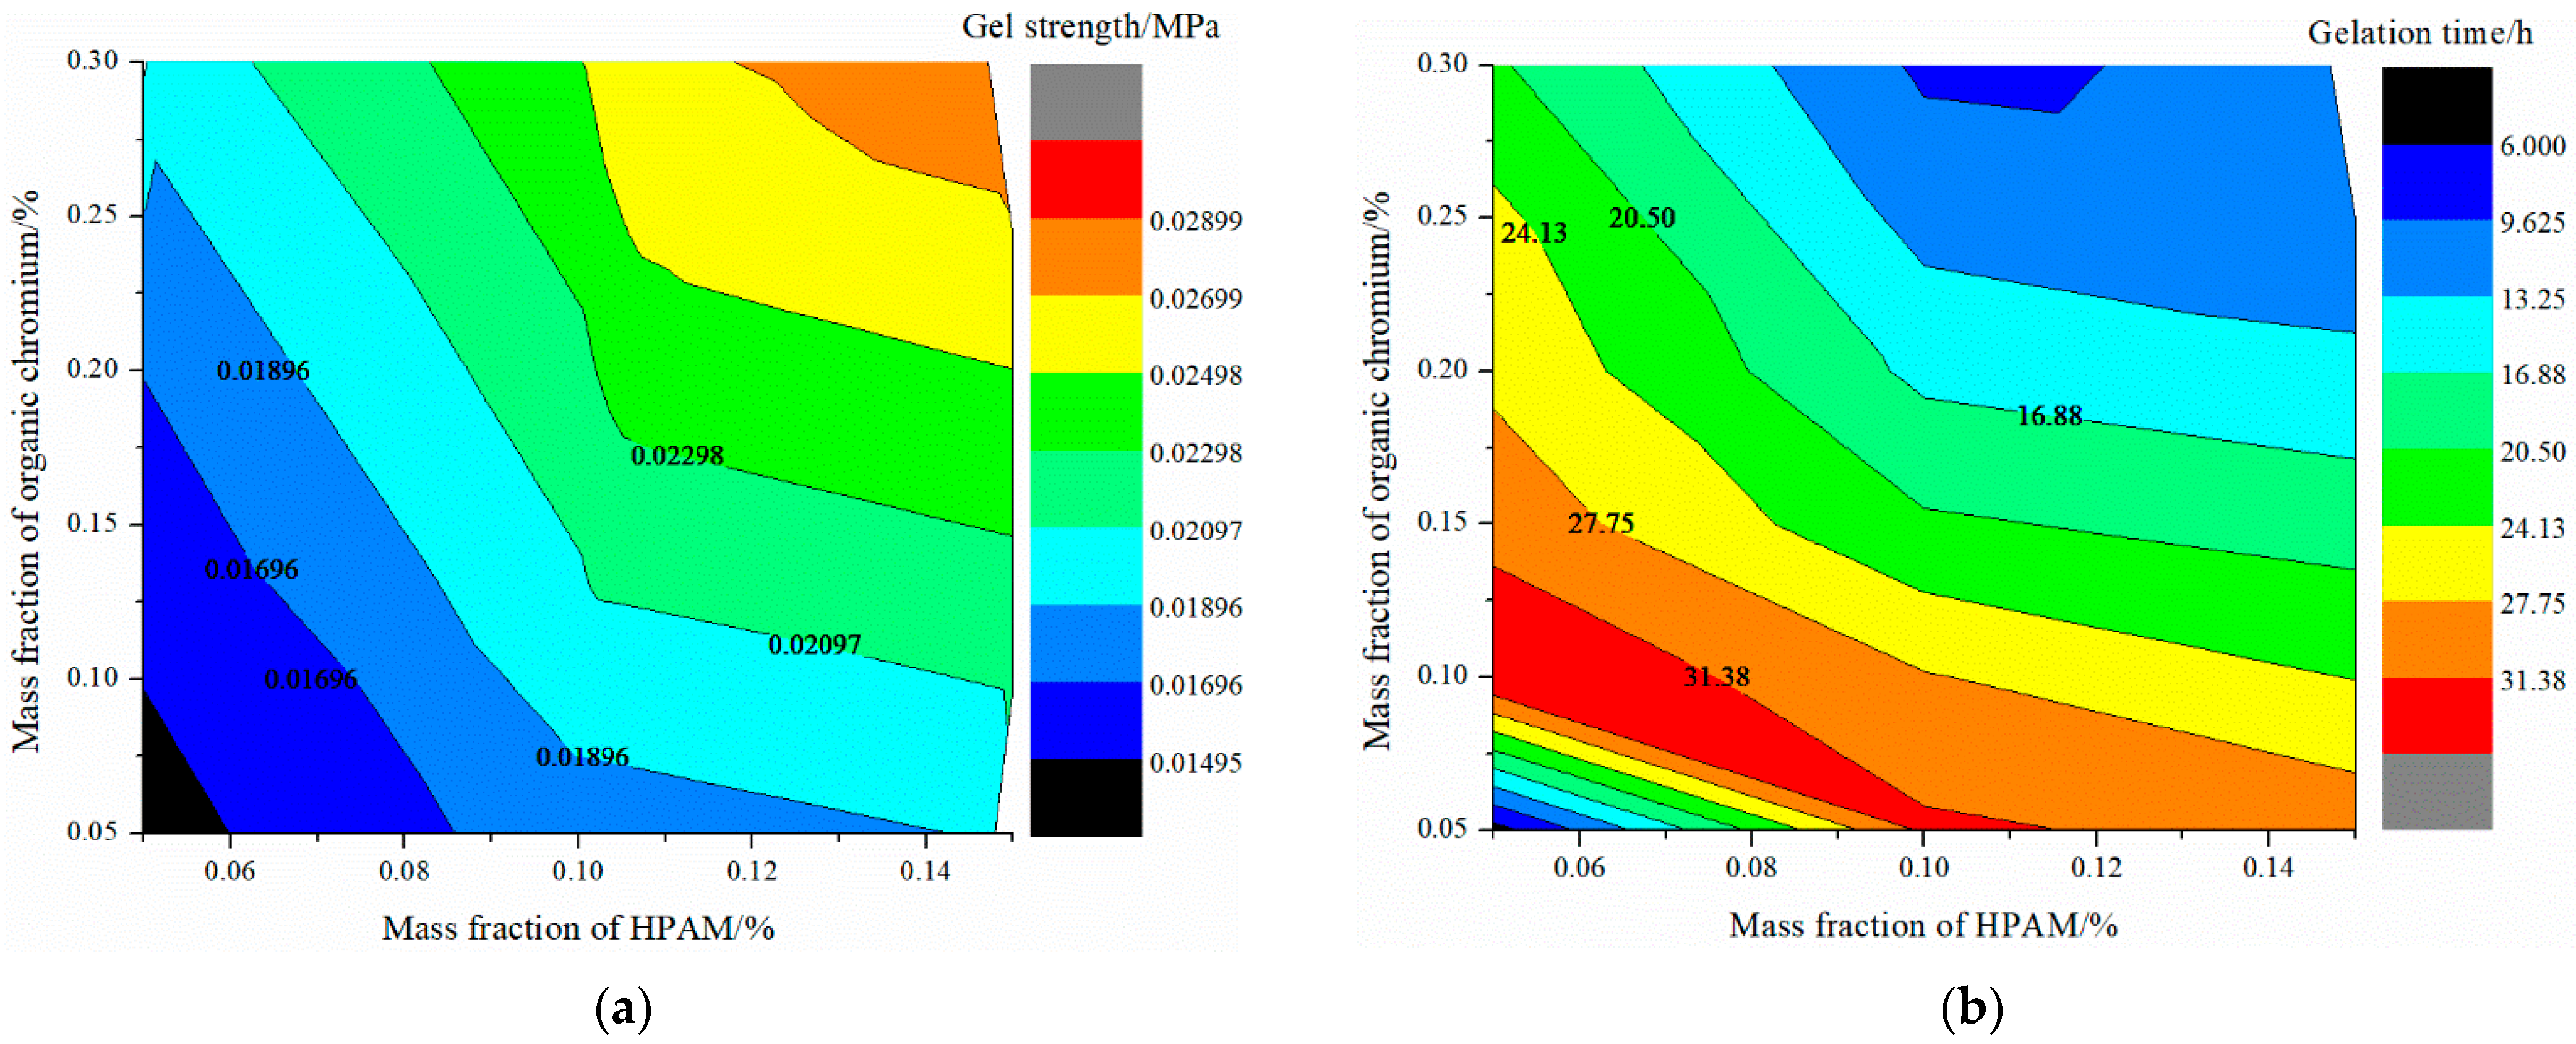
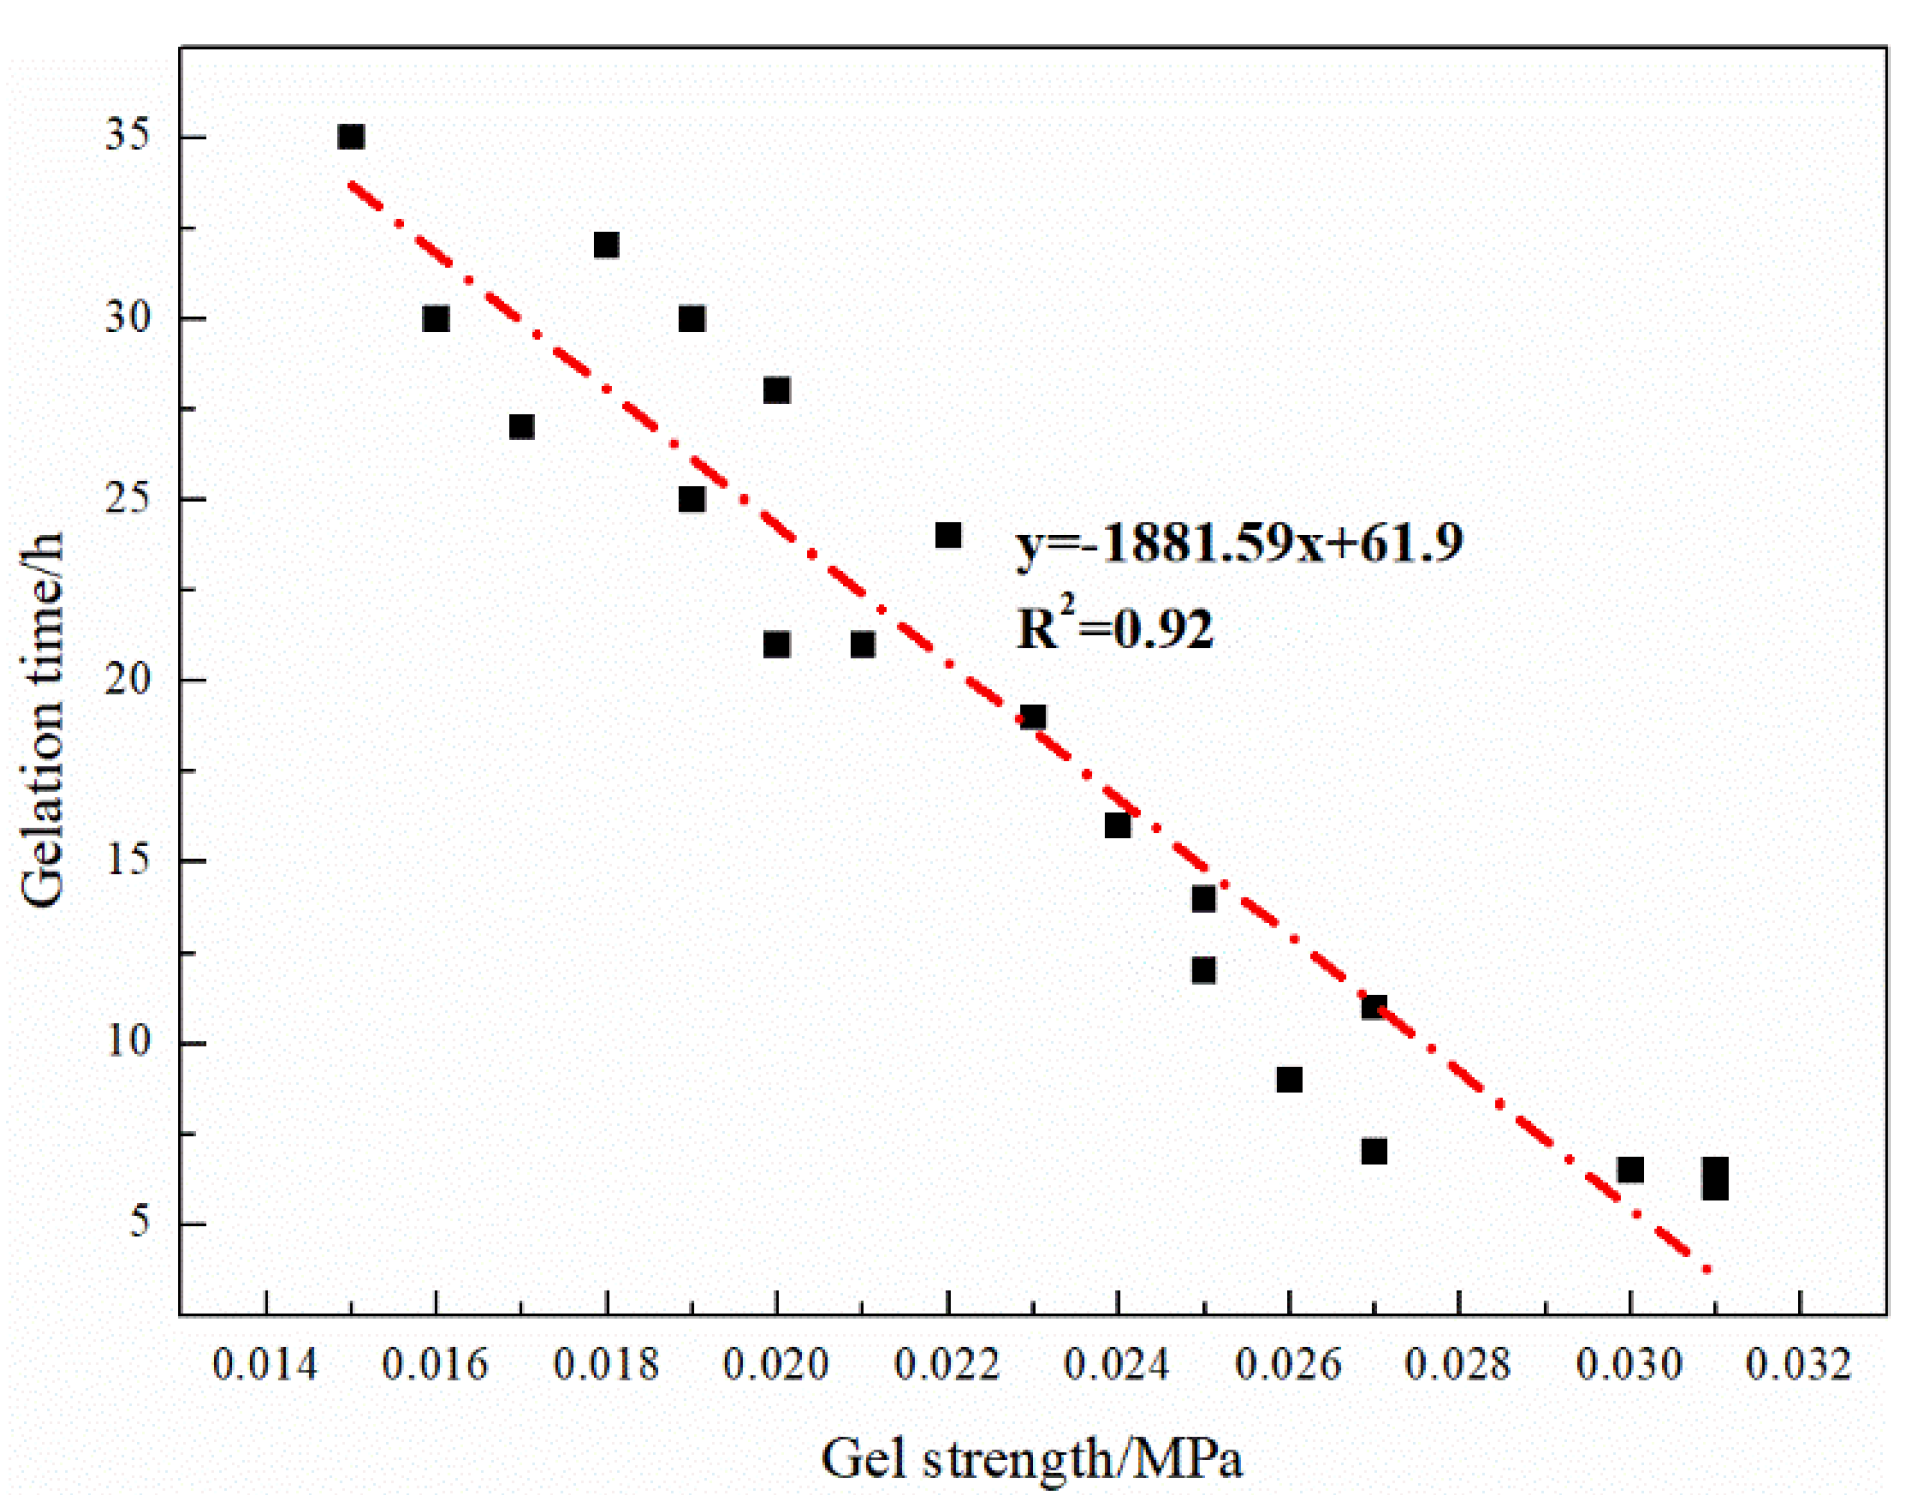
3.1.1. Gel Plugging Agent
- Pre-crosslinking gel particle
- 2.
- Gel
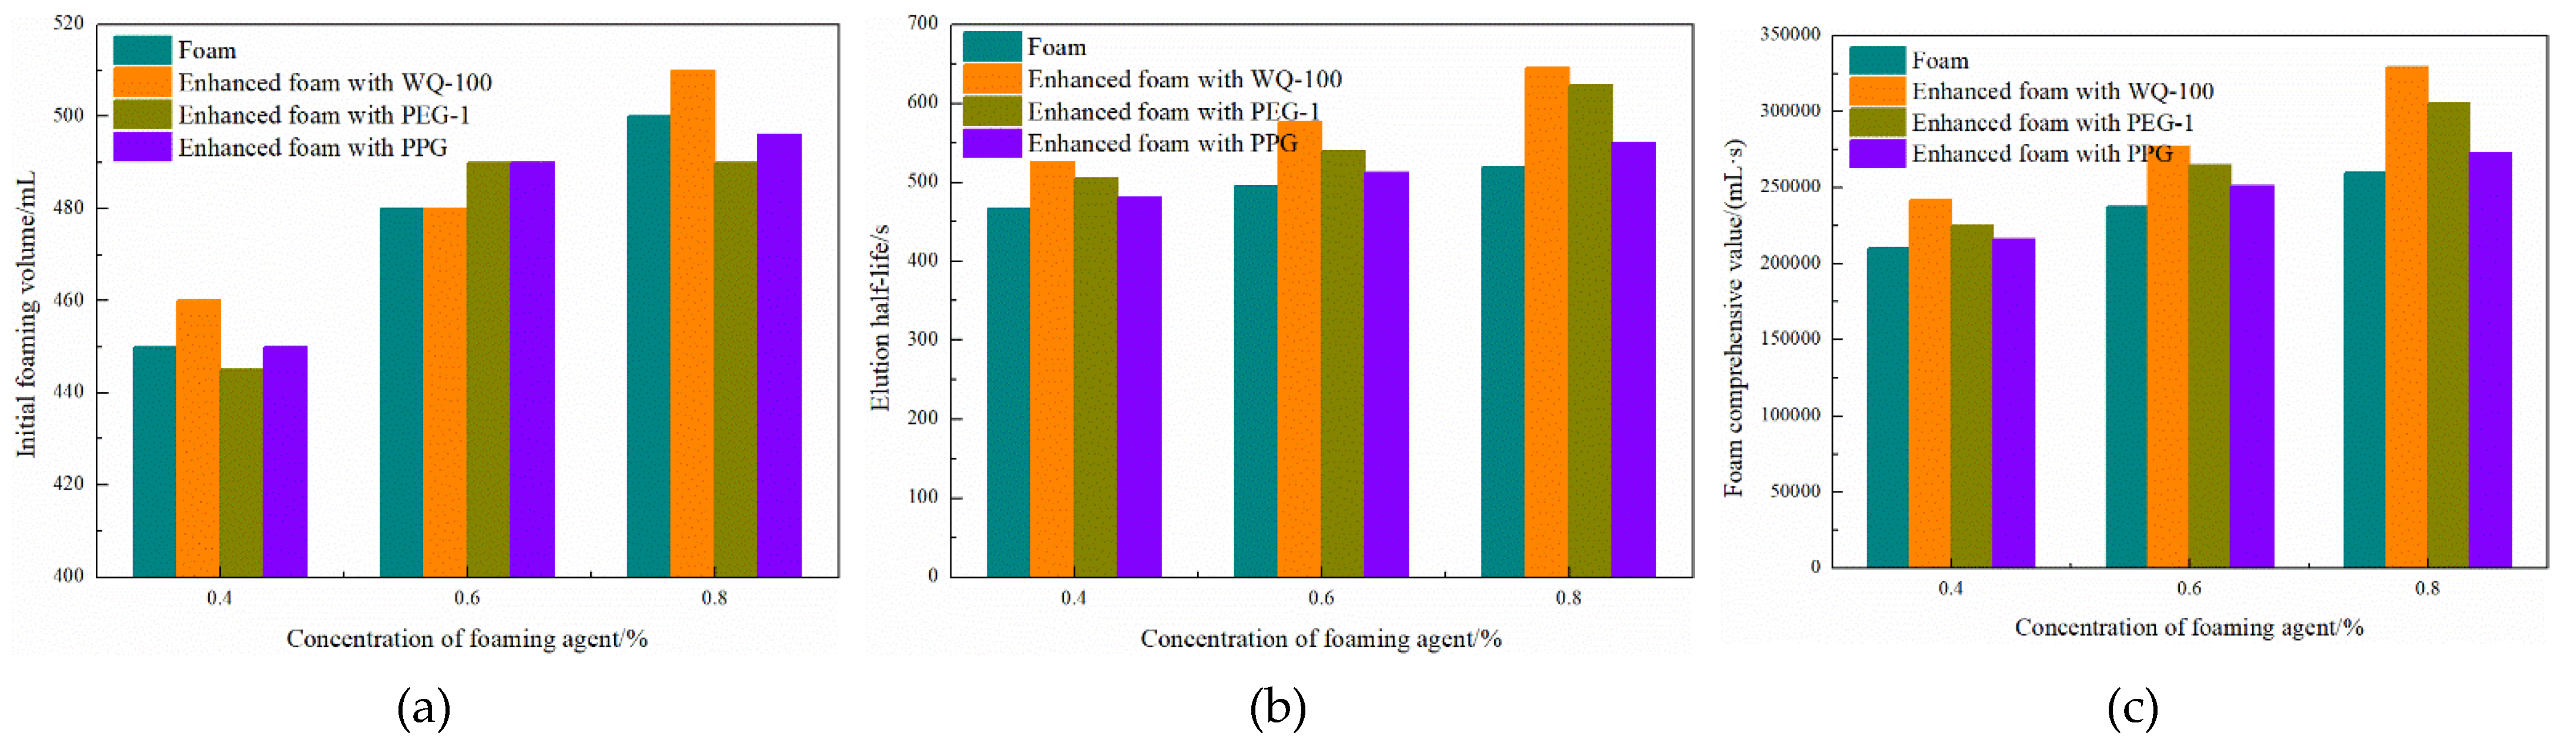
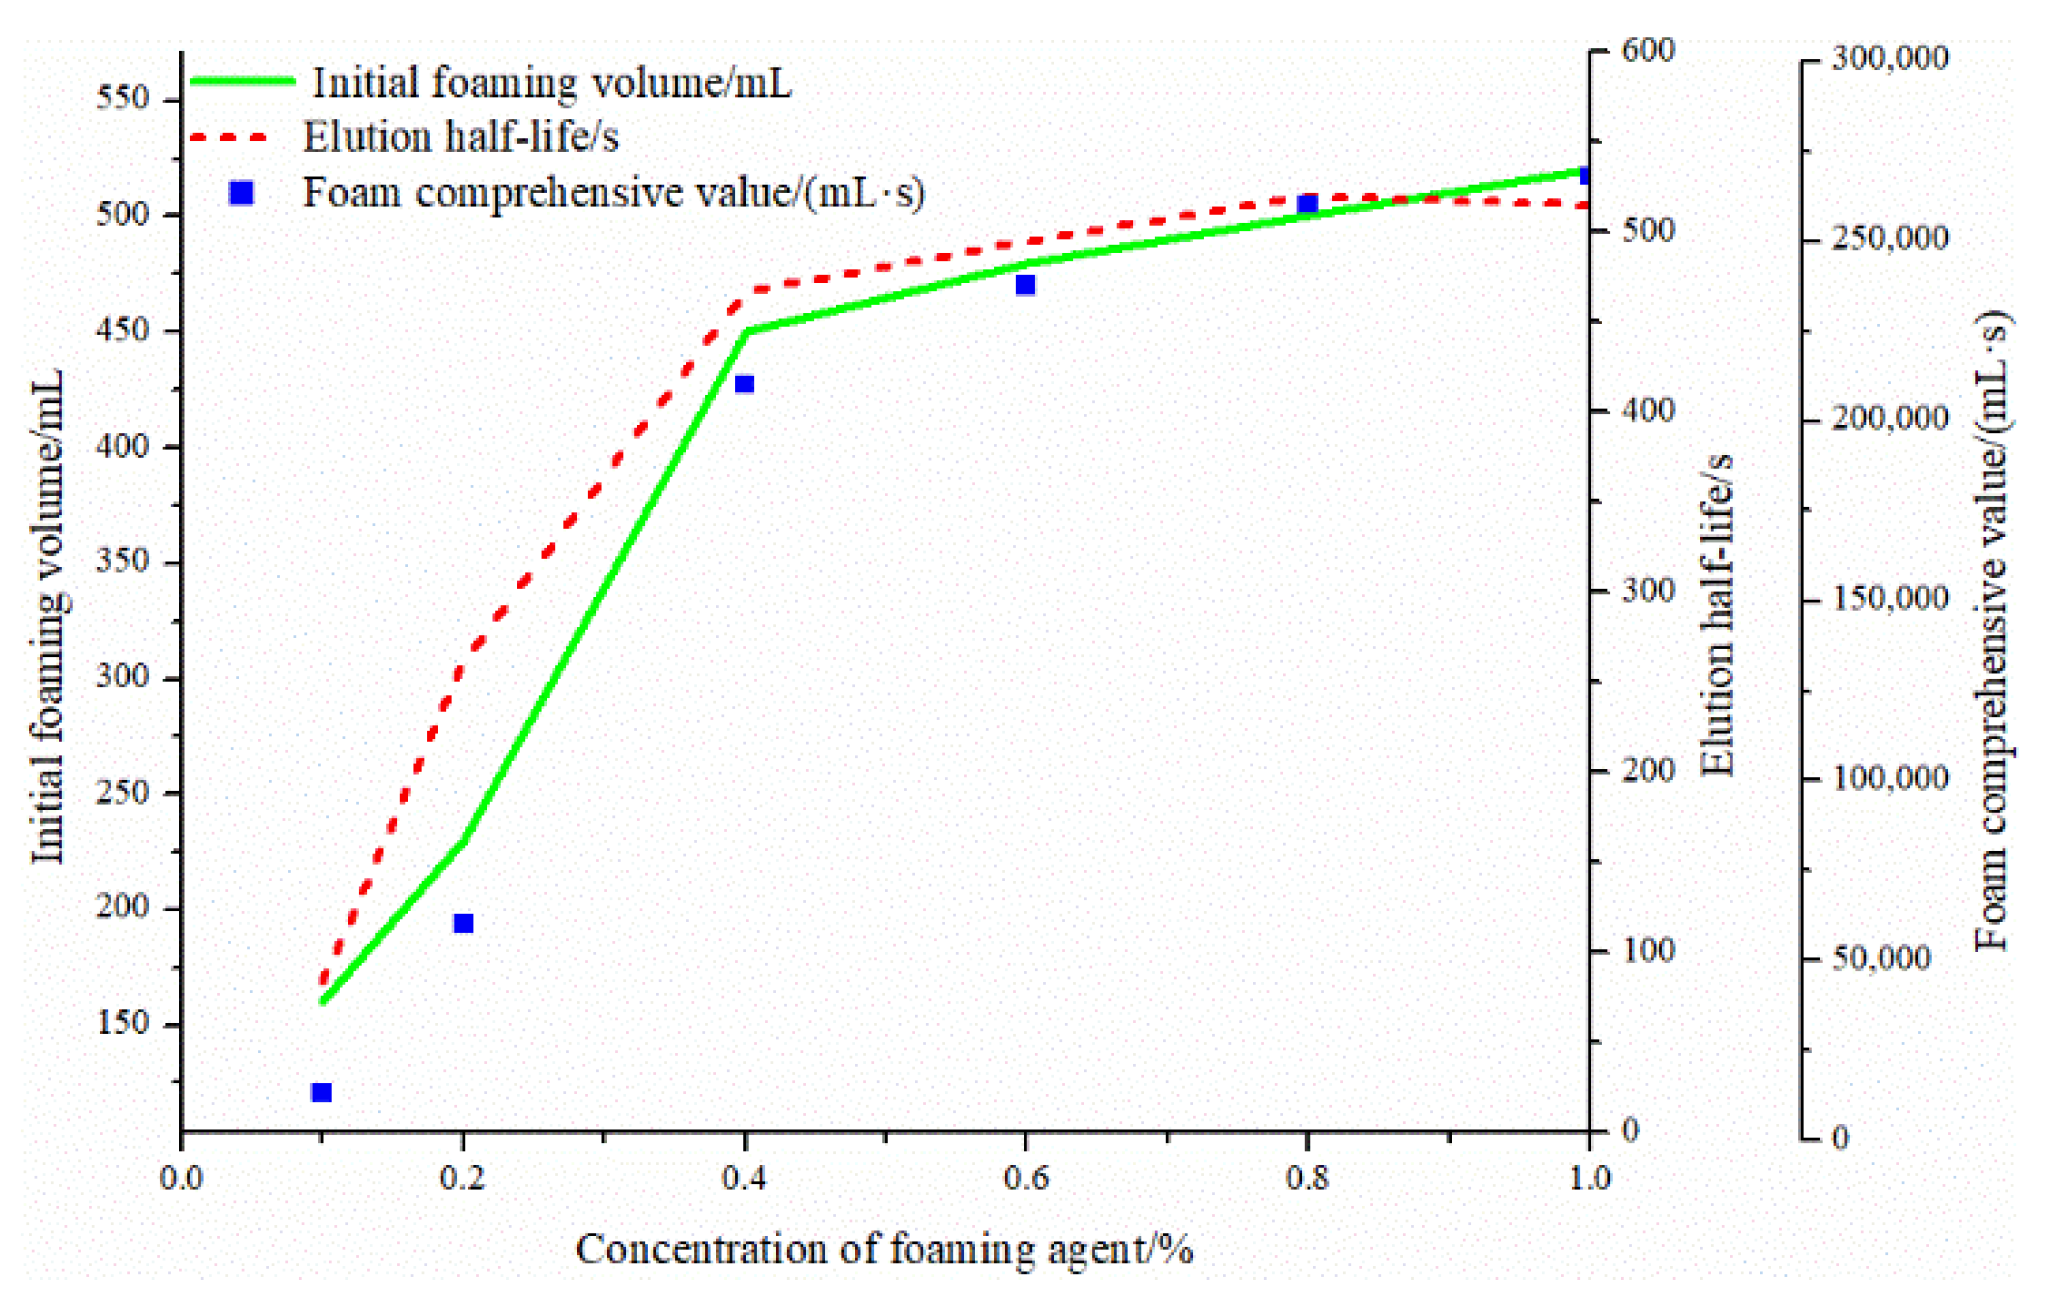
3.1.2. Foam Comprehensive Coefficient at Varying Concentrations of Foaming Agent
3.1.3. Binary/Ternary Composite Plugging System
- Pre-crosslinking gel particle
- 2.
- Enhanced gels with pre-crosslinking gel particle
- 3.
- Enhanced foam with pre-crosslinking gel particle and gels
3.2. Plugging and EOR Performance of Gel System
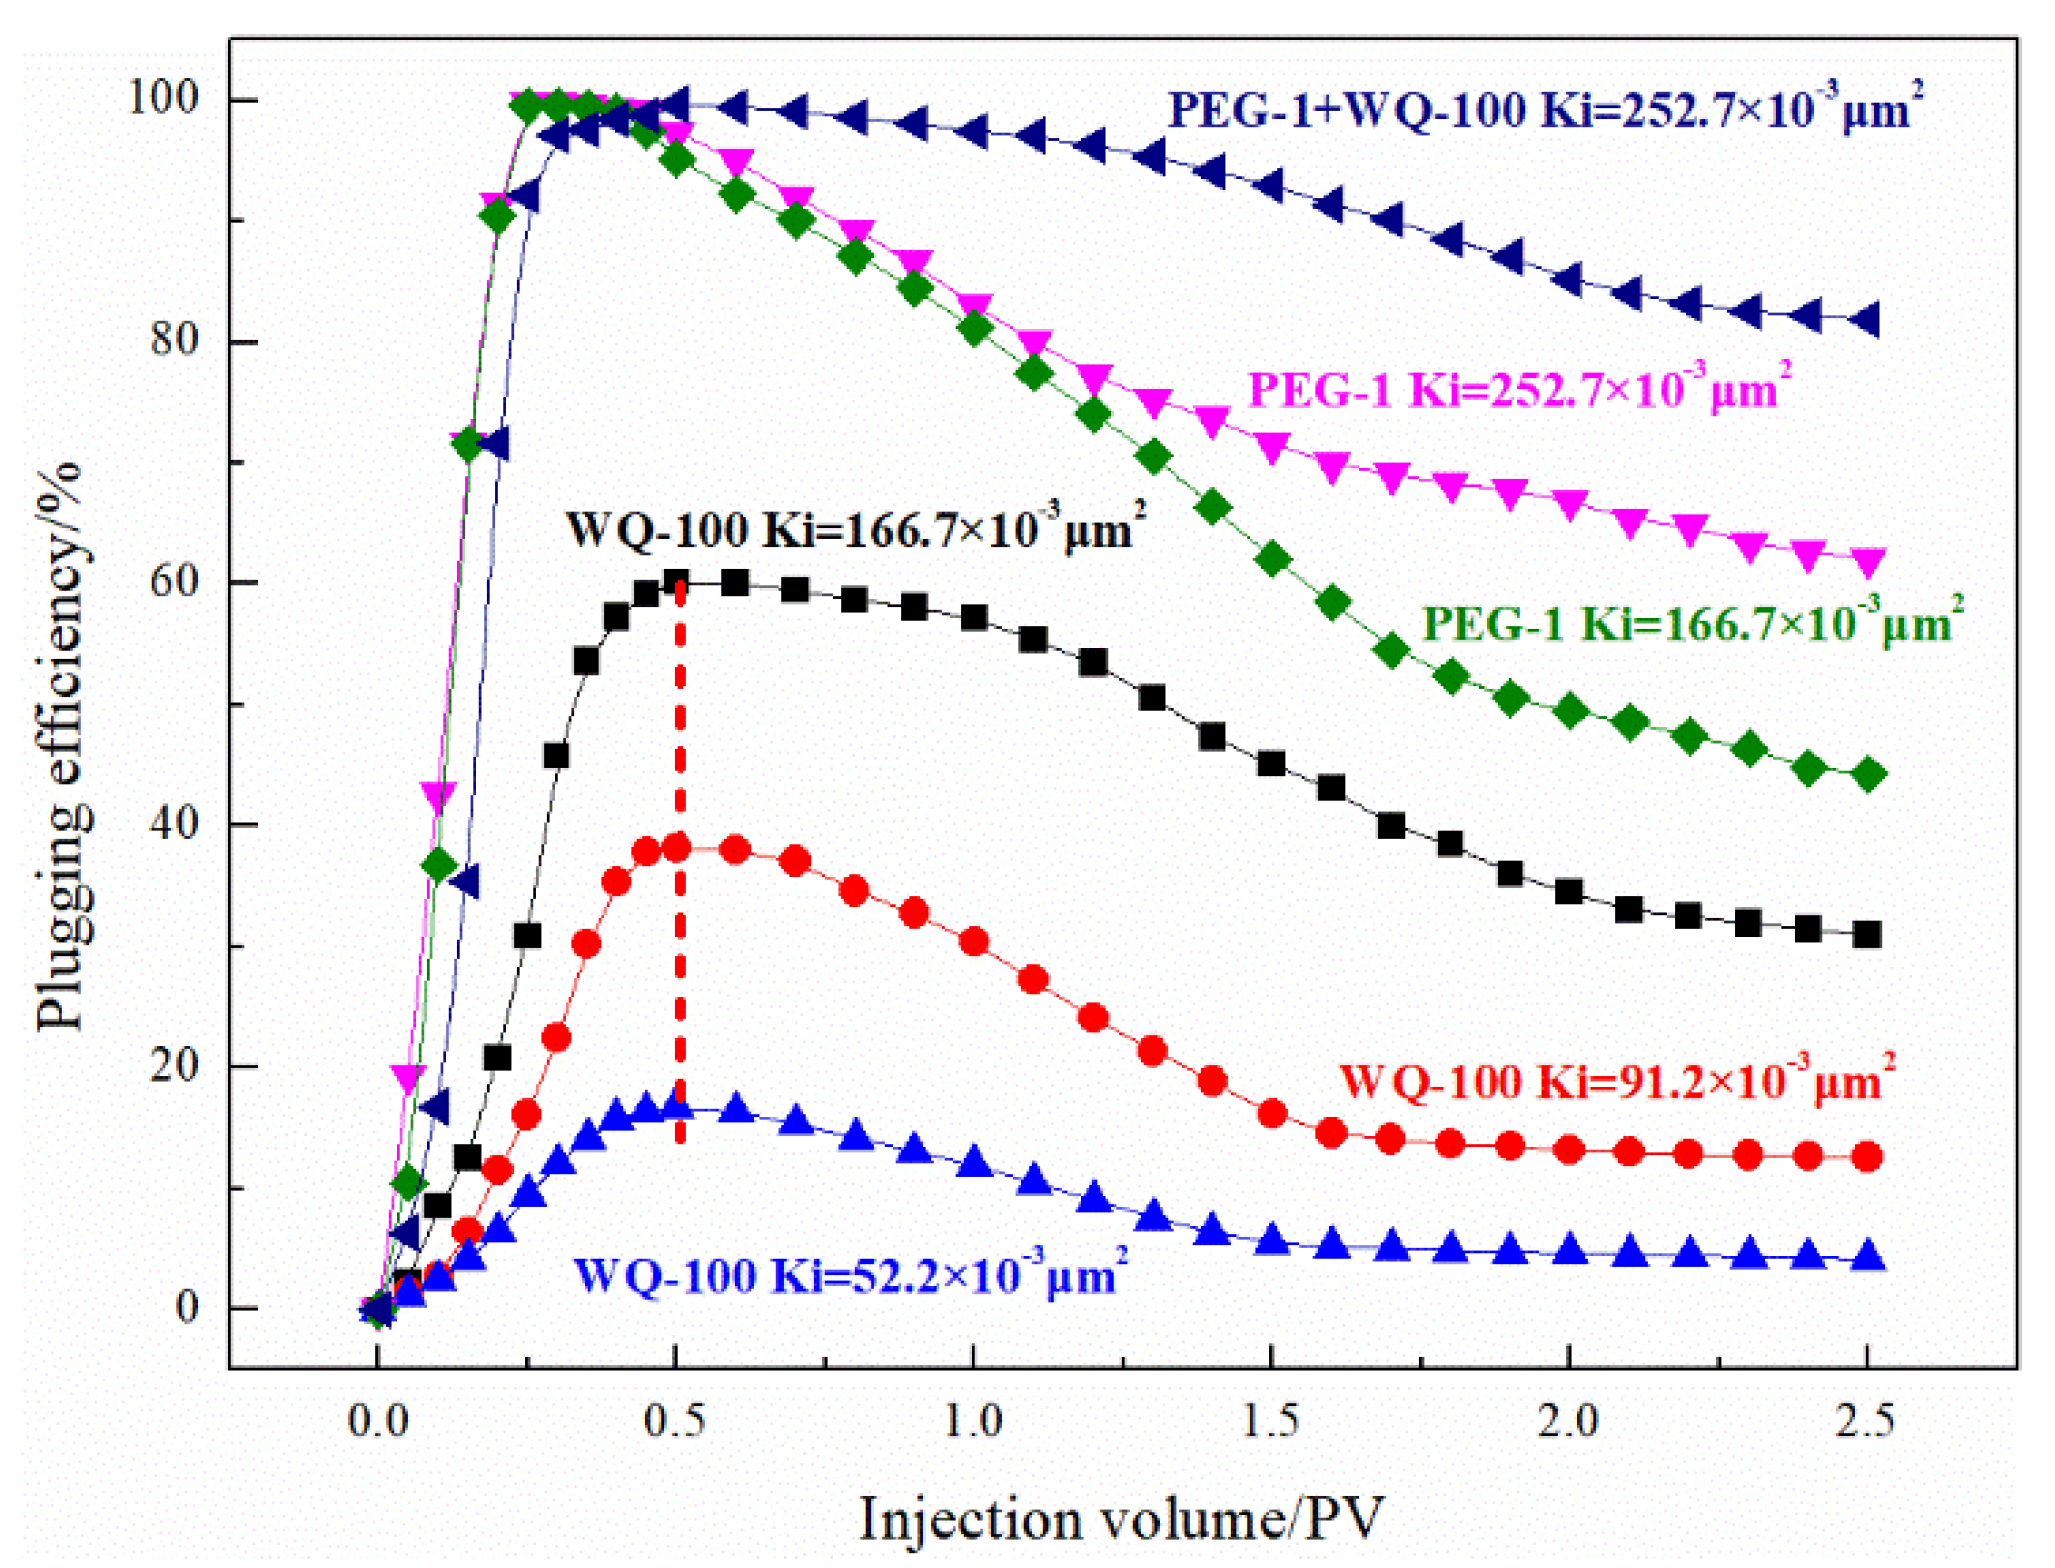
3.2.1. Plugging Performance
- Porous reservoir
- 2.
- Fractured reservoir
- 3.
- Pore-fractured reservoir
3.2.2. EOR Performance
3.3. Plugging and EOR Performance of Gel Enhanced Foam System
3.3.1. Plugging Performance
3.3.2. EOR Performance
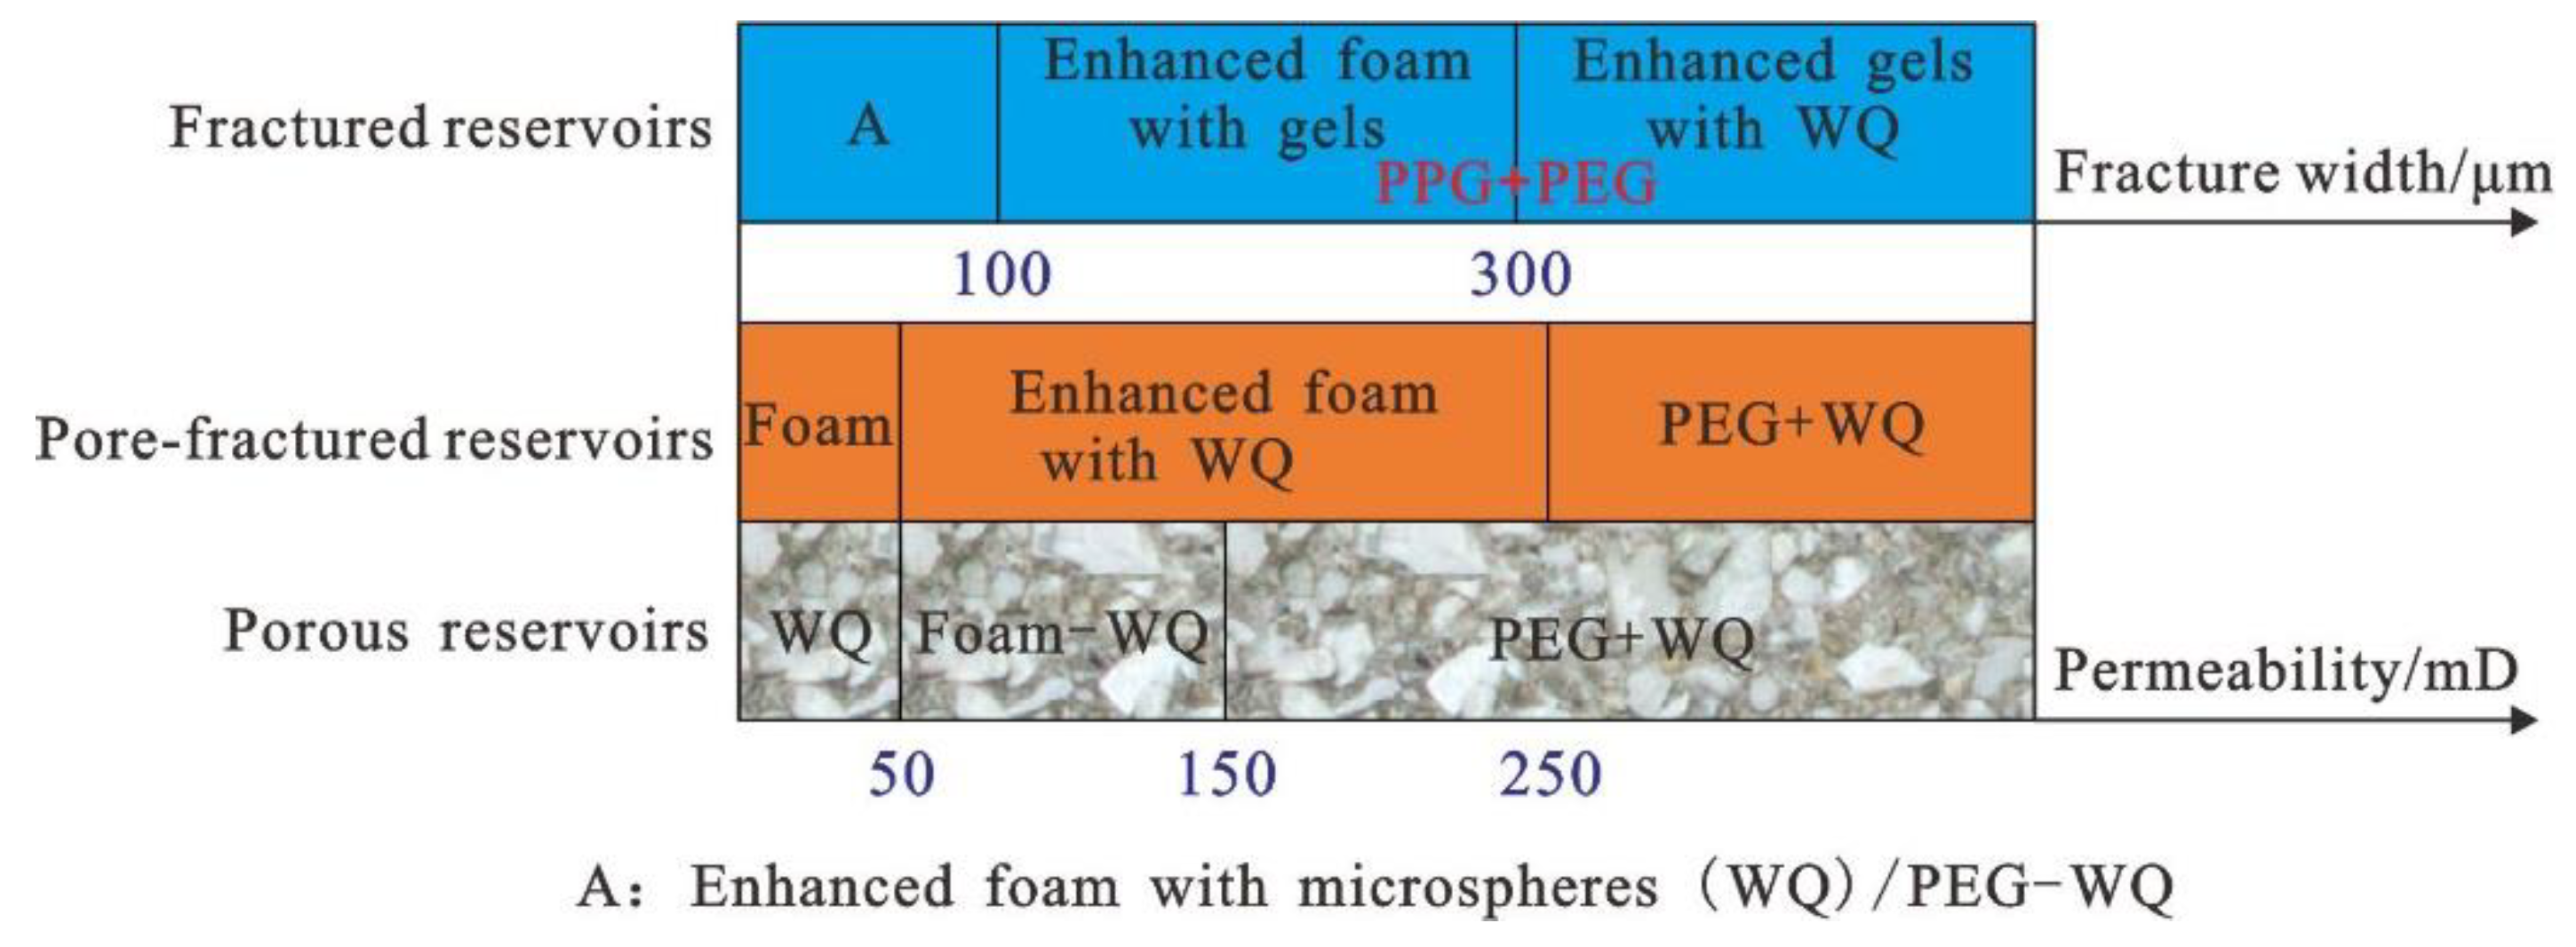
3.4. Construction of Profile and Control System Technique Plate
4. Conclusions
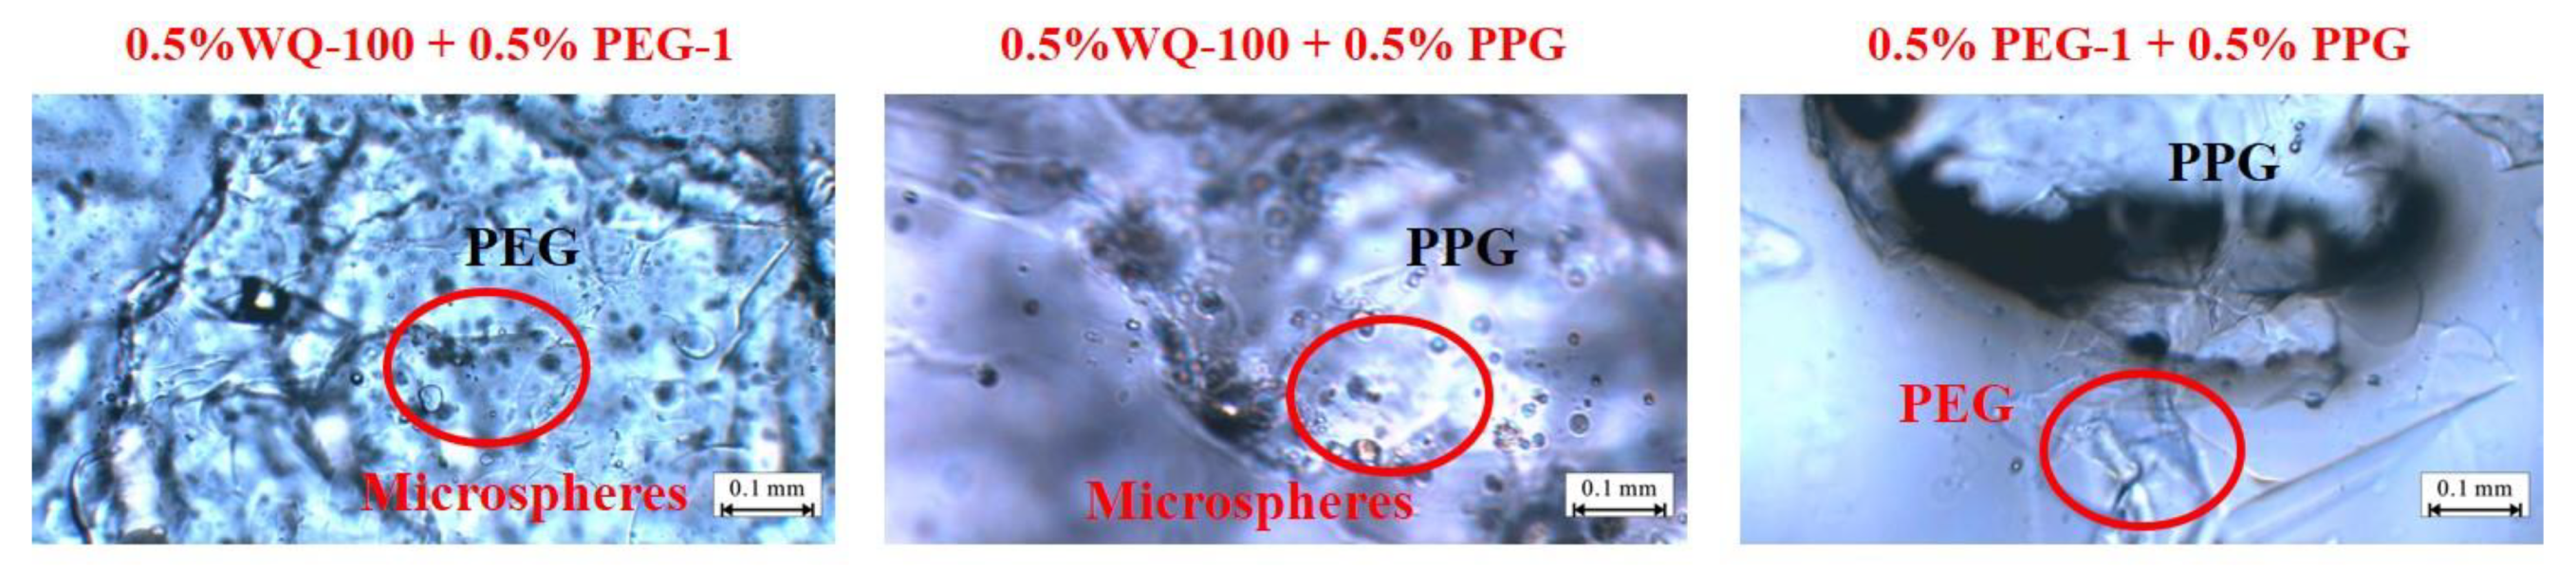
- (1)
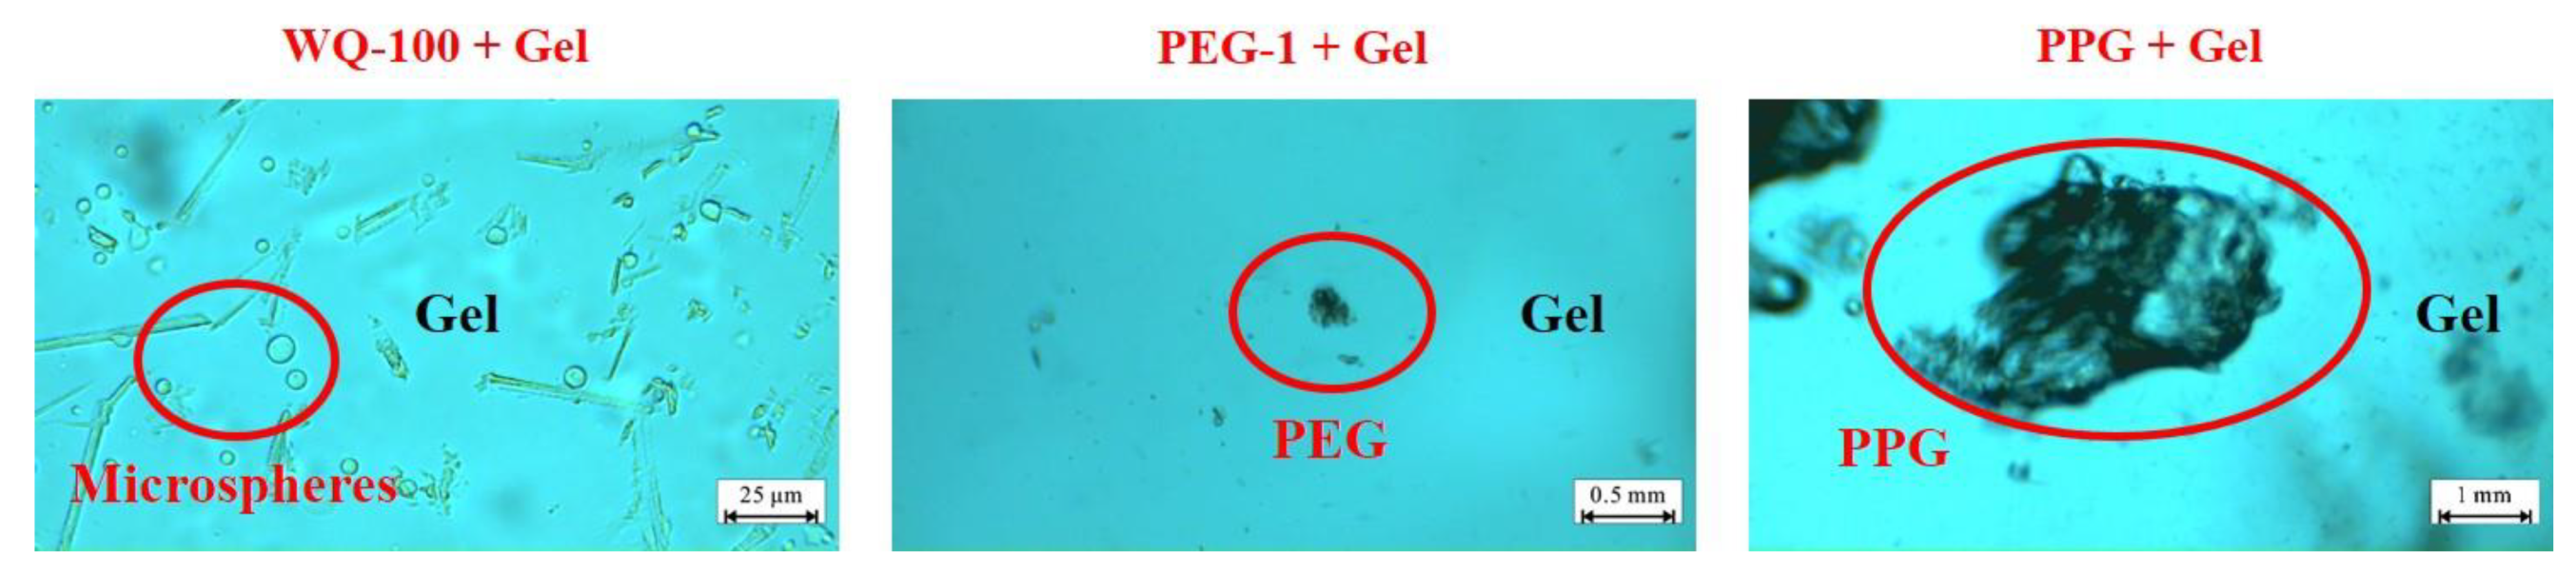
- The adsorption effect of microspheres (WQ-100) on the surface of PEG-1 is more potent than that of PPG, and the deposition is mainly on the surface of PPG. The adsorption effect of PEG-1 on the surface of PPG is not apparent, primarily manifested as deposition stacking.
- (2)
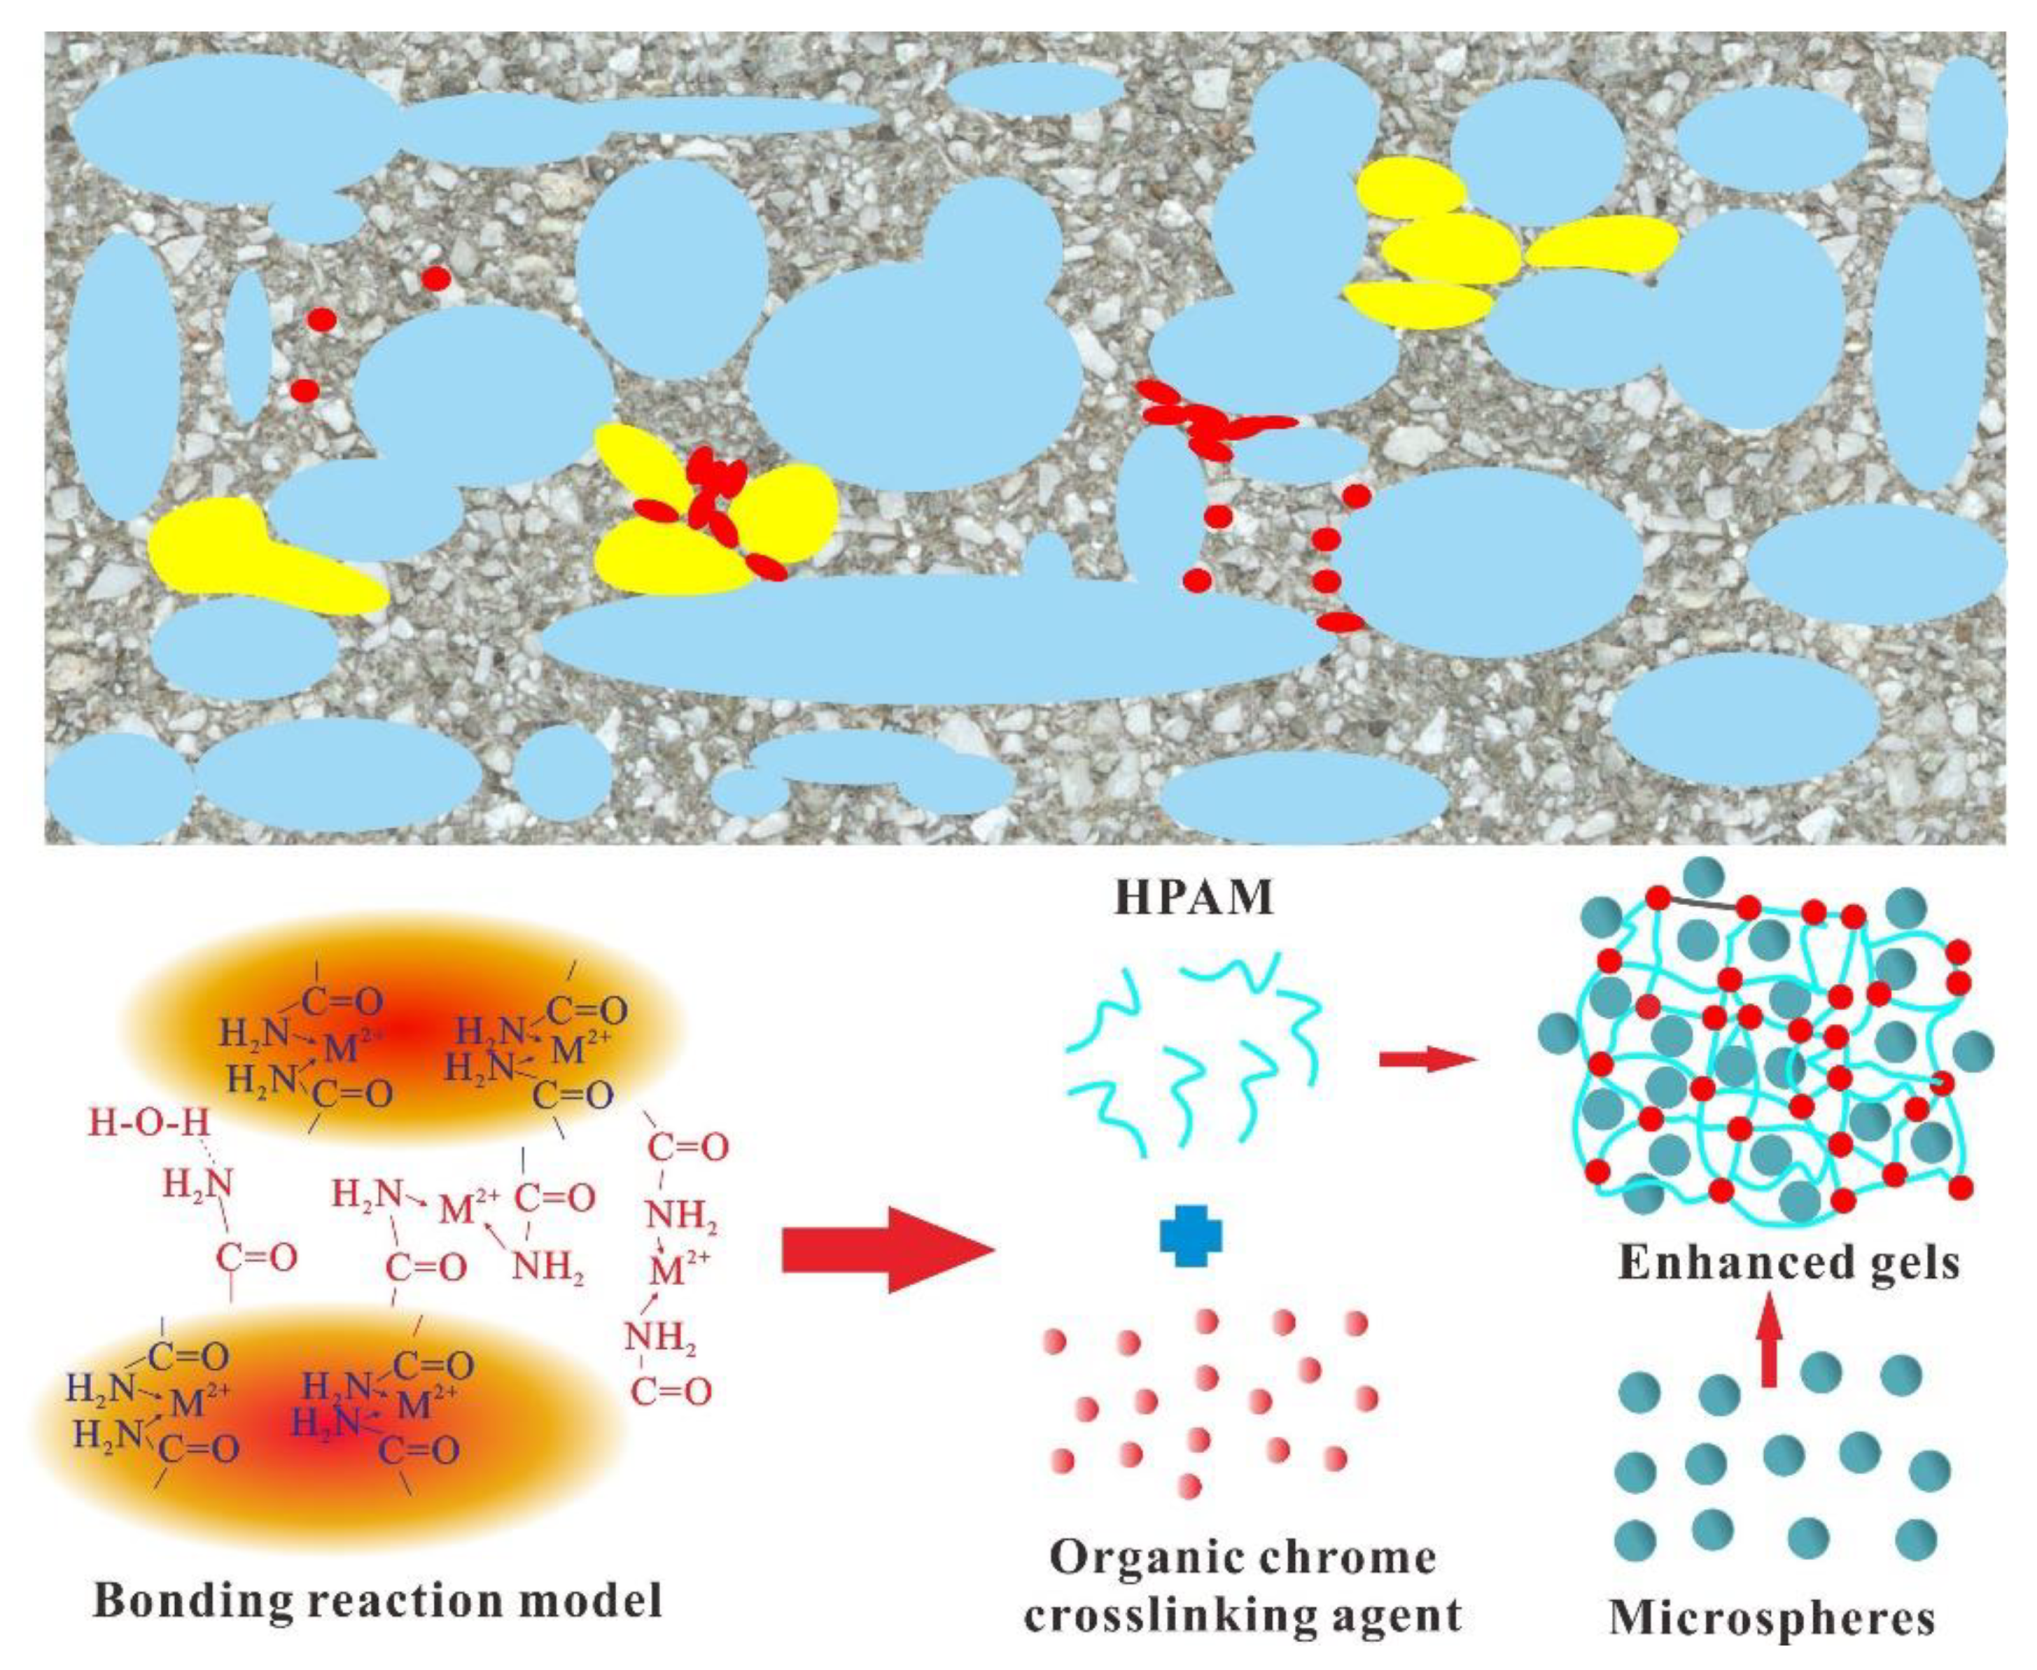
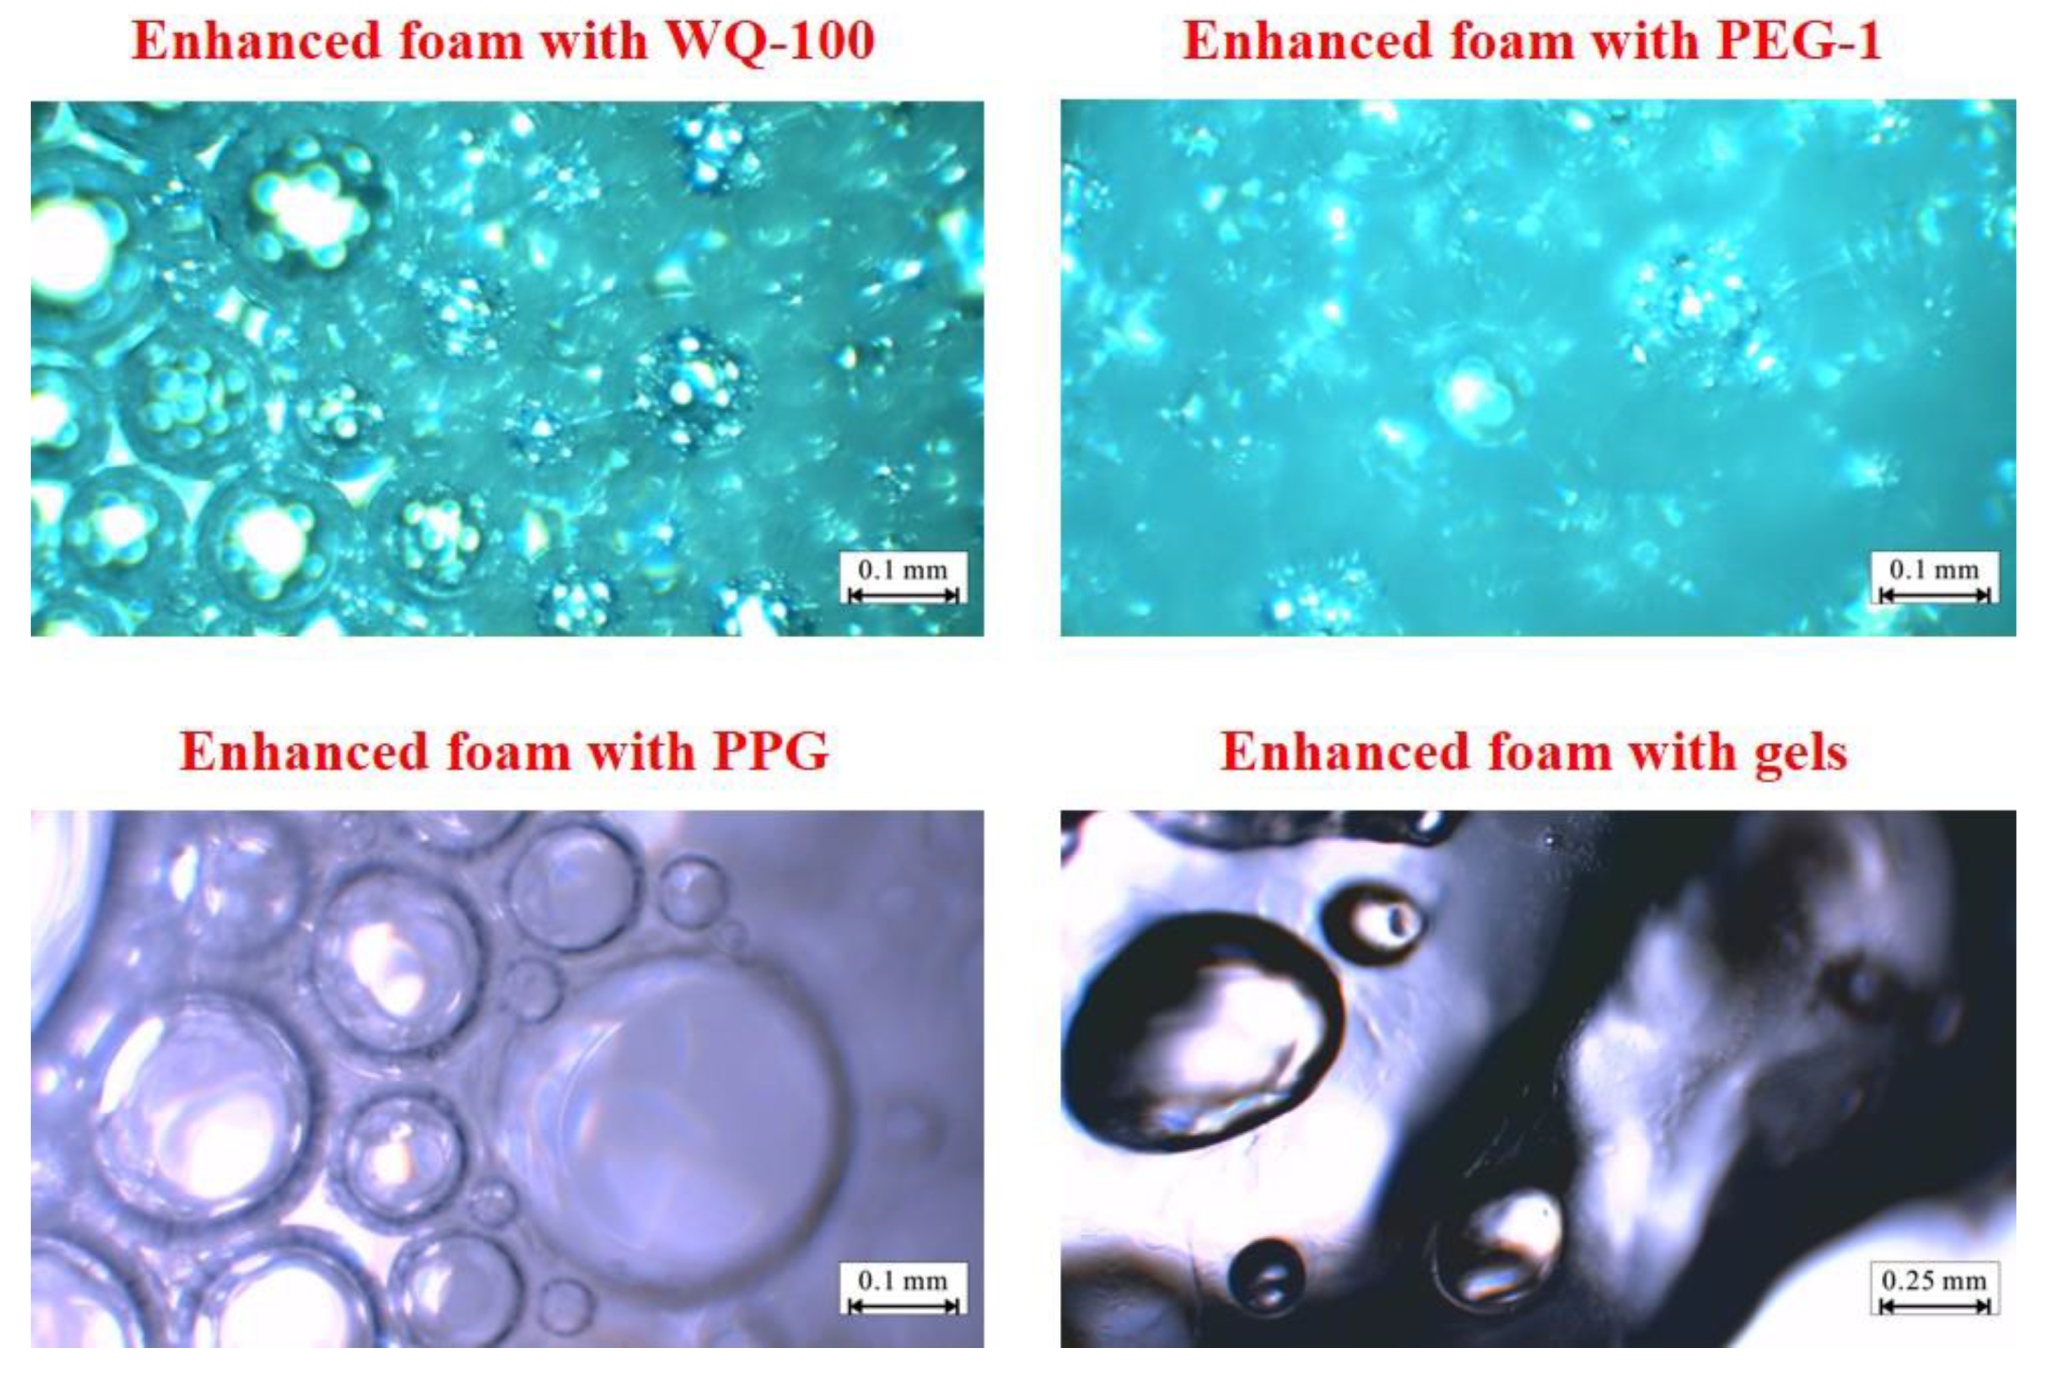
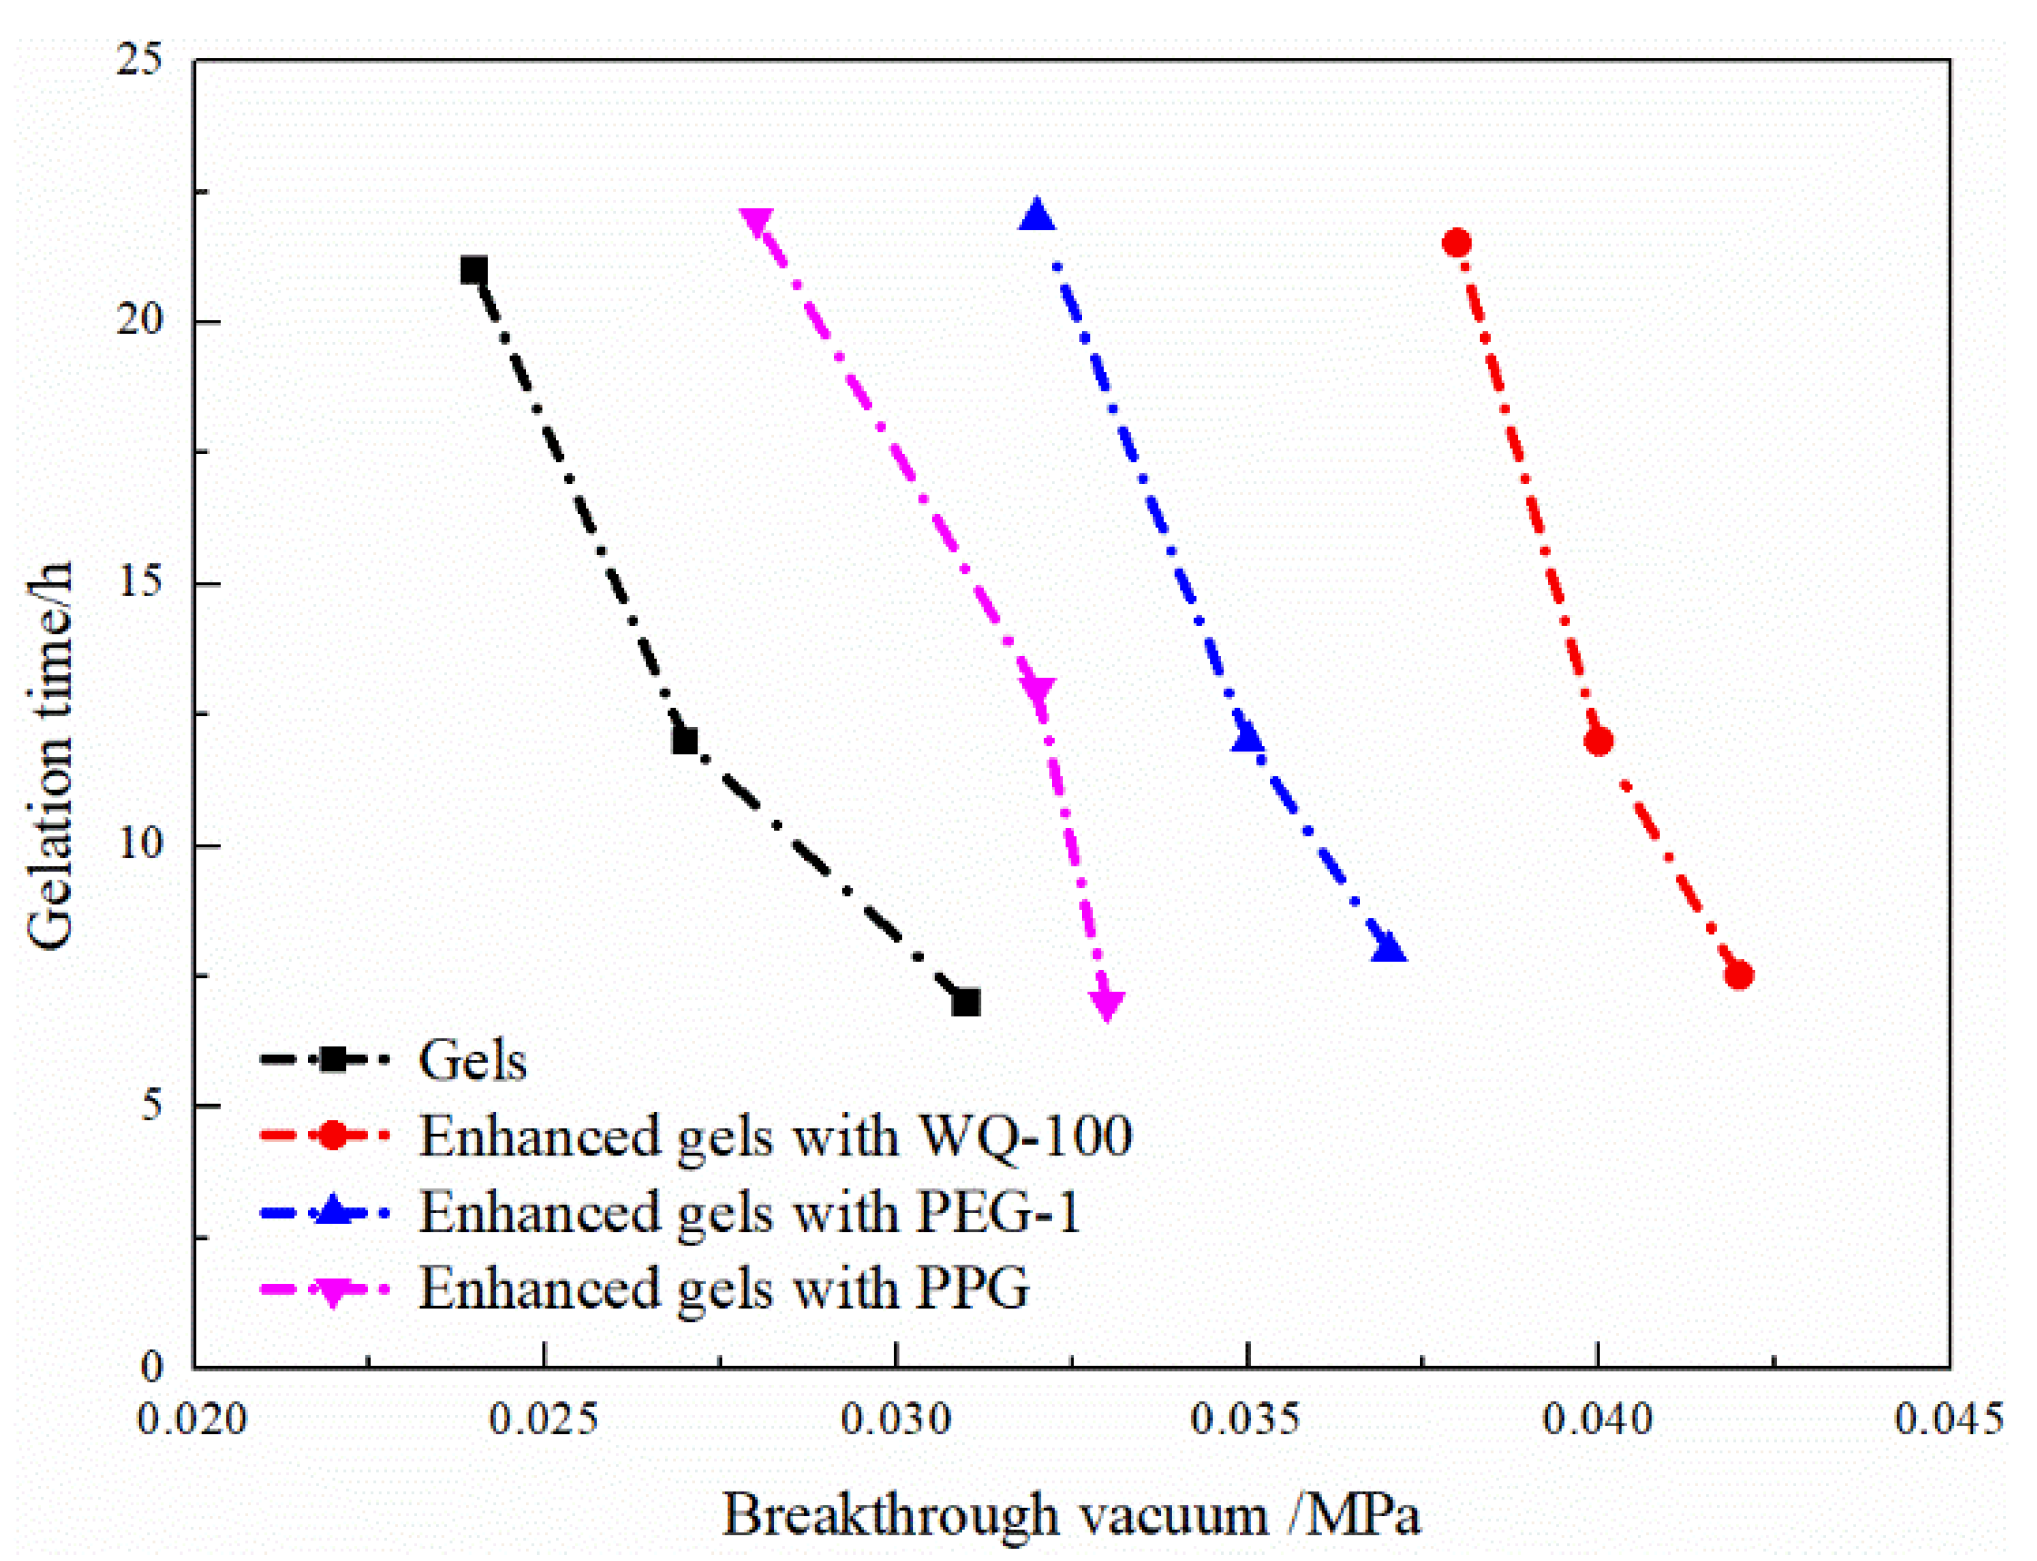
- The gel was synthesized with 0.2% HPAM + 0.2% organic chromium cross-linking agent, and the strength of enhanced gel with WQ-100 was higher than that of PEG-1 and PPG. The comprehensive value of WQ-100 reinforced foam is greater than that of PEG-1, and PPG reinforced foam and the enhanced foam with gel has a thick liquid film and poor foaming effect.
- (3)
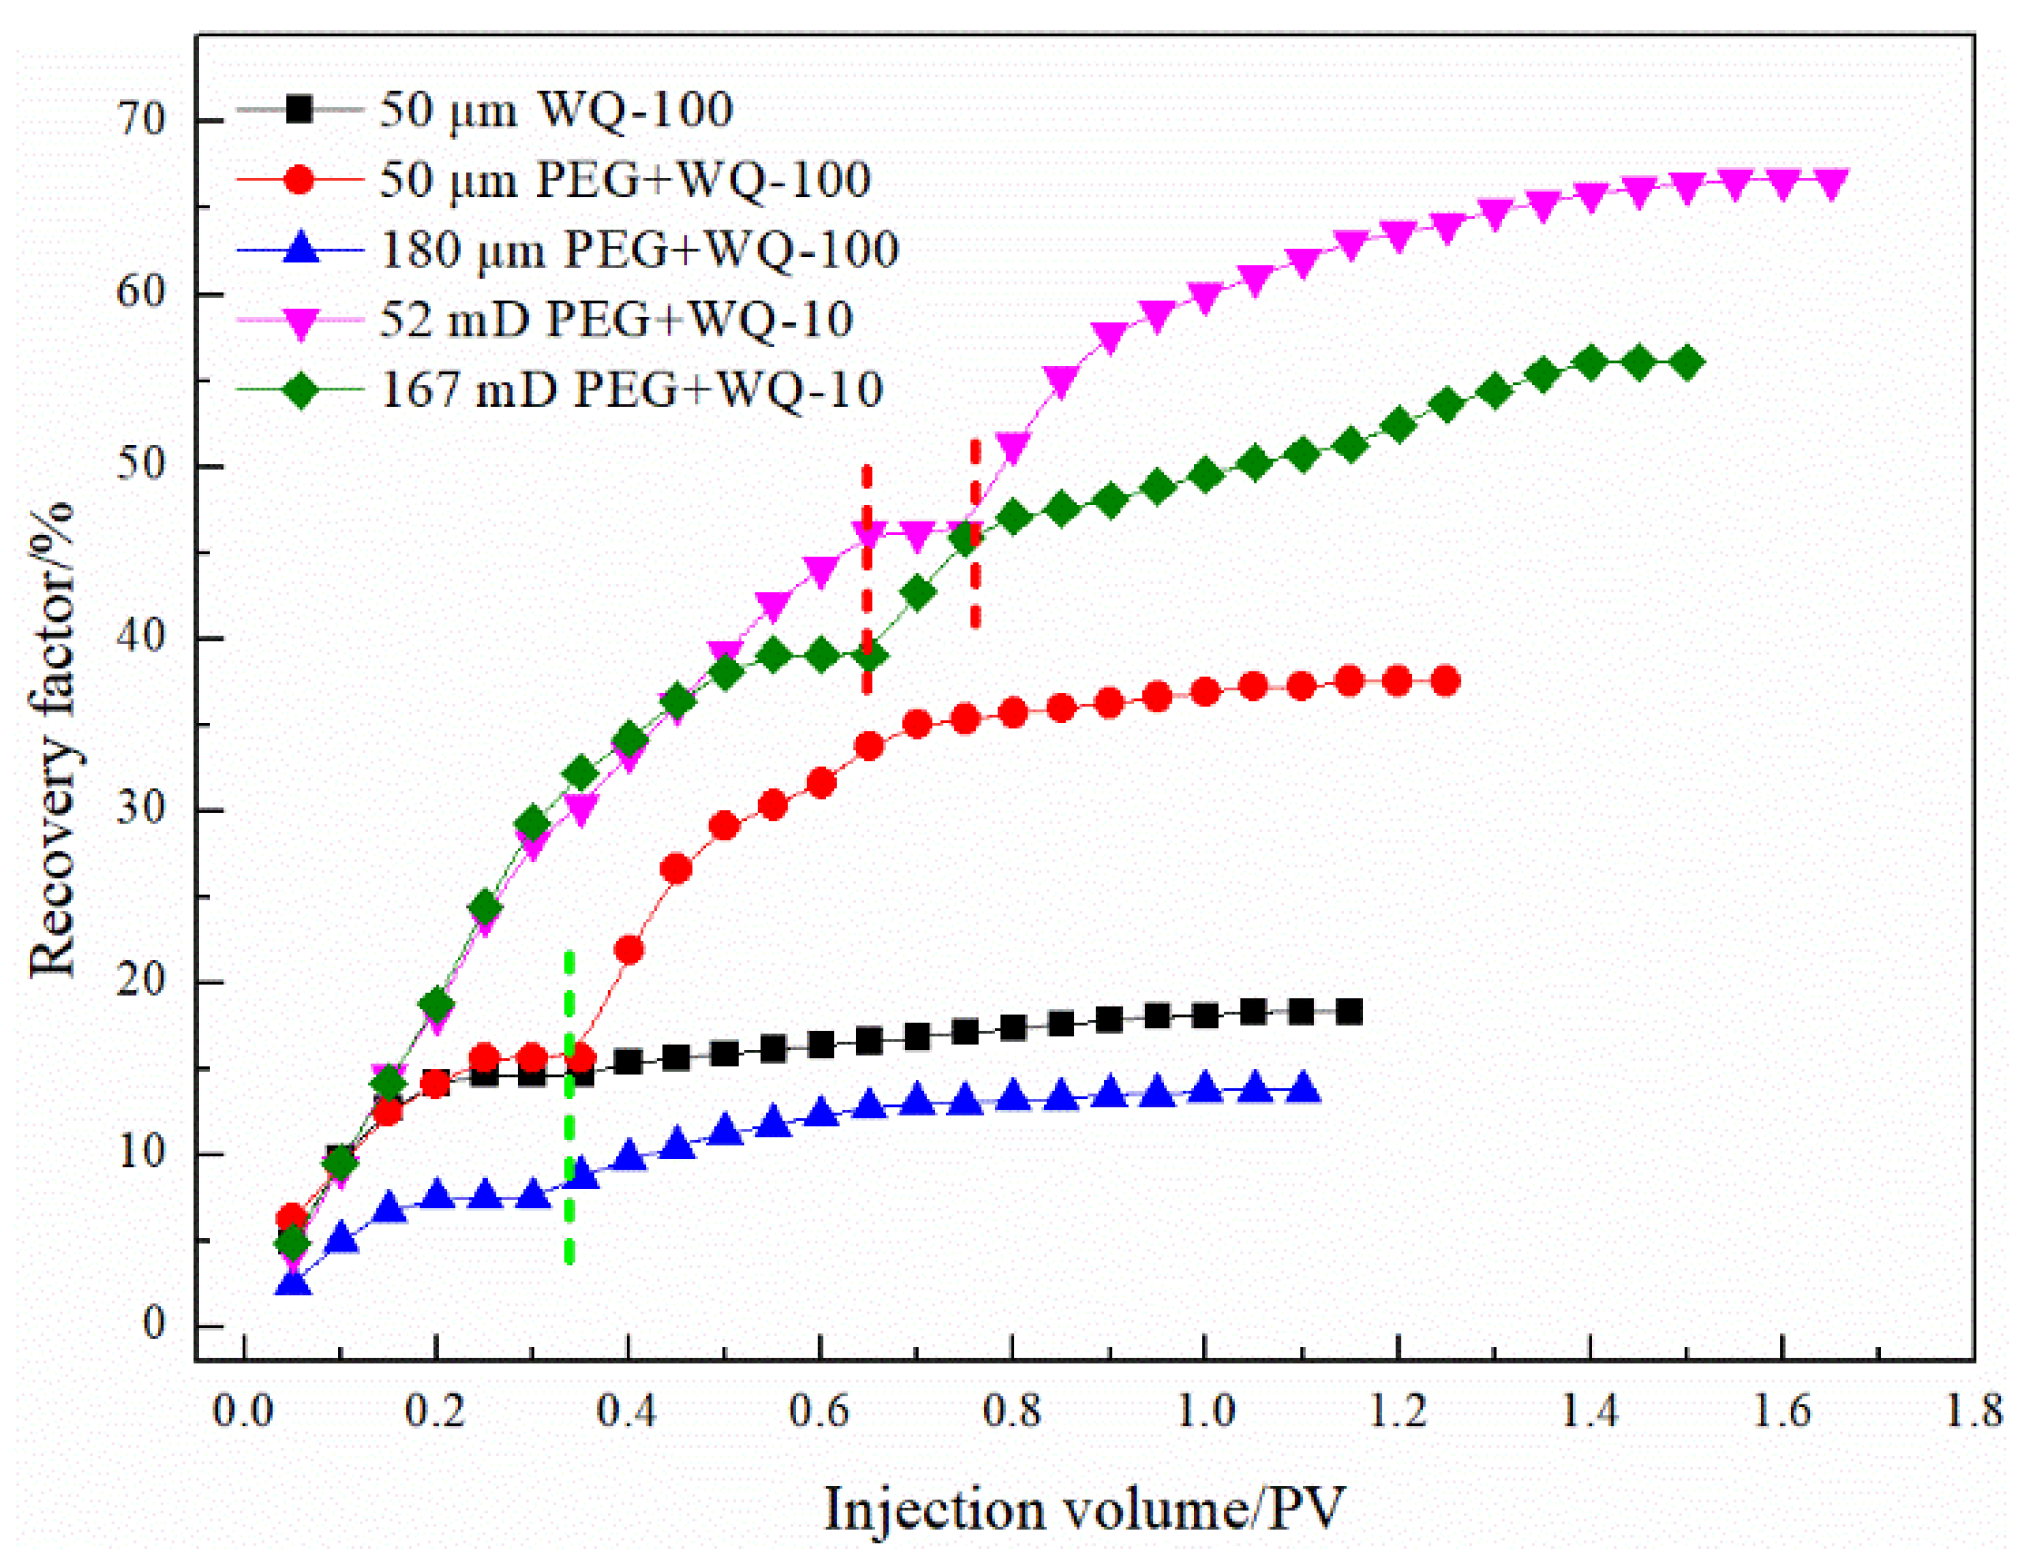
- For the heterogeneous porous reservoir with the permeability of 5/100 mD, the enhanced foam with WQ-100 shows better performance in plugging control and flooding, and the recovery factor increases by 28.05%. The improved foam with gel enhances the fluid flow diversion ability and the recovery factor of fractured reservoirs with fracture widths of 50 μm and 180 μm increases by 29.41% and 24.39%.
- (4)
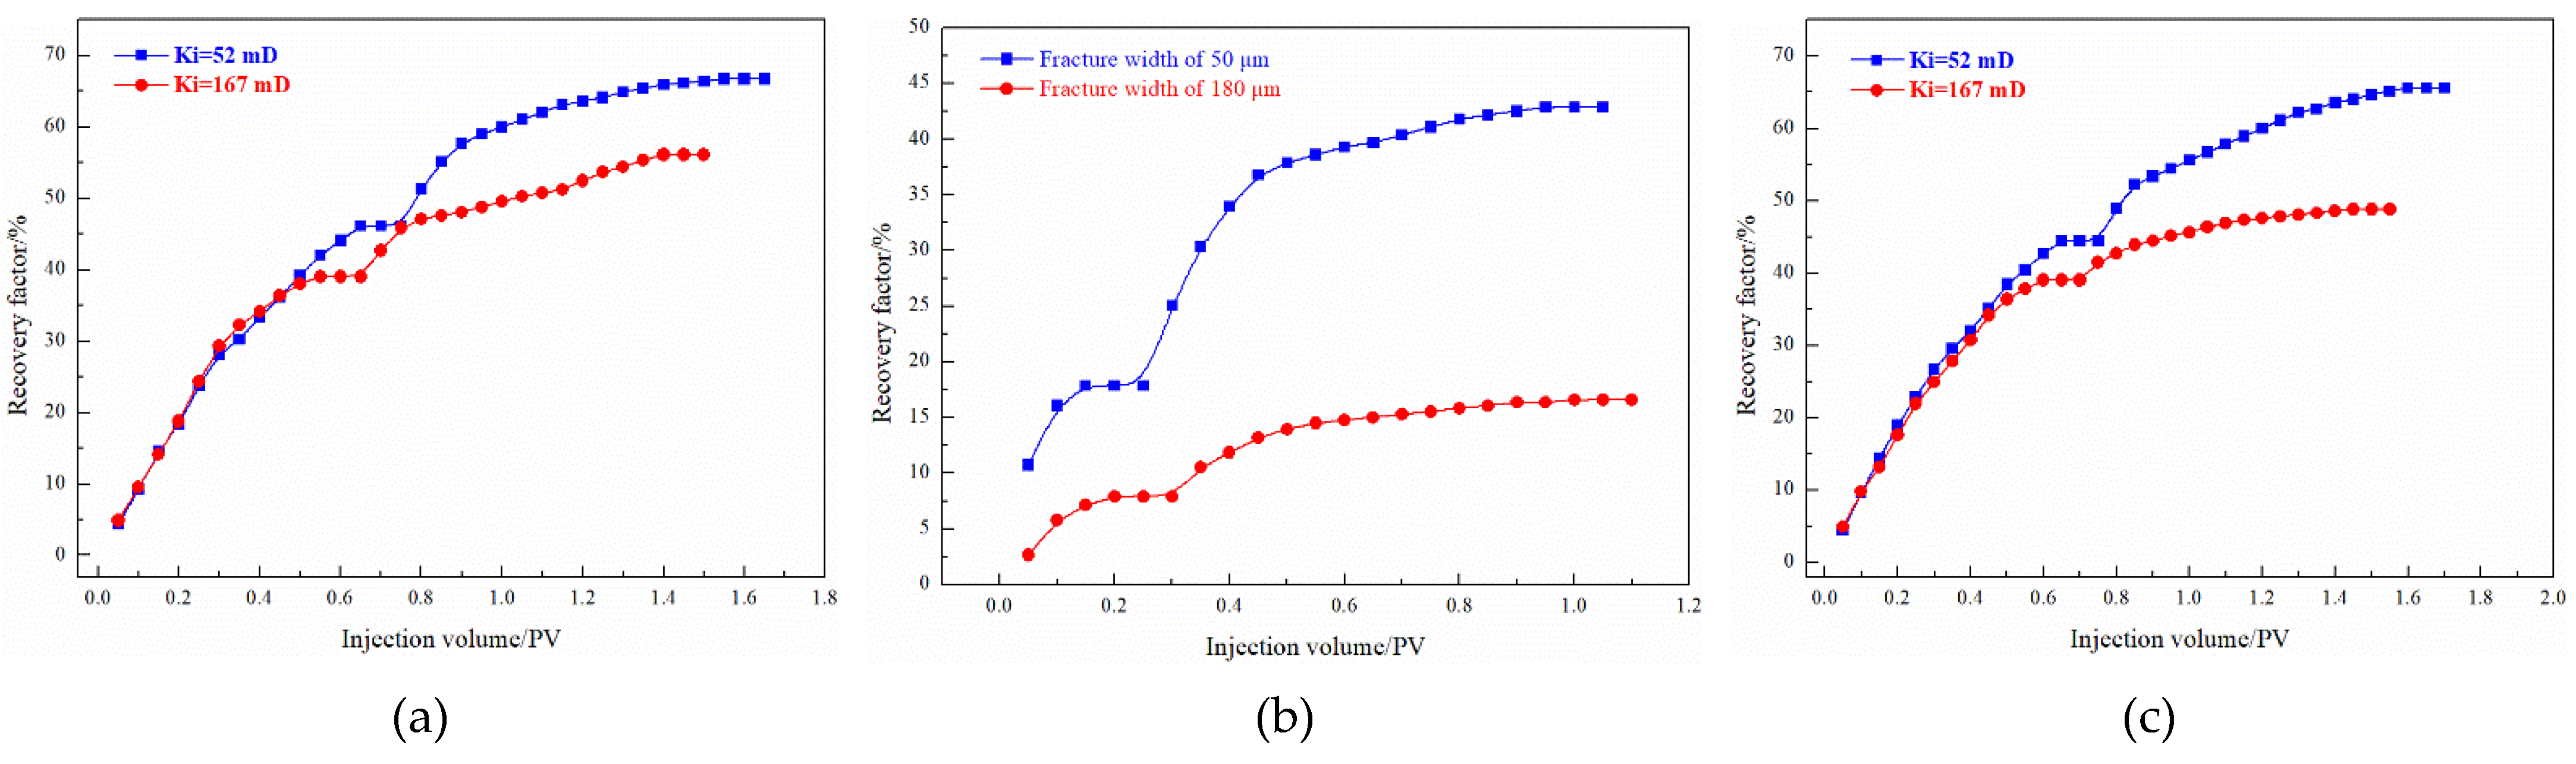
- For pore-fractured reservoirs with a permeability of 52/167 mD, the PEG + WQ-100 microsphere and enhanced foam with WQ-100 systems show better plugging and recovering performance, and the recovery factor increases are 20.52% and 17.08%, 24.44% and 21.43%, respectively.
- (5)
- The plugging performance of the composite gel system is stronger than that of the enhanced gel with foam. However, the oil displacement performance of the gel-enhanced foam is better than that of the composite gel system due to the “plug-flooding-integrated” feature of the foam.
Author Contributions
Funding
Institutional Review Board Statement
Informed Consent Statement
Data Availability Statement
Acknowledgments
Conflicts of Interest
References
- Wang, J.T.; Wang, Z.Y.; Sun, B.J.; Gao, Y.H.; Wang, X.; Fu, W.Q. Optimization design of hydraulic parameters for supercritical CO2 fracturing in unconventional gas reservoir. Fuel 2019, 235, 795–809. [Google Scholar] [CrossRef]
- Tian, Y.; Uzun, O.; Shen, Y.Z.; Lei, Z.D.; Yuan, J.R.; Chen, J.H.; Kazemi, H.; Wu, Y.S. Feasibility study of gas injection in low permeability reservoirs of Changqing oilfield. Fuel 2020, 274, 117831. [Google Scholar] [CrossRef]
- Jia, D.L.; Liu, H.; Zhang, J.Q.; Gong, B.; Pei, X.H.; Wang, Q.B.; Yang, Q.H. Data-driven optimization for fine water injection in a mature oil field. Petrol. Explor. Dev. 2020, 47, 674–682. [Google Scholar] [CrossRef]
- Yang, J.B.; Bai, Y.R.; Sun, J.S.; Lv, K.H.; Han, J.L.; Dai, L.Y. Experimental study on physicochemical properties of a shear thixotropic polymer gel for lost circulation control. Gels 2022, 8, 229. [Google Scholar] [CrossRef]
- Zhu, D.Y.; Bai, B.J.; Hou, J.R. Polymer gel systems for water management in high-temperature petroleum reservoirs: A chemical review. Energy Fuels 2017, 31, 13063–13087. [Google Scholar] [CrossRef]
- Xie, K.; Su, C.; Liu, C.L.; Cao, W.J.; He, X.; Ding, H.N.; Mei, J.; Yan, K.; Cheng, Q.; Lu, X.G. Synthesis and performance evaluation of an organic/inorganic composite gel plugging system for offshore oilfields. ACS Omega 2022, 7, 12870–12878. [Google Scholar] [CrossRef]
- Jia, H.; Kang, Z.; Zhu, J.Z.; Ren, L.L.; Cai, M.J.; Wang, T.; Xu, Y.B.; Li, Z.J. High density bromide-based nanocomposite gel for temporary plugging in fractured reservoirs with multi-pressure systems. J. Pet. Sci. Eng. 2021, 205, 108778. [Google Scholar] [CrossRef]
- Xu, T.H.; Wang, J.; Bai, Z.W.; Wang, J.H.; Zhao, P. Plugging performance of a new sulfonated tannin gel system applied in tight oil reservoir. Geofluids 2022, 2022, 3602242. [Google Scholar] [CrossRef]
- Gao, H.; Xu, R.Z.; Xie, Y.G. Quantitative evaluation of the plugging effect of the gel particle system flooding agent using NMR technique. Energy Fuels 2020, 34, 4329–4337. [Google Scholar] [CrossRef]
- Zhao, G.; Dai, C.; Chen, A.; Yan, Z.; Zhao, M. Experimental study and application of gels formed by nonionic polyacrylamide and phenolic resin for in-depth profile control. J. Pet. Sci. Eng. 2015, 135, 552–560. [Google Scholar] [CrossRef]
- Jia, H.; Niu, C.C.; Yang, X.Y. Improved understanding nanocomposite gel working mechanisms: From laboratory investigation to wellbore plugging application. J. Pet. Sci. Eng. 2020, 191, 107214. [Google Scholar] [CrossRef]
- Huang, B.; Zhang, W.S.; Zhou, Q.; Fu, C.; He, S.B. Preparation and experimental study of a low-initial-viscosity gel plugging agent. ACS Omega 2020, 5, 15715–15727. [Google Scholar] [CrossRef]
- Liu, J.B.; Zhong, L.G.; Wang, C.; Li, S.H.; Yuan, X.N.; Liu, Y.G.; Meng, X.H.; Zou, J.; Wang, Q.X. Investigation of a high temperature gel system for application in saline oil and gas reservoirs for profile modification. J. Pet. Sci. Eng. 2021, 202, 108416. [Google Scholar] [CrossRef]
- Sheng, Y.J.; Peng, Y.C.; Zhang, S.W.; Guo, Y.; Ma, L.; Wang, Q.H.; Zhang, H.L. Study on thermal stability of gel foam co-stabilized by hydrophilic silica nanoparticles and surfactants. Gels 2022, 8, 123. [Google Scholar] [CrossRef]
- Li, X.; Pu, C.S.; Chen, X. A novel foam system stabilized by hydroxylated multiwalled carbon nanotubes for enhanced oil recovery: Preparation, characterization and evaluation. Colloids Surfaces A Phys. Eng. Asp. 2022, 632, 127804. [Google Scholar] [CrossRef]
- Lai, N.J.; Zhao, J.; Zhu, Y.Q.; Wen, Y.P.; Huang, Y.J.; Han, J.H. Influence of different oil types on the stability and oil displacement performance of gel foams. Colloids Surfaces A Phys. Eng. Asp. 2021, 630, 127674. [Google Scholar] [CrossRef]
- Zhang, F.; Schechter, D.S. Gas and foam injection with CO2 and enriched NGL’s for enhanced oil recovery in unconventional liquid reservoirs. J. Pet. Sci. Eng. 2021, 202, 108472. [Google Scholar] [CrossRef]
- Li, D.Q.; Li, F.; Deng, S.; Liu, J.H.; Huang, Y.H.; Yang, S. Preparation of oil-based foam gel with nano-SiO2 as foam stabilizer and evaluation of its performance as a plugging agent for fractured shale. Geofluids 2022, 2022, 9539999. [Google Scholar] [CrossRef]
- Jin, F.Y.; Jiang, T.T.; Varfolomeev, M.A.; Yuan, C.D.; Zhao, H.Y.; He, L.; Jiao, B.L.; Du, D.J.; Xie, Q. Novel preformed gel particles with controllable density and its implications for EOR in fractured-vuggy carbonated reservoirs. J. Pet. Sci. Eng. 2021, 205, 108903. [Google Scholar] [CrossRef]
- Dijvejin, Z.A.; Ghaffarkhah, A.; Sadeghnejad, S.; Sefti, M.V. Effect of silica nanoparticle size on the mechanical strength and wellbore plugging performance of SPAM/chromium (III) acetate nanocomposite gels. Polym. J. 2019, 51, 693–707. [Google Scholar] [CrossRef]
- Ren, G.W. Assess the potentials of CO2 soluble surfactant when applying supercritical CO2 foam. Part I: Effects of dual phase partition. Fuel 2020, 277, 118086. [Google Scholar] [CrossRef]
- Sun, H.Q.; Wang, Z.W.; Sun, Y.H.; Wu, G.H.; Sun, B.Q.; Sha, Y. Laboratory evaluation of an efficient low interfacial tension foaming agent for enhanced oil recovery in high temperature flue-gas foam flooding. J. Pet. Sci. Eng. 2020, 195, 107580. [Google Scholar] [CrossRef]
- Li, Q.; Yu, X.R.; Wang, L.L.; Qu, S.S.; Wu, W.C.; Ji, R.J.; Luo, Y.; Yang, H. Nano-silica hybrid polyacrylamide/polyethylenimine gel for enhanced oil recovery at harsh conditions. Colloids Surfaces A Phys. Eng. Asp. 2022, 633, 127898. [Google Scholar] [CrossRef]
- Lin, R.Y.; Luo, P.Y.; Sun, Y.; Pan, Y.; Sun, L. Experimental study on the optimization of multi-level nano–microsphere deep profile control in the process of gas injection in fracture-type buried-hill reservoirs. ACS Omega 2021, 6, 24185–24195. [Google Scholar] [CrossRef]
- Liang, S.; Hu, S.Q.; Li, J.; Xu, G.R.; Zhang, B.; Zhao, Y.D.; Yan, H.; Li, J.Y. Study on EOR method in offshore oilfield: Combination of polymer microspheres flooding and nitrogen foam flooding. J. Pet. Sci. Eng. 2019, 178, 629–639. [Google Scholar] [CrossRef]
- Wang, T.F.; Fan, H.M.; Yang, W.P.; Meng, Z. Stabilization mechanism of fly ash three-phase foam and its sealing capacity on fractured reservoirs. Fuel 2020, 264, 116832. [Google Scholar] [CrossRef]


| Enhanced Foam System | Interfacial Tension/(mN/m) | Note |
|---|---|---|
| 0.4% foaming agent | 35.2 | / |
| 0.4% foaming agent + 0.1% WQ-100 | 33.6 | Reduce surface tension |
| 0.4% foaming agent + 0.1% PEG-1 | 34.8 | Not significantly |
| 0.4% foaming agent + 0.1% PPG | / | Particle size is too large to measure |
| 0.4% foaming agent + 0.2% HPAM + 0.1% organic chromium cross-linking agent | 46.5 | Liquid film gelation, foam stabilization |
| Physical Models | Fracture Width /μm | Porosity before Splitting /% | Permeability before Splitting /× 10−3 μm2 | Permeability after Splitting /× 10−3 μm2 |
|---|---|---|---|---|
| Fractured models | 50 | 19.5 | 5.3 | 90,000 |
| 180 | 20.6 | 4.6 | 2,480,000 | |
| 340 | 21.2 | 6 | 31,200,000 | |
| 510 | 20.4 | 4.7 | 87,000,000 | |
| Pore-fractured models | Matrix volume /cm3 | Microfracture volume/cm3 | Porosity /% | Permeability /× 10−3 μm2 |
| 295 | 0.4 | 27.1 | 52.2 | |
| 0.8 | 28.4 | 91.2 | ||
| 1.2 | 29.8 | 166.7 | ||
| 1.6 | 31.2 | 252.7 |
| Concentration of Foaming Agent/% | Initial Foaming Volume/mL | Elution Half-Life/s | Foam Composite Value/(mL s) |
|---|---|---|---|
| 0.1 | 160 | 83 | 13,280 |
| 0.2 | 230 | 262 | 60,260 |
| 0.4 | 450 | 467 | 210,150 |
| 0.6 | 480 | 495 | 237,600 |
| 0.8 | 500 | 520 | 260,000 |
| 1.0 | 520 | 515 | 267,800 |
| HPAM/% | Gel Agent | Organic Chromium Crosslinking Agent/% | Breakthrough Vacuum /MPa | Gelation Time/h |
|---|---|---|---|---|
| 0.2 | 0.1 | 0.024 | 21 | |
| 0.2 | 0.027 | 12 | ||
| 0.3 | 0.031 | 7 | ||
| 0.2% WQ-100 | 0.1 | 0.038 | 21.5 | |
| 0.2 | 0.040 | 12 | ||
| 0.3 | 0.042 | 7.5 | ||
| 0.2% PEG-1 | 0.1 | 0.032 | 22 | |
| 0.2 | 0.035 | 12 | ||
| 0.3 | 0.037 | 8 | ||
| 0.2% PPG | 0.1 | 0.028 | 22 | |
| 0.2 | 0.032 | 13 | ||
| 0.3 | 0.033 | 7 |
| Plugging System | Initial Permeability /10−3 μm2 | Plugging Efficiency /% | Plugging Efficiency after Injection 10 PV Formation Water |
|---|---|---|---|
| 0.5% WQ-100 0.5 PV | 4.8 | 92.05 | 79.21 |
| 15.9 | 90.52 | 71.93 | |
| 49.6 | 78.21 | 56.20 | |
| 99.8 | 52.34 | 21.54 | |
| 156.7 | 20.73 | 5.80 | |
| 0.5% PEG-1 0.5 PV | 4.8 | End face seal | |
| 15.9 | End face seal | ||
| 49.6 | 96.83 | 90.24 | |
| 99.8 | 93.83 | 82.23 | |
| 156.7 | 91.82 | 77.53 | |
| Plugging System | Fracture Width /μm | Plugging Efficiency /% | Residual Plugging Efficiency/% |
|---|---|---|---|
| 0.5% WQ-100 (0.5 PV) | 50 | 24.80 | 7.39 |
| 180 | 16.67 | 5.17 | |
| 340 | 5.00 | 0.00 | |
| 510 | 1.23 | 0.00 | |
| 0.5% PEG-1 (0.5 PV) | 50 | 94.29 | 86.88 |
| 180 | 82.98 | 38.46 | |
| 340 | 18.18 | 6.90 | |
| 510 | 13.64 | 0.72 | |
| 0.5% PPG (0.5 PV) | 50 | 98.76 | 91.83 |
| 180 | 99.76 | 99.34 | |
| 340 | 99.53 | 98.49 | |
| 510 | 99.68 | 98.75 | |
| 0.2% HPAM + 0.2% Cr3+ (0.5 PV) | 50 | 97.11 | 90.91 |
| 180 | 99.81 | 99.18 | |
| 340 | 99.88 | 99.67 | |
| 510 | 99.91 | 99.75 |
| Plugging System | Fracture Width /μm | Plugging Efficiency /% | Residual Plugging Efficiency/% |
|---|---|---|---|
| 0.5% PPG 0.25 PV + 0.5% PEG-1 0.25 PV | 50 | 99.02 | 97.61 |
| 180 | 99.85 | 99.50 | |
| 340 | 99.87 | 99.66 | |
| 510 | 99.90 | 99.81 | |
| 0.5% WQ-100 + 0.2% HPAM + 0.2% Cr3+ 0.5 PV | 50 | 98.93 | 92.85 |
| 180 | 99.91 | 98.97 | |
| 340 | 99.90 | 99.05 | |
| 510 | 99.92 | 99.13 |
| Reservoir Models | Plugging System Formula | EOR before Plugging /% | EOR after Plugging /% | |
|---|---|---|---|---|
| Porous reservoirs | 50/100 mD | 0.5 PV WQ-100 | 39.19 | 50.68 |
| 0.25 PV PEG + 0.25 PV WQ-100 | 38.82 | 64.71 | ||
| 0.15 PV PEG + 0.15 PV WQ-100 + 0.1 PV PEG + 0.1 PV WQ-100 | 39.08 | 63.22 | ||
| Fractured reservoirs | Fracture width /μm | Plugging system Formula | EOR before plugging /% | EOR after plugging /% |
| 50 | 0.5 PV WQ-100 | 14.63 | 18.29 | |
| 50 | 0.2 PV PEG + 0.3 PV WQ-100 | 15.63 | 37.5 | |
| 180 | 7.5 | 13.75 | ||
| 50 | 0.2 PV PPG + 0.3 PV PEG | 16.67 | 44.44 | |
| 180 | 7.32 | 29.27 | ||
| Pore-fractured reservoirs | Permeability /mD | Plugging system Formula | EOR before plugging /% | EOR after plugging /% |
| 52 | 0.5 PV WQ-100 | 43.75 | 52.5 | |
| 167 | 40.79 | 44.74 | ||
| 52 | 0.2 PV PEG + 0.3 PV WQ-100 | 46.15 | 66.67 | |
| 167 | 39.02 | 56.1 | ||
| Reservoirs Models | Permeability/mD | 0.25 PV PEG + 0.25 PV WQ-100 | 0.25 PV Foam + 0.25 PV WQ-100 |
|---|---|---|---|
| Porous reservoirs | 5/150 | Section block | 94.2%/97.8% |
| 96.1%/97.6% | 94.1%/96.3% | ||
| 92.8%/94.5% | 91.6%/92.5% | ||
| 91.1%/92.8% | 90.4%/90.9% | ||
| Reservoirs models | Fracture width/μm | Foam + WQ-100 | Enhanced foam with gels + WQ-100 |
| Fractured reservoirs | 50 | 85.5/90.5 | 94.7/96.4 |
| 180 | 50.6/56.8 | 92.9/94.2 | |
| 340 | 10.3/13.8 | 91.6/92.6 | |
| 510 | 4.8/5.9 | 89.7/90.5 | |
| Reservoirs models | Microfracture/matrix volume ratio | Foam | WQ-100 + Foam |
| Pore-fractured reservoirs | 0.4/295 | 91.4 | 93.6 |
| 0.8/295 | 89.7 | 92.8 | |
| 1.2/295 | 86.1 | 91.2 | |
| 1.6/295 | 80.3 | 90.5 |
| Reservoir Models | Plugging System Formula | EOR before Plugging /% | EOR after Plugging /% | |
|---|---|---|---|---|
| Porous reservoirs | 5/100 mD | PEG-WQ-100 | 39.08 | 63.22 |
| Foam | 39.13 | 65.22 | ||
| Enhanced foam with WQ-100 | 39.02 | 67.07 | ||
| Fractured reservoirs | Fracture width/μm | Plugging system Formula | EOR before plugging /% | EOR after plugging /% |
| 50 | PEG-WQ-100 | 15.63 | 37.5 | |
| PPG-PEG-1 | 16.67 | 44.44 | ||
| WQ-100 | 14.63 | 18.29 | ||
| Enhanced foam with WQ-100 | 17.86 | 42.86 | ||
| Enhanced foam with gels | 17.65 | 47.06 | ||
| 180 | PEG-WQ-100 | 7.5 | 13.75 | |
| PPG-PEG-1 | 7.32 | 29.27 | ||
| Enhanced foam with WQ-100 | 7.89 | 16.58 | ||
| Enhanced foam with gels | 8.54 | 32.93 | ||
| Pore-fractured reservoirs | Permeability /mD | Plugging system Formula | EOR before plugging /% | EOR after plugging /% |
| 52 | PEG-WQ-100 | 46.15 | 66.67 | |
| Foam | 44.44 | 65.56 | ||
| Enhanced foam with WQ-100 | 46.67 | 71.11 | ||
| 167 | PEG-WQ-100 | 39.02 | 56.1 | |
| Foam | 39.02 | 48.78 | ||
| Enhanced foam with WQ-100 | 42.86 | 64.29 | ||
Publisher’s Note: MDPI stays neutral with regard to jurisdictional claims in published maps and institutional affiliations. |
© 2022 by the authors. Licensee MDPI, Basel, Switzerland. This article is an open access article distributed under the terms and conditions of the Creative Commons Attribution (CC BY) license (https://creativecommons.org/licenses/by/4.0/).
Share and Cite
Wang, L.-L.; Wang, T.-F.; Wang, J.-X.; Tian, H.-T.; Chen, Y.; Song, W. Enhanced Oil Recovery Mechanism and Technical Boundary of Gel Foam Profile Control System for Heterogeneous Reservoirs in Changqing. Gels 2022, 8, 371. https://doi.org/10.3390/gels8060371
Wang L-L, Wang T-F, Wang J-X, Tian H-T, Chen Y, Song W. Enhanced Oil Recovery Mechanism and Technical Boundary of Gel Foam Profile Control System for Heterogeneous Reservoirs in Changqing. Gels. 2022; 8(6):371. https://doi.org/10.3390/gels8060371
Chicago/Turabian StyleWang, Liang-Liang, Teng-Fei Wang, Jie-Xiang Wang, Hai-Tong Tian, Yi Chen, and Wei Song. 2022. "Enhanced Oil Recovery Mechanism and Technical Boundary of Gel Foam Profile Control System for Heterogeneous Reservoirs in Changqing" Gels 8, no. 6: 371. https://doi.org/10.3390/gels8060371
APA StyleWang, L.-L., Wang, T.-F., Wang, J.-X., Tian, H.-T., Chen, Y., & Song, W. (2022). Enhanced Oil Recovery Mechanism and Technical Boundary of Gel Foam Profile Control System for Heterogeneous Reservoirs in Changqing. Gels, 8(6), 371. https://doi.org/10.3390/gels8060371