Article

Performance of Dye Removal from Single and Binary Component Systems by Adsorption on Composite Hydrogel Beads Derived from Fruits Wastes Entrapped in Natural Polymeric Matrix

by
Cristina-Gabriela Grigoraș
1,*,
Andrei-Ionuț Simion
1,*,
Lidia Favier
2,
Cătălin Drob
3 and
Lucian Gavrilă
1
1
Department of Chemical and Food Engineering, Faculty of Engineering, “Vasile Alecsandri” University of Bacău, Calea Mărășești 157, 600115 Bacău, Romania
2
Ecole Nationale Supérieure de Chimie de Rennes, University of Rennes, CNRS, UMR 6226, CEDEX 7, 35708 Rennes, France
3
Department of Engineering and Management, Mechatronics, Faculty of Engineering, “Vasile Alecsandri” University of Bacău, Calea Mărășești 157, 600115 Bacău, Romania
*
Authors to whom correspondence should be addressed.
Gels 2022, 8(12), 795; https://doi.org/10.3390/gels8120795
Submission received: 14 November 2022 / Revised: 28 November 2022 / Accepted: 1 December 2022 / Published: 3 December 2022
(This article belongs to the Special Issue Advanced Hydrogel for Water Treatment)

Abstract

:
The treatment of contaminated water is currently a major concern worldwide. This work was directed towards the preparation of a composite hydrogel by entrapping cherry stones powder on chitosan, which is known as one of the most abundant natural polymers. The synthesized material was characterized by scanning electron microscopy, by Fourier transform infrared spectroscopy, and by the point of zero charge determination. Its ability to remove two azo dyes models (Acid Red 66 and Reactive Black 5) existing in single form and in binary mixture was evaluated. Response Surface Methodology–Central Composite Design was used to optimize three parameters affecting the process while targeting the lowest final contaminant concentrations. The best results were obtained at pH 2, an adsorbent dose of 100 g/L, and a temperature of 30 °C, when more than 90% of the pollutants from the single component systems and more than 70% of those of the binary mixtures were removed from their aqueous solutions. The adsorption process was in accordance with Elovich and pseudo-second-order kinetic models, and closely followed the Freundlich and Temkin equilibrium isotherms. The obtained results led to the conclusion that the prepared hydrogel composite possesses the ability to successfully retain the target molecules and that it can be considered as a viable adsorbent material.

Graphical Abstract

1. Introduction

With the continuous increase in demand for different products, industrialization in the recent decades has resulted in the use of more and more chemical compounds. Synthetic dyes are among the most frequently encountered of these compounds. Depending on their structure, they can be divided into several categories such as azo, vat, indigo, nitro dyes, etc., the first, azo, representing more than 60% of the market [1]. Since it is common for synthetic dyes to be used in the production of goods as textiles [2,3], cosmetics [4,5,6], food [7,8,9], plastics [10], drugs [11,12], etc., they are obtained in large quantities. Part of them end up in water, either through the products in which they are found or as part of the discharged effluents thus becoming a source of contamination.
Even at very low concentrations, these pollutants, recognized as highly durable and water soluble and characterized by their own form and mechanism of action, cause serious injuries to human health and to the environment. Allergic reactions, association with systemic diseases, skin irritations [13], mutagenic and carcinogenic potential, high toxicity, respiratory and renal failure [14], cyanosis, tissue necrosis, and jaundice [15] can be cited as negative effects of dyes on humans. As well, dyes inhibit plant growth, cause reductions in pigment and protein content of microalgae, and have toxic effects on aquatic life, resulting in breathing troubles, movement difficulties, and malformations [16].
As a consequence, the removal of these emerging contaminants from wastewater has become a pressing issue and the need to maintain water quality has become a real challenge.
In order to counterbalance these growing concerns, it is imperative that dyes are removed from aqueous media at sufficiently low levels. Usually, the elimination of dyes is attempted through a variety of biological, chemical, and physical methods. The first class of treatments is typically characterized by the degradation of dyes through metabolism or adsorption by biomass (bacteria, fungi, and yeasts) before the treated aqueous effluents are released into the environment [17]. Chemical treatments include methods such as oxidation processes [18,19,20], ozonation [21,22], electrochemical destruction [23,24], photocatalysis [25,26,27], etc. In terms of physical techniques, coagulation-flocculation [28,29], membrane filtration [30], nanofiltration [31], precipitation [32,33], etc., can be cited. Even though, on occasion, satisfactory results were obtained when combinations of biological, chemical, and physical methods were used [34,35], many of these methods are ineffective for some colored compounds. Reduced degradation is observed for biological treatments. Then again, chemical and physical processes are responsible for the generation of various secondary products which are regularly classified as harmful for the environment. Moreover, due to the complex structures of dyes and their often high molecular weight, there is always a challenge in selecting the adequate approach.
As a result of the above related aspects, there is an amplified demand for the development of appropriate methodologies for the removal of dyes existing in wastewaters. Adsorption is considered to be an attractive alternative since it stands out through operation simplicity, avoidance of supplementary chemicals, and nonexistence of undesirable products [36]. Numerous adsorbents such as activated carbon [37,38,39], silicates [40], porous geopolymers [41], materials prepared from agricultural wastes [42,43] or obtained from biomass residue [44], materials containing nanoparticles of various oxides [45,46,47], composites [48,49], etc., are reported as favorable adsorbents. They possess important surface area, high pore sizes, and structures permitting high affinity with various compounds; therefore, they are listed as efficiently retaining colored contaminants from aqueous media.
Considering the actual context of the continuing efforts towards developing new methods for water depollution, the novelty of the present paper resides in using an under-valorized by-product from fruits processing industrial sector to produce an adsorbent material and revealing that it is able to retain colored molecules from aqueous solution.
Thus, the present research was undertaken to prepare a low-cost adsorbent by a simple method of entrapping a powder of cherry stones in a chitosan polymeric matrix. Morphological analysis using scanning electron microscopy (SEM), Fourier Transform Infrared Spectroscopy (FTIR) analysis, and determination of the point of zero charge (pHPZC) were used for its characterization. Subsequently, the adsorption potential of the obtained value-added material was evaluated for the removal of two model azo dyes: Acid Red 66 (AR) and Reactive Black 5 (RB), which are found in single or in binary component systems. Then, a Response Surface Methodology (RSM) analysis was conducted on several parameters which affect the adsorption process (pH, adsorbent amount, and temperature). Finally, on the optimized established conditions, a kinetic study was carried out and kinetic models and equilibrium isotherms were tested and established.

2. Results and Discussion

2.1. Adsorbent Synthesis and Characterization

Cherry stones are a waste product from the fruits processing industry that is highly available; however, they are usually not considered a product of interest, and are generally discarded. Our preliminary tests revealed that cherry stones, as such, are not able to adequately retain the target contaminants. Even though there are ways of using them for producing activated carbon, for example. A chemical activation process conducted with zinc chloride at 700 °C was proposed by Angin et al. [50]. Olivares-Marin et al. [51,52] used dehydration agents such as potassium hydroxide or sulfuric acid and temperatures between 400 °C and 900 °C in order to obtain activated carbon from cherry stones. Duran-Valle et al. [53] submitted cherry stones to different gases action under elevated temperature obtaining a porous material. Nowicki et al. [54] conducted a pyrolysis process on cherry stones followed by physical activation at 800 °C under carbon dioxide. The tests on the use of the prepared material for the adsorption of different pollutants were very promising. In one of our previous papers [55], we have reported, also, that the adsorbent which results from calcinating cherry stones for 6 h at 600 °C is able to retain dyes such as Congo Red from aqueous solutions. Nonetheless, all of these methods, besides being time- and energy-consuming, present the major disadvantage of a very reduced yield (only 1.2% in our earlier study).
As a consequence, in this work, we aimed, firstly, to prepare an adsorbent material by using cherry stones directly without passing them through the activation and/or calcination steps of activated carbon manufacture. Through our investigations, we have determined that, when this industrial by-product is used in a ground state, its adsorption capacity increases significantly. However, cherry stones powder is difficult to recover from an aqueous environment after the completion of the adsorption process. An alternative consists of entrapping the cherry stones into a carrier support. Chitosan (a polysaccharide derived from chitin) was chosen for this purpose. Apart from the fact that this natural polymer possesses, among others, attractive attributes such as biocompatibility, biodegradability, untoxicity, and antitumor, analgesic, antioxidant, and antimicrobial properties [56], it is known for its ability to form hydrogels.
In our case, cherry stones in powder were carefully mixed for 24 h with a solution of chitosan in acetic acid. The suspension was then dripped in a methanol–sodium hydroxide combination and left to rest at 4 °C for another 24 h. The hydrogel beads were heated at reflux in a methanol–glutaraldehyde mixture for 6 h at 70 °C in order to ensure a good stability in acidic media. A schematic representation of the preparation process steps is exhibited in Figure 1.
As shown in Figure 2A, the resulted beads (abbreviated CSCH) have a uniform spherical shape and a white, light yellow color with visible grains of cherry stones powder. Their mean diameter was 2.5 mm ± 0.2 mm.
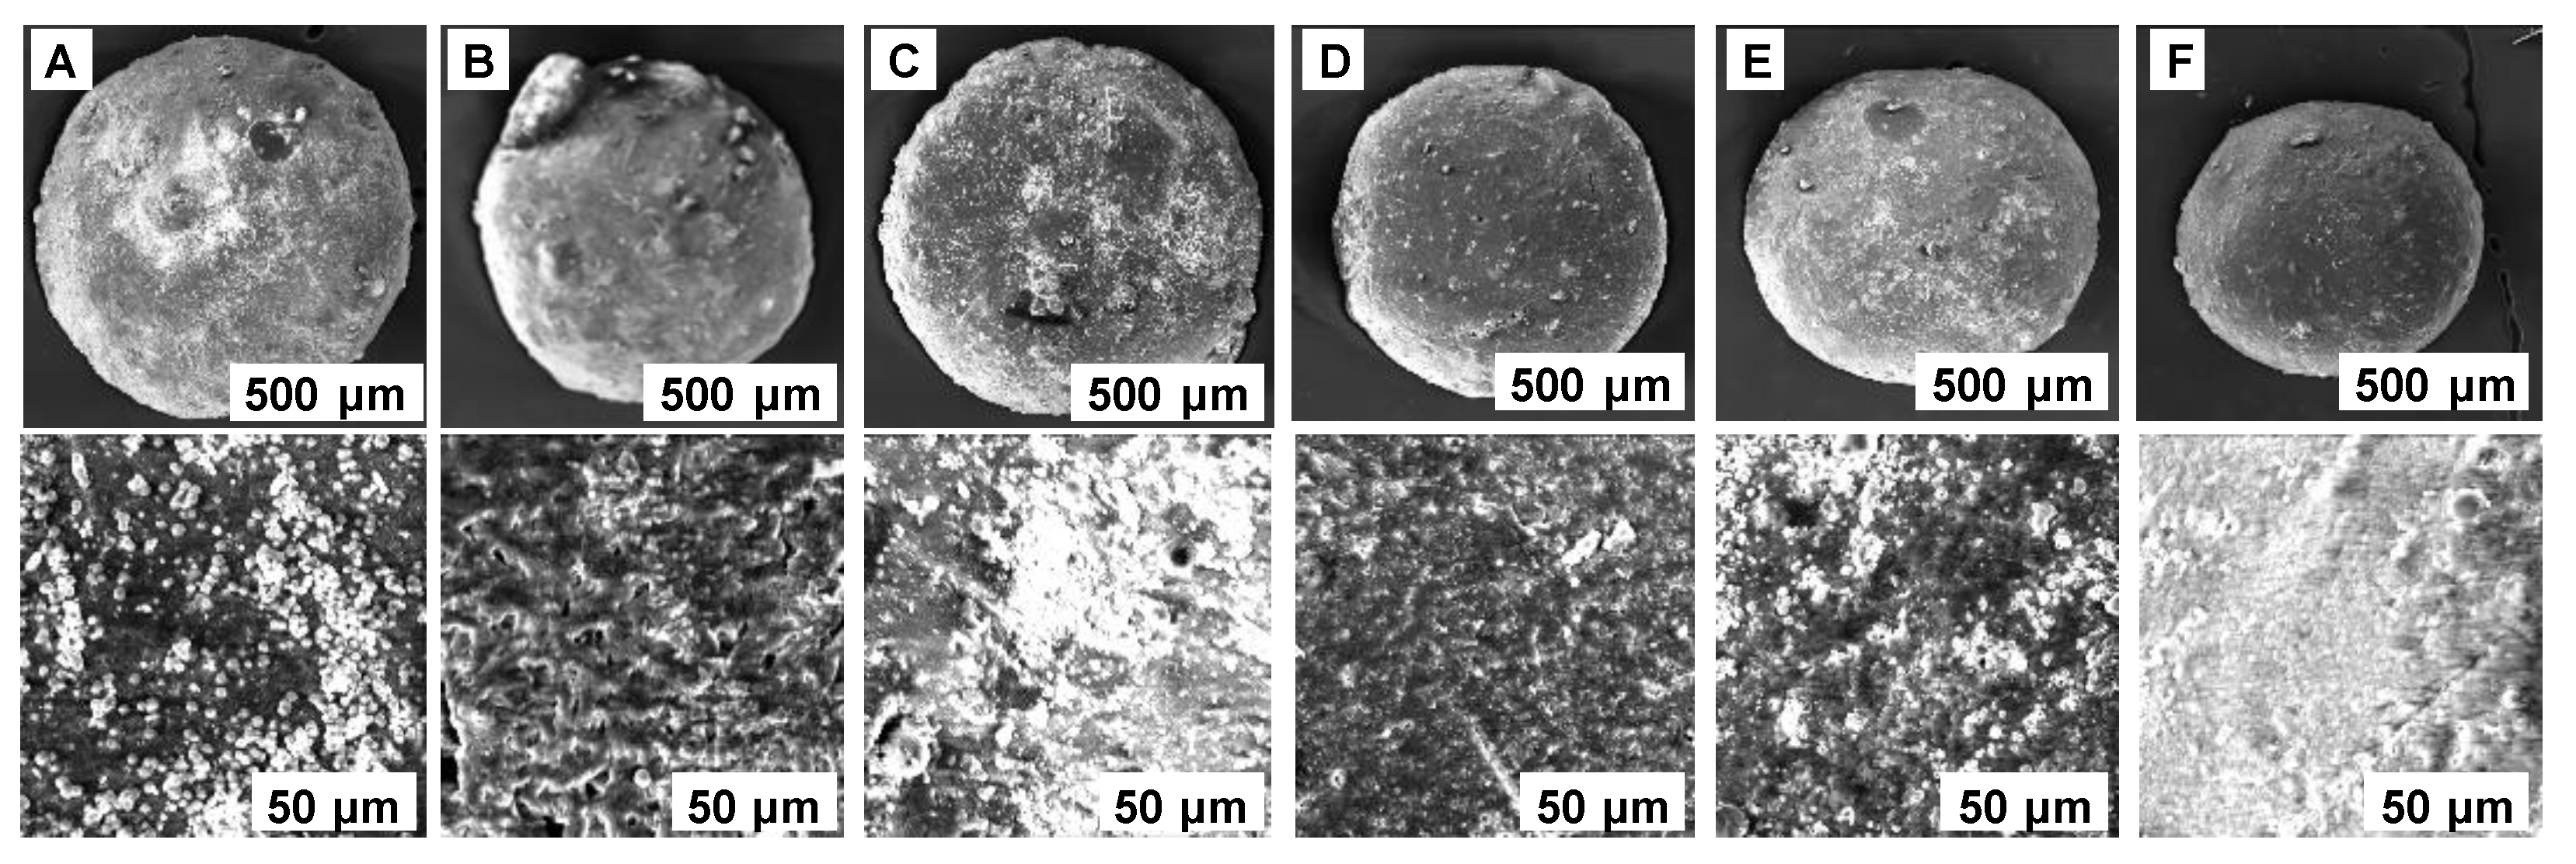
The SEM analysis of hydrogel beads revealed a smooth external surface with some irregularities that can be due to the preparation process. At the internal level, a structure with fine pores is visible. It can be also seen that the chitosan matrix englobes particles of cherry stones powder (Figure 3A). The photographs recorded after the adsorption process (Figure 3B–E) are similar both in the case of single and binary component systems, and disclose rolling tendencies.
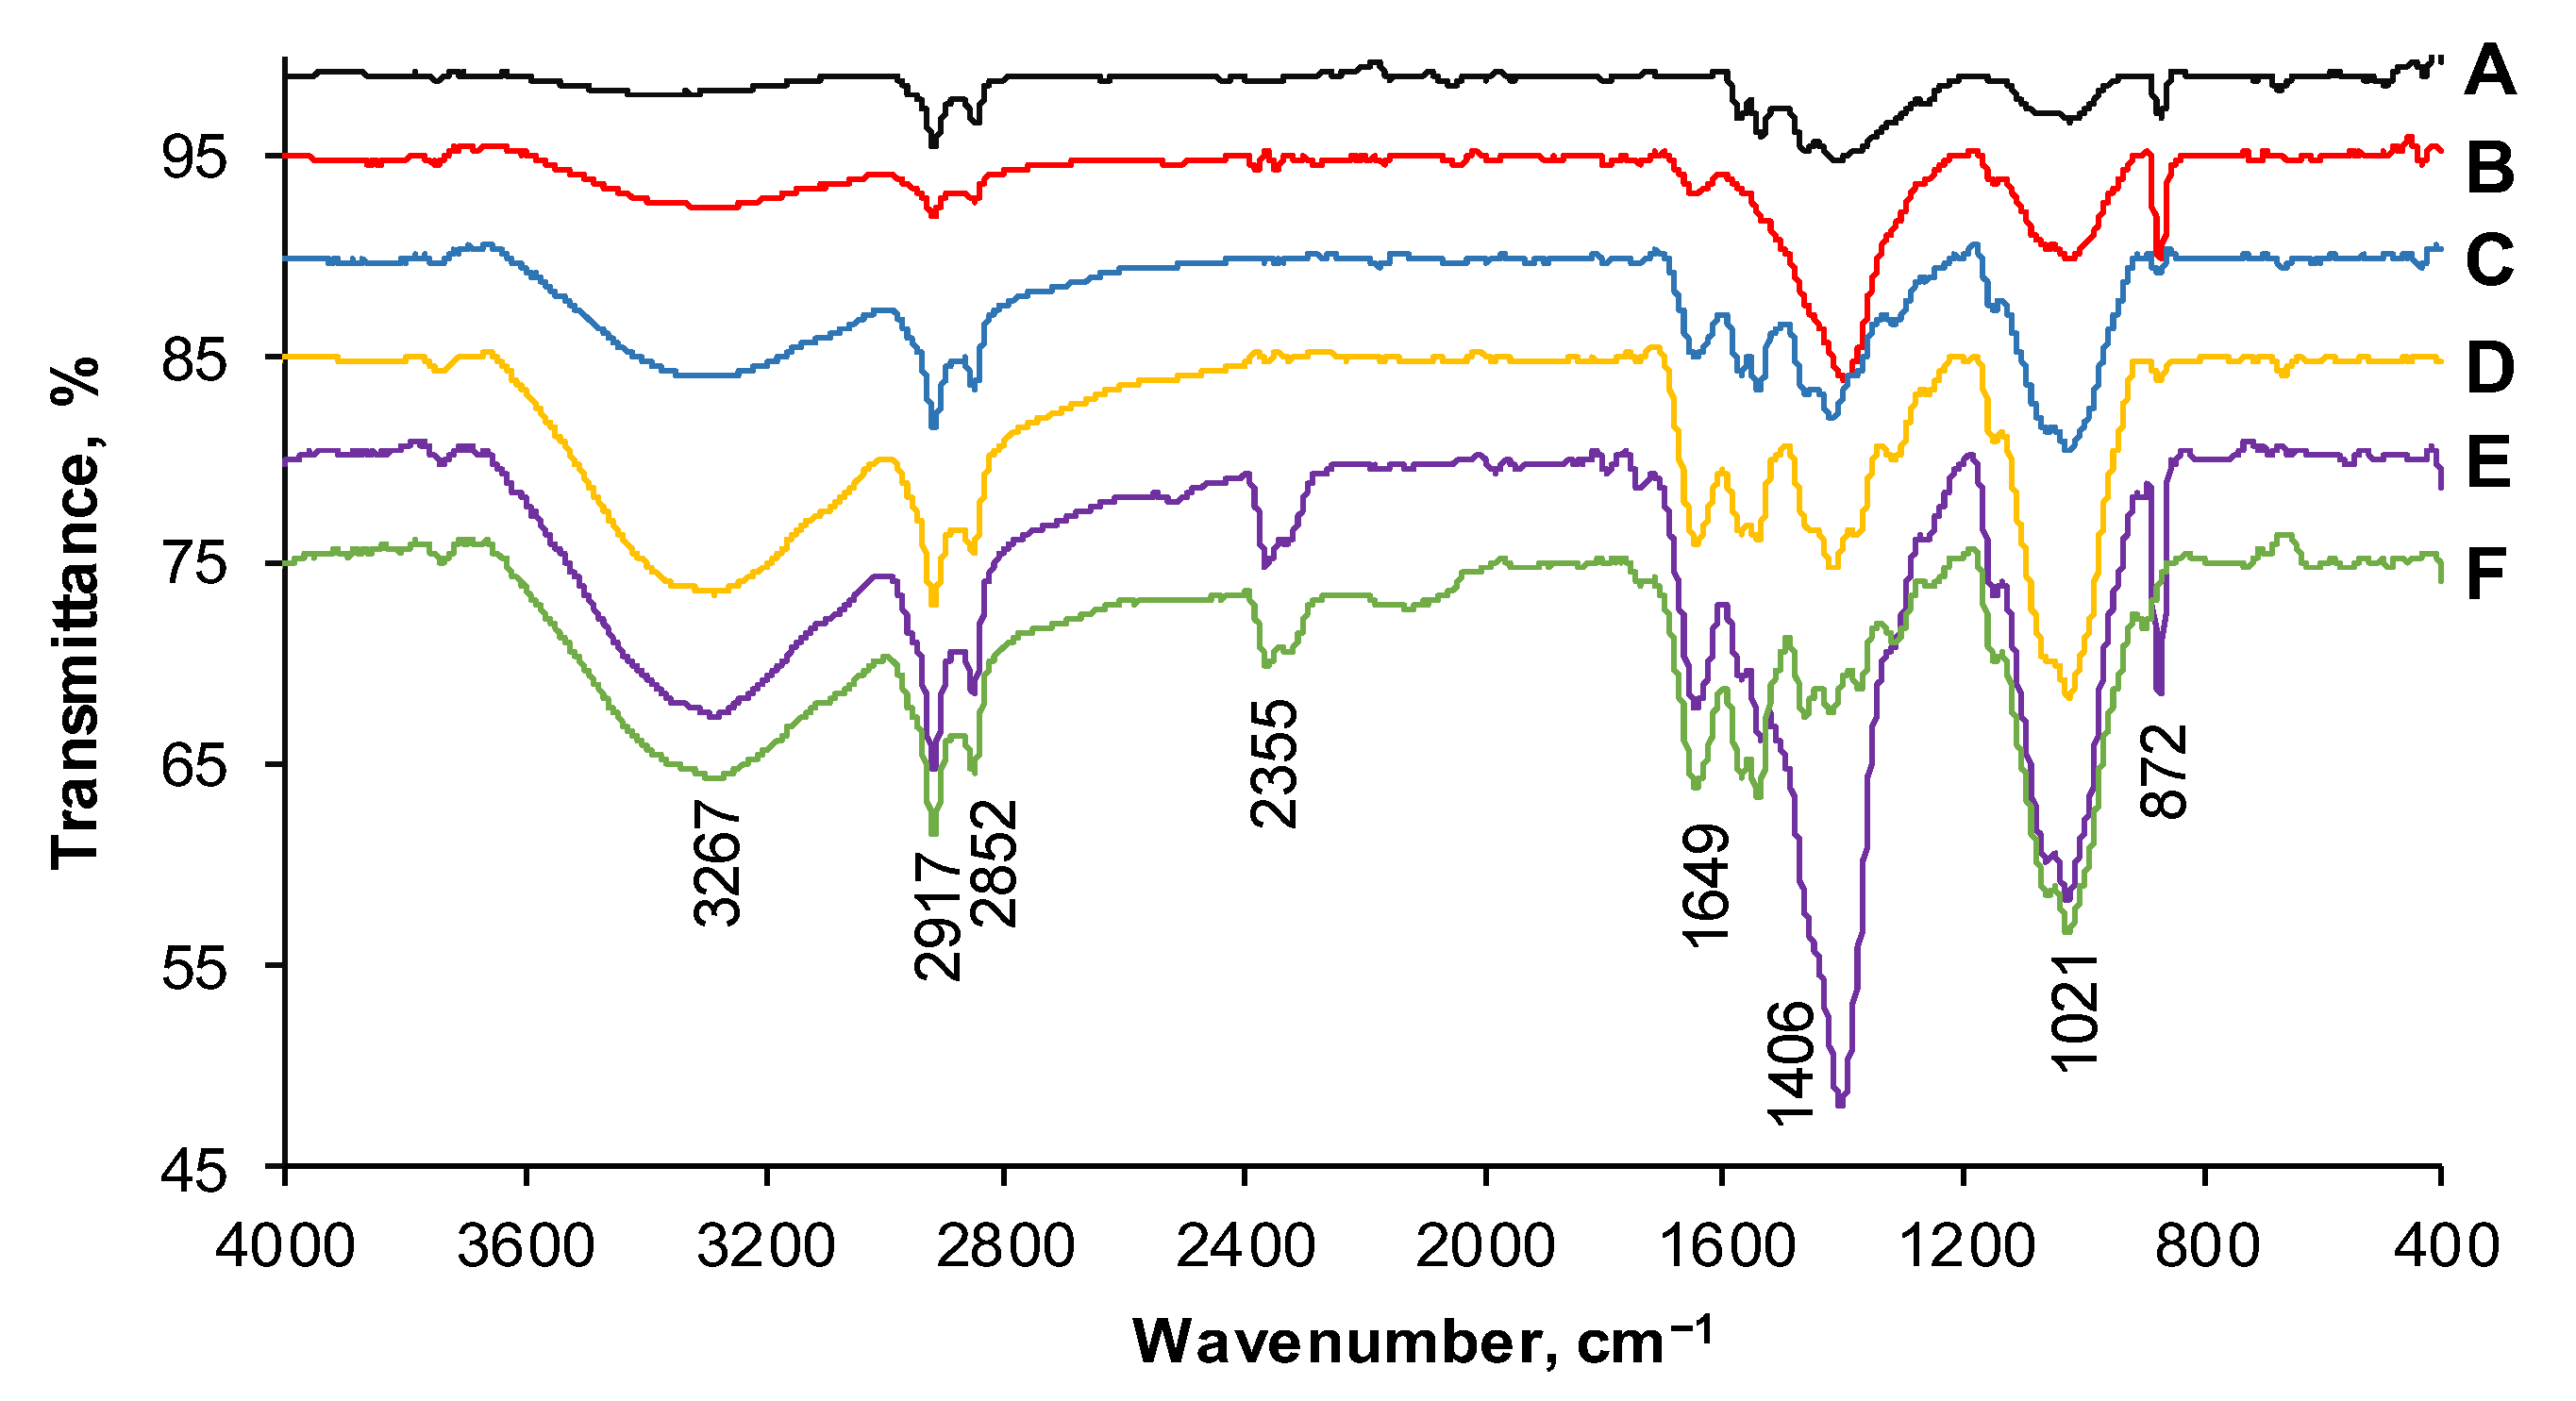
FTIR spectra were recorded for the prepared material before and after the adsorption of the target compounds existing in the tested single or binary systems. In the case of CSCH adsorbent (Figure 4A), the band appearing between 3500 cm−1 and 3200 cm−1 was characteristic of the hydroxyl stretching vibration overlapped on the −N−H vibration of chitosan matrix.
Methylene and methylidene asymmetric stretch have a peak at approximatively 2800 cm−1. In the region of 1500 cm−1–1200 cm−1, bending vibrations of −N−H and of −CH2 can be observed [57]. At approximately 1000 cm−1, vibration of the C−O of the natural polymer or of cherry stones is visible [58].
The analysis of the FTIR spectra recorded after the retention of Acid Red 66 dye (Figure 4B), Reactive Black 5 (Figure 4C), or their combinations (Figure 4D–F) showed the existence of functional groups such as diazene (at about 1500 cm−1) or sulfonate group attached to benzene (vibrations between 1400 cm−1 and 1000 cm−1) [59] specific to AR or the bands of C−C, C=C, and N=N, which were observable from 1600 cm−1 to 1500 cm−1 [60,61] and were assignable to RB. These facts sustain the conclusion that the adsorption of the molecules took place.
The last investigation conducted for the characterization of the synthesized material was the determination of the point of zero charge (pHPZC). When an adsorbent is introduced in an electrolyte aqueous solution, the ions existing on its surface dissociate and form complexes with those of the electrolyte solution [62]. Hence, at different pH values, the surface charge can be negative, positive, or null, and the adsorbent acts as a cation or anion exchanger, being able to retain various molecules. A surface charge equal to 0 does not signify the absence of charge but equality between the positive and negative charges [63].
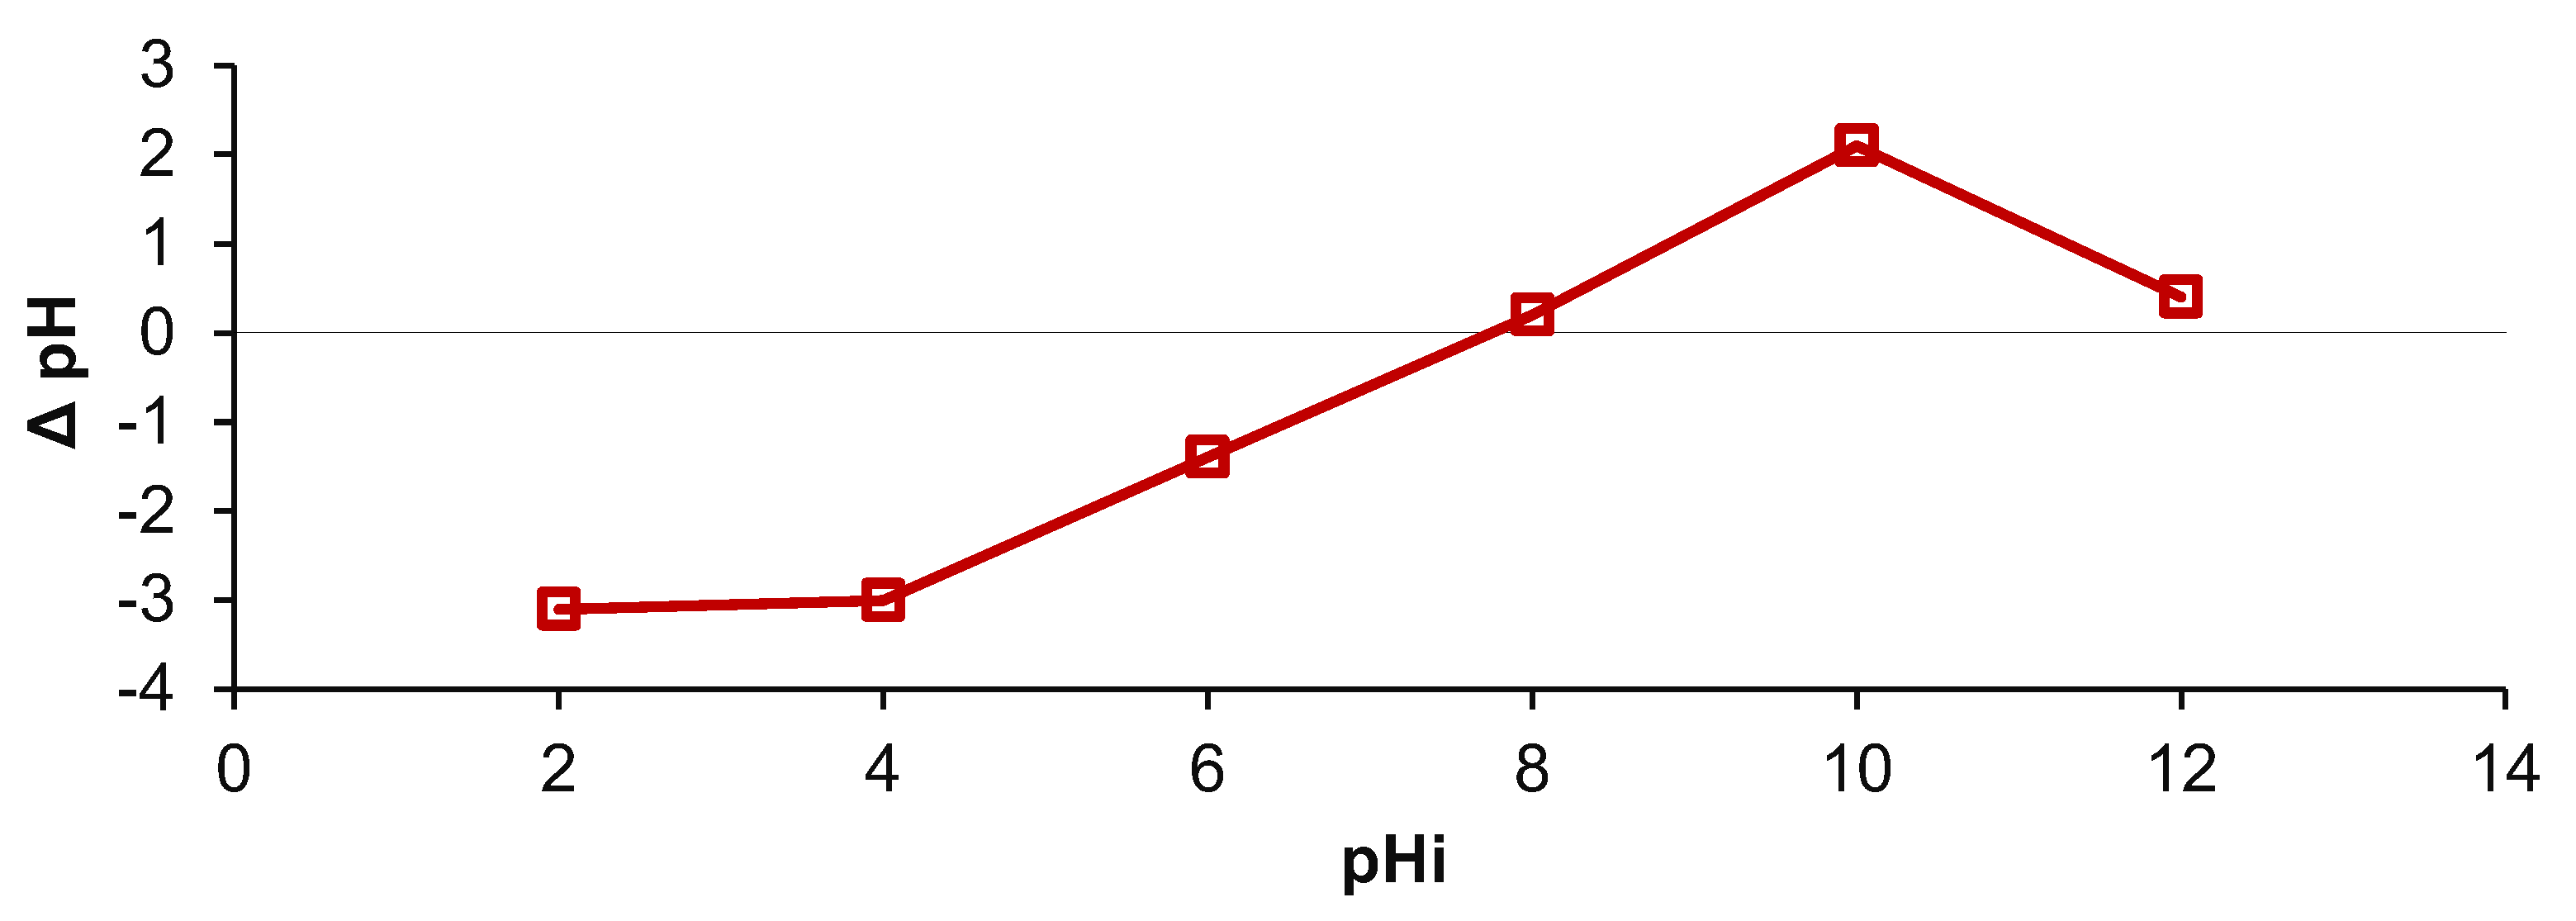
From Figure 5, it can be remarked that the adsorbent obtained by entrapping cherry stones powder in chitosan has a pHPZC of 7.8. Similar values were reported by other studies [54,64] in which cherry stones were used for manufacturing adsorbing materials. Theoretically, at a working pH below pHPZC, the hydrogel beads interact with the negative charges of the pollutants while, at a pH above the pHPZC, more interactions will occur with the positive charge of the chosen molecules. Practically, an increase in pH from 2 to 4 leads to an increase in pHPZC. The existence of a plateau is perceptible when the pH is adjusted between 4 and 10. In this interval, the adsorbent possesses amphoteric properties, meaning that neither the acid addition nor the base addition in the initial dye solution will affect the equilibrium pH.

2.2. Optimization of Adsorption Process Main Parameters by Response Surface Methodology

Response Surface Methodology with one of its most frequently used designs (Central Composite Design (CCD)) is an effective technique that can be applied when there are several variables influencing one or multiple responses of interest, as is the case with contaminants adsorption [65,66]. Defined as a tool which is able to explain the connections that occur between different factors in order to return optimized working conditions, RSM implies, in a first step, an appropriate development of the experimental program, including the choice of parameters influencing a response function and the set of their levels of variation. Secondly, with the acquired data, an optimization process is conducted via a software investigation. A mathematical model is generated, and its adequacy is tested by statistical analysis and confirmed by comparison with results registered when running experiments on the suggested conditions.
In these circumstances, one of our aims was to determine the optimized values for the three main parameters (pH, adsorbent dose, and temperature) affecting the adsorption of target dyes. The final contaminant concentration was the following response function.
For this study, a total of 27 experiments were conducted for each of the single dye systems (AR, RB) and for a binary system (50% AR + 50% RB).
Table 1 shows the recorded data for the response function and the values predicted by the quadratic models generated by the employed software.
The mathematical models obtained for the response function (final contaminant concentration) of each set of experiments are expressed by Equations (1)–(3).
C AR = 8.66 + 6.27 · X 1 2.08 · X 2 + 0.06 · X 3 0.65 · X 1 · X 2 0.29 · X 1 · X 3 + 0.33 · X 2 · X 3 0.74 · X 1 2 + 3.48 · X 2 2 + 0.92 · X 3 2
C RB = 10.74 + 8.16 · X 1 1.25 · X 2 0.23 · X 3 + 0.10 · X 1 · X 2 0.19 · X 1 · X 3 + 0.10 · X 2 · X 3 0.17 · X 1 2 + 3.92 · X 2 2 + 2.00 · X 3 2  
C 50 %   AR + 50 %   RB = 19.46 + 5.87 · X 1 0.22 · X 2 + 0.35 · X 3 + 0.76 · X 1 · X 2 0.25 · X 1 · X 3 + 0.04 · X 2 · X 3 2.28 · X 1 2 + 4.04 · X 2 2 + 0.43 · X 3 2  
The interdependent consequence of the terms depends on the coefficient signs: a positive sign implies synergy and that an augmentation of the response function occurs with the increase in the factors. On the contrary, a negative sign suggests that the variable is able to conduct to a diminishment of the response function.
Statistical significance was tested by analysis of variance.
As shown in Table 2, the values of lack of fit for all three dyes systems indicate the suitability of the obtained mathematical equations. In the case of the terms, a low p-value suggests that the specific terms are significant. For AR and RB single systems, the pH and adsorbent dose had the most important impact while, in the case of the binary dye system, it seems that the pH had the greatest influence on the retention of the pollutants on the adsorbent surface.
The models F-values (260.08 for AR, 1877.61 for RB, 34.43 for 50% AR + 50% RB) imply that they are significant, with the chances of being caused by the noise reaching only 0.01%.
Correlation coefficients very close to the unit (0.9915 for AR, 0.9988 for RB, and 0.9394 for 50% AR + 50% RB) reveal that the models can satisfactorily predict the experimental results. The Predicted R2 (0.9784 for AR, 0.9974 for RB, and 0.8691 for 50% AR + 50% RB) were all in reasonable agreement with the Adjusted R2 (0.9877 for AR, 0.9983 for RB, and 0.9121 for 50% AR + 50% RB), with the difference being very reduced.
The adequate precision (which measures the signal to noise ratio) was higher than 4 for all three systems (56.810 for AR, 144.678 for RB, and 18.784 for 50% AR + 50% RB), indicating an adequate signal.
Consequently, the mathematical models can be considered as fitting for all systems.
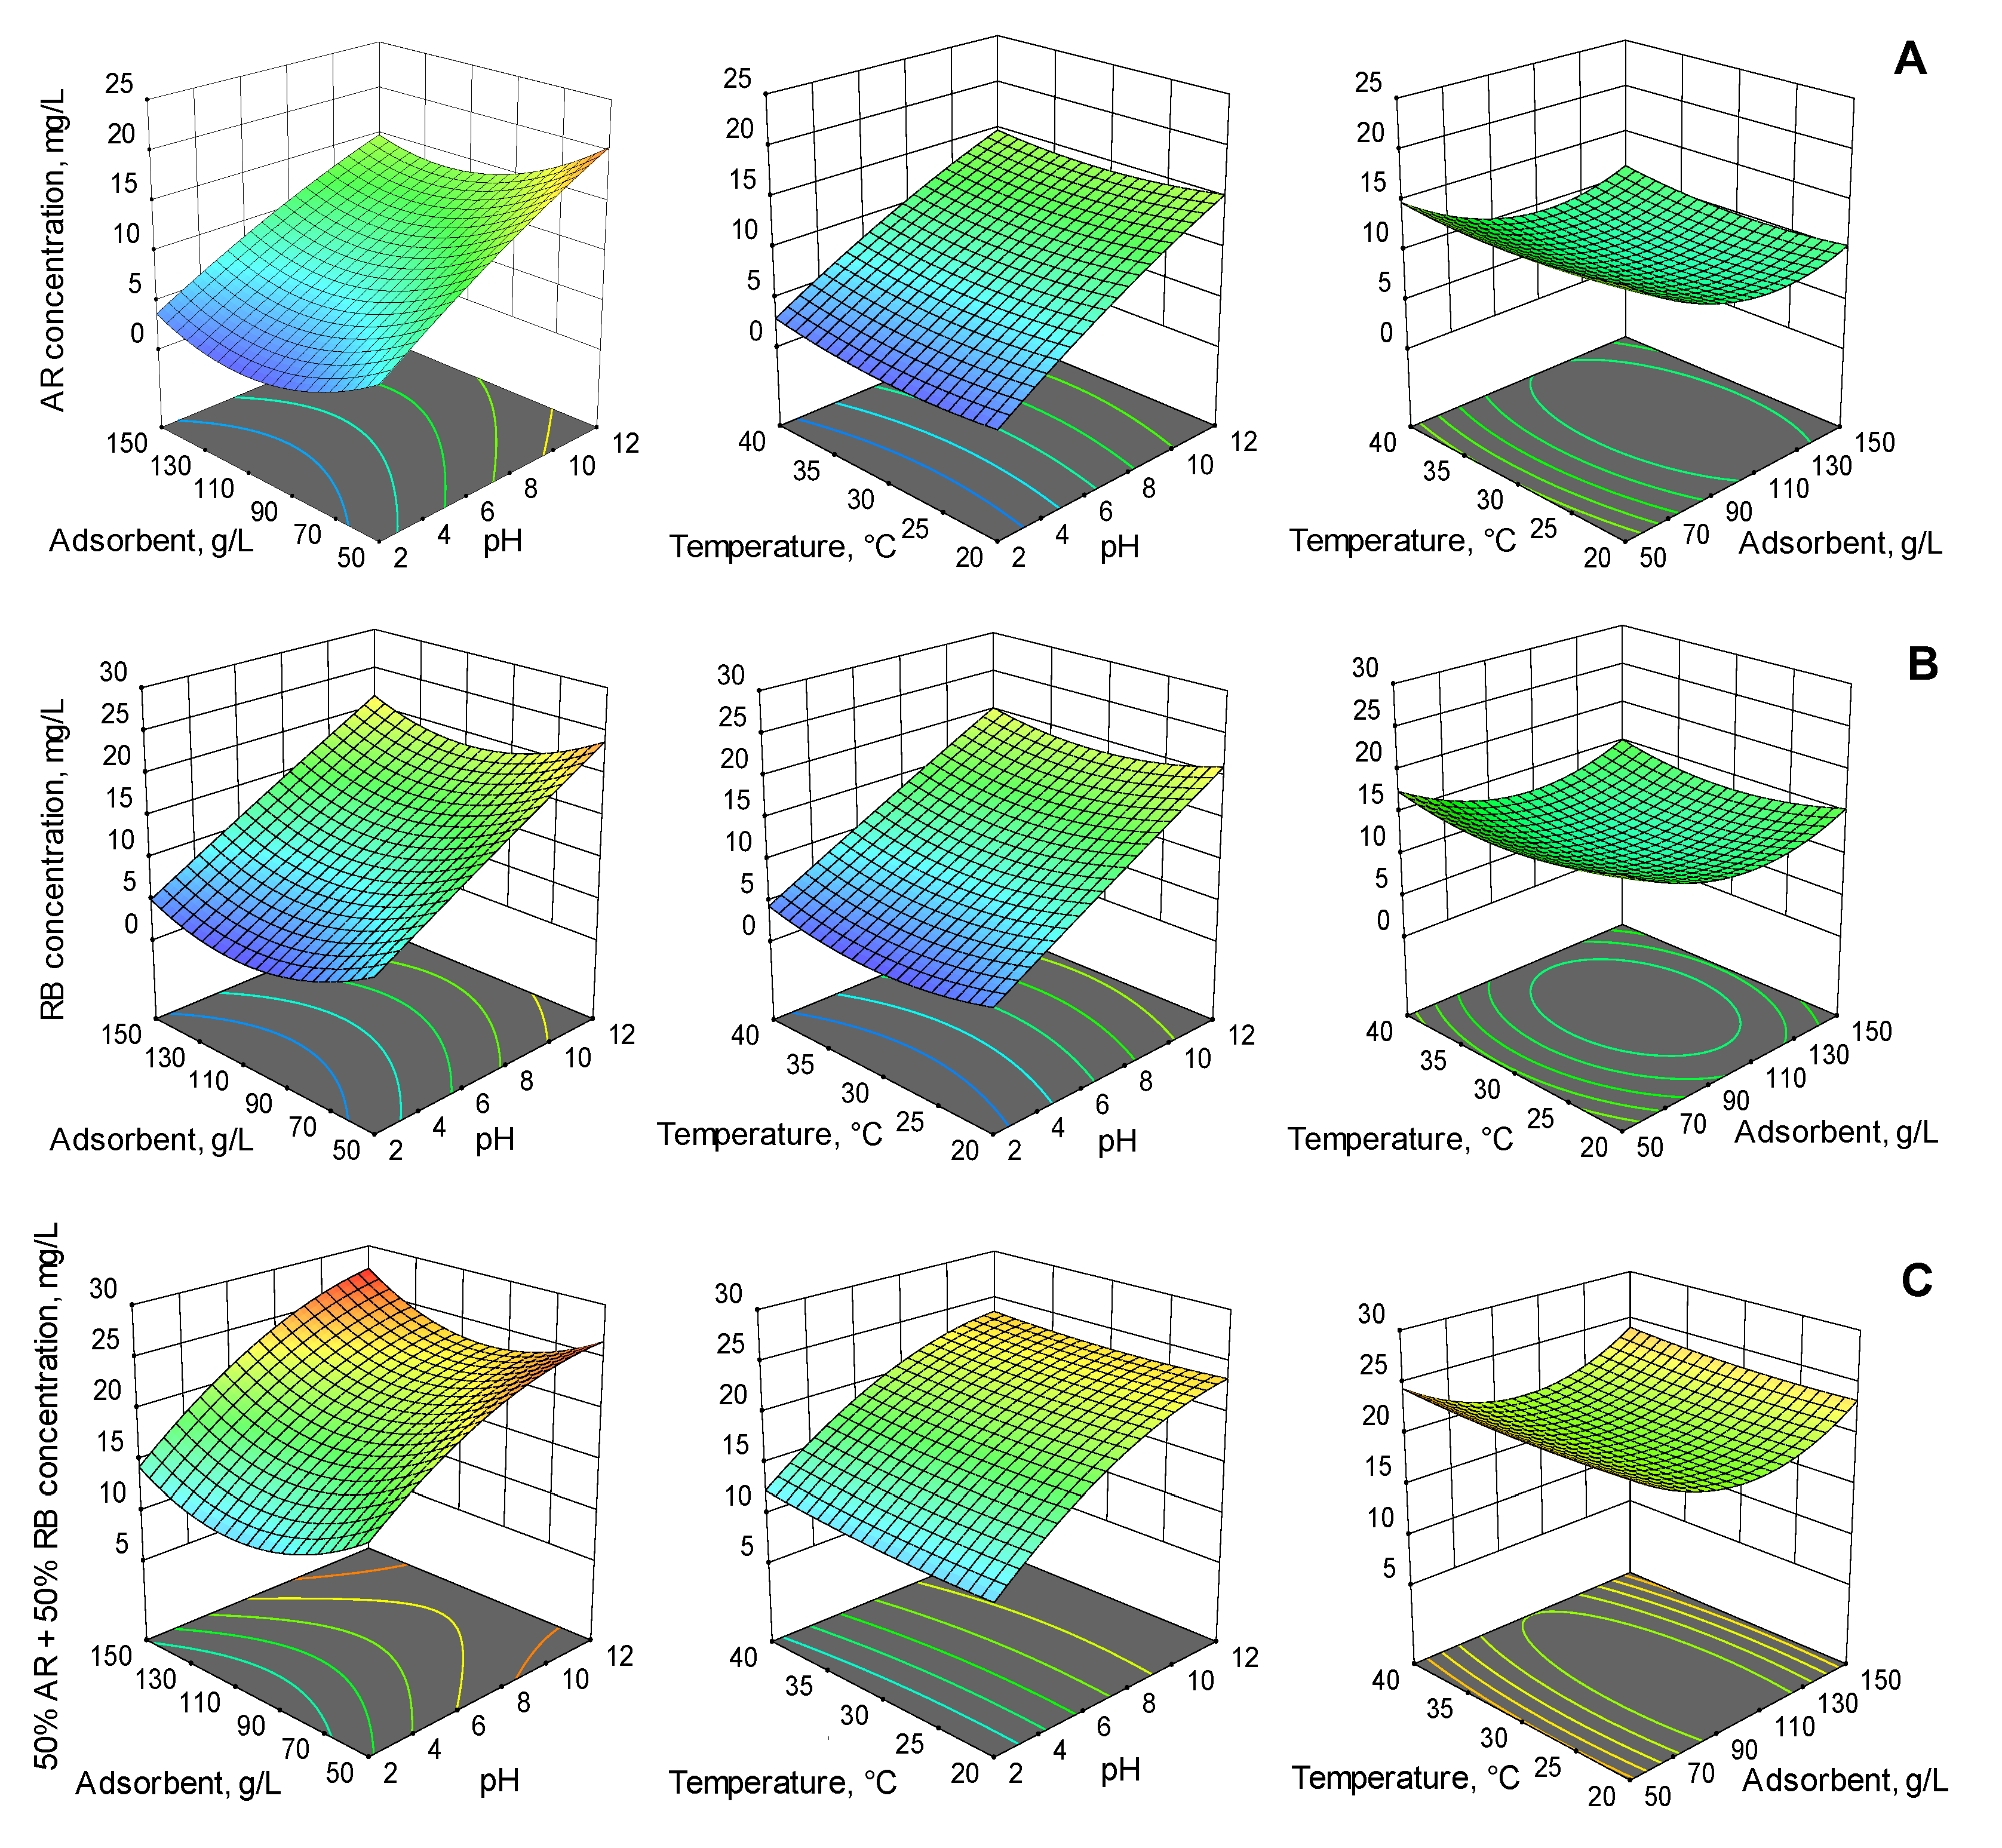
3D response surface plots showing the factors impacts on the final dye concentration are displayed in Figure 6.
When conducting an adsorption process, the pH of the initial solution has a decisive effect. It impacts both the adsorbent properties and the characteristics of the molecules to be adsorbed [65]. In this study, more than 90% of the target compounds were removed from the aqueous solution of single dye system and more than 70% was removed when two dyes were mixed in equal proportions. The removal efficiency decreased with the augmentation of pH to neutral, and also in alkaline media. Similar data are disclosed by other papers which reveal that acid conditions are suitable for the adsorption of this type of dyes [67,68].
The amount of the adsorbent added to emerging pollutants solutions also affects the adsorption effectiveness. The most elevated values of the removal efficiency in the case of the analyzed dyes in single form or in combination were attained when the adsorbent concentration was 100 g/L. Increasing the adsorbent dose augments the probability that the active sites are occupied by the contaminants. After a certain limit (considered to be the optimal adsorbent dose), saturation is reached and no considerable increase in dye retention on the adsorbent surface is observed [69].
Temperature is another key parameter of the adsorption process. As explained by Yadav and Dasgupta [70], the increased retention of the dye chosen for their experiments when the temperature was raised from 20 °C to 30 °C could be the result of the increased dye flux getting to the adsorbent material, and of a more important diffusion rate. The decline in removal efficiency when the temperature was set at 40 °C could be the outcome of a reduced affinity of the dye to the adsorbent. Silva et al. [71] concluded that a high temperature is responsible for weakening the forces between the target molecule and the adsorbent surface, and has an undesirable impact on the process. Analogous information can be drawn from our investigation. Three temperatures were tested (20 °C, 30 °C, and 40 °C) and the best results were obtained for the middle value.
All three parameters were optimized simultaneously in order to reach the smallest contaminant concentration in the aqueous solution after the finalization of the adsorption process. The resultant values were as follows: pH 2, adsorbent dose: 100 g/L, and temperature: 30 °C. Five supplementary experiments were conducted in these conditions. The adsorption of dyes on the synthesized material was visible (Figure 2B–F). The removal efficiencies were 1.20 ± 0.05 mg/L for AR, 2.40 ± 0.1 mg/L for RB, and 7.12 ± 0.09 mg/L for 50% AR + 50% RB system, sustaining the adequacy of the mathematical models and validating them.

2.3. Adsorption Process Kinetic

A better understanding of the adsorption process can be achieved by studying the kinetic behavior of the adsorbent. Investigations were conducted at pH 2 and a temperature of 30 °C by putting 10 mL of dye solution in a single system (AR, RB) or binary systems (25% AR + 75% RB, 50% AR + 50% RB, and 75% AR + 25% RB), in contact with an adsorbent dose of 100 g/L. The refractory compound concentrations were established at given time intervals ranging from 10 min to 240 min.
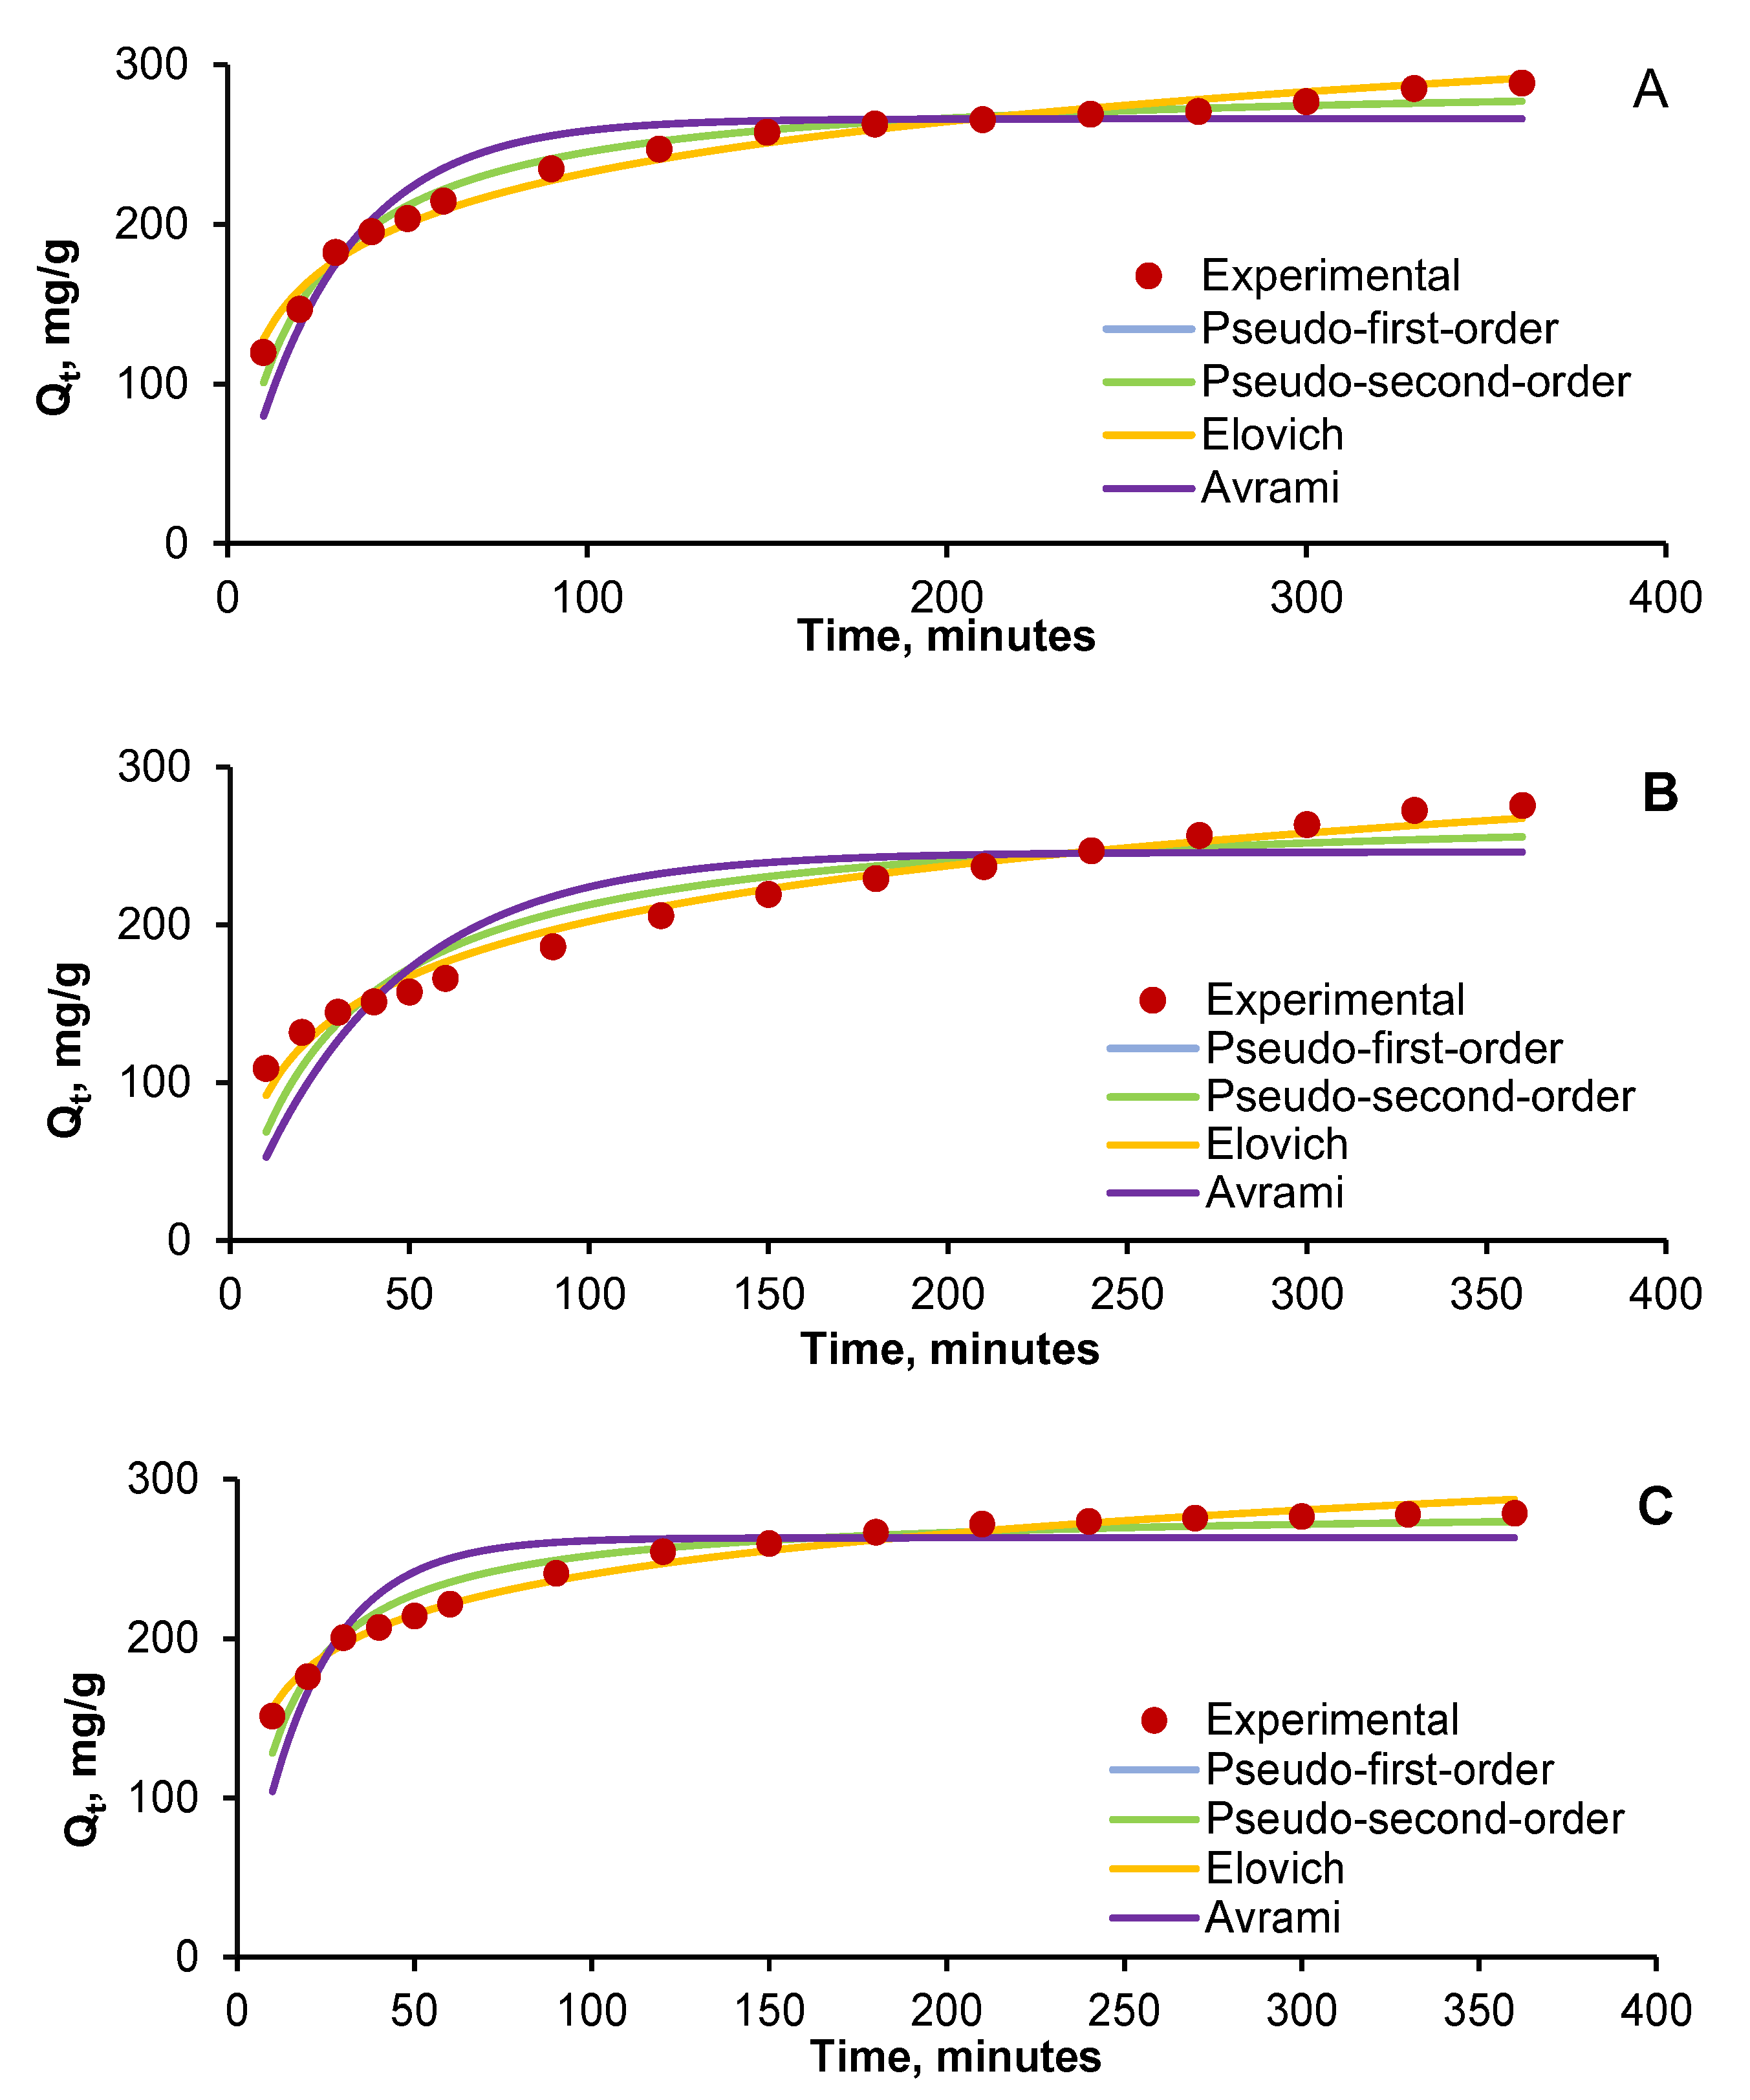
Different known kinetic models, namely pseudo-first-order, pseudo-second-order, Elovich, and Avrami, were tested and their accuracy evaluated. The first of the mentioned models can estimate the equilibrium time and quantity of the adsorbed pollutant by determining the time-scaling factor [72]. The pseudo-second-order kinetic model states that adsorption is based on chemical relations which take place between the adsorbate and the adsorbent surface. Parameters such as initial contaminant concentration, enthalpy, and entropy changes must be considered since they have a major impact on the adsorption [73]. There are studies specifying that, for high initial concentrations, the pseudo-first-order model is more suitable to express the adsorption kinetics, while the pseudo-second-order equation is recommended for defining the adsorption conduct at low concentrations [74,75]. The Elovich equation hypothesis is related to the fact that the chemical mechanism led the process, and is appropriate for situations including adsorbents with heterogeneous surfaces [76]. The Avrami kinetic model proposes that the reaction between the adsorbate and adsorbent occurs at the active sites surface. One of its factors gives details on the changes in the adsorption mechanisms as a function of time and temperature [77].
Very similar allures were remarked for all five tested pollutant concentrations (10 mg/L, 20 mg/L, 30 mg/L, 40 mg/L, and 50 mg/L) for the two single systems (AR and RB) and the three binary systems (25% AR + 75% RB, 50% AR + 50% RB, and 75% AR + 25% RB). Therefore, we have illustrated, in Figure 7, as an example, only the kinetic behavior of the results obtained for a total initial pollutant concentration of 30 mg/L in the case of AR (Figure 7A), RB (Figure 7B), and their combination in equal proportions (Figure 7C).
From the graphical representations, it seems that the sequence Elovich > pseudo-second-order > pseudo-first-order > Avrami can be established for all cases. However, after studying the kinetic parameters values (Table 3), it can be seen that the adsorption capacities predicted by the pseudo-second-order model were closer to those of the conducted experiments.
Comparable conclusions were made by various other investigations conducted for the elimination of different combinations of dyes by adsorption on different composite materials. Rong et al. [78] analyzed the ability of an adsorbent of nickel oxide and graphene nanosheets to retain Congo Red from wastewater and indicated that the pseudo-second-order kinetic model closely fit the experimental results. Abramian and El-Rassy [79] carried out the adsorption of Orange II on titania aerogel and showed that the process follows the pseudo-second-order kinetic model. The adsorption of Reactive Black 5 dye on a low-cost adsorbent of macadamia seed husks was the subject of interest of Felista et al. [80], and their findings also designated the pseudo-second-order kinetic model as appropriate. Likewise, the adsorption of dyes existing in binary systems is well described by this type of kinetic model [81,82].
The evaluation of the statistical data (Table 4) equally endorses the indication that the Elovich and pseudo-second-order models are able to describe the contaminants adsorption on the hydrogel beads prepared by entrapping the cherry stones powder on the natural polymeric matrix of chitosan. The Elovich model fitting the experimental results implies that contaminants adsorption takes place by mass transfer with different activation energies for chemisorption. The adequacy of the pseudo-second-order equation emphasizes that chemical adsorption is the controlling mechanism of the target compounds retention, while the smaller correlation coefficients recorded for the pseudo-first-order model reveal that, even though physisorption can occur, it is not the dominant process.

2.4. Equilibrium Isotherms in Single and Binary Component Dye Systems

Adsorption isotherms are frequently employed for establishing the relation which occurs between the adsorption capacity reached by an adsorbent in the equilibrium state and the concentration existing initially in the pollutants aqueous solutions with the objective of determining the process mechanism.
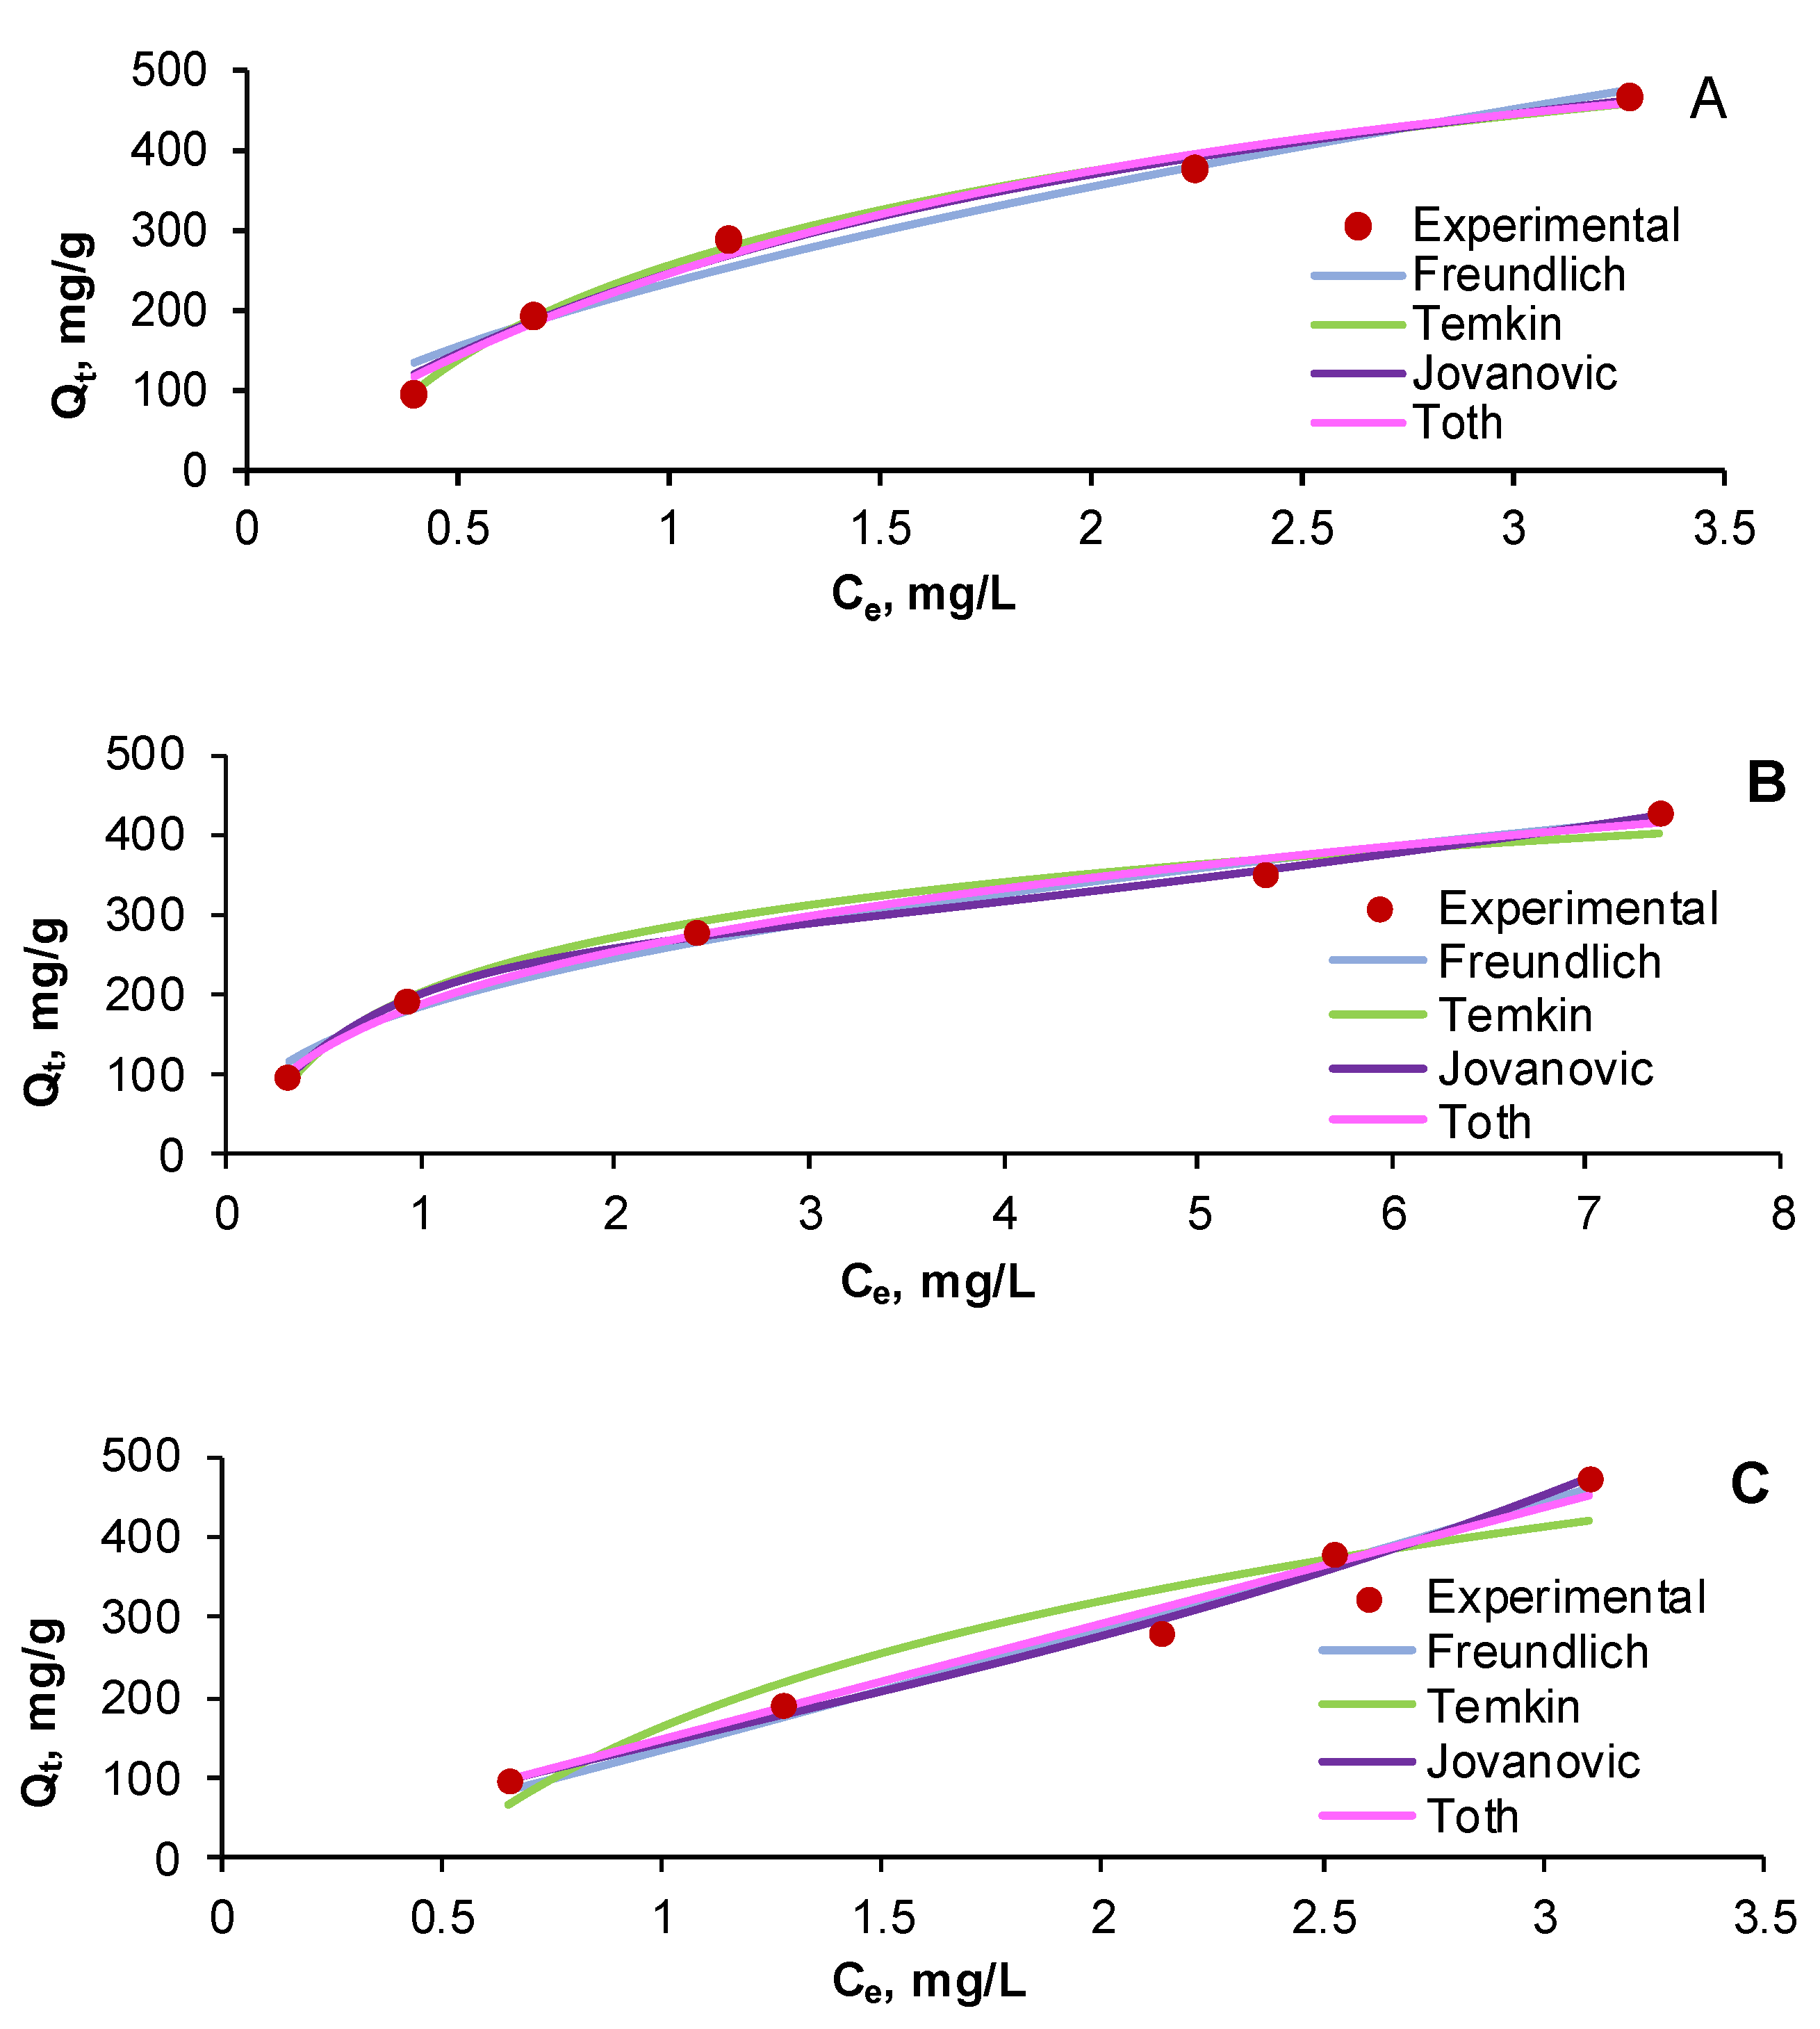
In the present work, three isotherm models with two parameters (Langmuir, Freundlich, and Temkin) and two isotherm models with three parameters (Jovanovic-multilayer and Toth) were compared to the registered results. Langmuir isotherm characterizes the adsorption happening on adsorbent homogeneous sites. It suggests that: (i) a material possessing adsorption properties has a limited adsorption capacity; (ii) the active sites of the adsorbent are identical and can accommodate only one adsorbate molecule; (iii) there are no interactions between the retained molecules [83]. Freundlich isotherm is useful in the situation of adsorbents with heterogeneous surfaces, which retain high amounts of contaminants [84]. The Temkin equation analyses the interactions between the adsorbent and the molecule to be adsorbed. It is based on the supposition that the molecules adsorption heat diminishes in a linear mode and that the binding energies are uniformly distributed [85]. The Jovanovic-multilayer isotherm model refers to physical adsorption and implies that the adsorbent surface which is not occupied by the target compound will reduce proportionally with the decrease in the power of the compound partial pressure [86]. The Toth isotherm provides information for submonolayer coverage, its theory relying on the fact that the materials with heterogeneous surfaces are able to adsorb low-to-high concentrations of pollutants from aqueous media [87].
As in the case of the kinetic study, very similar allures were remarked for all five tested pollutant concentrations (10 mg/L, 20 mg/L, 30 mg/L, 40 mg/L, and 50 mg/L) for the two monocomponent systems (AR and RB) and for the three binary component systems (25% AR + 75% RB, 50% AR + 50% RB, and 75% AR + 25% RB). Therefore, we have pictured, in Figure 8, as an example, only the equilibrium isotherms of the results obtained for a total initial pollutant concentration of 30 mg/L in the case of AR (Figure 8A), RB (Figure 8B), and their combination in equal proportions (Figure 8C).
Regardless of the fact that Langmuir isotherm is considered one of the most frequently used equations describing the adsorption process of various types of compounds, our investigation showed that this model is not suitable for portraying the adsorption (data not shown) of chosen dyes existing in single or in binary systems.
The analysis of the equilibrium isotherms parameters, reported in Table 5, reveals that, for the monocomponent dye system RB, the adsorption is favored by temperature, as the nF constant of the Freundlich isotherm is superior to 2. For both monocomponent dye systems, AR and RB, the ratio 1/nF Freundlich isotherm is subunitary, suggesting a chemisorption process. For the binary component system, it is superior to 1, indicating a cooperation adsorption and, thus, a high importance of the lateral interaction among compounds on the adsorbent surface. This can be explained by the fact that the functional groups, such as hydroxyl of the prepared material, are able to form coordinative bonds. In consequence, it can be noted that the adsorbent material prepared from cherry stones powder and chitosan has characteristics that are specific to a heterogeneous surface and that the adsorption process is conducted by chemisorption and cooperative adsorption.
A good fit with experimental data can be observed for the Temkin model, its nT constant suggesting a lack of adsorbent surface homogeneity.
The Jovanovic and Toth equations estimated the adsorption capacity; however, the values are rather different from those calculated experimentally, being higher in the case of the AR system and inferior for the RB system and for dye combinations.
Our conclusions are comparable with those of other studies conducted for the removal of dyes by adsorption on different materials. Similar findings were published by Ali et al. [88], who explored the adsorption of indigo carmin and Congo Red dyes on calcinated layered double hydroxides, and by Ojediran et al. [89], who inspected the retention of malachite green on acid functionalized maize cob and pointed out that the adsorption does not obey the Langmuir model. Abramian and El-Rassy focused on the adsorption of Orange II dye on a porous titania aerogel [79] and revealed that the Freundlich isotherm is suitable for describing the process. Archin et al. [90] showed that the Temkin model is applicable for the adsorption of Methylene Blue cationic dye and of Acid Blue 25 anionic dye in single form or in binary mixture on activated carbon obtained from tobacco residues. Diaz de Tuesta et al. [86] tested the removal of Sudan-IV from oily wastewater by retention on activated carbons and presented the Jovanovic and Toth expressions as appropriate models for their adsorption experiments.
The investigation of the statistical errors given in Table 6, along with the considerations discussed earlier, permit sustaining that the tested isotherm equations fit the experimental data in a satisfactory way. As a function of their adequacy and accuracy, the tried models can be ordered as follows: Freundlich > Temkin > Jovanovic > Toth.

2.5. Adsorption Mechanism Exploration

Depending on how the solid surface of the adsorbent interacts with the refractory compounds, the adsorption can occur by physical and/or by chemical sorption.
As explained earlier, the adsorption performance was affected by the solution pH, temperature, and adsorbent dose. The best results were obtained at pH 2, at a temperature of 30 °C, with a concentration of adsorbent of 100 g/L. In these conditions, the adsorbent is positively charged while both dyes encompass negative charges due to the existence of nitrogen–nitrogen bonds with aromatic rings, generally replaced by sulfonate groups in the case of AR, and with the sulfonate group present on the surface in the case of RB. The prepared material was able to retain the AR and RB from monocomponent systems or from binary systems based on electrostatic interactions, van der Waals forces, hydrogen, and π-π bonds. The fact that the Elovich and pseudo-second-order kinetic models were found to accurately describe the adsorption implies that chemical sorption is controlling the process. The adsorbent and the adsorbate interact mainly by strong covalent bonds. The migration of dyes from the surface to the interior of the retaining material was observable. The relation between the adsorbate and the adsorbent at equilibrium was described closely by the Freundlich and Temkin models. This information shows, also, that chemisorption and cooperative adsorption conduct the adsorption process.

3. Conclusions

This work focused on the synthesis of a low-cost adsorbent material based on entrapping an industrial waste represented by the cherry stones in a natural polymeric matrix such as chitosan. The resultant composite was characterized by SEM and FTIR analysis and by establishing its point of zero charge. It was then tested for its ability to adsorb emerging contaminants from aqueous solutions. Two azo dyes (Acid Red 66 and Reactive Black 5) were chosen as model molecules. Response Surface Methodology–Central Composite Design served to establish that pH 2, an adsorbent dose of 100 g/L, and a temperature of 30 °C are optimal for attaining the lowest final concentration of the mentioned dyes existing in single form or in different binary mixtures. The kinetic study carried out for various initial pollutant concentrations revealed that the adsorption mechanism is well described by the Elovich and pseudo-second-order models. In terms of equilibrium isotherms, the Freundlich and Temkin equations were found to reasonably characterize the process behavior.
The outcomes of this research allowed for confidence in the fact that the obtained hydrogel composite is a promising one and that it can be successfully utilized as an alternative to more expensive materials currently employed for removing pollutants from aqueous solutions.

4. Materials and Methods

4.1. Chemical Reagents

Analytical purity reagents were used for all the experiments without any prior treatment. All stock and diluted solutions were prepared with distilled water.
Sodium hydroxide, hydrochloric acid, acetic acid, and methanol were supplied by Chemical Company, Iasi, Romania. Glutaraldehyde was delivered by Across Organics (Vienna, Austria). Potassium nitrate, chitosan, Acid Red 66, and Reactive Black 5 dyes (Table 7) were provided by Merck, Romania.

4.2. Analytical Procedure

Stock solutions of Acid Red 66 and Reactive Black 5 dyes with concentrations of 100 mg/L were prepared.
When necessary, the pH was adjusted with small volumes of NaOH 0.1 M or of HCl 0.1 M. All pH measurements were made with a pH tester HI 98103 (Hanna Instruments, Bucharest, Romania).
Calibration curves in concentration range of 1 mg/L–15 mg/L for Acid Red 66 (AR) and of 1 mg/L–40 mg/L for Reactive Black 5 (RB) were used for samples evaluation. The absorbance was recorded at a wavelength of 500 nm and 600 nm for both dyes with a UV1280 Spectrophotometer (Shimadzu, Kyoto, Japan).

4.3. Adsorbent Synthesis

Cherry stones were recovered from fruits harvested from the Eastern Romanian region. They were washed with tap water and dried at room temperature for 24 h and in a laboratory oven (AirPerformance AP60, Froilabo, Paris, France) at 60 °C for 6 h. Then, they were passed through a grinding mill (PerkinElmer, Hägersten, Sweden) and sieved on a 125-µm sieve existing on an electromagnetic Filtra Vibracion IRIS FTS-0200 sieve shaker (Filtra Vibracion, Badalona, Spain).
The adsorbent was prepared based on the method proposed by Altun et al., 2019 [58] with slight modifications. Briefly, 4 g of chitosan were put in contact with 200 mL of a 2% acetic acid solution on a Nahita magnetic plate (Auxilab, Beriáin, Spain). After dissolution, 2 g of cherry stone powder were added and continuously stirred for 24 h. The resultant mixture was dropped into a coagulation solution composed of 120 g of NaOH, 400 mL of distilled water, and 600 mL of methanol. The obtained hydrogel beads were let in this solution for 24 h in order to insure their complete coagulation. After that, they were washed with distilled water until they had a neutral pH and then placed in a laboratory beaker along with a solution containing 1.2 mL glutaraldehyde and 120 mL methanol, and were heated at reflux at 70 °C for 6 h. The prepared cherry stones-chitosan hydrogel beads (abbreviated CSCH) were stored in glutaraldehyde-methanol solution in a closed vessel at 4 °C. Prior to use, they were washed with ethanol and distilled water.

4.4. Adsorbent Characterization

Before SEM analysis, the adsorbent was dried overnight at room temperature. Then, it was positioned on double-adhesive carbon discs fixed on specific stubs of a TESCAN MIRA device (TESCAN Orsay Holding, Brno, Check Republic) equipped with TESCAN Essence software version 1.0.8.0. Normal secondary electron mode (SE) in high vacuum was considered for the investigation. Detection was ensured by a large field detector (LFD) at an accelerating voltage of 20 kV, a working distance of 14–40 mm, and a spot size of 6. The magnification range was between 500 μm and 50 µm.
FTIR spectra were registered from 4000 cm−1 to 400 cm−1 (45 scans/min.) with a resolution of 4 cm−1 on an IRSpirit FT-IR spectrometer (Shimadzu, Bucharest, Romania) including a QATR accessory and a KBr beam splitter. The QATR plate was cleaned with ethanol between acquisitions. Air was used for background spectrum reference, which was recorded and compared with the anterior one.
Determination of pHPZC was realized by solid addition method with potassium nitrate as background electrolyte following the procedure described by Balistrieri and Murray [91]. Summarily, volumes of 25 mL of KNO3 0.1 M were added in a series of Erlenmeyer flasks. An adjustment between 2 and 12 of initial pH values (pHi) was ensured. In each initial solution, 0.5 g of CSCH beads were added. After 24 h at room temperature, the solutions pH was measured again (pHf). A graphical representation of the evolution of differences between the initial and final pH values (Δ pH) against pHi served to establish the pHPZC of the samples.

4.5. Optimization of Adsorption Process Main Parameters

Based on preliminary tests, three independent variables and one response function were chosen for the study. The coded and actual values of the considered factors included in the experimental matrix design are presented in Table 8.
10 mL of AR solution, 10 mL of RB solution, or 10 mL of a mixture containing 50% AR and 50% RB with a concentration of 30 mg/L with variable pH were put in contact with different amounts of cherry stones-chitosan hydrogel beads at various temperatures for 6 h.
The final dye concentrations were determined by reading the absorbance at 500 nm for AR and at 600 nm for RB. For the binary mixture, the absorbance was recorded both at 500 nm and at 600 nm. To establish the concentration in this case, Vierordt’s method (or the simultaneous equation method) was applied using Equations (4) and (5).
C AR = A λ 1 · ε RB λ 1 A λ 2 · ε RB λ 2 ε AR λ 1 · ε RB λ 2 ε RB λ 1 · ε AR λ 2
C RB = A λ 1 · ε RB λ 1 A λ 2 · ε RB λ 2 ε AR λ 1 · ε RB λ 2 ε RB λ 1 · ε AR λ 2
where CAR and CRB are the concentrations (mg/L) of AR and RB; Aλ1 is the absorbance of the mixture at 500 nm; Aλ2 is the absorbance of the mixture at 600 nm; εRBλ1 and εRBλ2 are the molar absorptivities of RB at 500 nm and 600 nm, respectively; εARλ1 and εARλ2 are the molar absorptivities of AR at 500 nm and 600 nm, respectively. Molar absorptivities were represented by the slopes of the calibration curves.
All experiments were carried out in triplicate and reported as mean values.
The obtained data were introduced in Design Expert 13 software (Stat-Ease, Minneapolis, MN, USA) and Response Surface Methodology–Central Composite Design (RSM-CCD) was used to find the optimum values of the working parameters and to generate quadratic polynomial models expressed by Equation (6):
Y K = β 0 + i = 1 n β i · X i + i = 1 n j = 1 n β ij · X i · X j + i = 1 n β ii · X i 2
where YK is the response function (final dye concentration, mg/L), Xi stands for independent variables, β0, βi, βj, and βij are the intercept, linear, quadratic, and interaction coefficients.
Removal efficiency (R, %) and equilibrium sorption capacity were calculated with Equations (7) and (8):
R = C i C e C i · 100
q e = C i C e M · V
where Ci and Ce are the initial and equilibrium concentrations (mg/L); V is the dye volume (mL); M is the adsorbent amount (g).

4.6. Kinetic Study and Equilibrium Isotherms

In the established optimal conditions, 10 mL of AR, of RB, or of AR + RB combinations with concentrations between 10 mg/L and 50 mg/L were mixed with the adsorbent. The pollutant retention was followed between 10 min and 240 min.
Each of the kinetic and equilibrium isotherm models has its own nonlinear equation. Their forms and related explanations are shown in Table 9 and Table 10. Experimental data were explored with the help of CAVS software, version 2.0 (Federal University of Paraná, Curitiba, Paraná, Brazil).

4.7. Statiscal Analysis

The results obtained by carrying out the experimental program concentrated on the elimination of dyes from aqueous solutions by adsorption on the prepared adsorbent were statistically evaluated by Analysis of Variance (ANOVA) (in the case of RSM), Root mean square error (RMSE), Marquardt’s percent standard deviation (MPSD), hybrid fractional error function (HYBRID), chi-square (χ2), and coefficient of determination (R2) (in the case of the kinetic and equilibrium isotherms study). All the values were generated by the software specified in Section 4.5 and Section 4.6.

Author Contributions

Conceptualization, C.-G.G.; methodology, C.-G.G.; software, A.-I.S.; validation, C.-G.G., A.-I.S., L.F., L.G. and C.D.; formal analysis, C.-G.G.; investigation, C.-G.G.; resources, C.-G.G., A.-I.S. and L.F.; data curation, C.-G.G.; writing—original draft preparation, C.-G.G.; writing—review and editing, C.-G.G.; visualization, L.G. and C.D.; supervision, L.G.; project administration, C.-G.G. and A.-I.S.; funding acquisition, C.-G.G., A.-I.S. and L.F. All authors have read and agreed to the published version of the manuscript.

Funding

This research received no external funding.

Informed Consent Statement

Not applicable.

Data Availability Statement

Not applicable.

Conflicts of Interest

The authors declare no conflict of interest.

References

  1. Benkhaya, S.; M’Rabet, S.; El Harfi, A. Classifications, properties, recent synthesis and applications of azo dyes. Heliyon 2020, 6, e03271. [Google Scholar] [CrossRef] [PubMed] [Green Version]
  2. Benkhaya, S.; M’ rabet, S.; El Harfi, A. A review on classifications, recent synthesis and applications of textile dyes. Inorg. Chem. Commun. 2020, 115, 107891. [Google Scholar] [CrossRef]
  3. Do, K.L.; Su, M.; Zhao, F. From historical dye to bio-colourant: Processing, identification in historical textiles and potential applications of anthraquinone-based morindone. Dye. Pigment. 2022, 205, 110482. [Google Scholar] [CrossRef]
  4. Vázquez-Ortega, F.; Lagunes, I.; Trigos, Á. Cosmetic dyes as potential photosensitizers of singlet oxygen generation. Dye. Pigment. 2020, 176, 108248. [Google Scholar] [CrossRef]
  5. Lee, M.; Nam, K.T.; Kim, J.; Lim, S.E.; Yeon, S.H.; Lee, B.; Lee, J.Y.; Lim, K.-M. Evaluation of ocular irritancy of coal-tar dyes used in cosmetics employing reconstructed human cornea-like epithelium and short time exposure tests. Food Chem. Toxicol. 2017, 108, 236–243. [Google Scholar] [CrossRef]
  6. Guerra, E.; Alvarez-Rivera, G.; Llompart, M.; Garcia-Jares, C. Simultaneous determination of preservatives and synthetic dyes in cosmetics by single-step vortex extraction and clean-up followed by liquid chromatography coupled to tandem mass spectrometry. Talanta 2018, 188, 251–258. [Google Scholar] [CrossRef]
  7. Durazzo, A.; Carocho, M.; Heleno, S.; Barros, L.; Souto, E.B.; Santini, A.; Lucarini, M. Food dyes and health: Literature quantitative research analysis. Meas. Food 2022, 7, 100050. [Google Scholar] [CrossRef]
  8. Lehmkuhler, A.; Miller, M.D.; Bradman, A.; Castorina, R.; Chen, M.-A.; Xie, T.; Mitchell, A.E. Levels of FD&C certified food dyes in foods commonly consumed by children. J. Food Compos. Anal. 2022, 112, 104649. [Google Scholar] [CrossRef]
  9. Jang, G.-W.; Choi, S.-I.; Choi, S.-H.; Han, X.; Men, X.; Kwon, H.-Y.; Choi, Y.-E.; Lee, O.-H. Method validation of 12 kinds of food dye in chewing gums and soft drinks, and evaluation of measurement uncertainty for soft drinks. Food Chem. 2021, 356, 129705. [Google Scholar] [CrossRef]
  10. Velho, S.R.K.; Brum, L.F.W.; Petter, C.O.; dos Santos, J.H.Z.; Šimunić, Š.; Kappa, W.H. Development of structured natural dyes for use into plastics. Dye. Pigment. 2017, 136, 248–254. [Google Scholar] [CrossRef]
  11. Choi, P.J.; Cooper, E.A.; Park, T.I.H.; Denny, W.A.; Jose, J. Novel synthetic approach for accessing drug–dye conjugates for targeted tumour therapy. Results Chem. 2022, 4, 100343. [Google Scholar] [CrossRef]
  12. Choi, P.J.; Cooper, E.; Schweder, P.; Mee, E.; Faull, R.; Denny, W.A.; Dragunow, M.; Park, T.I.H.; Jose, J. The synthesis of a novel Crizotinib heptamethine cyanine dye conjugate that potentiates the cytostatic and cytotoxic effects of Crizotinib in patient-derived glioblastoma cell lines. Bioorganic Med. Chem. Lett. 2019, 29, 2617–2621. [Google Scholar] [CrossRef] [PubMed]
  13. Kim, K.-H.; Kabir, E.; Jahan, S.A. The use of personal hair dye and its implications for human health. Environ. Int. 2016, 89–90, 222–227. [Google Scholar] [CrossRef]
  14. Al-Tohamy, R.; Ali, S.S.; Li, F.; Okasha, K.M.; Mahmoud, Y.A.G.; Elsamahy, T.; Jiao, H.; Fu, Y.; Sun, J. A critical review on the treatment of dye-containing wastewater: Ecotoxicological and health concerns of textile dyes and possible remediation approaches for environmental safety. Ecotoxicol. Environ. Saf. 2022, 231, 113160. [Google Scholar] [CrossRef]
  15. Oladoye, P.O.; Ajiboye, T.O.; Omotola, E.O.; Oyewola, O.J. Methylene blue dye: Toxicity and potential elimination technology from wastewater. Results Eng. 2022, 16, 100678. [Google Scholar] [CrossRef]
  16. Hadi, P.; Sharma, S.K.; McKay, G. Removal of Dyes from Effluents Using Biowaste-Derived Adsorbents. In Green Chemistry for Dyes Removal from Wastewater; Wiley: Hoboken, NJ, USA, 2015; pp. 139–201. [Google Scholar]
  17. Singh, A.; Pal, D.B.; Mohammad, A.; Alhazmi, A.; Haque, S.; Yoon, T.; Srivastava, N.; Gupta, V.K. Biological remediation technologies for dyes and heavy metals in wastewater treatment: New insight. Bioresour. Technol. 2022, 343, 126154. [Google Scholar] [CrossRef]
  18. Dadban Shahamat, Y.; Masihpour, M.; Borghei, P.; Hoda Rahmati, S. Removal of azo red-60 dye by advanced oxidation process O3/UV from textile wastewaters using Box-Behnken design. Inorg. Chem. Commun. 2022, 143, 109785. [Google Scholar] [CrossRef]
  19. Bessegato, G.G.; de Souza, J.C.; Cardoso, J.C.; Zanoni, M.V.B. Assessment of several advanced oxidation processes applied in the treatment of environmental concern constituents from a real hair dye wastewater. J. Environ. Chem. Eng. 2018, 6, 2794–2802. [Google Scholar] [CrossRef] [Green Version]
  20. Hassaan, M.A.; El Nemr, A.; Madkour, F.F. Testing the advanced oxidation processes on the degradation of Direct Blue 86 dye in wastewater. Egypt. J. Aquat. Res. 2017, 43, 11–19. [Google Scholar] [CrossRef] [Green Version]
  21. Wang, J.; Yuan, R.; Feng, Z.; Ma, F.; Zhou, B.; Chen, H. The advanced treatment of textile printing and dyeing wastewater by hydrodynamic cavitation and ozone: Degradation, mechanism, and transformation of dissolved organic matter. Environ. Res. 2022, 215, 114300. [Google Scholar] [CrossRef]
  22. Turhan, K.; Turgut, Z. Decolorization of direct dye in textile wastewater by ozonization in a semi-batch bubble column reactor. Desalination 2009, 242, 256–263. [Google Scholar] [CrossRef]
  23. Koulini, G.V.; Laiju, A.R.; Ramesh, S.T.; Gandhimathi, R.; Nidheesh, P.V. Effective degradation of azo dye from textile wastewater by electro-peroxone process. Chemosphere 2022, 289, 133152. [Google Scholar] [CrossRef]
  24. Kothai, A.; Sathishkumar, C.; Muthupriya, R.; Sankar, K.S.; Dharchana, R. Experimental investigation of textile dyeing wastewater treatment using aluminium in electro coagulation process and Fenton’s reagent in advanced oxidation process. Mater. Today Proc. 2021, 45, 1411–1416. [Google Scholar] [CrossRef]
  25. Chairungsri, W.; Subkomkaew, A.; Kijjanapanich, P.; Chimupala, Y. Direct dye wastewater photocatalysis using immobilized titanium dioxide on fixed substrate. Chemosphere 2022, 286, 131762. [Google Scholar] [CrossRef]
  26. Dihom, H.R.; Al-Shaibani, M.M.; Radin Mohamed, R.M.S.; Al-Gheethi, A.A.; Sharma, A.; Khamidun, M.H.B. Photocatalytic degradation of disperse azo dyes in textile wastewater using green zinc oxide nanoparticles synthesized in plant extract: A critical review. J. Water Process Eng. 2022, 47, 102705. [Google Scholar] [CrossRef]
  27. Thambiliyagodage, C. Efficient photocatalysis of carbon coupled TiO2 to degrade pollutants in wastewater—A review. Environ. Nanotechnol. Monit. Manag. 2022, 18, 100737. [Google Scholar] [CrossRef]
  28. Nnaji, P.C.; Anadebe, V.C.; Ezemagu, I.G.; Onukwuli, O.D. Potential of Luffa cylindrica seed as coagulation-flocculation (CF) agent for the treatment of dye wastewater: Kinetic, mass transfer, optimization and CF adsorption studies. Arab. J. Chem. 2022, 15, 103629. [Google Scholar] [CrossRef]
  29. Liang, C.-Z.; Sun, S.-P.; Li, F.-Y.; Ong, Y.-K.; Chung, T.-S. Treatment of highly concentrated wastewater containing multiple synthetic dyes by a combined process of coagulation/flocculation and nanofiltration. J. Membr. Sci. 2014, 469, 306–315. [Google Scholar] [CrossRef]
  30. Xiang, J.; Wang, X.; Ding, M.; Tang, X.; Zhang, S.; Zhang, X.; Xie, Z. The role of lateral size of MXene nanosheets in membrane filtration of dyeing wastewater: Membrane characteristic and performance. Chemosphere 2022, 294, 133728. [Google Scholar] [CrossRef] [PubMed]
  31. Xiang, J.; Li, H.; Hei, Y.; Tian, G.; Zhang, L.; Cheng, P.; Zhang, J.; Tang, N. Preparation of highly permeable electropositive nanofiltration membranes using quaternized polyethyleneimine for dye wastewater treatment. J. Water Process Eng. 2022, 48, 102831. [Google Scholar] [CrossRef]
  32. Hao, J.; Ji, L.; Li, C.; Hu, C.; Wu, K. Rapid, efficient and economic removal of organic dyes and heavy metals from wastewater by zinc-induced in-situ reduction and precipitation of graphene oxide. J. Taiwan Inst. Chem. Eng. 2018, 88, 137–145. [Google Scholar] [CrossRef]
  33. Li, Y.; An, Y.; Zhao, R.; Zhong, Y.; Long, S.; Yang, J.; Li, J.; Zheng, H. Synergetic removal of oppositely charged dyes by co-precipitation and amphoteric self-floating capturer: Mechanism investigation by molecular simulation. Chemosphere 2022, 296, 134033. [Google Scholar] [CrossRef]
  34. Liu, X.; Chen, Z.; Du, W.; Liu, P.; Zhang, L.; Shi, F. Treatment of wastewater containing methyl orange dye by fluidized three dimensional electrochemical oxidation process integrated with chemical oxidation and adsorption. J. Environ. Manag. 2022, 311, 114775. [Google Scholar] [CrossRef]
  35. Jing, X.; Yuan, J.; Cai, D.; Li, B.; Hu, D.; Li, J. Concentrating and recycling of high-concentration printing and dyeing wastewater by a disc tube reverse osmosis-Fenton oxidation/low temperature crystallization process. Sep. Purif. Technol. 2021, 266, 118583. [Google Scholar] [CrossRef]
  36. Khan, S.A.; Abbasi, N.; Hussain, D.; Khan, T.A. Sustainable Mitigation of Paracetamol with a Novel Dual-Functionalized Pullulan/Kaolin Hydrogel Nanocomposite from Simulated Wastewater. Langmuir 2022, 38, 8280–8295. [Google Scholar] [CrossRef] [PubMed]
  37. Bichave, M.S.; Kature, A.Y.; Koranne, S.V.; Shinde, R.S.; Gongle, A.S.; Choudhari, V.P.; Topare, N.S.; Raut-Jadhav, S.; Bokil, S.A. Nano-metal oxides-activated carbons for dyes removal: A review. Mater. Today Proc. 2022, in press. [Google Scholar] [CrossRef]
  38. Goswami, R.; Kumar Dey, A. Synthesis and application of treated activated carbon for cationic dye removal from modelled aqueous solution. Arab. J. Chem. 2022, 15, 104290. [Google Scholar] [CrossRef]
  39. Sultana, M.; Rownok, M.H.; Sabrin, M.; Rahaman, M.H.; Alam, S.M.N. A review on experimental chemically modified activated carbon to enhance dye and heavy metals adsorption. Clean. Eng. Technol. 2022, 6, 100382. [Google Scholar] [CrossRef]
  40. Wang, W.; Zhao, W.; Zhang, H.; Xu, J.; Zong, L.; Kang, Y.; Wang, A. Mesoporous polymetallic silicate derived from naturally abundant mixed clay: A potential robust adsorbent for removal of cationic dye and antibiotic. Powder Technol. 2021, 390, 303–314. [Google Scholar] [CrossRef]
  41. Tochetto, G.A.; Simão, L.; de Oliveira, D.; Hotza, D.; Immich, A.P.S. Porous geopolymers as dye adsorbents: Review and perspectives. J. Clean. Prod. 2022, 374, 133982. [Google Scholar] [CrossRef]
  42. Bilal, M.; Ihsanullah, I.; Hassan Shah, M.U.; Bhaskar Reddy, A.V.; Aminabhavi, T.M. Recent advances in the removal of dyes from wastewater using low-cost adsorbents. J. Environ. Manag. 2022, 321, 115981. [Google Scholar] [CrossRef]
  43. Ali, N.S.; Jabbar, N.M.; Alardhi, S.M.; Majdi, H.S.; Albayati, T.M. Adsorption of methyl violet dye onto a prepared bio-adsorbent from date seeds: Isotherm, kinetics, and thermodynamic studies. Heliyon 2022, 8, e10276. [Google Scholar] [CrossRef] [PubMed]
  44. Amalina, F.; Abd Razak, A.S.; Krishnan, S.; Zularisam, A.W.; Nasrullah, M. A review of eco-sustainable techniques for the removal of Rhodamine B dye utilizing biomass residue adsorbents. Phys. Chem. Earth Parts A/B/C 2022, 128, 103267. [Google Scholar] [CrossRef]
  45. Moradi, O.; Panahandeh, S. Fabrication of different adsorbents based on zirconium oxide, graphene oxide, and dextrin for removal of green malachite dye from aqueous solutions. Environ. Res. 2022, 214, 114042. [Google Scholar] [CrossRef]
  46. Hassanien, R.; Hassan, Z.A.; Al-Assy, W.; Ibrahim, S.M. Removal of toxic thymol sulfone phthalein dye from wastewater by using efficient adsorbent NiO nanoparticles. J. Mol. Struct. 2022, 1269, 133864. [Google Scholar] [CrossRef]
  47. Zeng, S.; Long, J.; Sun, J.; Wang, G.; Zhou, L. A review on peach gum polysaccharide: Hydrolysis, structure, properties and applications. Carbohydr. Polym. 2022, 279, 119015. [Google Scholar] [CrossRef]
  48. Tabasum, A.; Razzaq, H.; Razzaque, S.; Bibi, A.; Farooq, S.; Yaqub, A.; Siddique, A.; Amir, T.; Rehman, S.-u. Protonated polyaniline and its derivatives as potential adsorbents for simultaneous reclamation of textile dyes and oil/water separation. Mater. Chem. Phys. 2023, 293, 126913. [Google Scholar] [CrossRef]
  49. Mohammad-Rezaei, R.; Khalilzadeh, B.; Rahimi, F.; Moradi, S.; Shahlaei, M.; Derakhshankhah, H.; Jaymand, M. Simultaneous removal of cationic and anionic dyes from simulated industrial effluents using a nature-inspired adsorbent. Environ. Res. 2022, 214, 113966. [Google Scholar] [CrossRef]
  50. Angin, D. Production and characterization of activated carbon from sour cherry stones by zinc chloride. Fuel 2014, 115, 804–811. [Google Scholar] [CrossRef]
  51. Olivares-Marín, M.; Fernández-González, C.; Macías-García, A.; Gómez-Serrano, V. Preparation of activated carbons from cherry stones by activation with potassium hydroxide. Appl. Surf. Sci. 2006, 252, 5980–5983. [Google Scholar] [CrossRef]
  52. Olivares-Marín, M.; Fernández-González, C.; Macías-García, A.; Gómez-Serrano, V. Preparation of activated carbon from cherry stones by physical activation in air. Influence of the chemical carbonisation with H2SO4. J. Anal. Appl. Pyrolysis 2012, 94, 131–137. [Google Scholar] [CrossRef]
  53. Durán-Valle, C.J.; Gómez-Corzo, M.; Gómez-Serrano, V.; Pastor-Villegas, J.; Rojas-Cervantes, M.L. Preparation of charcoal from cherry stones. Appl. Surf. Sci. 2006, 252, 5957–5960. [Google Scholar] [CrossRef]
  54. Nowicki, P.; Kazmierczak, J.; Pietrzak, R. Comparison of physicochemical and sorption properties of activated carbons prepared by physical and chemical activation of cherry stones. Powder Technol. 2015, 269, 312–319. [Google Scholar] [CrossRef]
  55. Grigoras, C.; Simion, A.-I.; Favier, L.; Gavrilă, L. Congo Red Removal from Aqueous Effluents by Adsorption on Cherry Stones Activated Carbon. Environ. Eng. Manag. J. 2020, 19, 247–254. [Google Scholar]
  56. Al-Rooqi, M.M.; Hassan, M.M.; Moussa, Z.; Obaid, R.J.; Suman, N.H.; Wagner, M.H.; Natto, S.S.A.; Ahmed, S.A. Advancement of chitin and chitosan as promising biomaterials. J. Saudi Chem. Soc. 2022, 26, 101561. [Google Scholar] [CrossRef]
  57. Nasir, A.; Inaam-ul-Hassan, M.; Raza, A.; Tahir, M.; Yasin, T. Removal of copper using chitosan beads embedded with amidoxime grafted graphene oxide nanohybids. Int. J. Biol. Macromol. 2022, 222, 750–758. [Google Scholar] [CrossRef]
  58. Altun, T. Chitosan-coated sour cherry kernel shell beads: An adsorbent for removal of Cr(VI) from acidic solutions. J. Anal. Sci. Technol. 2019, 10, 14. [Google Scholar] [CrossRef]
  59. Rosli, M.I.; Abdullah, M.; Krishnan, G.; Harun, S.W.; Aziz, M.S. Power-dependent nonlinear optical behaviours of ponceau BS chromophore at 532 nm via Z-scan technique. J. Photochem. Photobiol. A Chem. 2020, 397, 112574. [Google Scholar] [CrossRef]
  60. Vinayak, A.; Singh, G.B. Biodecolorization of reactive black 5 using magnetite nanoparticles coated Bacillus sp. RA5. Mater. Today: Proc. 2022, 48, 1523–1526. [Google Scholar] [CrossRef]
  61. Joksimović, K.; Kodranov, I.; Randjelović, D.; Slavković Beškoski, L.; Radulović, J.; Lješević, M.; Manojlović, D.; Beškoski, V.P. Microbial fuel cells as an electrical energy source for degradation followed by decolorization of Reactive Black 5 azo dye. Bioelectrochemistry 2022, 145, 108088. [Google Scholar] [CrossRef]
  62. Khan, M.; Sarwar, A. Determination of points of zero charge of natural and treated adsorbents. Surf. Rev. Lett. 2007, 14, 461–469. [Google Scholar] [CrossRef]
  63. Bakatula, E.N.; Richard, D.; Neculita, C.M.; Zagury, G.J. Determination of point of zero charge of natural organic materials. Environ. Sci. Pollut. Res. 2018, 25, 7823–7833. [Google Scholar] [CrossRef]
  64. Olivares-Marín, M.; Del Prete, V.; Garcia-Moruno, E.; Fernández-González, C.; Macías-García, A.; Gómez-Serrano, V. The development of an activated carbon from cherry stones and its use in the removal of ochratoxin A from red wine. Food Control 2009, 20, 298–303. [Google Scholar] [CrossRef]
  65. Bushra, R.; Mohamad, S.; Alias, Y.; Jin, Y.; Ahmad, M. Current approaches and methodologies to explore the perceptive adsorption mechanism of dyes on low-cost agricultural waste: A review. Microporous Mesoporous Mater. 2021, 319, 111040. [Google Scholar] [CrossRef]
  66. Karimifard, S.; Alavi Moghaddam, M.R. Application of response surface methodology in physicochemical removal of dyes from wastewater: A critical review. Sci. Total Environ. 2018, 640–641, 772–797. [Google Scholar] [CrossRef] [PubMed]
  67. Ye, X.; Wu, L.; Zhu, M.; Wang, Z.; Huang, Z.-H.; Wang, M.-X. Lotus pollen-derived hierarchically porous carbons with exceptional adsorption performance toward Reactive Black 5: Isotherms, kinetics and thermodynamics investigations. Sep. Purif. Technol. 2022, 300, 121899. [Google Scholar] [CrossRef]
  68. Priya; Sharma, A.K.; Kaith, B.S.; Vipula; Chandel, K.; Singh, A.; Isha. Chemically modified chitosan-sodium alginate as chemo-sensor adsorbent for the detection of picric acid and removal of biebrich scarlet. Int. J. Biol. Macromol. 2020, 147, 582–594. [Google Scholar] [CrossRef]
  69. Priya; Sharma, A.K.; Kaith, B.S.; Tanwar, V.; Bhatia, J.K.; Sharma, N.; Bajaj, S.; Panchal, S. RSM-CCD optimized sodium alginate/gelatin based ZnS-nanocomposite hydrogel for the effective removal of biebrich scarlet and crystal violet dyes. Int. J. Biol. Macromol. 2019, 129, 214–226. [Google Scholar] [CrossRef]
  70. Yadav, B.S.; Dasgupta, S. Effect of time, pH, and temperature on kinetics for adsorption of methyl orange dye into the modified nitrate intercalated MgAl LDH adsorbent. Inorg. Chem. Commun. 2022, 137, 109203. [Google Scholar] [CrossRef]
  71. de Farias Silva, C.E.; da Gama, B.M.V.; da Silva Gonçalves, A.H.; Medeiros, J.A.; de Souza Abud, A.K. Basic-dye adsorption in albedo residue: Effect of pH, contact time, temperature, dye concentration, biomass dosage, rotation and ionic strength. J. King Saud Univ.-Eng. Sci. 2020, 32, 351–359. [Google Scholar] [CrossRef]
  72. Plazinski, W.; Rudzinski, W.; Plazinska, A. Theoretical models of sorption kinetics including a surface reaction mechanism: A review. Adv. Colloid Interface Sci. 2009, 152, 2–13. [Google Scholar] [CrossRef]
  73. Tran, H.N.; You, S.-J.; Chao, H.-P. Thermodynamic parameters of cadmium adsorption onto orange peel calculated from various methods: A comparison study. J. Environ. Chem. Eng. 2016, 4, 2671–2682. [Google Scholar] [CrossRef]
  74. Azizian, S. Kinetic models of sorption: A theoretical analysis. J. Colloid Interface Sci. 2004, 276, 47–52. [Google Scholar] [CrossRef] [PubMed]
  75. dos Santos Lins, P.V.; Henrique, D.C.; Ide, A.H.; de Paiva e Silva Zanta, C.L.; Meili, L. Evaluation of caffeine adsorption by MgAl-LDH/biochar composite. Environ. Sci. Pollut. Res. 2019, 26, 31804–31811. [Google Scholar] [CrossRef] [PubMed]
  76. Wu, F.-C.; Tseng, R.-L.; Juang, R.-S. Characteristics of Elovich equation used for the analysis of adsorption kinetics in dye-chitosan systems. Chem. Eng. J. 2009, 150, 366–373. [Google Scholar] [CrossRef]
  77. George, R.; Sugunan, S. Kinetics of adsorption of lipase onto different mesoporous materials: Evaluation of Avrami model and leaching studies. J. Mol. Catal. B Enzym. 2014, 105, 26–32. [Google Scholar] [CrossRef]
  78. Rong, X.; Qiu, F.; Qin, J.; Zhao, H.; Yan, J.; Yang, D. A facile hydrothermal synthesis, adsorption kinetics and isotherms to Congo Red azo-dye from aqueous solution of NiO/graphene nanosheets adsorbent. J. Ind. Eng. Chem. 2015, 26, 354–363. [Google Scholar] [CrossRef]
  79. Abramian, L.; El-Rassy, H. Adsorption kinetics and thermodynamics of azo-dye Orange II onto highly porous titania aerogel. Chem. Eng. J. 2009, 150, 403–410. [Google Scholar] [CrossRef]
  80. Felista, M.M.; Wanyonyi, W.C.; Ongera, G. Adsorption of anionic dye (Reactive black 5) using macadamia seed Husks: Kinetics and equilibrium studies. Sci. Afr. 2020, 7, e00283. [Google Scholar] [CrossRef]
  81. Shahinpour, A.; Tanhaei, B.; Ayati, A.; Beiki, H.; Sillanpää, M. Binary dyes adsorption onto novel designed magnetic clay-biopolymer hydrogel involves characterization and adsorption performance: Kinetic, equilibrium, thermodynamic, and adsorption mechanism. J. Mol. Liq. 2022, 366, 120303. [Google Scholar] [CrossRef]
  82. You, X.; Zhou, R.; Zhu, Y.; Bu, D.; Cheng, D. Adsorption of dyes methyl violet and malachite green from aqueous solution on multi-step modified rice husk powder in single and binary systems: Characterization, adsorption behavior and physical interpretations. J. Hazard. Mater. 2022, 430, 128445. [Google Scholar] [CrossRef]
  83. Osagie, C.; Othmani, A.; Ghosh, S.; Malloum, A.; Kashitarash Esfahani, Z.; Ahmadi, S. Dyes adsorption from aqueous media through the nanotechnology: A review. J. Mater. Res. Technol. 2021, 14, 2195–2218. [Google Scholar] [CrossRef]
  84. Foo, K.Y.; Hameed, B.H. Insights into the modeling of adsorption isotherm systems. Chem. Eng. J. 2010, 156, 2–10. [Google Scholar] [CrossRef]
  85. Hamdaoui, O.; Naffrechoux, E. Modeling of adsorption isotherms of phenol and chlorophenols onto granular activated carbon: Part I. Two-parameter models and equations allowing determination of thermodynamic parameters. J. Hazard. Mater. 2007, 147, 381–394. [Google Scholar] [CrossRef] [PubMed]
  86. Diaz de Tuesta, J.L.; Silva, A.M.T.; Faria, J.L.; Gomes, H.T. Adsorption of Sudan-IV contained in oily wastewater on lipophilic activated carbons: Kinetic and isotherm modelling. Environ. Sci. Pollut. Res. 2020, 27, 20770–20785. [Google Scholar] [CrossRef]
  87. Mozaffari Majd, M.; Kordzadeh-Kermani, V.; Ghalandari, V.; Askari, A.; Sillanpää, M. Adsorption isotherm models: A comprehensive and systematic review (2010−2020). Sci. Total Environ. 2022, 812, 151334. [Google Scholar] [CrossRef] [PubMed]
  88. Ali, B.; Naceur, B.; Abdelkader, E.; Karima, E.; Nourredine, B. Competitive adsorption of binary dye from aqueous solutions using calcined layered double hydroxides. Int. J. Environ. Anal. Chem. 2022, 102, 3207–3226. [Google Scholar] [CrossRef]
  89. Ojediran, J.O.; Dada, A.O.; Aniyi, S.O.; David, R.O.; Adewumi, A.D. Mechanism and isotherm modeling of effective adsorption of malachite green as endocrine disruptive dye using Acid Functionalized Maize Cob (AFMC). Sci. Rep. 2021, 11, 21498. [Google Scholar] [CrossRef] [PubMed]
  90. Archin, S.; Sharifi, S.H.; Asadpour, G. Optimization and modeling of simultaneous ultrasound-assisted adsorption of binary dyes using activated carbon from tobacco residues: Response surface methodology. J. Clean. Prod. 2019, 239, 118136. [Google Scholar] [CrossRef]
  91. Balistrieri, L.; Murray, J. The Surface Chemistry of Goethite (a-FeOOH) in Major Ion Seawater. Am. J. Sci. 1981, 281, 788–806. [Google Scholar] [CrossRef]
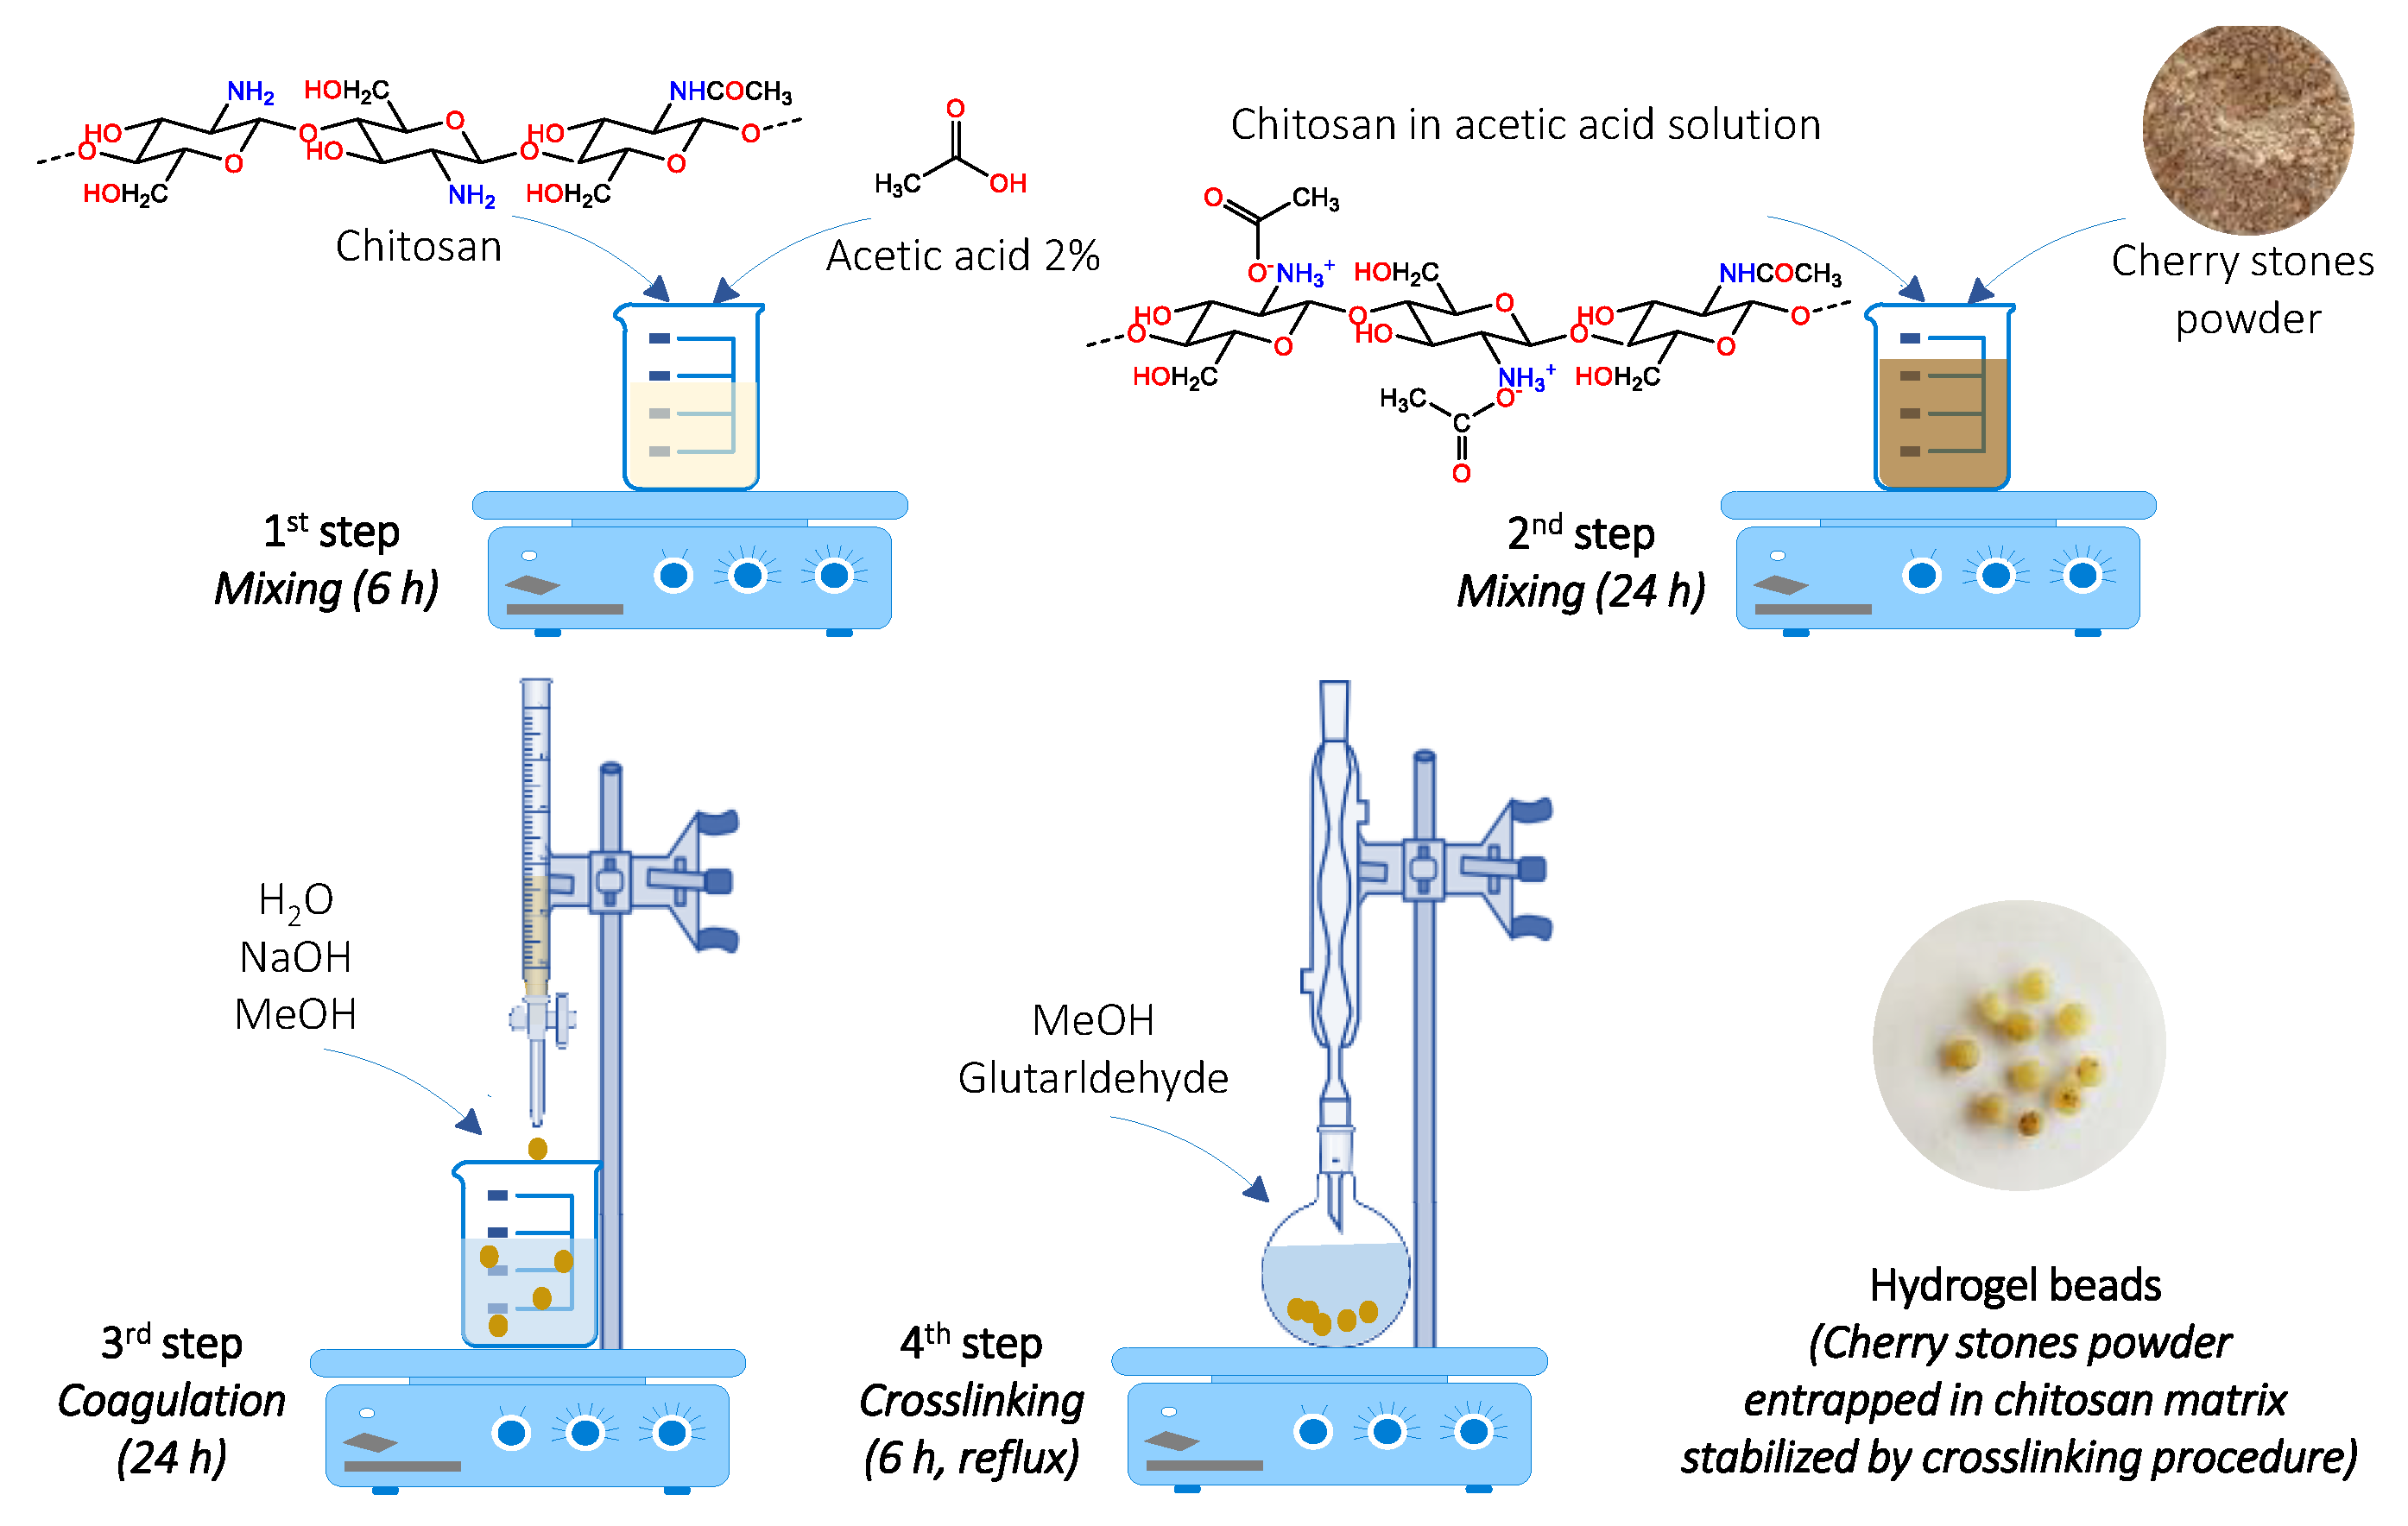
Figure 1. Hydrogel beads preparation procedure.
Gels 08 00795 g001
Figure 2. Images of CSCH beads before dye adsorption (A) and after adsorption of AR (B), RB (C), 25% AR + 75% RB (D), 50% AR + 50% RB (E), and 75% AR + 25% RB (F).
Gels 08 00795 g002
Figure 3. SEM photographs of CSCH beads before dye adsorption (A) and after adsorption of AR (B), RB (C), 25% AR + 75% RB (D), 50% AR + 50% RB (E), and 75% AR + 25% RB (F).
Gels 08 00795 g003
Figure 4. FTIR spectra of CSCH beads before dye adsorption (A) and after adsorption of AR (B), RB (C), 25% AR + 75% RB (D), 50% AR + 50% RB (E), and 75% AR + 25% RB (F).
Gels 08 00795 g004
Figure 5. Point of zero charge of the prepared adsorbent.
Gels 08 00795 g005
Figure 6. Aggregate impact of pH, adsorbent dose, and temperature on final concentration of AR (A), RB (B), and 50% AR + 50% RB (C).
Gels 08 00795 g006
Figure 7. Kinetics of AR (A), RB (B), and 50% AR + 50% RB (C) adsorption on CSCH adsorbent.
Gels 08 00795 g007
Figure 8. Equilibrium isotherms of AR (A), RB (B), and 50% AR + 50% RB (C) adsorption on CSCH adsorbent.
Gels 08 00795 g008
Table 1. RSM-CCD matrix including experimentally obtained and model-predicted data.
RunVariablesFinal Contaminant Concentration, mg/L
X1X2X3ARRB50% AR + 50% RB
ObservedPredictedObservedPredictedObservedPredicted
1250208.077.489.799.8418.1216.37
2250307.166.547.717.6917.2916.25
3250408.077.539.679.5718.8117.48
42100202.082.194.634.459.6511.06
52100301.141.582.402.397.0710.98
62100401.842.904.554.3711.2312.26
72150203.753.976.736.9414.2214.31
82150303.473.684.924.9816.6514.28
92150405.605.326.877.0615.5615.60
107502014.3715.3918.2018.2322.5223.76
117503013.6514.1515.9215.8922.1223.39
127504014.1914.8517.2617.5822.7824.37
137100209.089.4512.8212.9420.5419.22
147100308.788.5410.2410.6919.8018.89
1571004010.329.5712.6212.4822.1219.91
1671502011.4910.5715.8815.5323.3423.23
1771503010.229.9913.7313.3822.9722.95
1871504011.7711.3415.3215.2723.5724.02
1912502022.4321.9026.5926.3326.9727.09
2012503020.3620.3823.7523.8026.5926.47
2112504020.7320.7925.3225.3027.1827.20
22121002015.4015.3221.0021.1423.7323.31
23121003014.5714.1218.5718.7023.7022.73
24121004015.3114.8620.6420.3024.0323.50
25121502015.4015.7923.6023.8427.3528.09
26121503014.5614.9221.7721.5027.3327.56
27121504015.3115.9822.8623.1927.4428.37
Table 2. Analysis of variance for adsorption of dyes in single or binary system on the synthesized adsorbent material.
SourceSum of SquaresdfMean SquareF-Valuep-Value
AR
Model890.28998.92260.08<0.0001
X1—pH707.861707.861861.08<0.0001
X2—Adsorbent dose77.92177.92204.86<0.0001
X3—Temperature0.064210.06420.16870.6857
X1X25.0615.0613.310.0016
X1X31.0211.022.670.1177
X2X31.2811.283.380.0811
X123.7613.769.890.0051
X2283.08183.08218.44<0.0001
X325.7615.7615.150.0009
Residual7.61200.3803
Lack of Fit7.60170.4472254.310.0004
Pure Error0.005330.0018
Cor Total897.8929
RB
Model1383.549153.731877.61<0.0001
X1—pH1197.7211197.7214,628.93<0.0001
X2—Adsorbent dose28.20128.20344.43<0.0001
X3—Temperature0.947610.947611.570.0028
X1X20.124010.12401.510.2327
X1X30.444710.44475.430.0304
X2X30.114110.11411.390.2517
X120.190010.19002.320.1433
X22105.381105.381287.11<0.0001
X3227.34127.34333.96<0.0001
Residual1.64200.0819
Lack of Fit0.9900170.05820.26980.9678
Pure Error0.647530.2158
Cor Total1385.1829
50% AR + 50% RB
Model767.58985.2934.43<0.0001
X1—pH620.921620.92250.64<0.0001
X2—Adsorbent dose0.873610.87360.35260.5593
X3—Temperature2.1912.190.88490.3581
X1X27.0117.012.830.1080
X1X30.759410.75940.30650.5859
X2X30.021510.02150.00870.9266
X1235.51135.5114.340.0012
X22111.811111.8145.13<0.0001
X321.2811.280.51630.4807
Residual49.55202.48
Lack of Fit48.87172.8712.650.0295
Pure Error0.681930.2273
Cor Total817.1329
Table 3. Kinetic parameters of adsorption of AR, RB, and 50% AR + 50% RB.
Kinetic ModelParametersDye System
ARRB50% AR + 50% RB
Pseudo-first-orderQe266.0630246.2734263.1561
k10.03570.02410.0502
Pseudo-second-orderQe291.7014277.7586282.5912
k20.00010.00010.0002
Elovichα68.971125.441646.8997
β0.02150.01930.0008
AvramiQe266.0640246.2756263.1573
kAv0.00480.00370.0097
nAv7.39766.51195.1388
Table 4. Statistical error function values of kinetic nonlinear models.
Kinetic ModelStatistical ErrorDye System
ARRB50% AR + 50% RB
Pseudo-1st-orderRMSE16.383524.999719.0718
MPSD10.721118.444210.0718
HYBRID176.581468.3276216.2806
Χ231.176999.941836.2142
R20.88890.77550.7631
Pseudo-2nd-orderRMSE7.101016.91118.8147
MPSD4.835212.66835.1598
HYBRID34.4764217.737747.5154
Χ25.391939.43007.2024
R20.97910.89720.9494
ElovichRMSE6.04967.83814.6171
MPSD3.62095.71362.1060
HYBRID22.395545.690510.1622
Χ23.04016.82121.4145
R20.98480.97790.9861
AvramiRMSE16.383424.999719.0718
MPSD11.126319.141111.2905
HYBRID190.1722504.3717232.9243
Χ231.179799.952736.2170
R20.88880.77550.7631
Table 5. Equilibrium isotherm parameters of adsorption of AR, RB, and 50% AR + 50% RB.
Equilibrium
Isotherm
ParametersDye System
ARRB50% AR + 50% RB
FreundlichKF234.4442183.2031134.9317
nF1.67682.42460.9236
TemkinKT4.532225.530111.1164
bT14.82907.68882.0320
Jovanovic-multilayerQJ356.0906222.6863120.8938
KJ1.00001.72271.4182
K’J0.09170.08670.4418
TothQTo1157.282226.8143145.5048
KTo3.05210.25713.8275
nTo1.10410.82550.00006
Table 6. Statistical error function values of equilibrium isotherm nonlinear models.
Equilibrium IsothermStatistical ErrorDye System
ARRB50% AR + 50% RB
FreundlichRMSE23.862514.836614.9614
MPSD24.457112.00348.6964
HYBRID676.8724198.3764153.0725
Χ216.38265.50984.4373
R20.96680.98340.9872
TemkinRMSE9.580916.894138.2854
MPSD3.89817.647524.0721
HYBRID44.5042145.47211004.89
Χ21.31254.461732.6841
R20.99460.97850.9167
Jovanovic-multilayerRMSE16.68734.755711.2649
MPSD19.08022.32536.9566
HYBRID418.448517.2520115.684
Χ27.15940.34312.2864
R20.98560.99830.9927
TothRMSE16.054312.754016.6615
MPSD17.48197.94848.8027
HYBRID379.7791140.7021227.6069
Χ26.70542.75084.1725
R20.98500.98770.9842
Table 7. Model azo dyes properties.
PropertiesAcid Red 66Reactive Black 5
StructureGels 08 00795 i001Gels 08 00795 i002
Chemical name Sodium 6-(2-hydroxynaphthylazo)-3,4′-azodibenzenesulfonateTetrasodium 4-amino-5-hydroxy-3,6[[4-[[2-(sulphonatooxy)ethyl]supphonyl]pehnyl]azo]naphthalene-2,7-disulphonate
Molecular formulaC22H14N4Na2O7S2C26H21N5Na4O19S6
Molecular weight556.48 g/mol991.82 g/mol
CAS Number4196.99-017095-24-8
EC Number224-084-5241-164-5
Maximum wavelength500 nm600 nm
Table 8. Variables and levels of variation in RSM-CCD.
VariableLevels of Variation
CodedUncodedLow (−1)Central (0)High (+1)
X1pH2712
X2Adsorbent dose, mg/L50100150
X3Temperature, °C203040
Table 9. Kinetic models nonlinear equations.
Kinetic ModelEquationParameters Significance *
Pseudo-1st-order Q t = Q e · 1 e k 1 · t k1—pseudo-first-order constant rate, min−1
Pseudo-2nd-order Q t = k 2 · Q e 2 · t 1 + k 2 · Q e · t k2—pseudo-2nd-order constant rate, g/(mg·min)
Elovich Q t = 1 β · ln α · β · t + 1 β—extent of surface coverage and activation energy for chemisorption, g/mg
α—initial adsorption rate, mg/(g·min)
Avrami Q t = Q e · 1 e k Av · t ) n Av kAv—global rate constant, min−1
nAv—factor related to adsorption, dimensionless
* Common symbols significance: Qt—concentration on the solid phase at time t, mg/g; Qe—adsorbent capacity at equilibrium, mg/g; t—contact time, min.
Table 10. Equilibrium isotherms nonlinear equations.
Equilibrium IsothermEquationParameters Significance *
Langmuir Q e = Q L · K L · C e 1 + K L · C e QL—maximum Langmuir uptake, mg/g
KL—Langmuir constant, L/mg
Freundlich Q e = K F · C e 1 / n F KF—Freundlich constant, (mg/g)(L/mg)1/n
nF—Freundlich constant, dimensionless
Temkin Q e = R · T b T · ln K T · C e R—gas constant, R = 8.314 J/(mol K)
T—temperature, K
KT—Temkin constant, L/mg
bT—Temkin constant, J/mg
Jovanovic-multilayer Q e = Q J · ( 1 e K J · C e · e K J · C e ) QJ—Jovanovic maximum uptake, mg/g
KJ—Jovanovic constant, L/mg
K’J—Jovanovic constant, L/mg
Toth Q e = Q To · C e 1 K To + C e n To 1 / n To QTo—Toth maximum uptake, mg/g
KTo—Toth constant, L/mg
nTo—Toth constant, dimensionless
* Common symbols significance: Qe—adsorbate concentration on solid phase at equilibrium, mg/g; Ce—adsorbate concentration on fluid phase at equilibrium, mg/L.
Publisher’s Note: MDPI stays neutral with regard to jurisdictional claims in published maps and institutional affiliations.