Acknowledgments
Finally, this research would have not been possible without the collaboration of John Hedges and his wide-angle and deep perspective of marine geochemistry; or the seasoned advice of my friends Toyo Tanaka, Sam Edwards, Karel Dušek, and Peter Santschi; and without the support of Dennis Willows, former Director of Friday Harbor Labs; and the collaboration of Jekaterina Zyuzin, John Tuthill, Anthony Rodriguez, Andrew Moon, Chung Jong Yu, Tsveta Krumova, Jamila Harris, Jordan Stead, Maria Jose Bravo, Kelly Kettleson, Meena Padha, Thien Nguyen, Wei-Chun Chin, and Yongxue Ding; and former research fellows Ivan Quezada and Monica Orellana. Finally, I’m equally thankful for the outstanding support of our technical assistant and cat-herding boss Michelle Herko, who kept everyone at the bench, supplies on time, and our instruments running and well serviced.
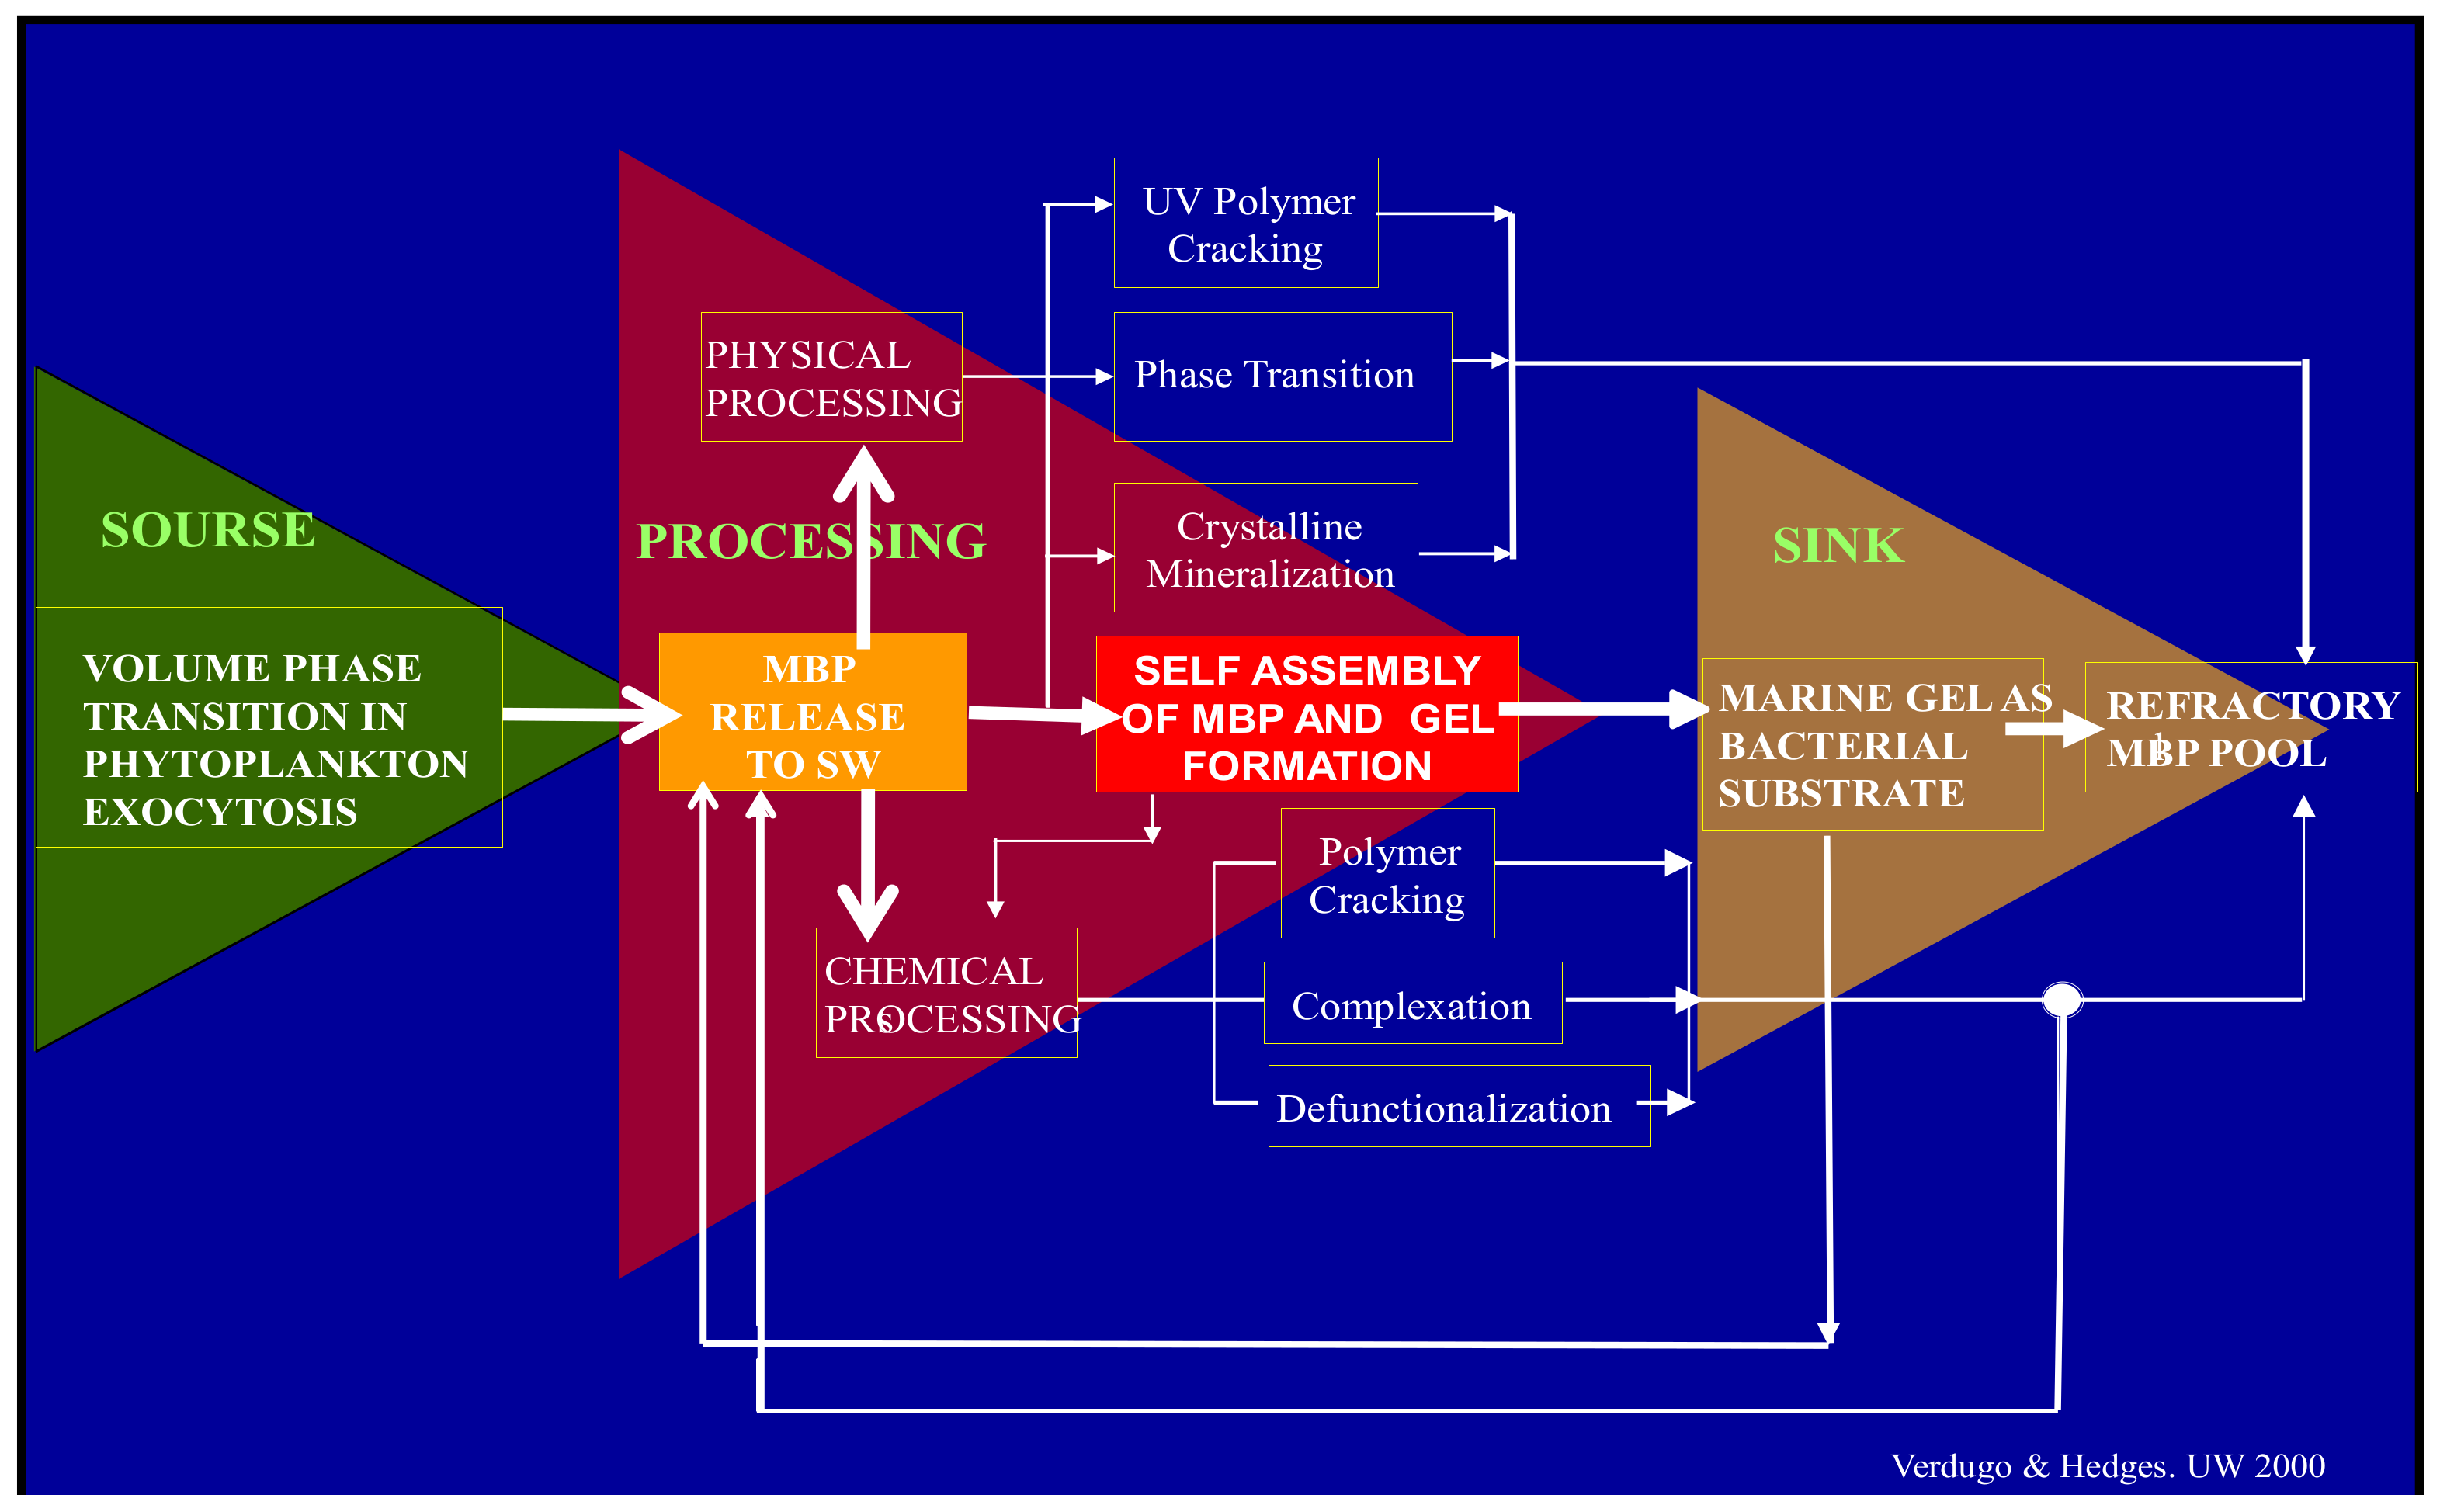
Figure 1.
Before their release to SW, MBP are held inside phytoplankton secretory granules. They are gels stored in a condensed phase inside the cell. Upon export from the cell by exocytosis they undergo typical polymer gel phase transition to solvated phase with massive swelling. They are finally released as loosely woven physical hydrogels. Once discharged to SW, MBP can separate, disperse broadly to join the dissolved organic matter (DOM) pool. While in the DOM pool, MBP can undergo multiple physical or chemical processes. Among those, self-assembly is the one that results in the formation of MGs. Marine gels contain 10
4 more organic material than their MBP dissolved precursors. MG form discrete patches of concentrated substrate that bacterial enzymes can readily cleave [
4]. While cleaved residues <600 D can be readily incorporated and metabolized by marine bacteria (MB) and thereby enter the food chain to higher trophic levels, larger cleaved residues can reenter self-assembly. However, enzymatic cleavage also leaves behind a stock of residues too large to be incorporated and metabolized by bacteria but too small to self-assemble. These leftovers from bacterial enzyme cleavage are likely to join the refractory organic stock found in the ocean. Implicit in this model is the hypothesis that MG is necessary and perhaps sufficient to drive the global flux of carbon up the food web with ramifications that scale to global cycles of marine bioactive elements.
![Gels 07 00136 g001]()
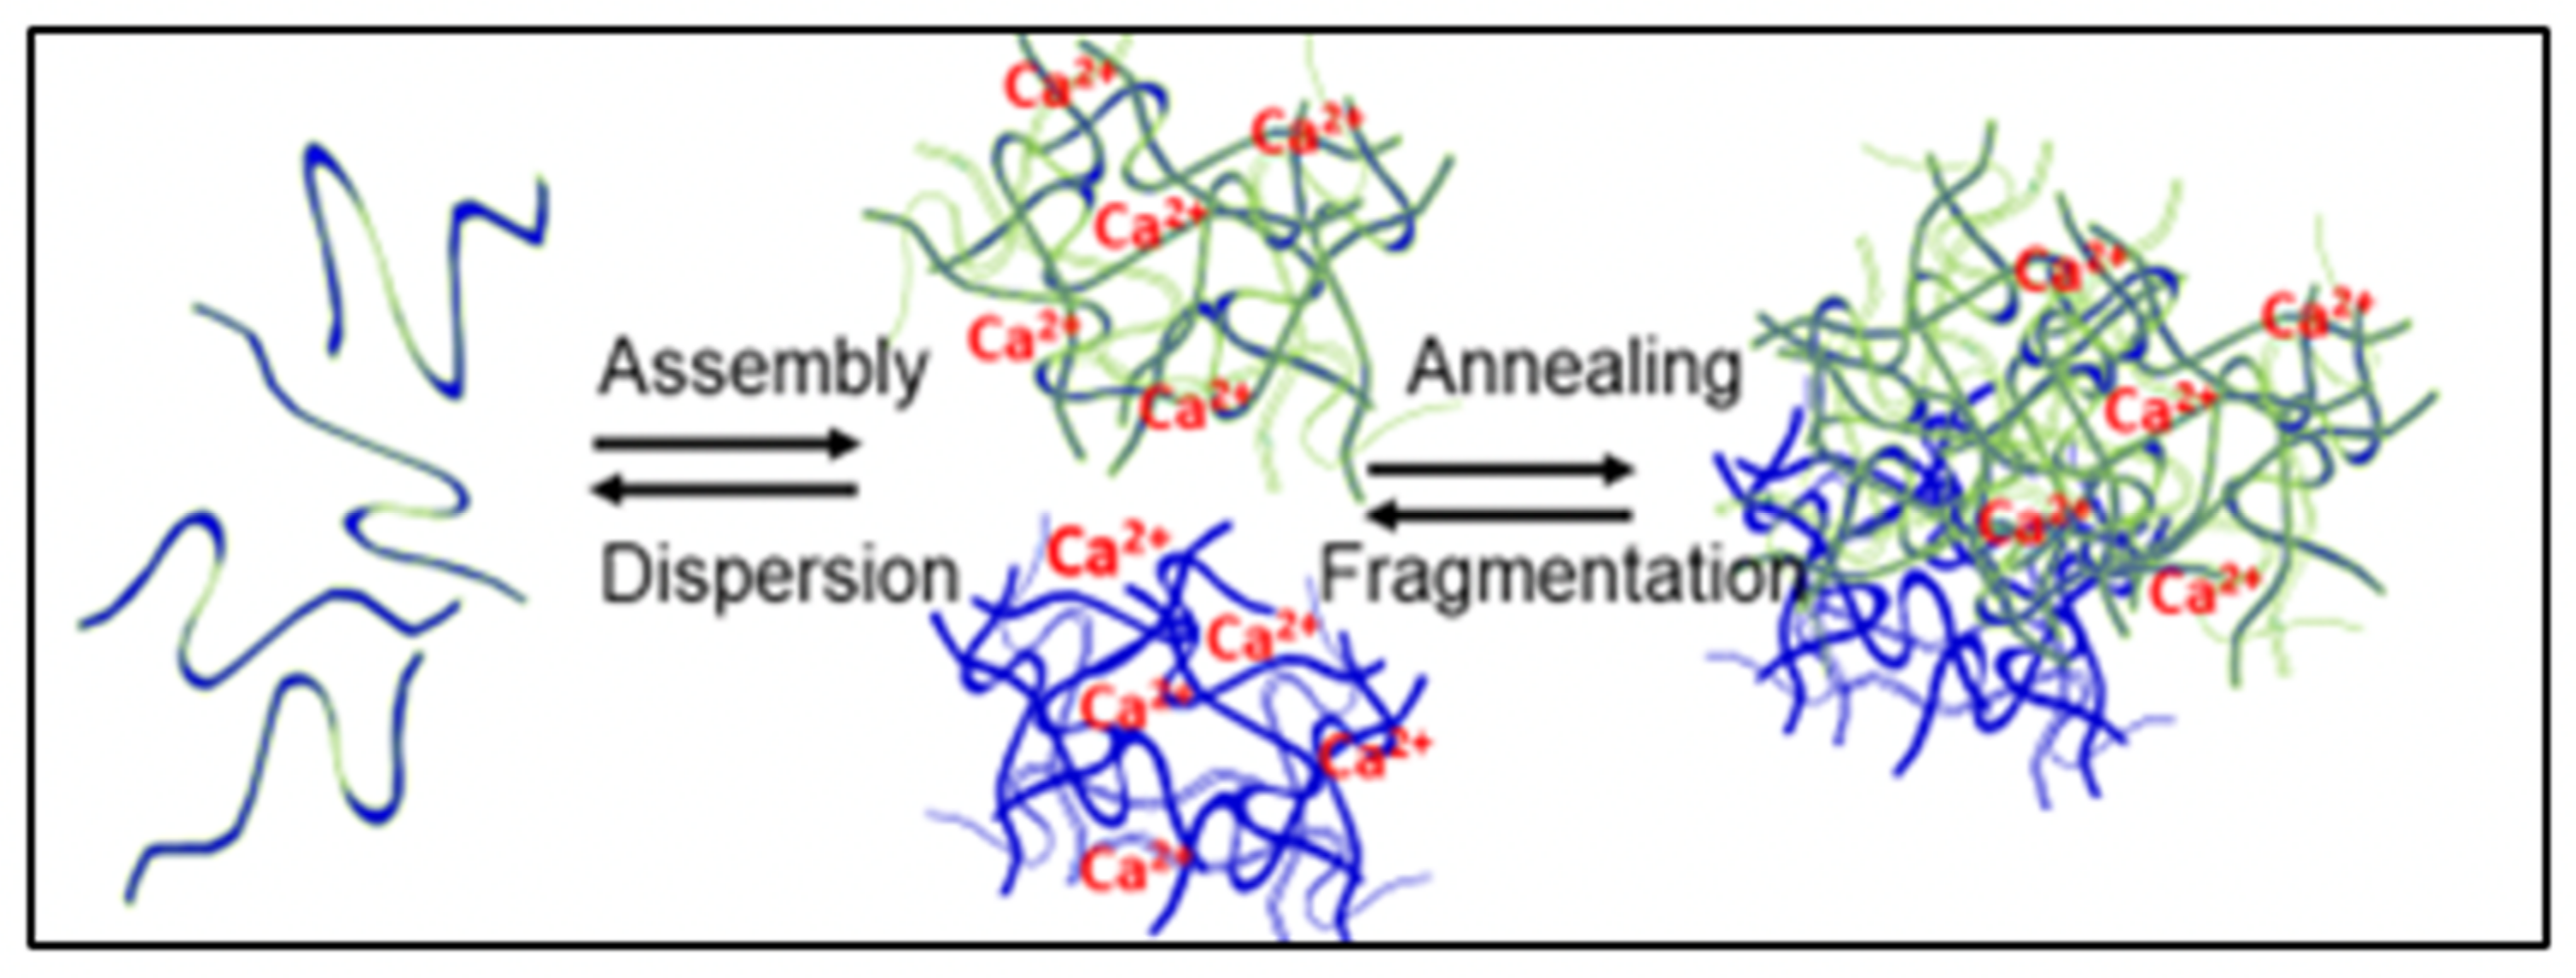
Figure 2.
In MG formation are two equilibrium constants: one representing the reversible mass transfer between free polymers and nano-assembled networks, and another that report the dynamics of reversible interconnection resulting from reptation and interpenetration of polymers that result in the formation of MG [
2].
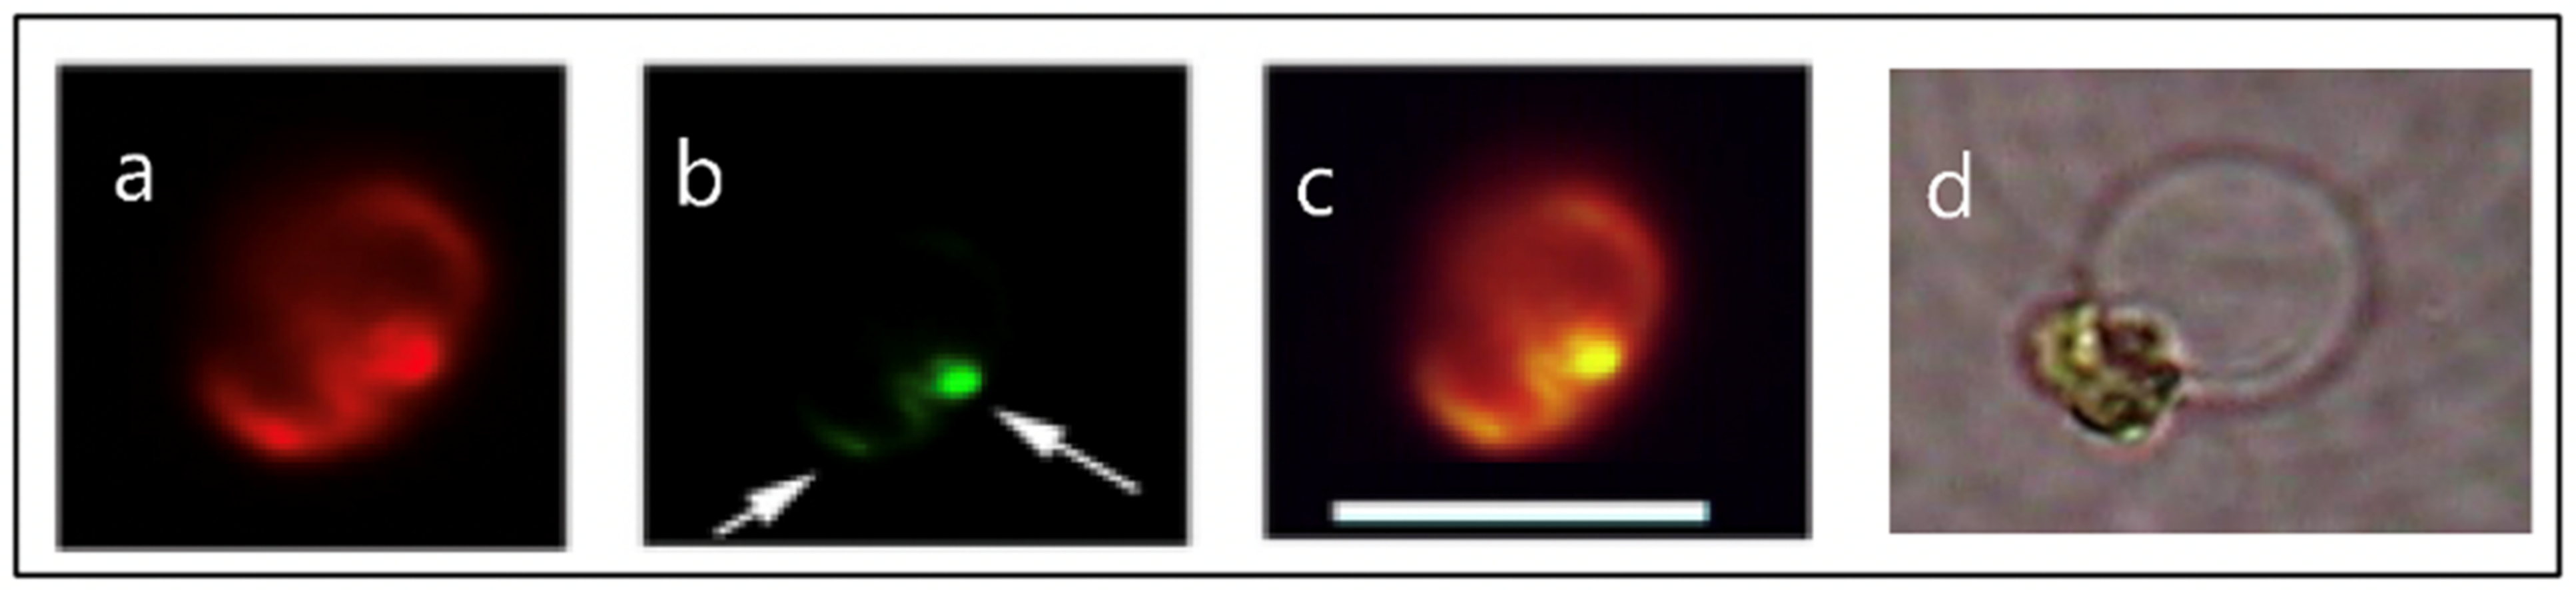
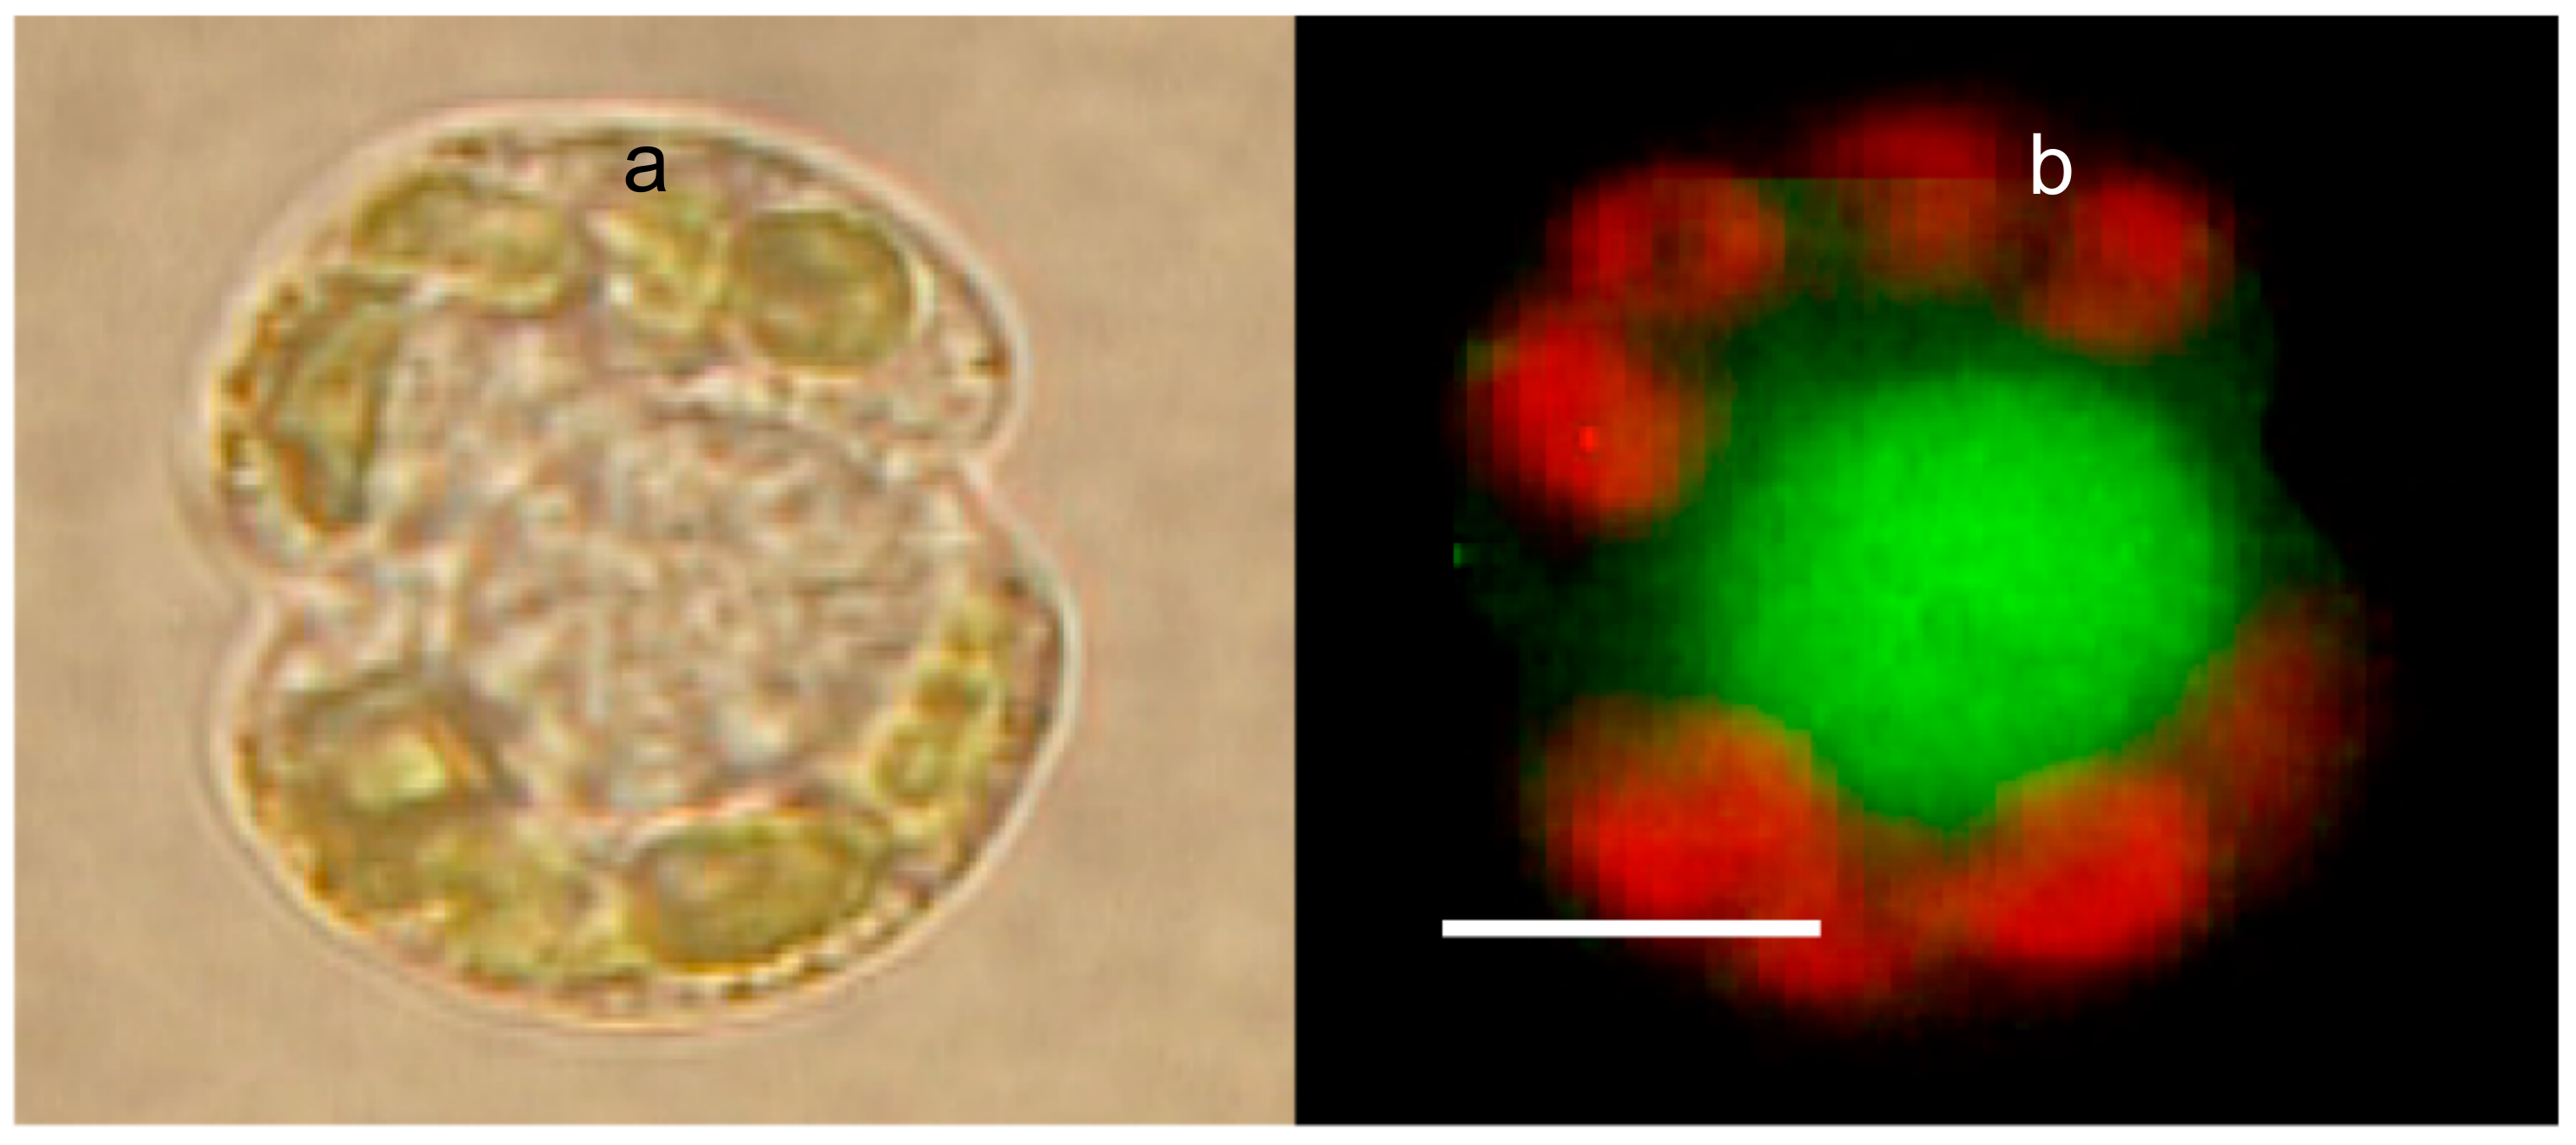
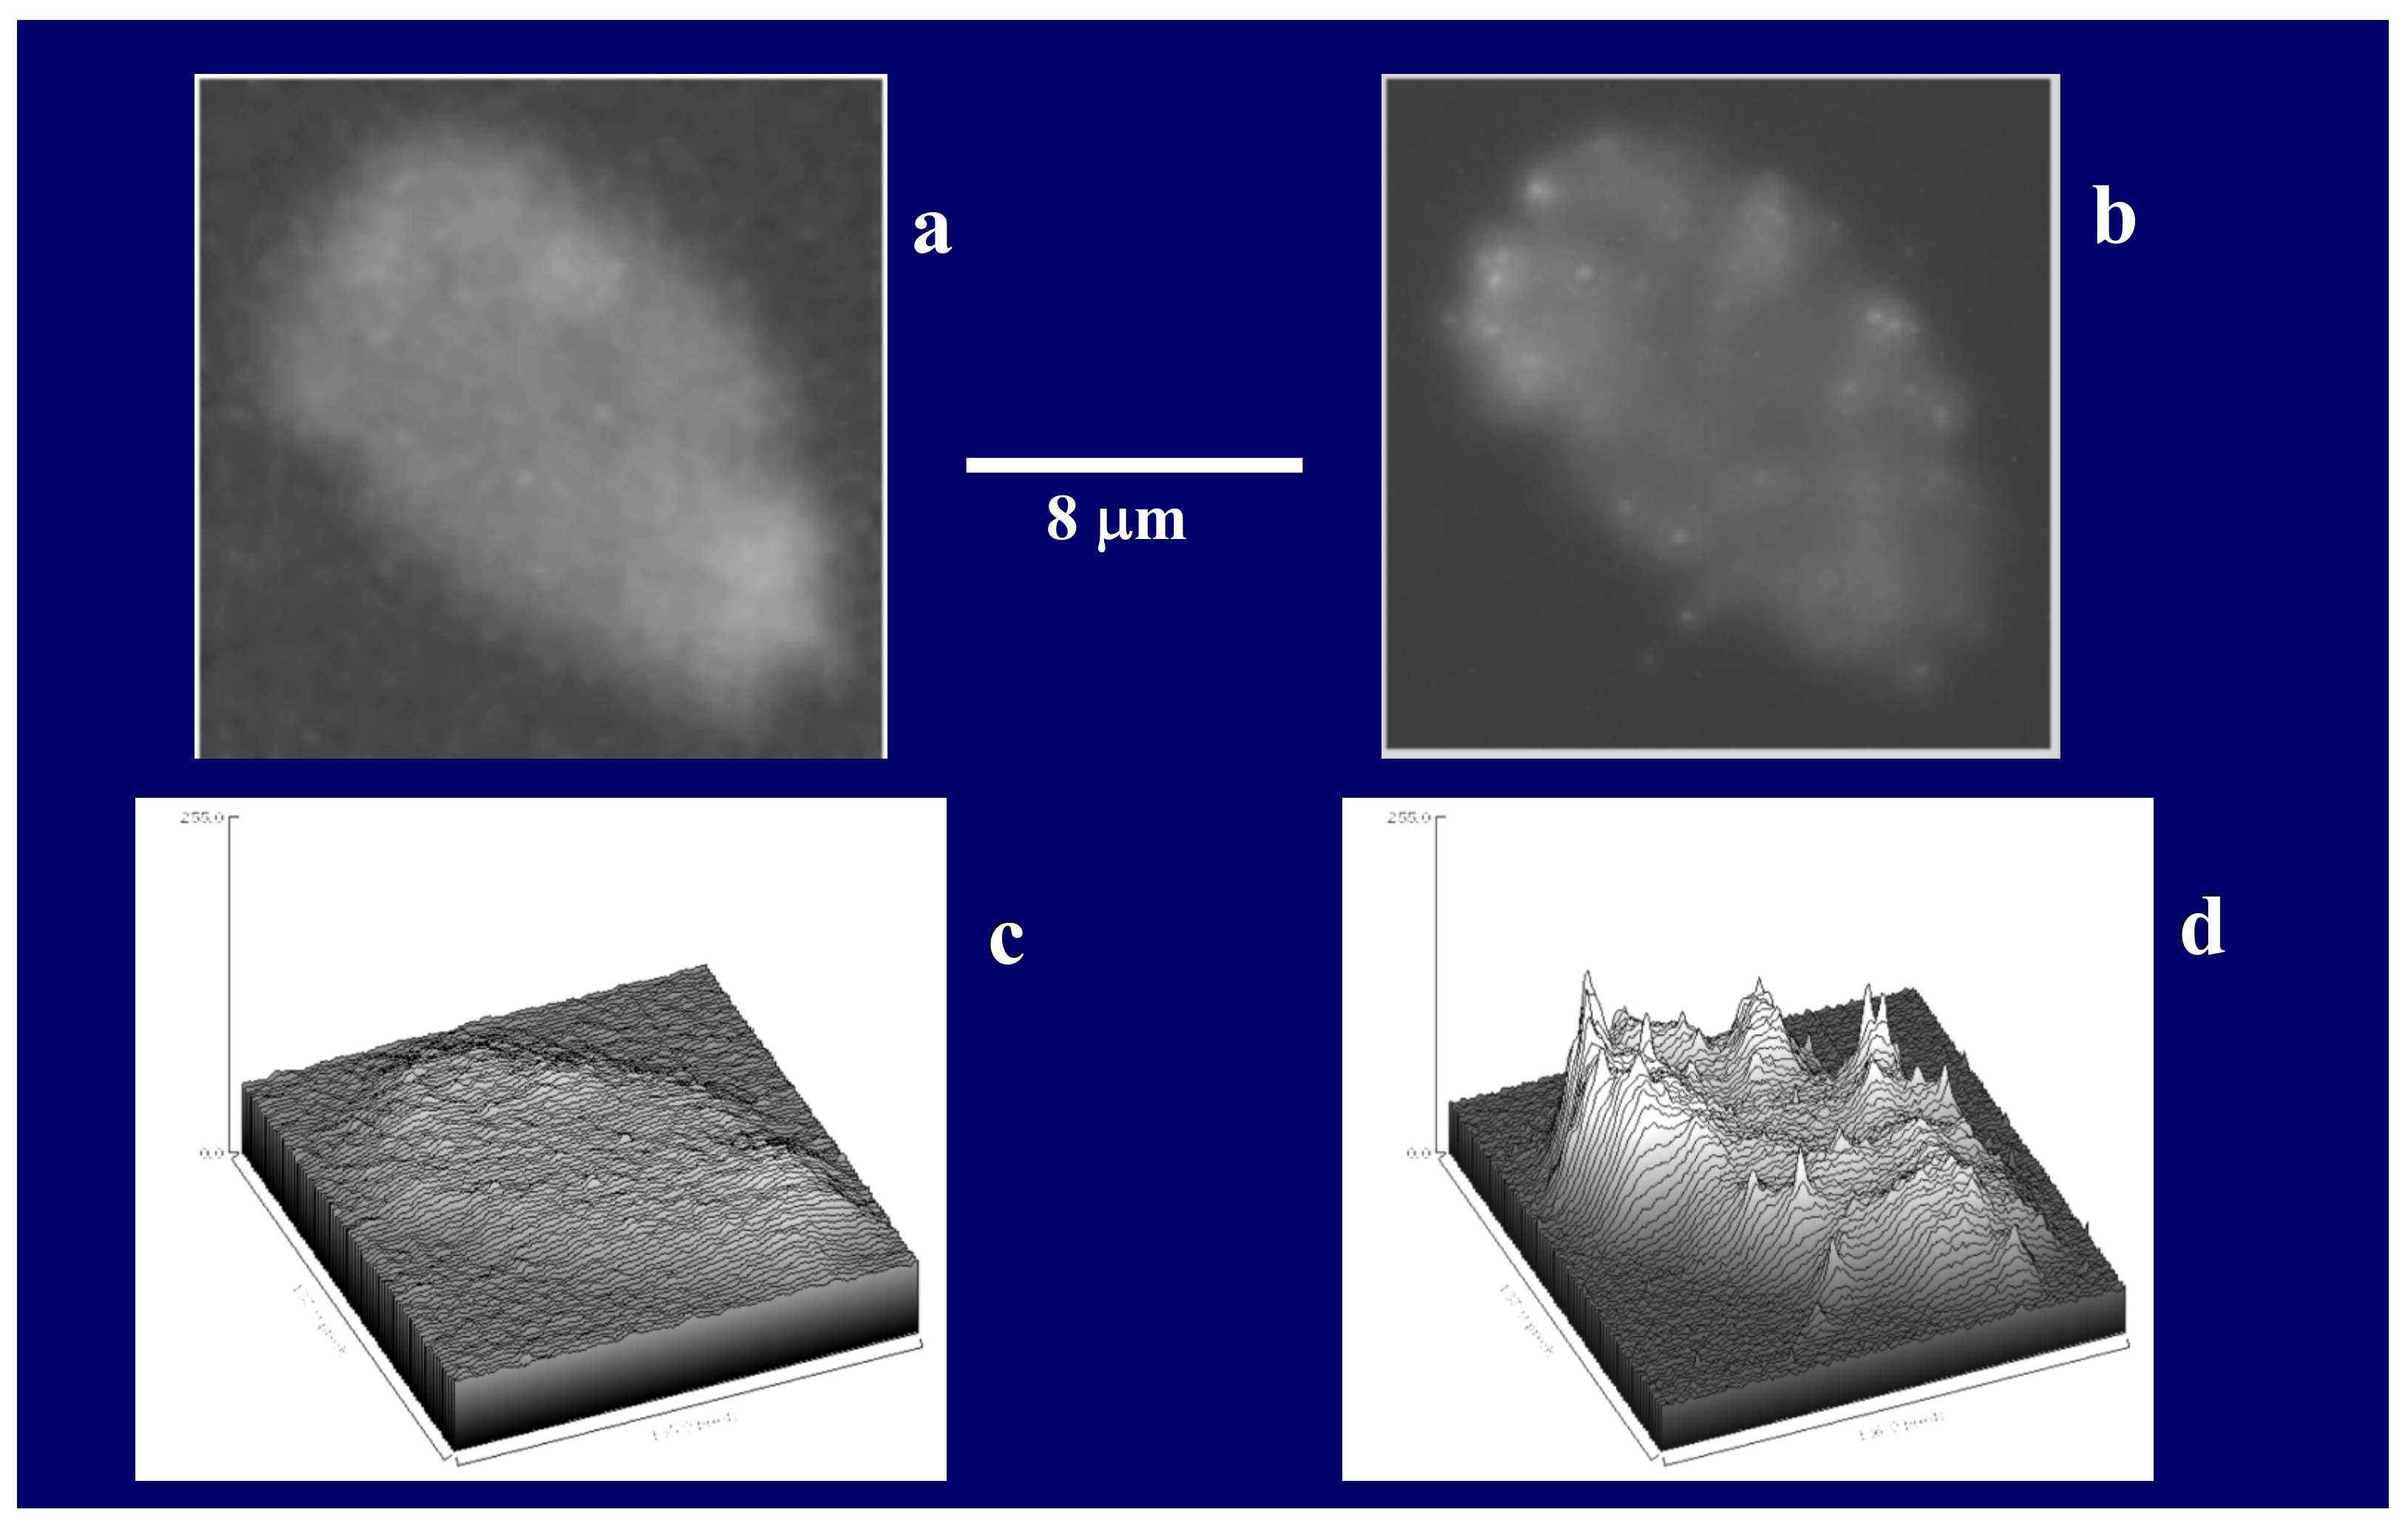
Figure 3.
Fluorescence images of Phaeocystis globosa taken with excitation at λex = 494 nm wavelength that induces emission of both chlorophyll in the chloroplast, that fluoresces bright red (Panel a), and of the secretory granules labeled LysoSensor—a probe that binds specifically to secretory granules—that fluoresces in green. The green granules indicated by arrows (Panel b) are almost at the limit of resolution of the optical microscope. A few can be distinguished individually, and most of them—like in this case—are clustered inside the cell. Panel (c) is the merged image of (a) and (b). Depending on [Ca2+] and pH in SW, the dimensions of the swollen exocytosed MBP matrix (Panel d) can vary from ~3–12 μm. Bar = 8 μm.
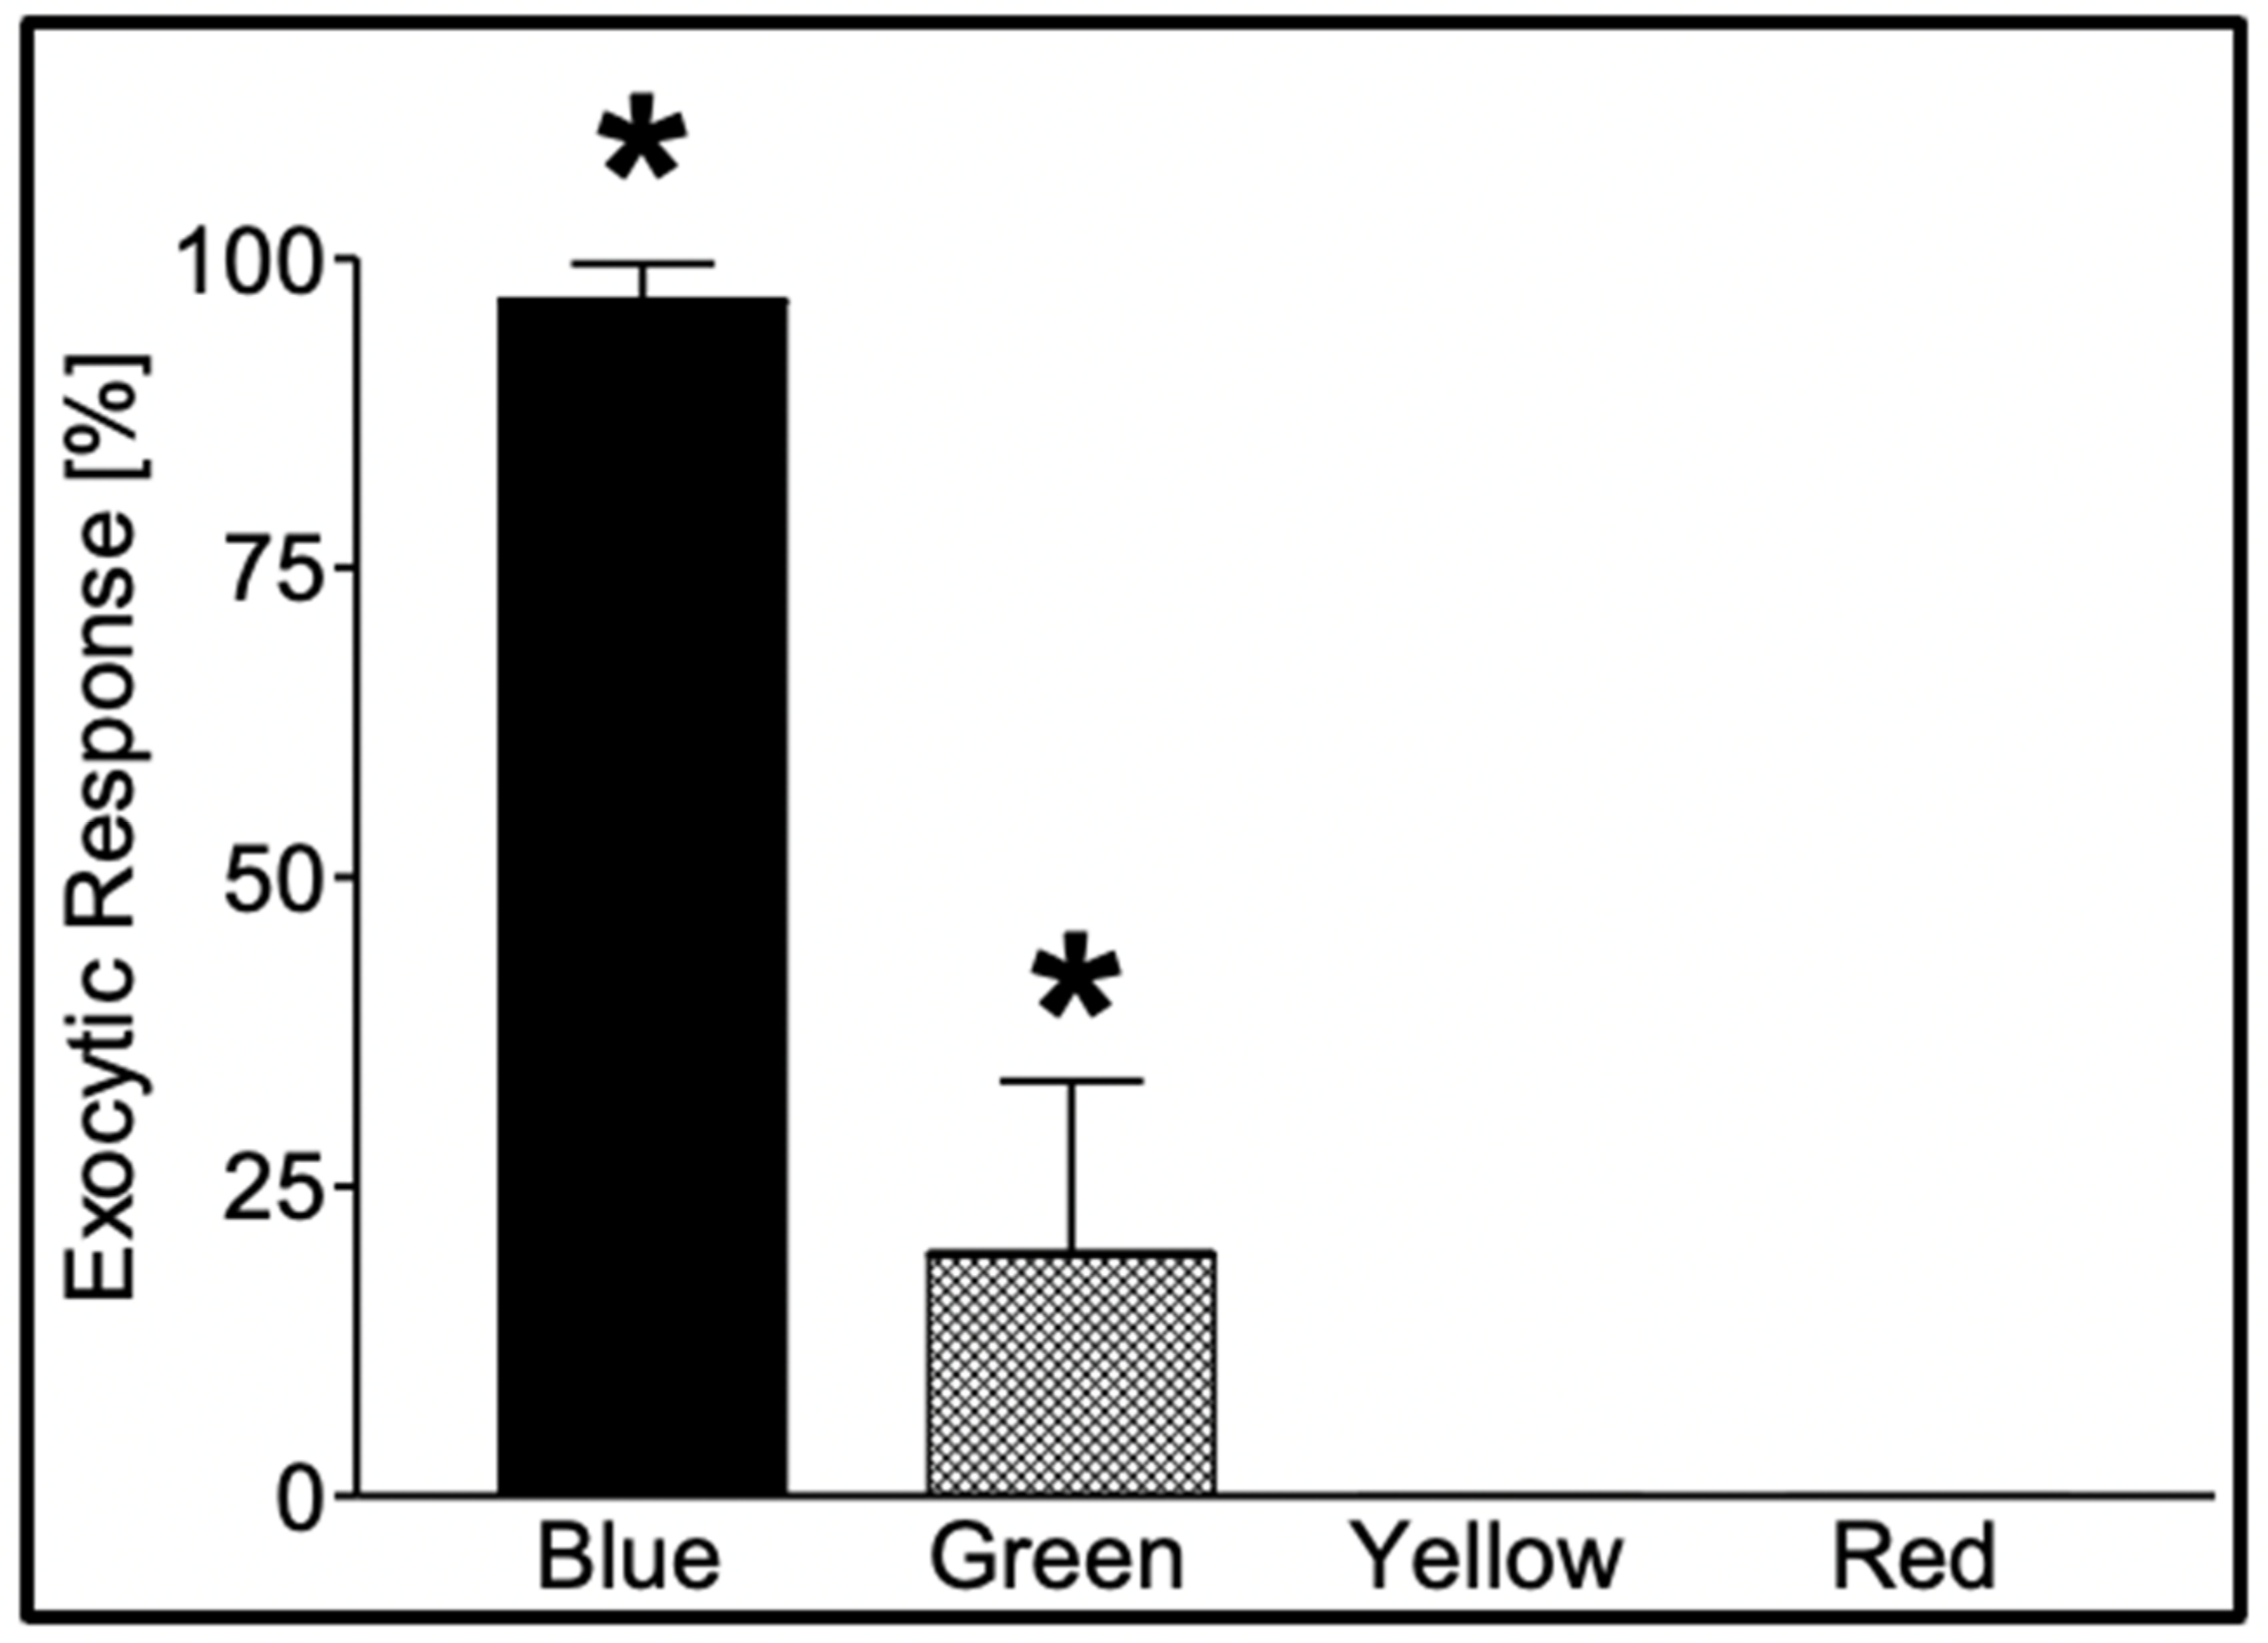
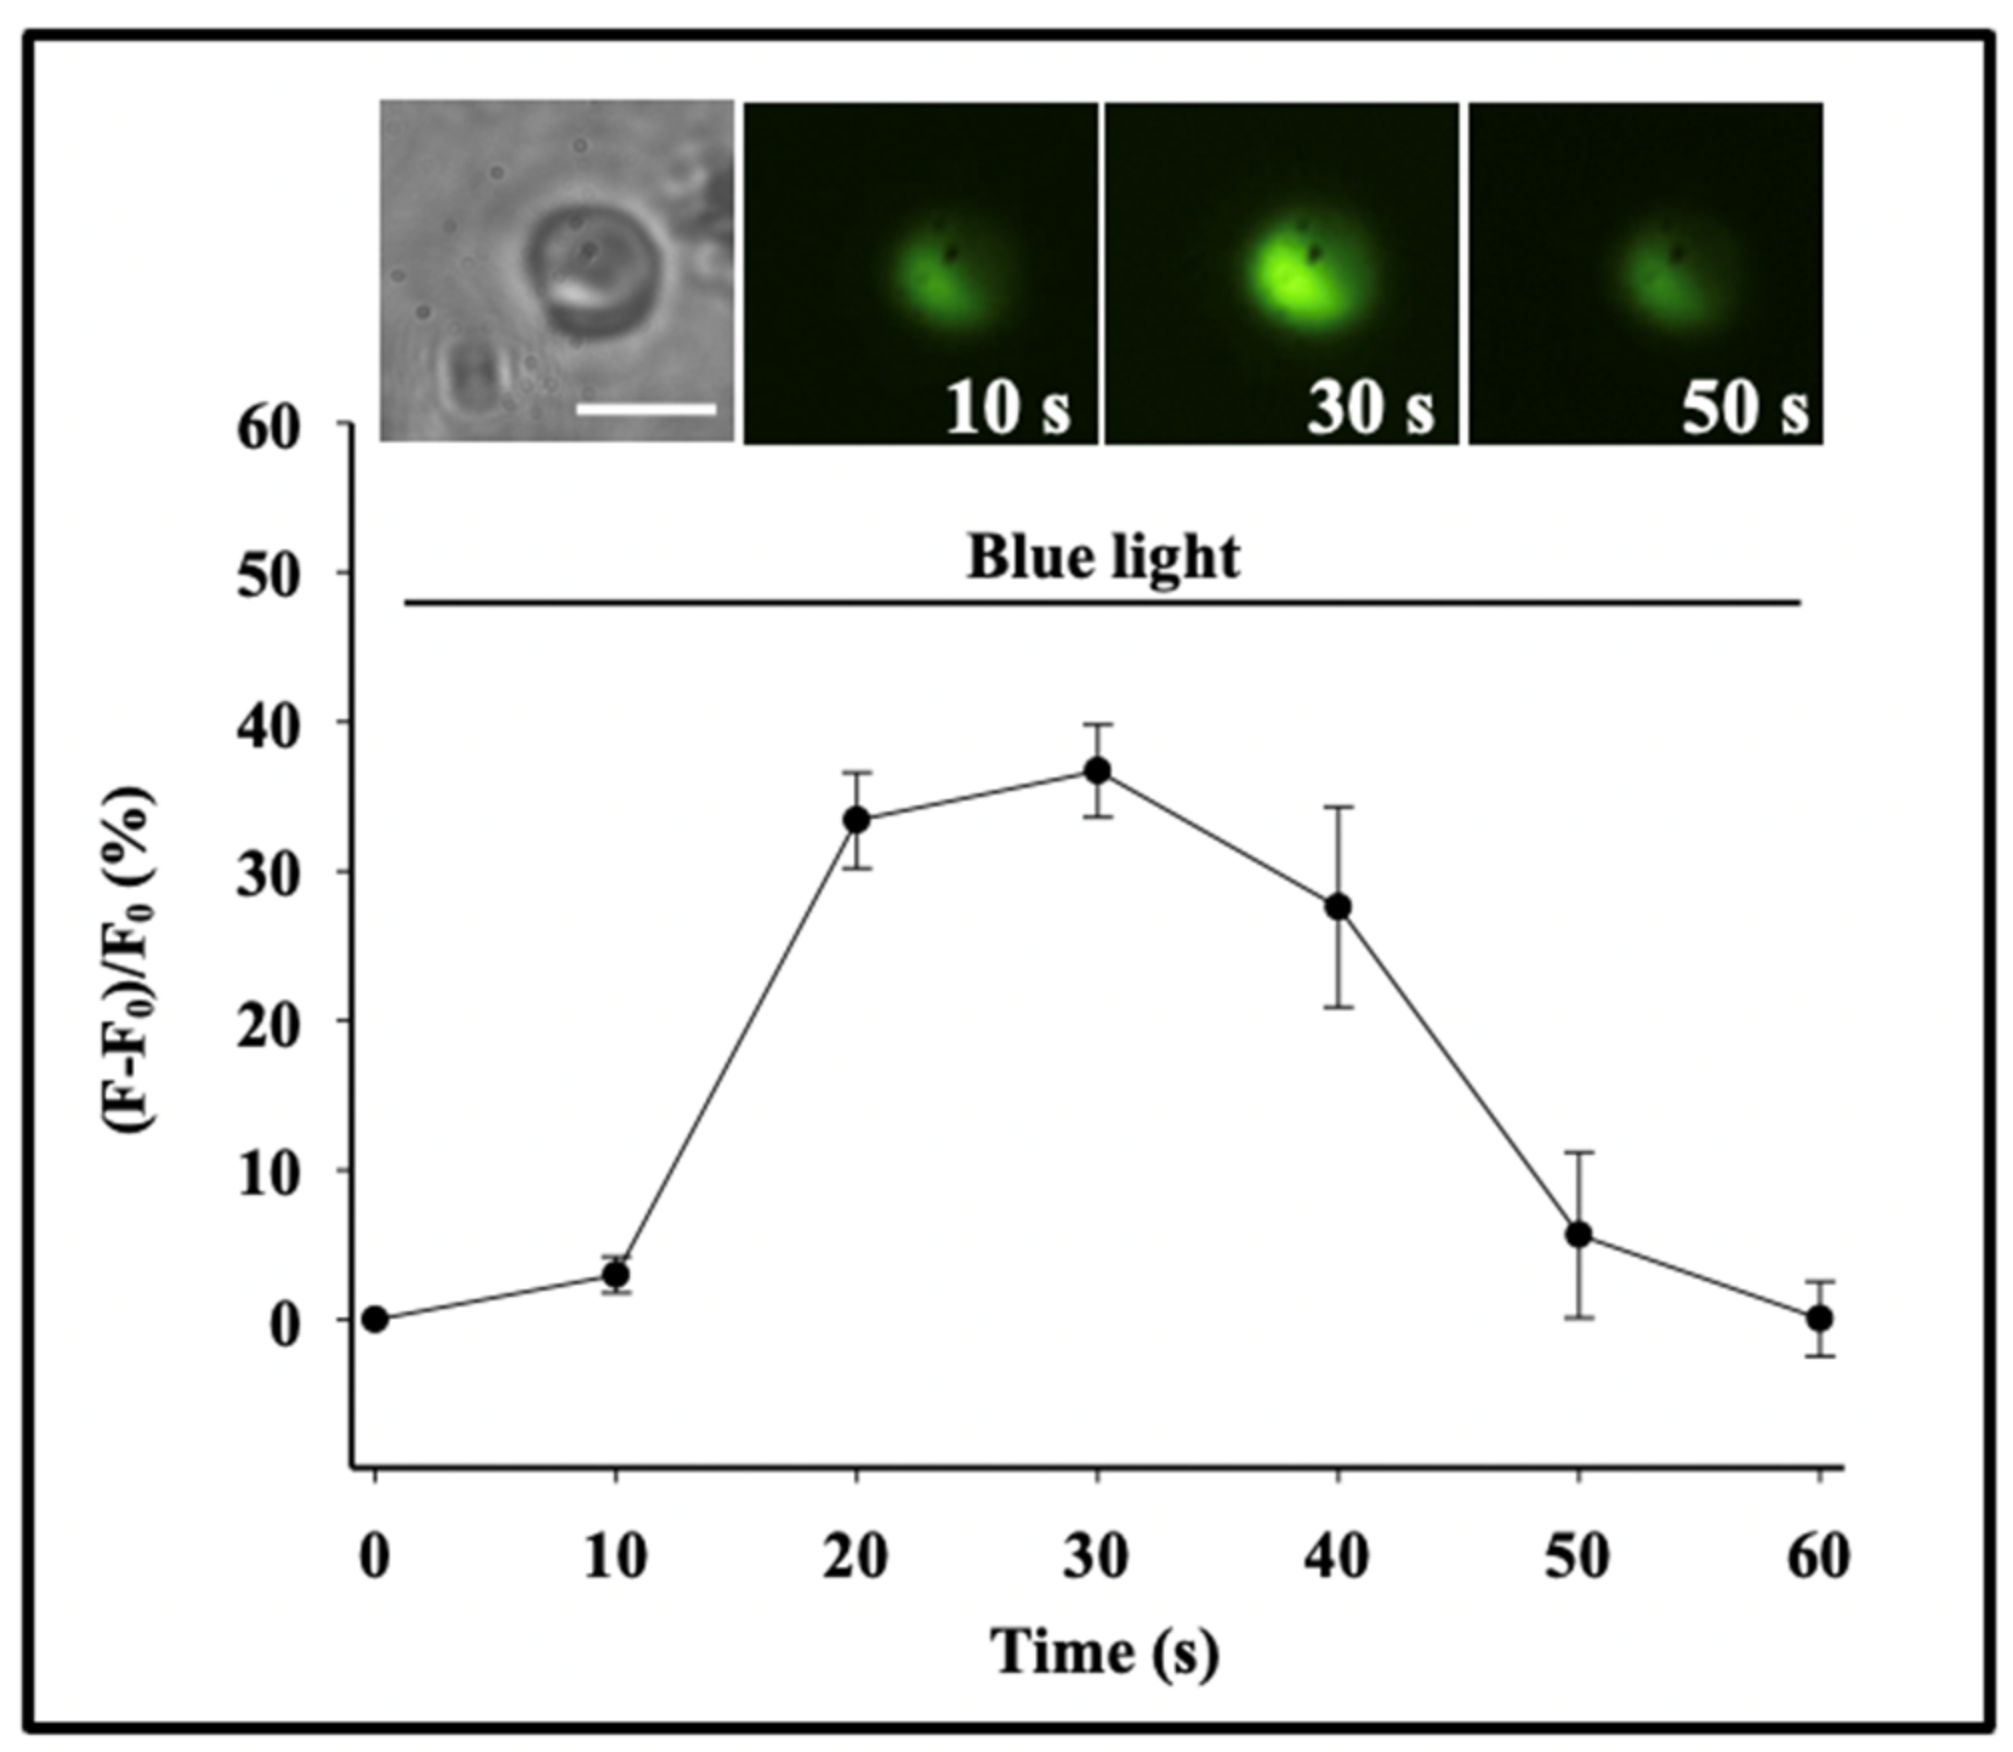
Figure 4.
Secretion in
Phaeocystis responds to specific photo-stimulation. Exposure of
Phaeocystis to a photon flux (*) of 480 μmol m
−2 × s
−1 of blue light (λ = 450–490 nm) for 60 min induced secretion in 97 ± 2.9% of the cells, while similar exposure (*) to green light (λ = 500–540 nm) resulted in secretion in only 20 ± 14% of the cells. Exposure to equal time/fluxes of yellow (λ = 560–600 nm) and red (λ = 640–720 nm) light fails to induce secretion. Bars correspond to the mean ± SEM of five measurements [
17].
Figure 5.
A characteristic transient increase of intracellular [Ca
2+]
C takes place following stimulation in
Phaeocystis [
20]. We studied Ca
2+-signaling in photostimulated
Phaeocystis by using the membrane-permeant fluorescent Ca
2+ probe Fluo 4-AM. As shown here, exposure of
Phaeocystis to blue light stimulation (λ = 450–490 nm) results in a transient increase of intracellular [Ca
2+]
C reported by a corresponding increase of fluorescence expressed as the ratio of emission before and after stimulation. This typical increase of [Ca
2+]
C was consistently followed by exocytosis and release of MBP stored in the secretory granule. Each point corresponds to the mean ± SEM of nine measurements. Bar = 10 μm.
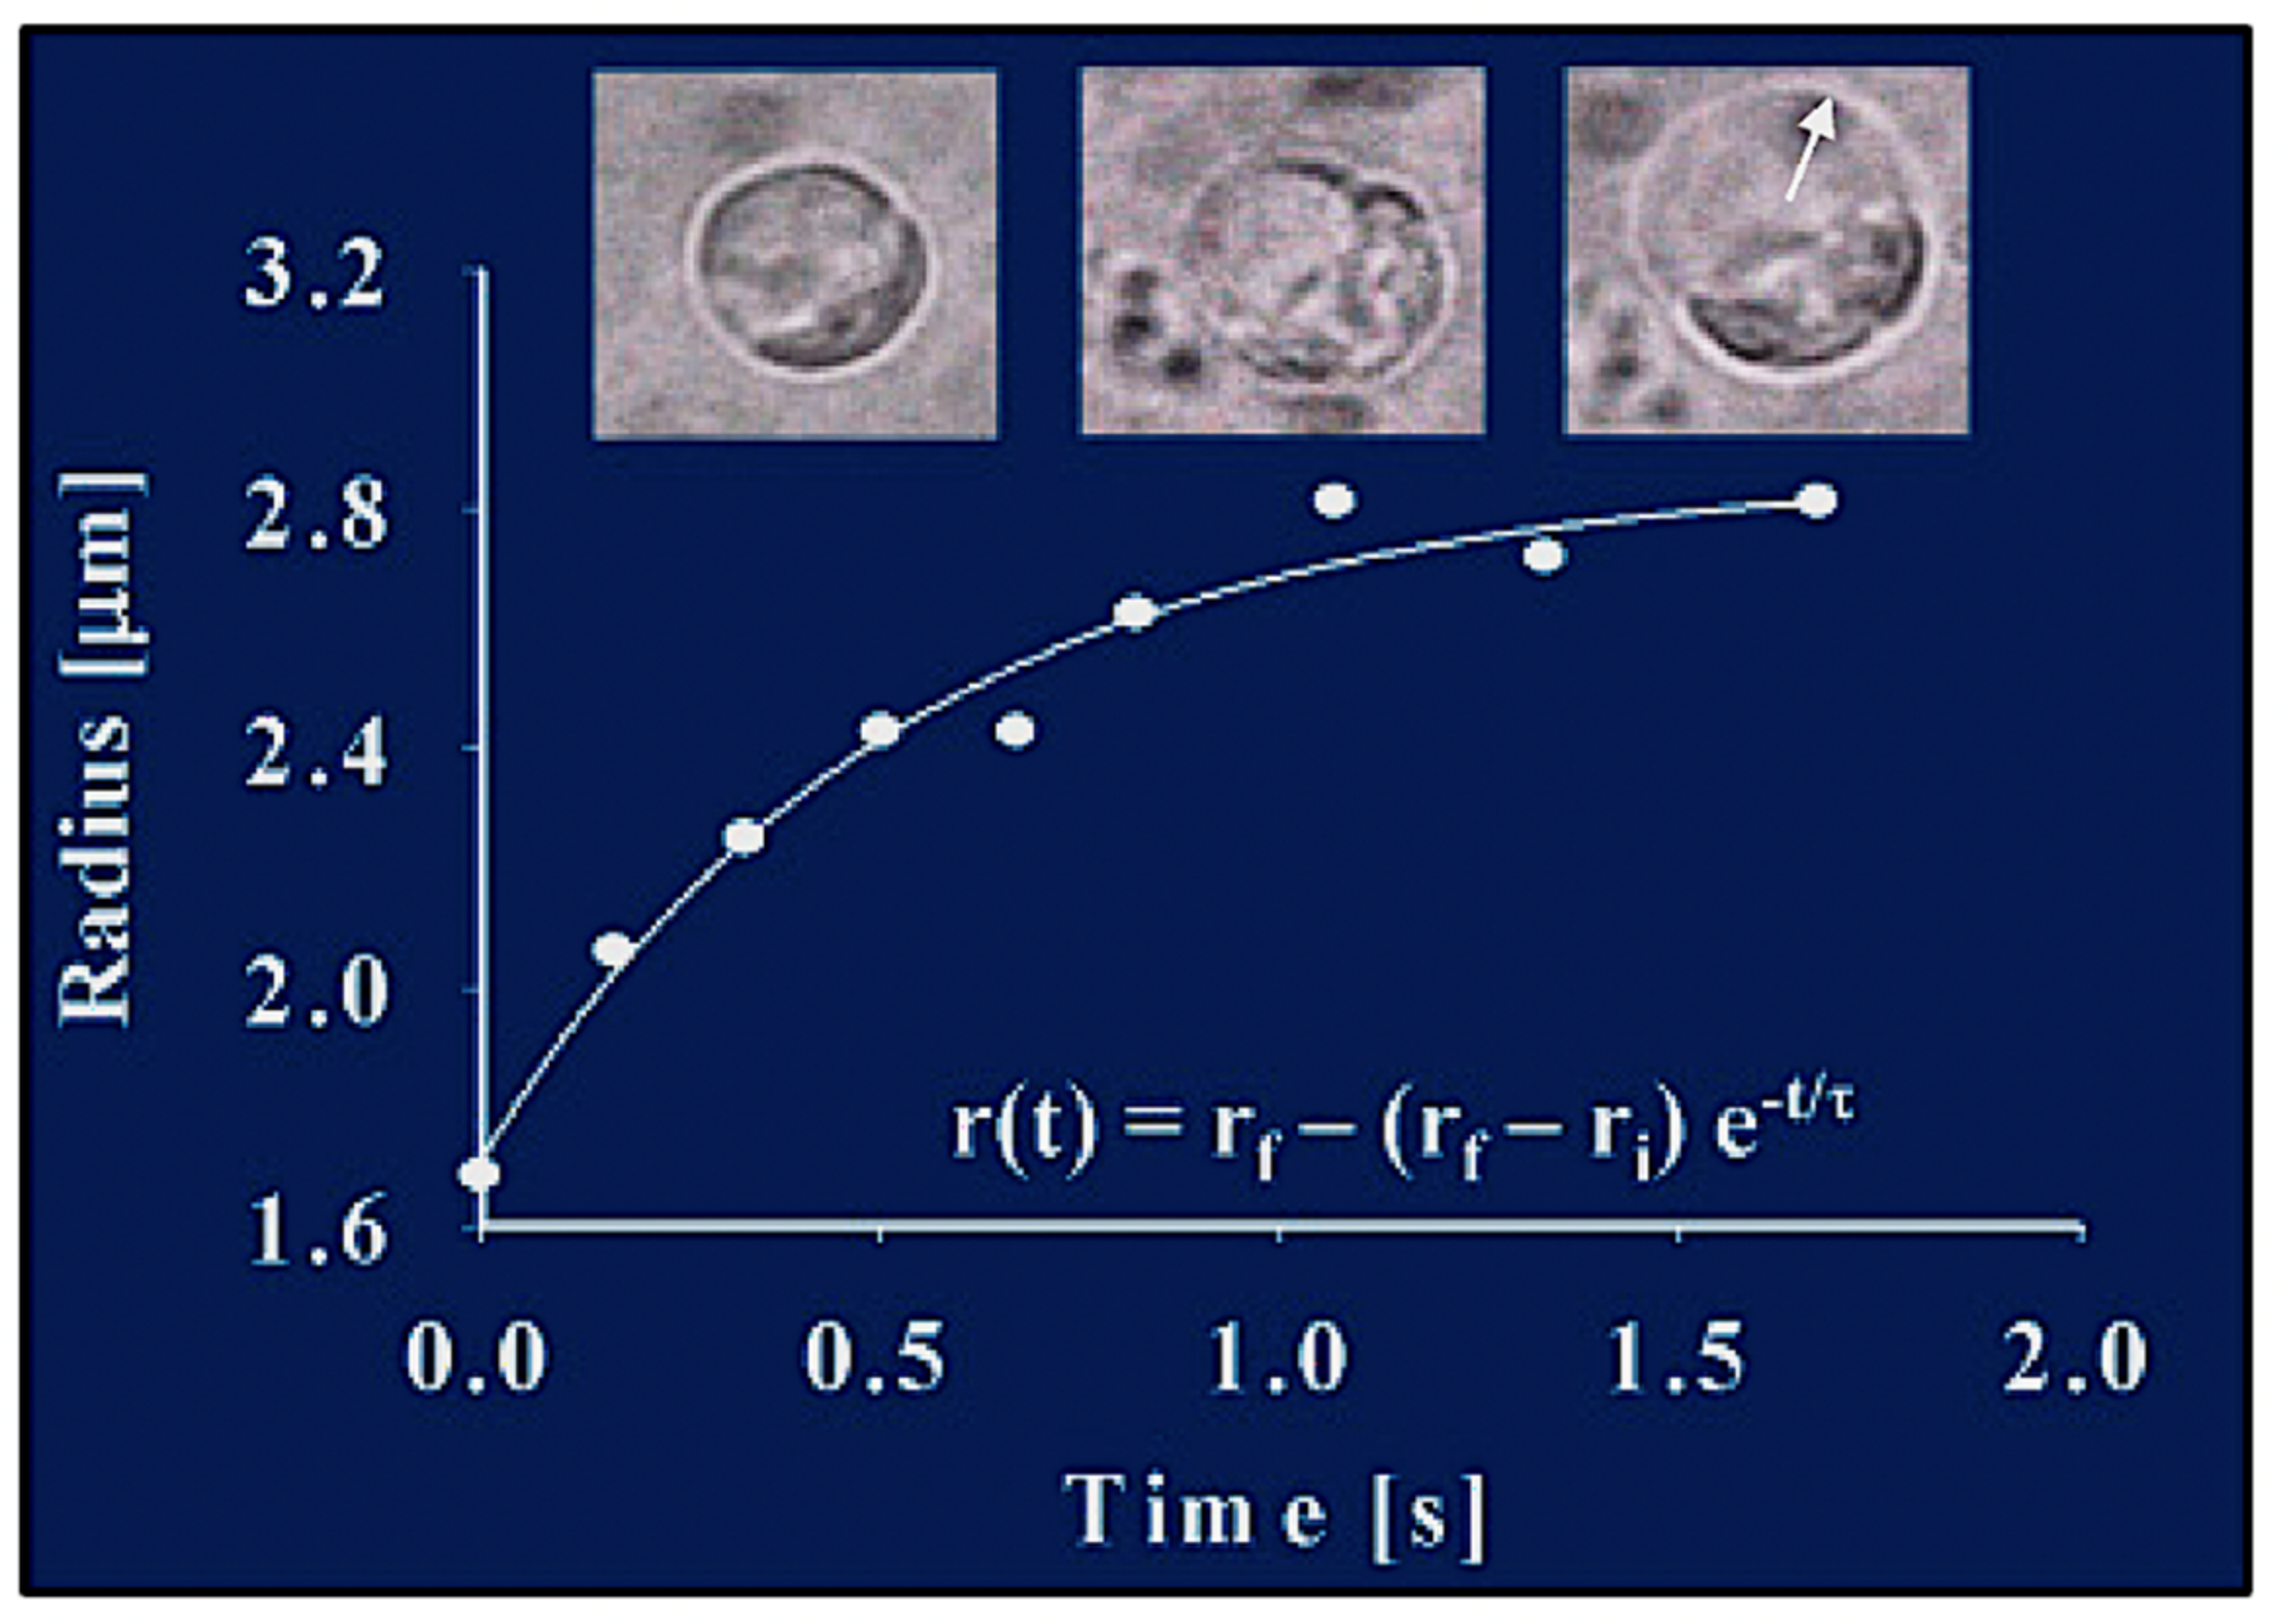
Figure 6.
The radial expansion (arrow) of the exocytosed granules follows characteristic first-order kinetics, lending the process to be formalized and evaluated in light of Tanaka’s theory of swelling of polymer gels [
27]. This figure illustrates images of video recording of exocytosis in a
Phaecystis cell captured at 30 fields × s
−1. Measurements conducted by digitizing video microscopic images show that, during product release, the radius of the secreted polymer gel increases following first-order kinetics. The continuous line is a non-linear least-square fitting of the data points to r(t) = r
f − (r
f − r
i)e
−t/τ, where r
i and r
f are the initial and final radius of the granule, and τ is the characteristic relaxation time of swelling.
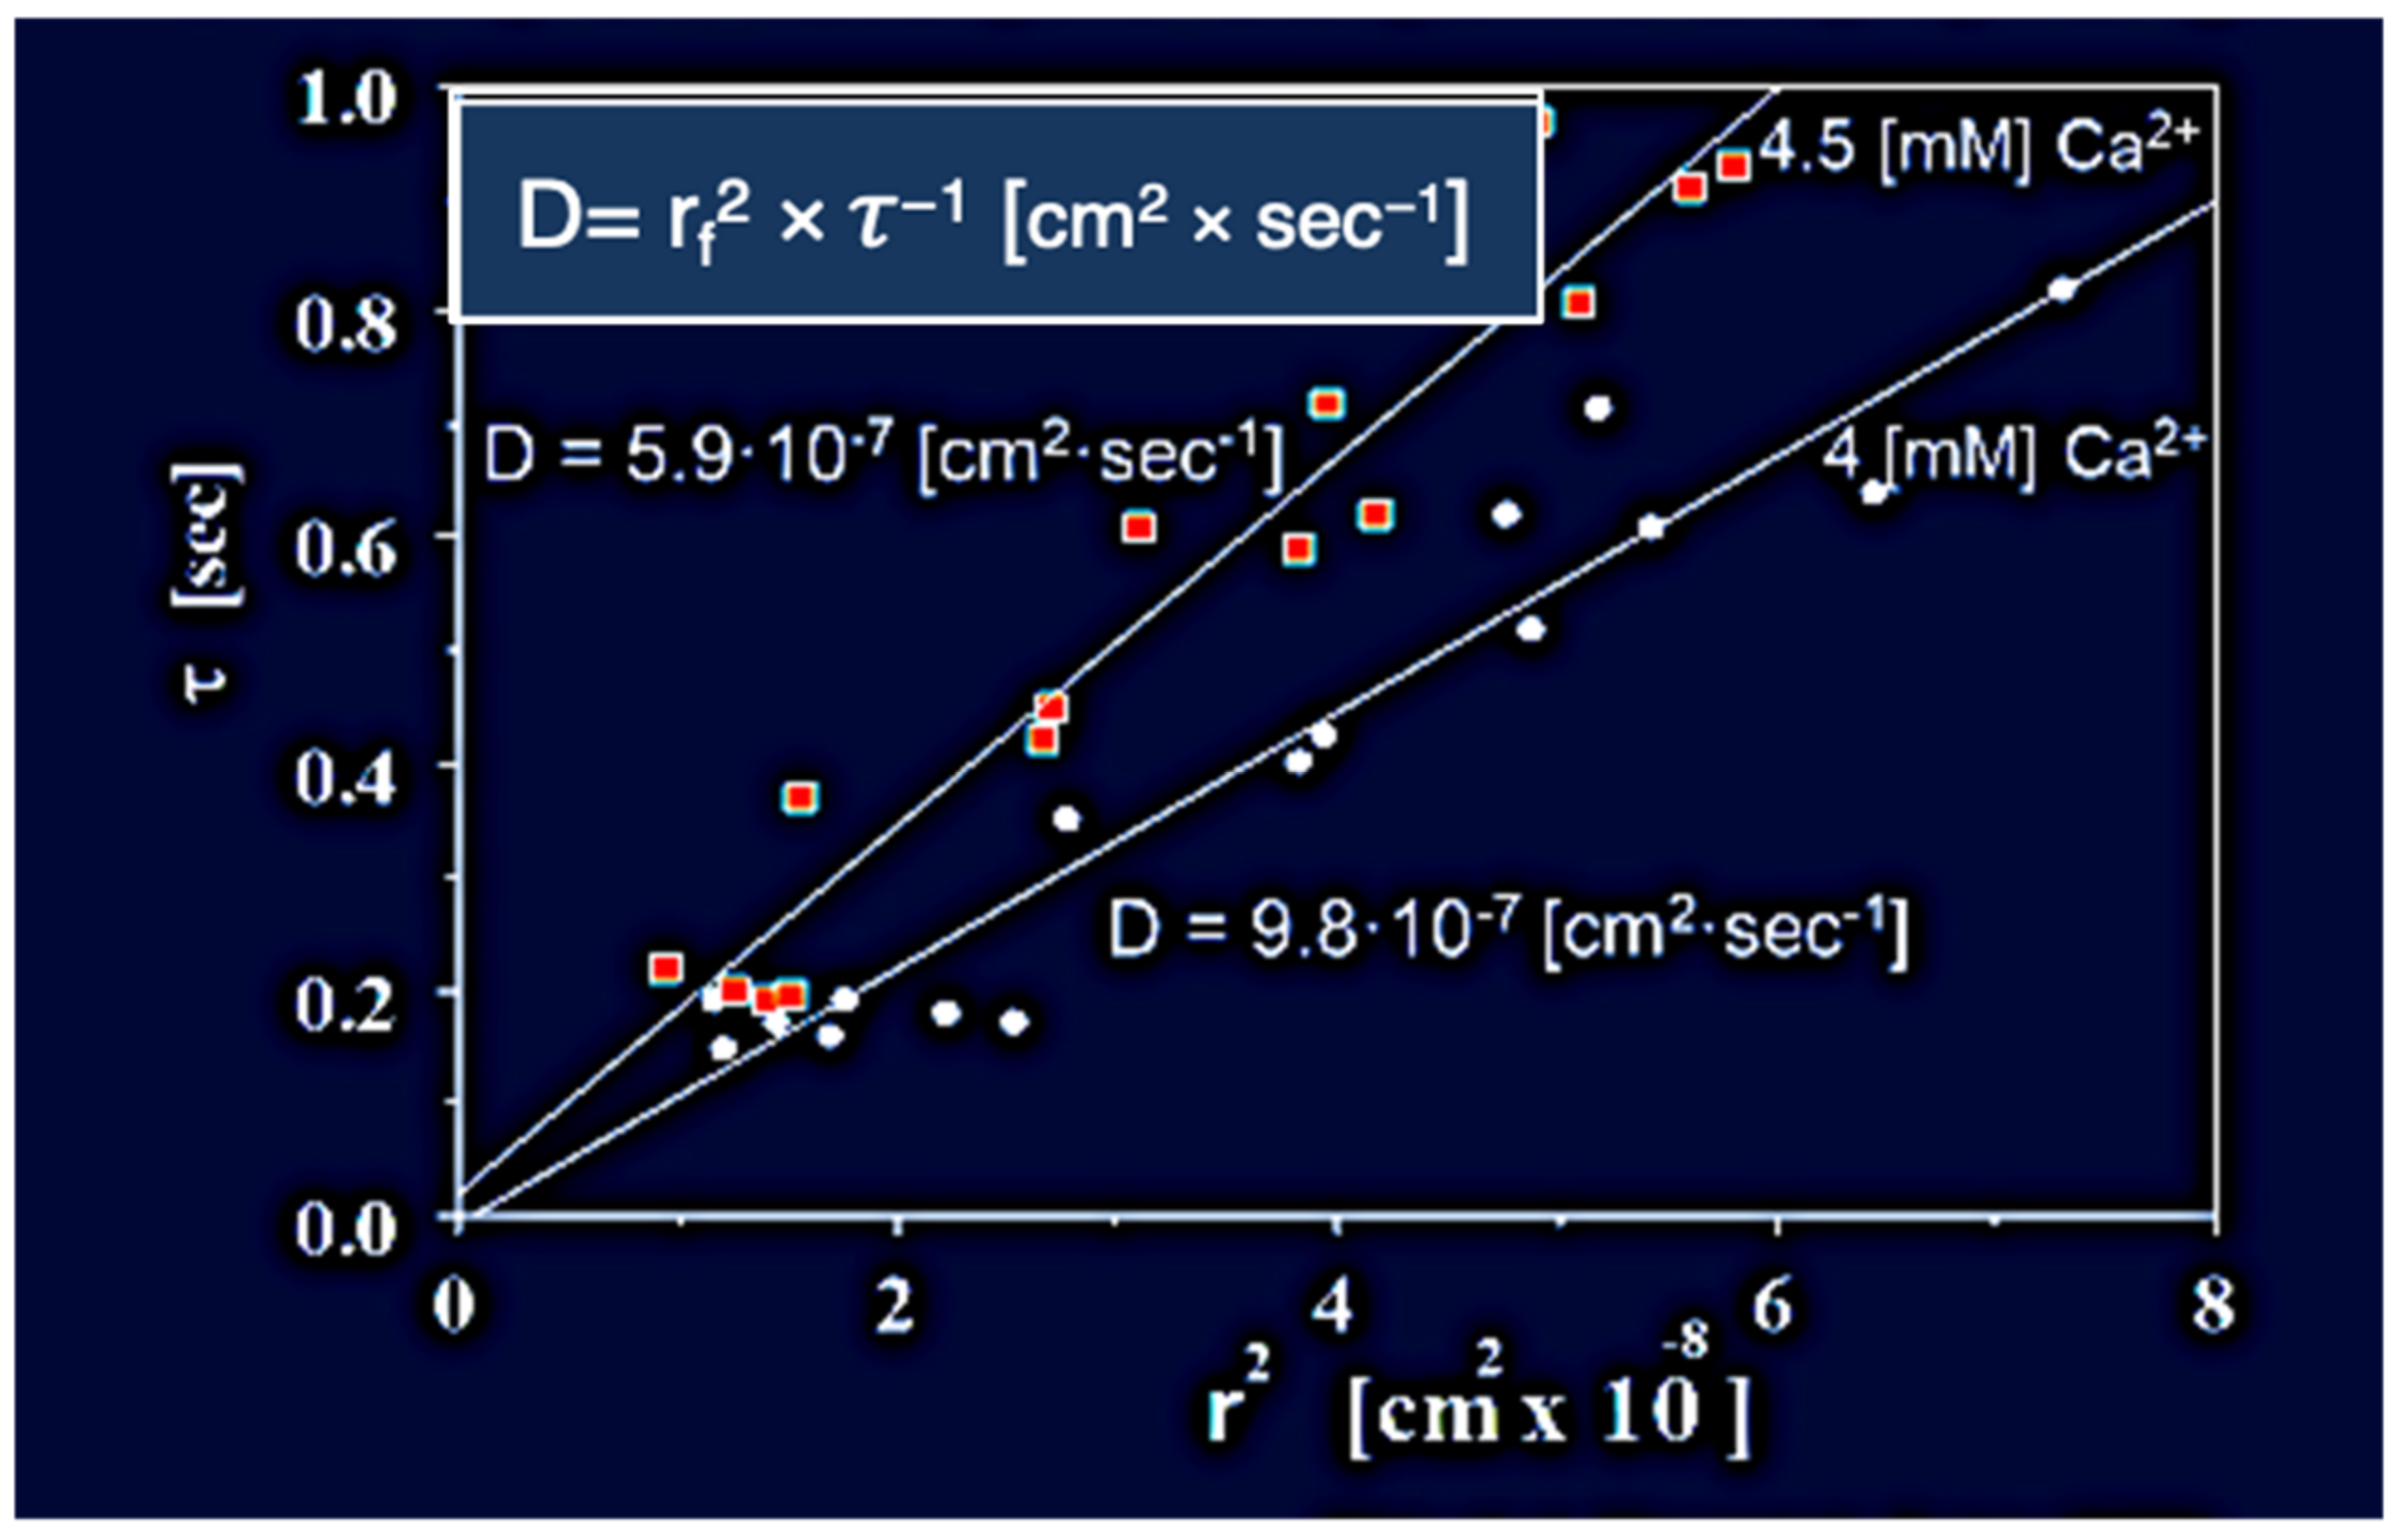
Figure 7.
In here,
Phaeocystis was equilibrated in ASW containing 4 mM and 4.5 mM [Ca
2+] at pH 8.2, 20 °C, and stimulated to secrete by exposure to blue (450–490 nm) light. The swelling of exocytosed granules was monitored by video microscopy. In agreement with theory [
25], the relationship between characteristic time (τ) of the swelling kinetics, and the second power of final radius (r
f)
2 of the exocytosed granules exhibit a characteristic linear function with a dimension of cm
2 × s
−1 that represent the diffusivity D = (r
f)
2 × τ
−1 [cm
2 × s
−1] of the exocytosed gel. Counterion concentration affects the diffusivity of exocytosed gels. In here
Phaeocystis slight changes of concentrations of ASW [Ca
2+] from 4 mM to 4.5 mM at pH 8.2, 20 °C, result in a corresponding decrease of D, from 9.8 × 10
−7 [cm
2 × s
−1 ] to 5.91 × 10
−7 [cm
2 × s
−1].
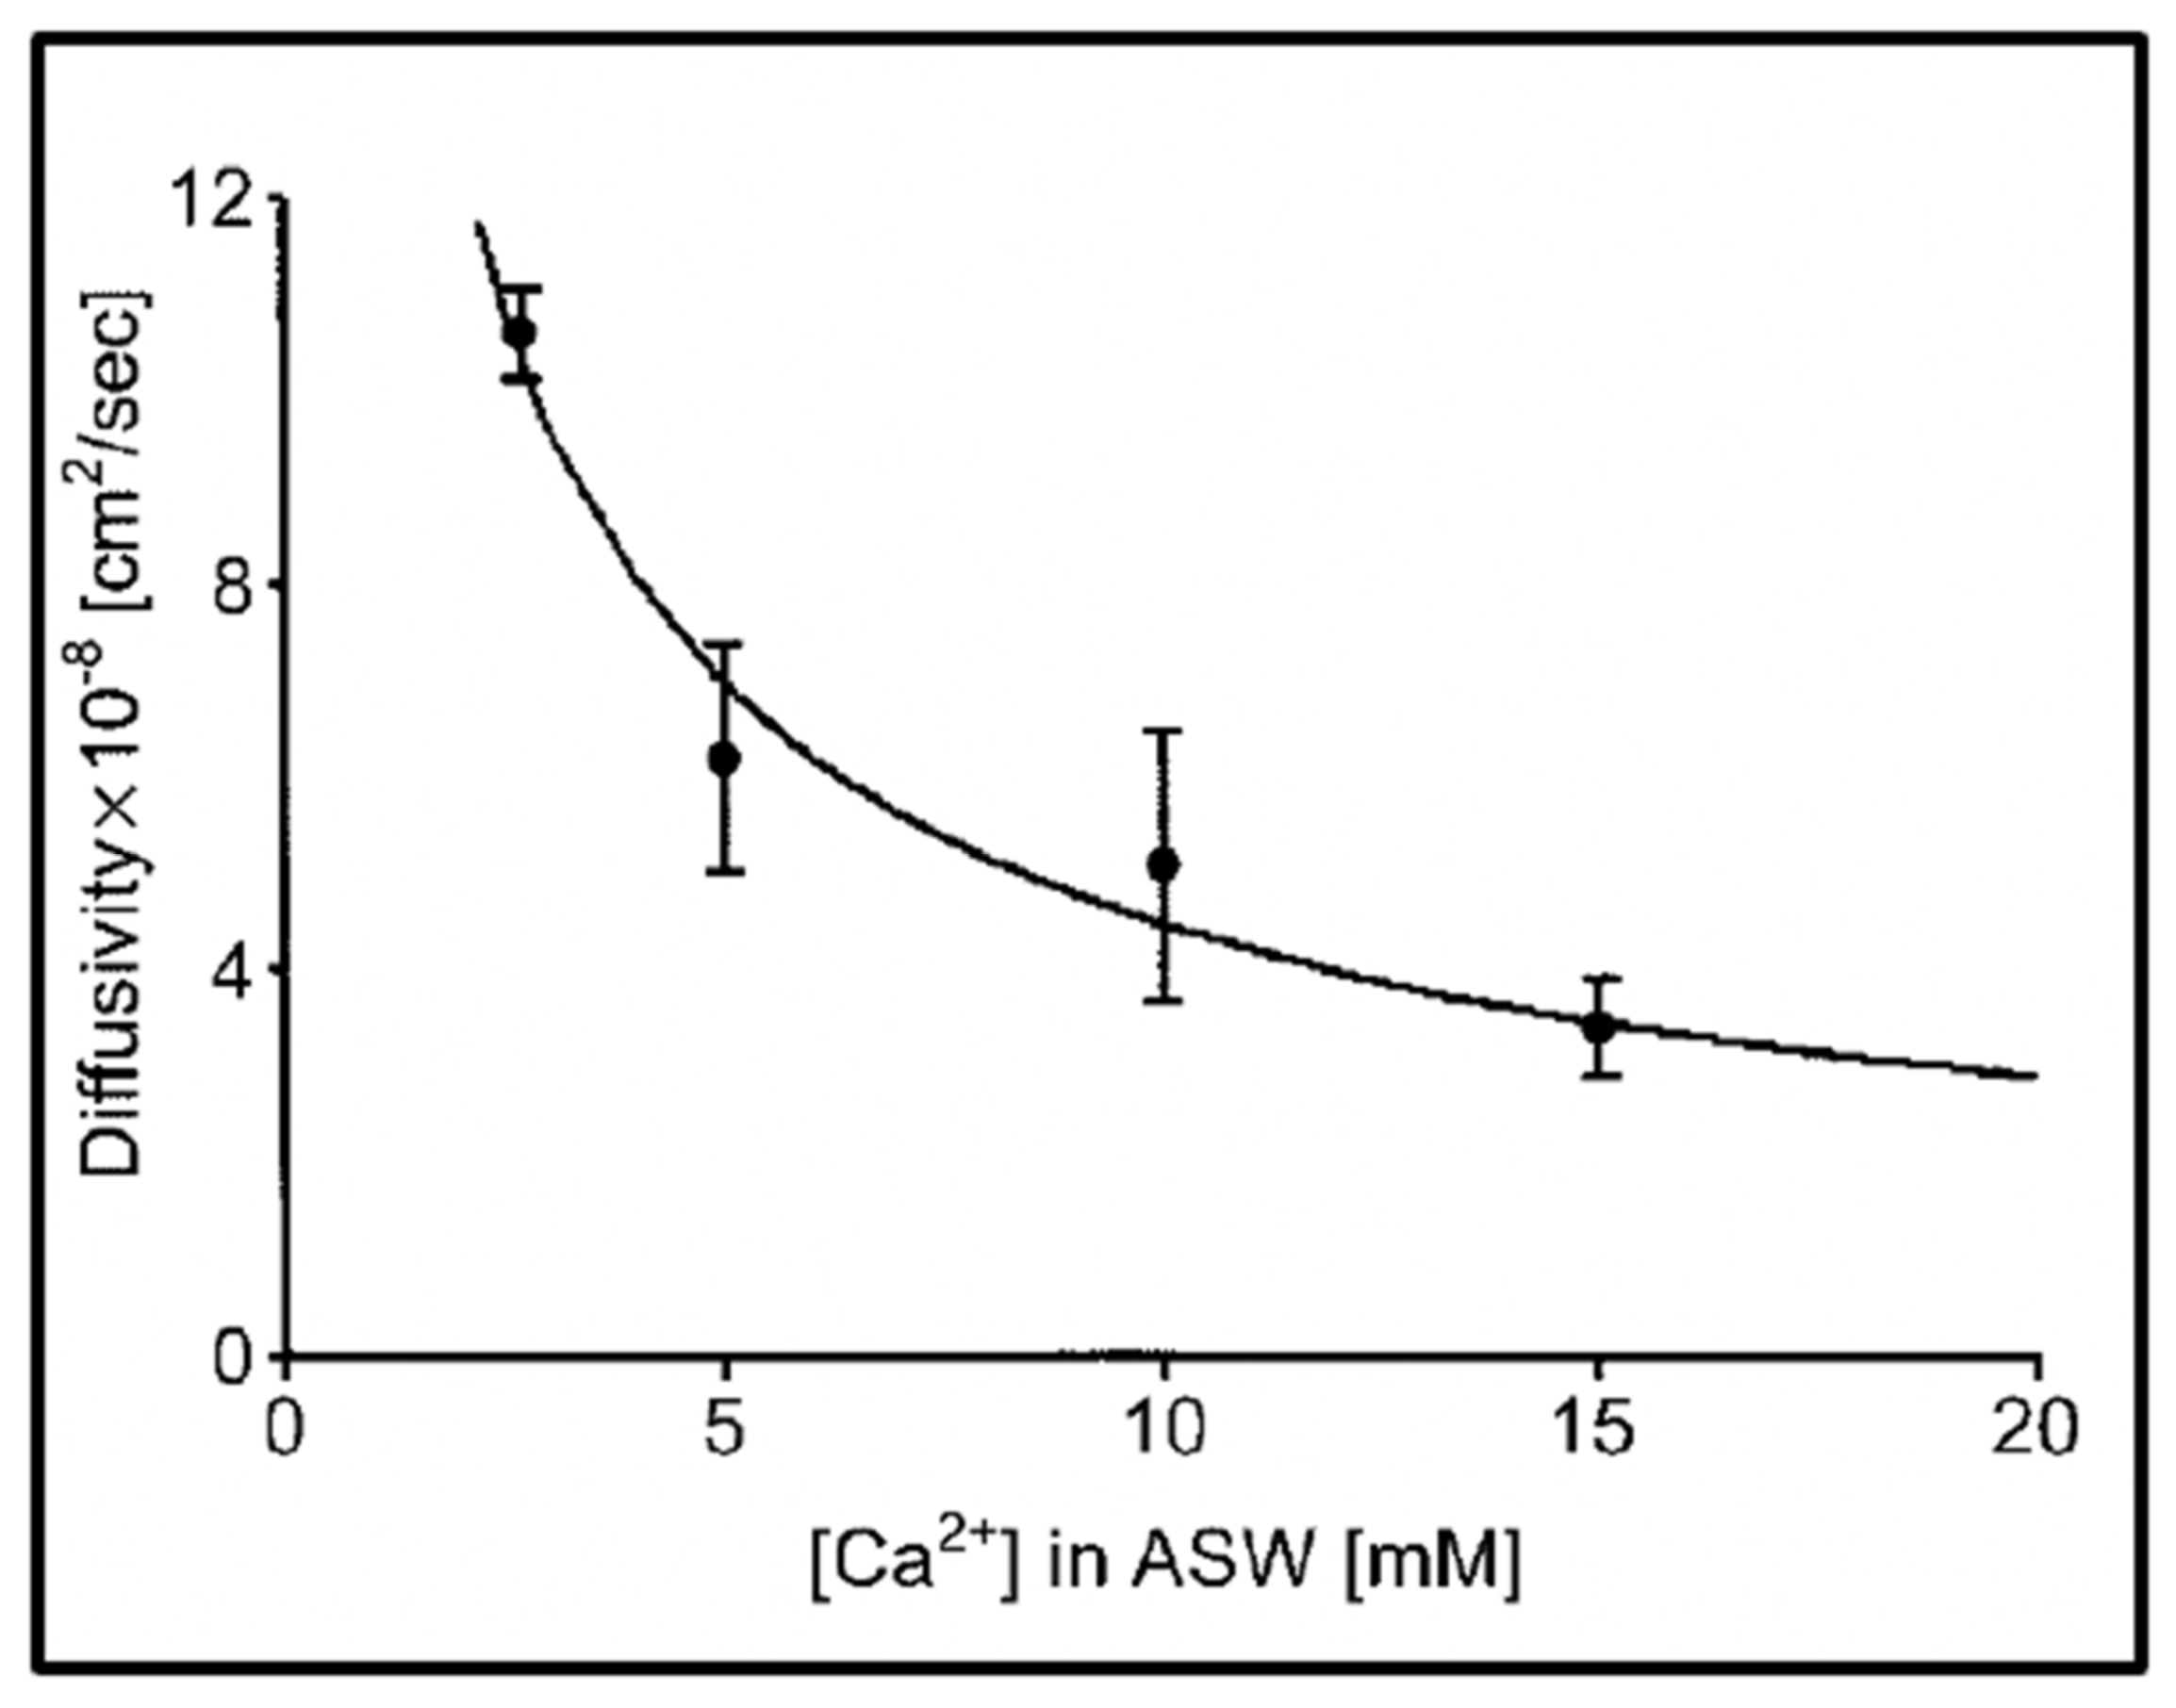
Figure 8.
Experiments conducted in Phaeocystis equilibrated in artificial seawater (ASW) containing increasing concentrations of Ca result in a characteristic power-law decrease of the diffusion of the exocytose Phaeocystis gel. Point corresponds to the mean ± SEM of seven measurements.
Figure 8.
Experiments conducted in Phaeocystis equilibrated in artificial seawater (ASW) containing increasing concentrations of Ca result in a characteristic power-law decrease of the diffusion of the exocytose Phaeocystis gel. Point corresponds to the mean ± SEM of seven measurements.
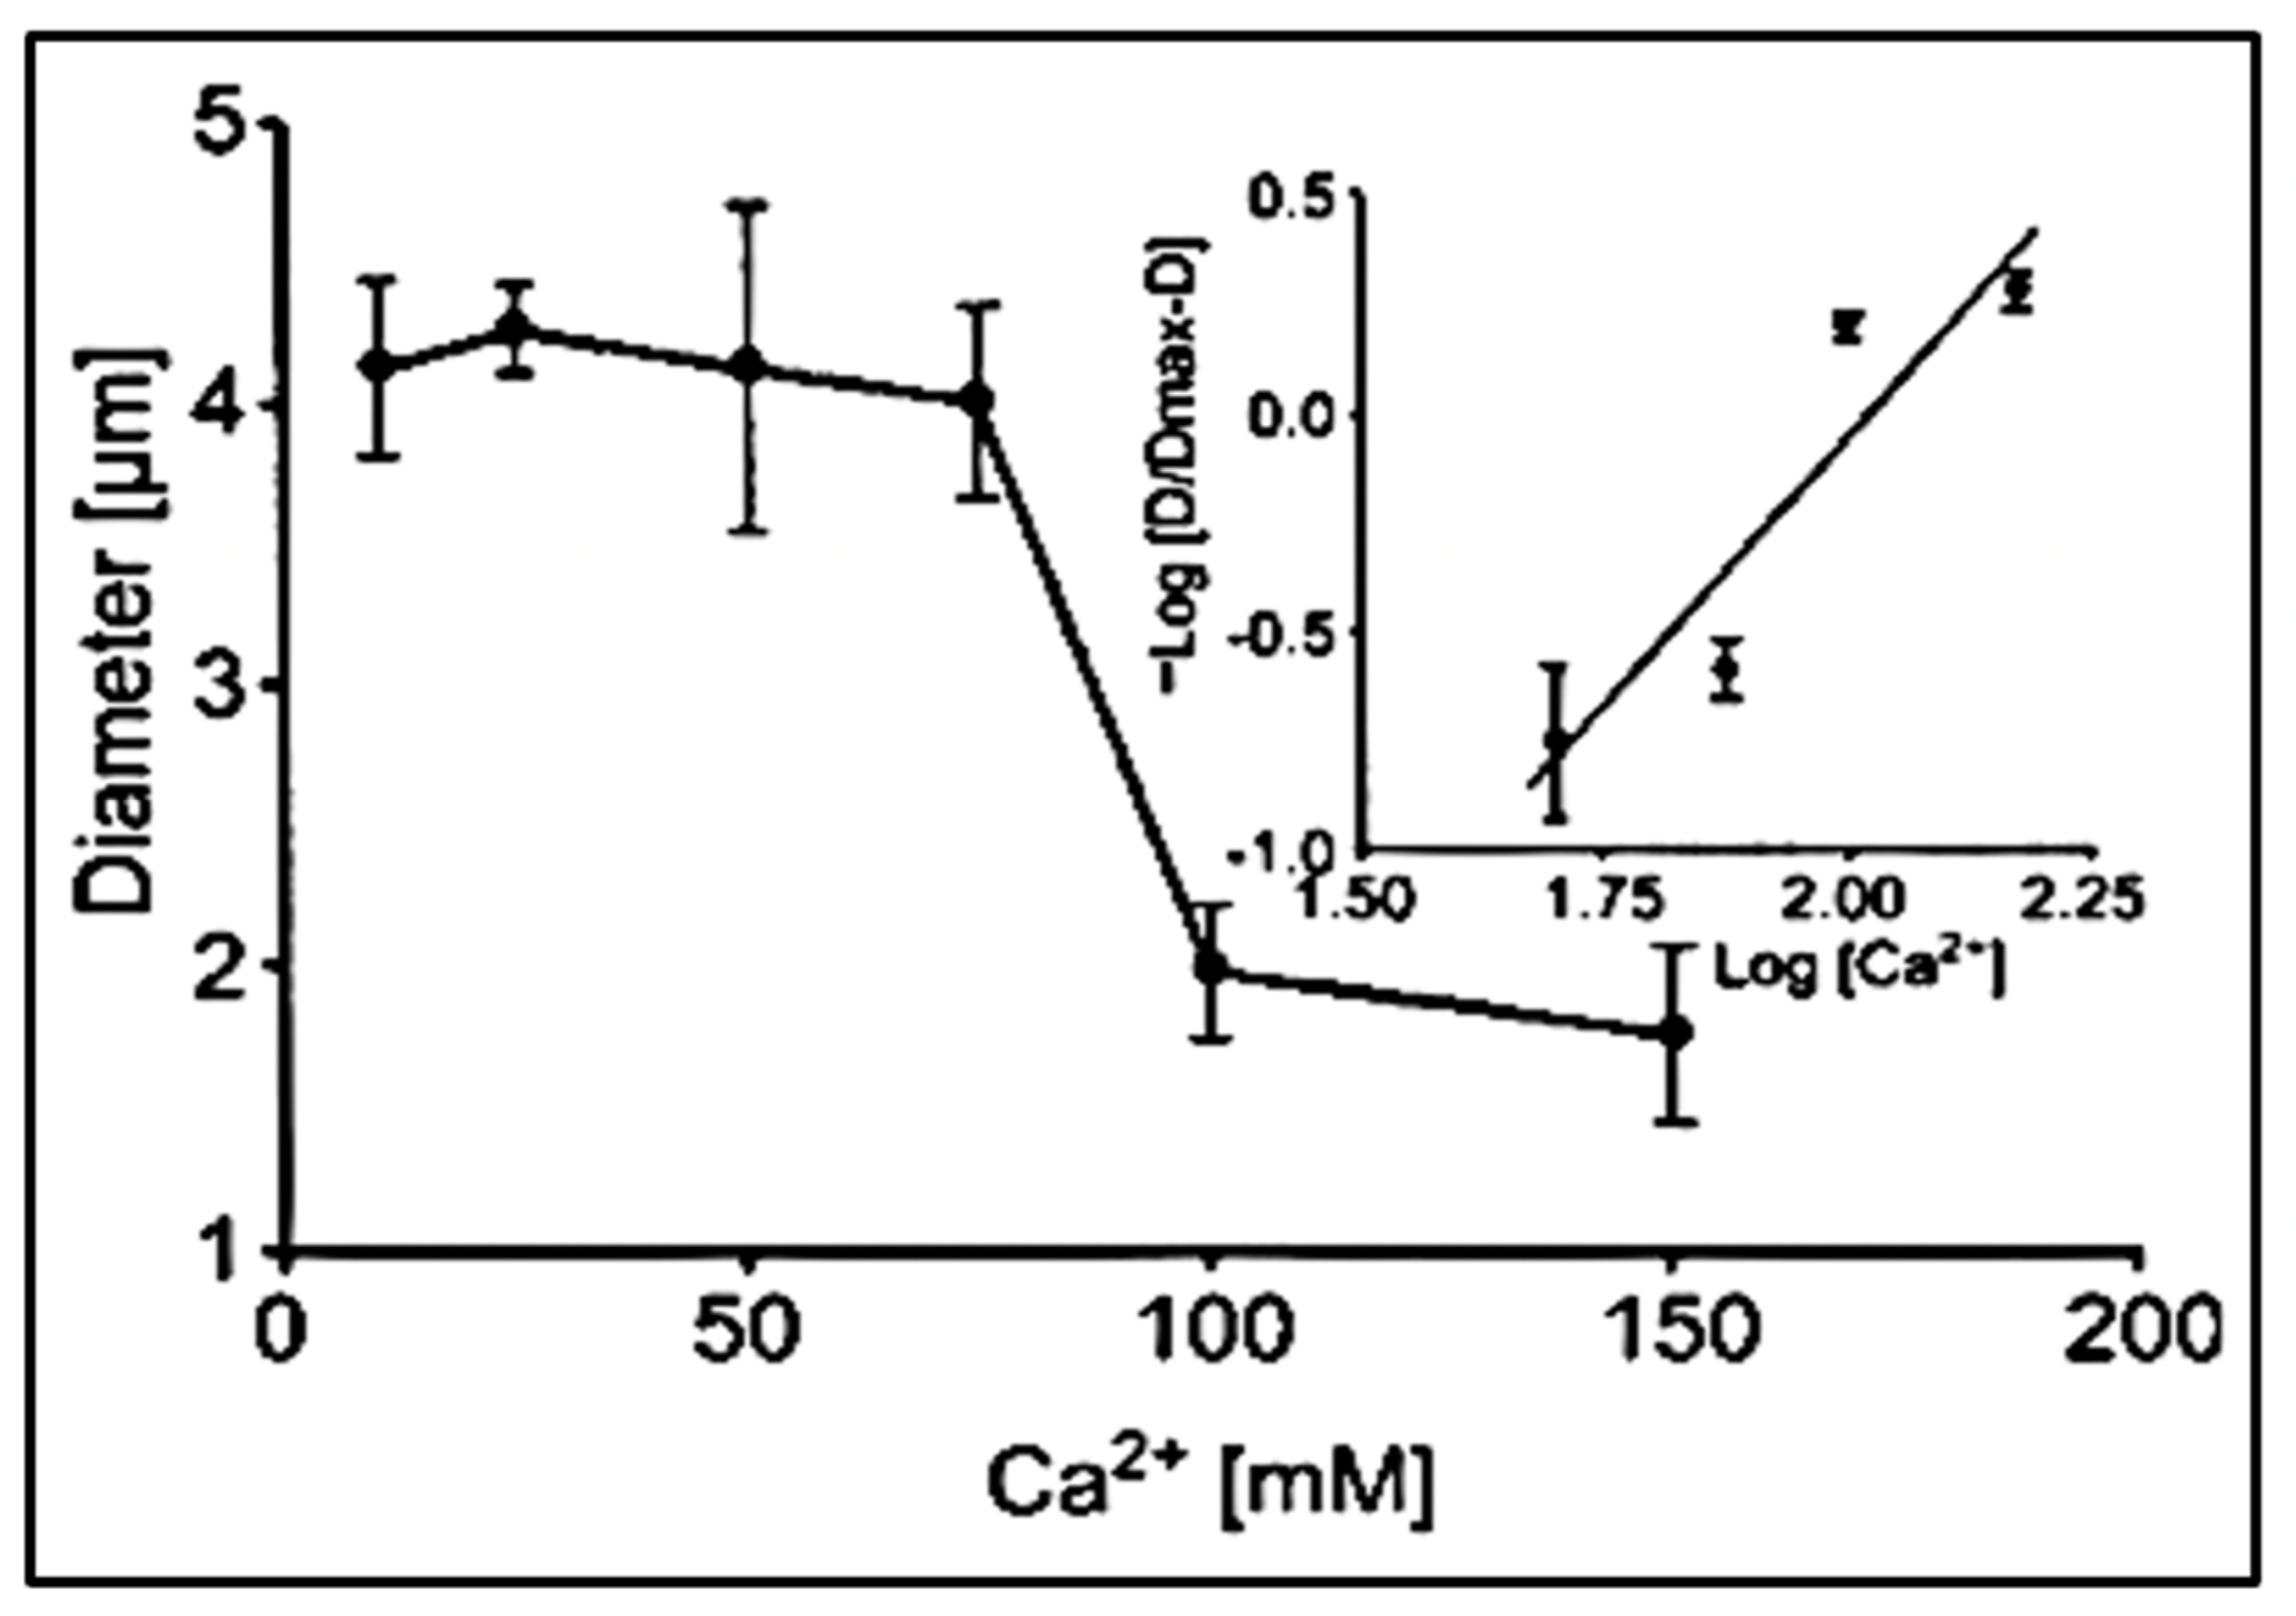
Figure 9.
The diameter of swollen exocytosed gels—equilibrated in a pH 3 buffer solution—changes drastically as [Ca
2+] increased from 10–150 mM CaCl
2. It undergoes a characteristic transition to a condensed phase [
19]. It shows a steep inflection at a critical point between 60 and 100 mM CaCl
2 at which phase transition takes place. The process is reversible, and as shown by the Hill plot in the inset, it exhibits the characteristic high cooperativity of critical phenomena with a Hill coefficient >2.5. Point corresponds to the mean ± SEM of seven measurements.
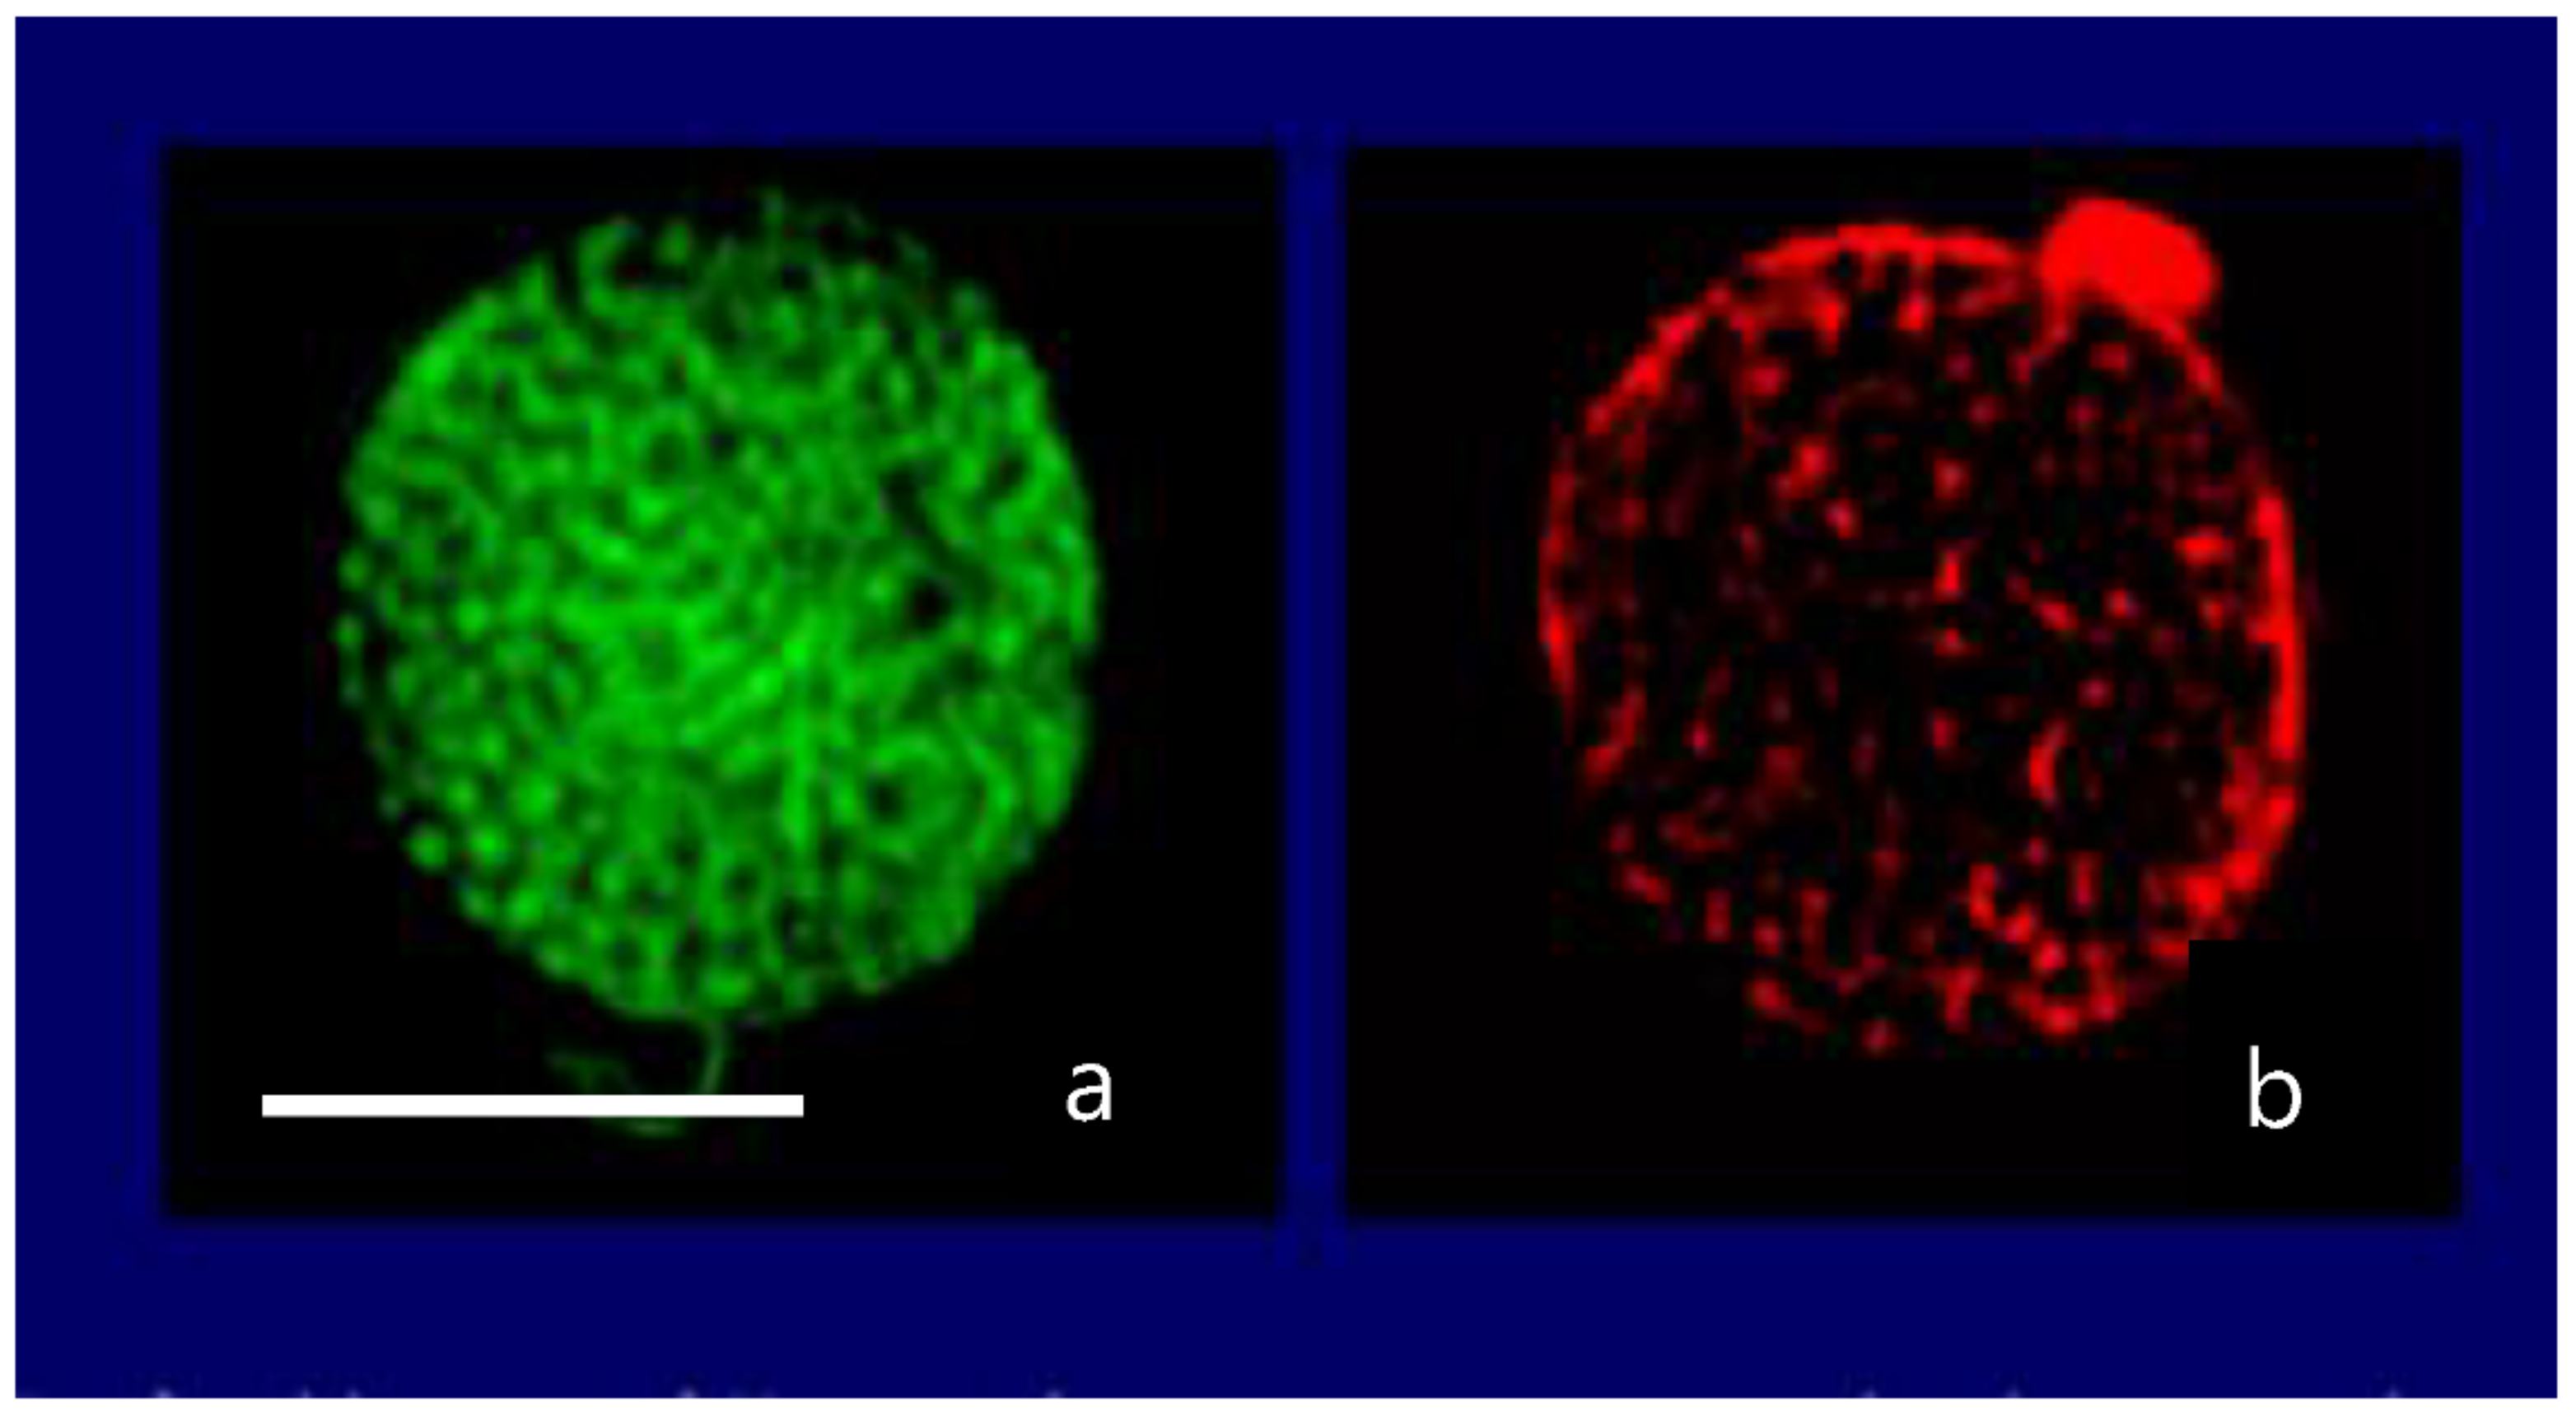
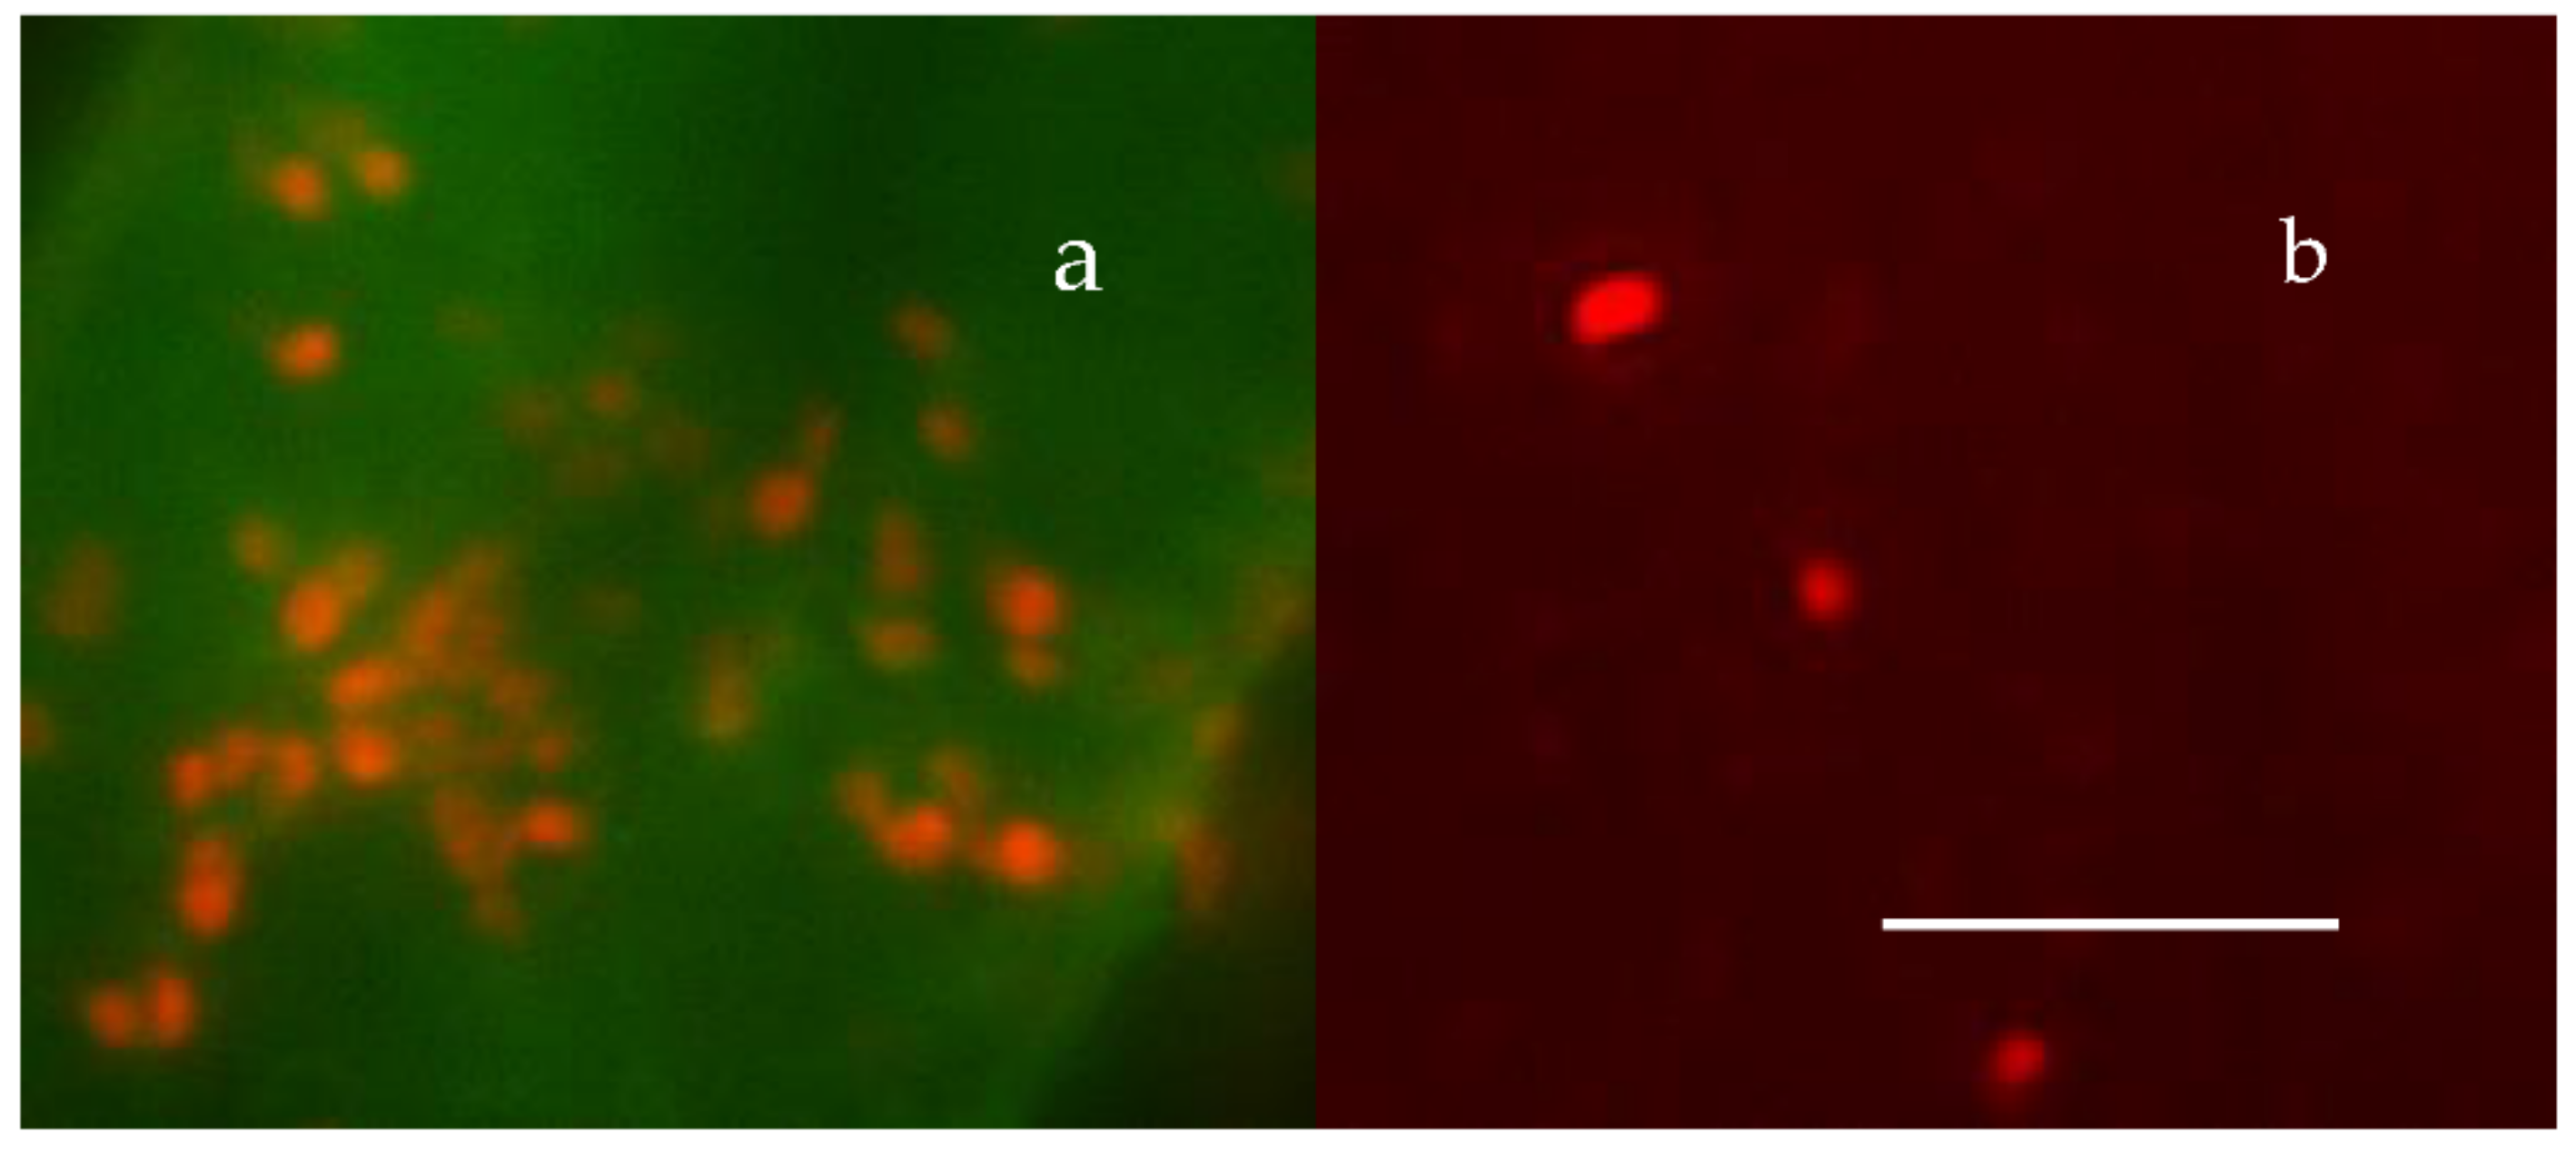
Figure 10.
Phase contrast (a) and LysoSensor-labeled Karinia brevis (b). The red emission corresponds to the autofluorescence of Chlorophyll from Karenia’s chloroplasts. The green emission is from a large secretory granule, labeled with LysoSensor, a probe that binds specifically to secretory granules. Bar = 8 μm.
Figure 11.
Confocal image of a secretory granule of Karenia brevis demonstrating colocalization of LysoSesor green—that labels secretory granules—in (a) and a fluorescent anti-brevetoxin antibody conjugated with Tetramethyl Rhodamine Isothiocyanate that emits in red (b). Bar = 10 μm.
Figure 11.
Confocal image of a secretory granule of Karenia brevis demonstrating colocalization of LysoSesor green—that labels secretory granules—in (a) and a fluorescent anti-brevetoxin antibody conjugated with Tetramethyl Rhodamine Isothiocyanate that emits in red (b). Bar = 10 μm.
Figure 12.
Fluorescence images show that marine gels contain a broad variety of biopolymers, including rubisco—a protein, labeled with a fluorescent specific antibody—nucleic acids—labeled with DAPI—hydrophobic moieties, probably lipids—labeled with Nile Red—and polyanionic polymers that bind Ca—labeled with CTC (Chlortetracycline).
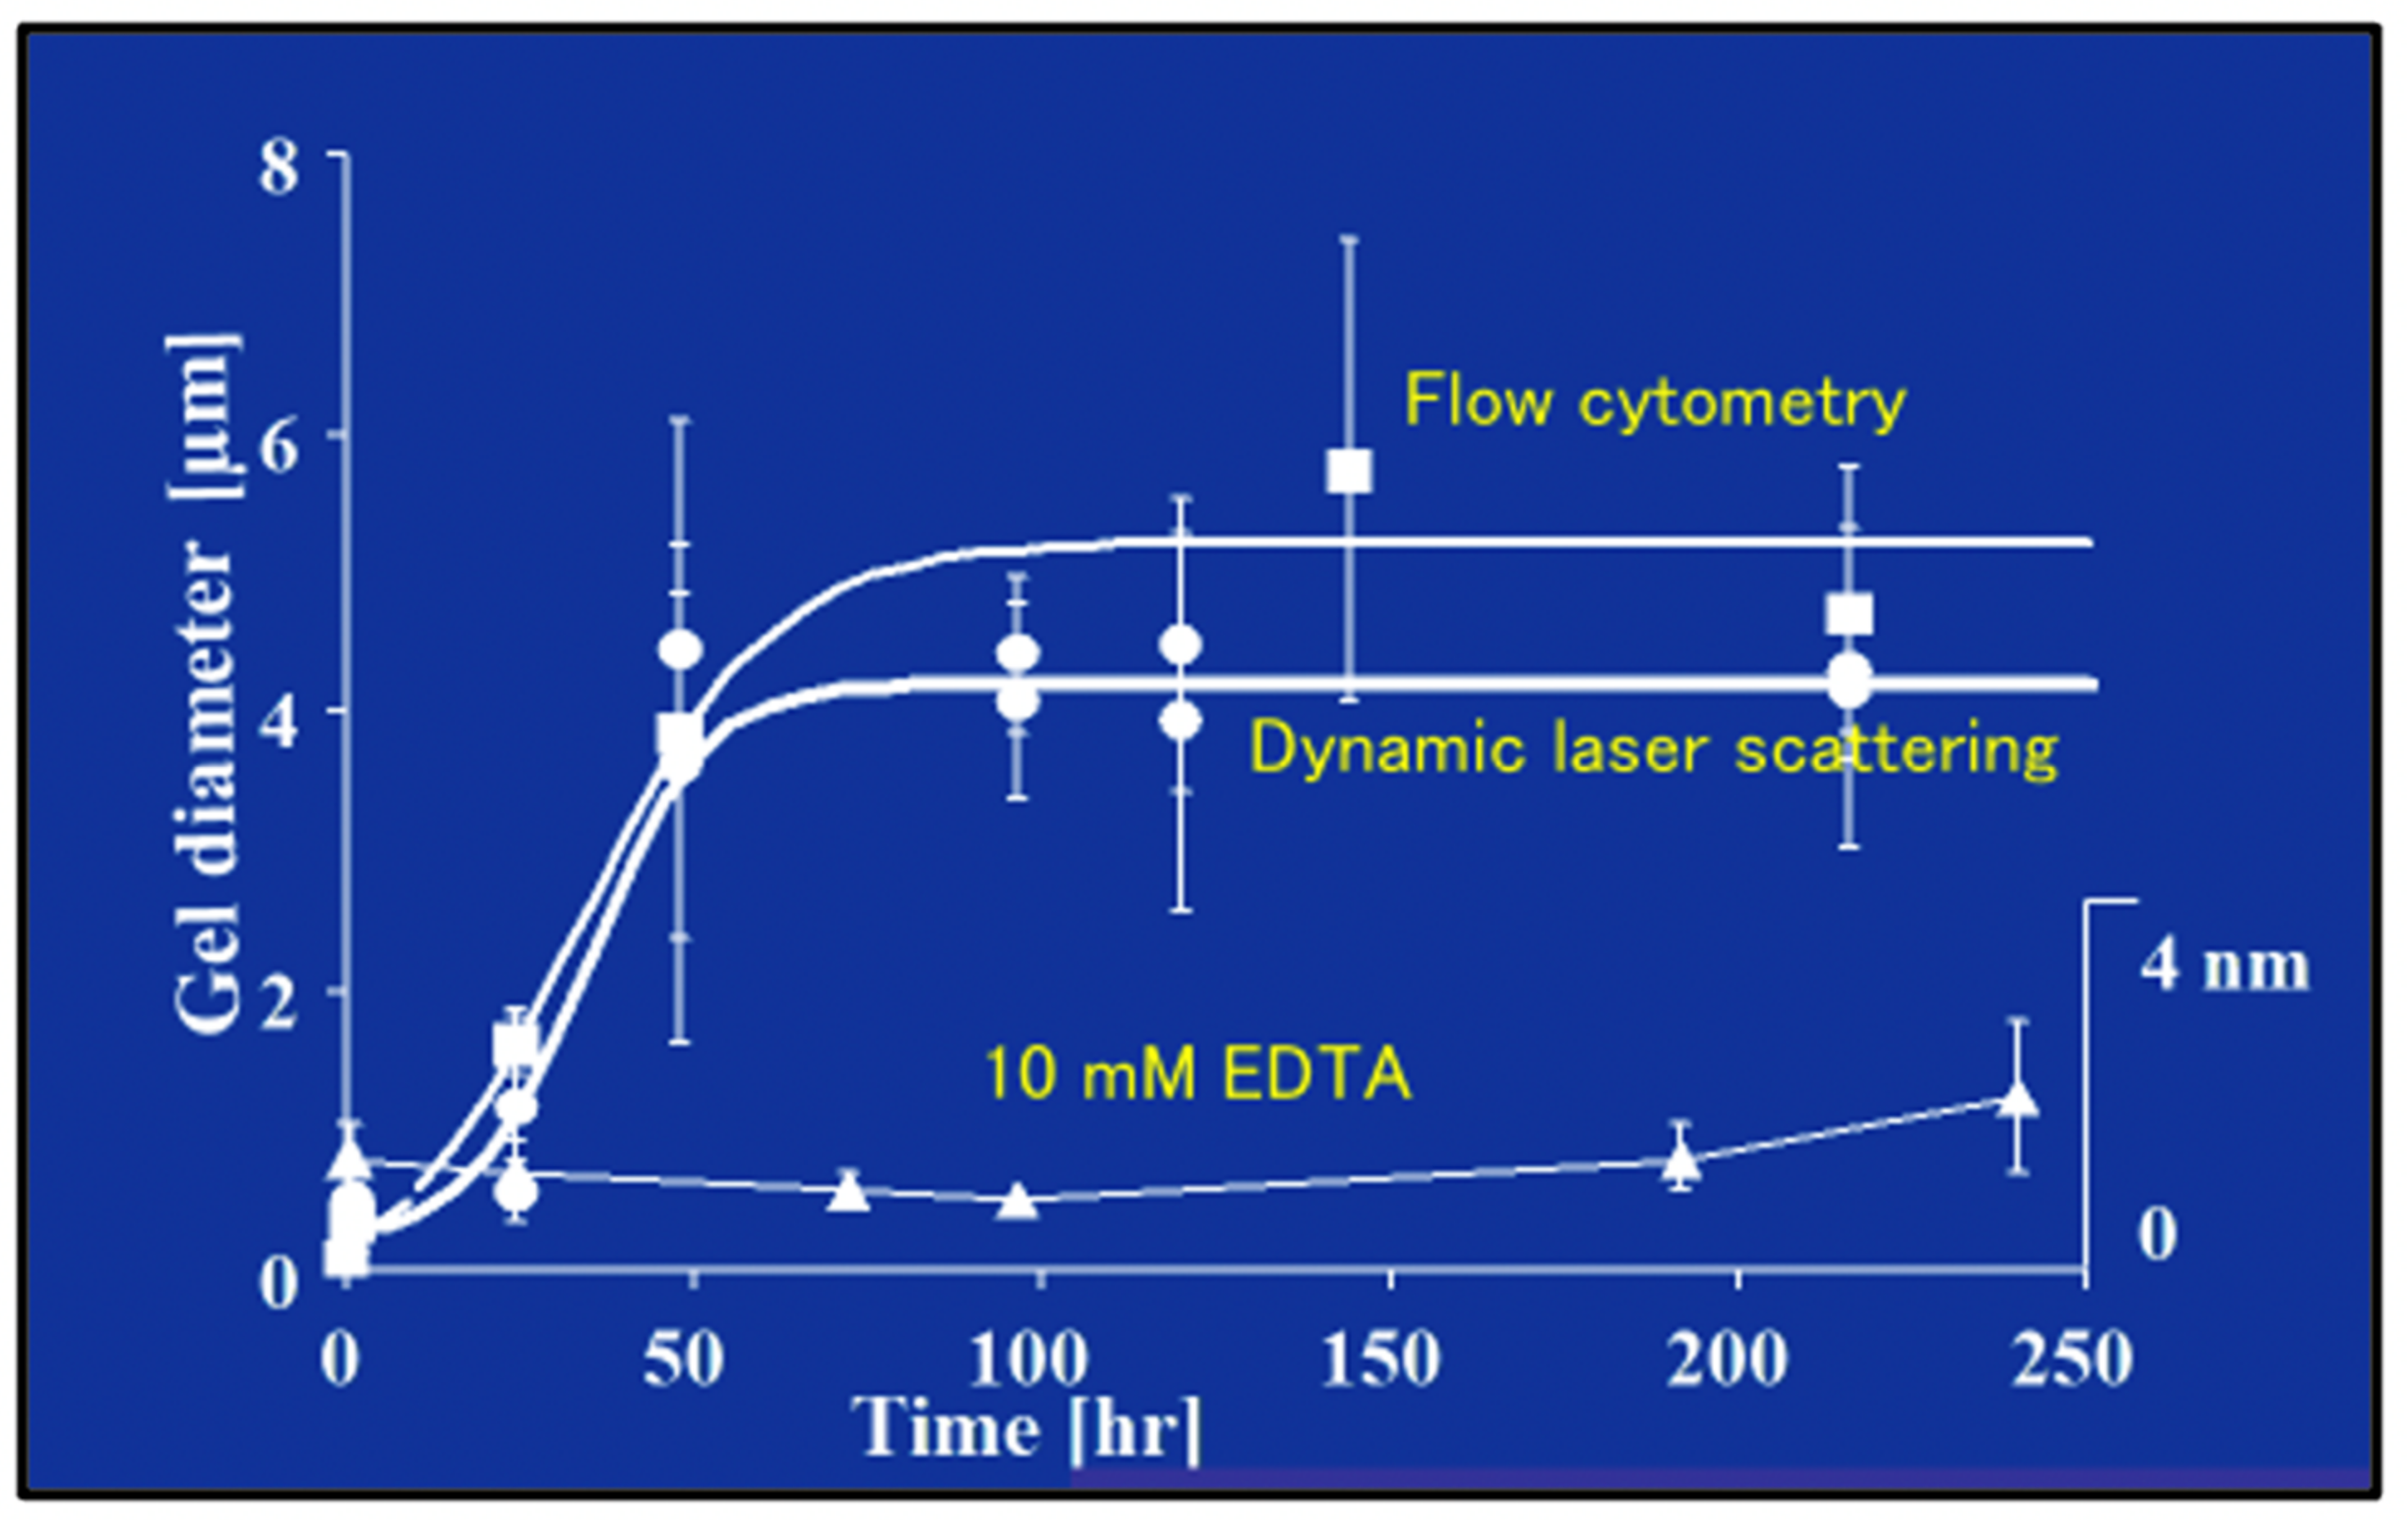
Figure 13.
The Time course of DOM biopolymer assembly and MG formation is monitored by measuring particle size by both homodyne dynamic laser scattering (DLS), and by flow cytometry in 0.2 µm-filtered SW. Measurements of microgel size by flow cytometry (squares) and DLS (circles) show a similar time course of assembly. MG size grows from colloidal, submicrometre size, to several micrometers following characteristic second order kinetics. Control samples in which MBP assembly was inhibited by chelating Ca2+ by adding 10 mM EDTA to the SW gave an average size of 1–2.5 nm, regardless of the time of observation (triangles). Each point corresponds to the average ± SD. of five measurements.
Figure 14.
Electron probe microanalysis reveals that MGs contain substantially higher levels of Ca than Mg. Notice, that probably resulting from the Donnan partition, Ca reaches much higher concentrations inside self-assembled MG than in SW. Inset (a) is an environmental scanning electron micrograph image of a MG, the background depicts the surface of a filter—notice that this gel is intact and fully hydrated as environmental scanning electron microscopy (ESEM) does not require fixation or any other artifact-inducing chemical manipulation. Inset (b) is a gel labeled with CTC, a fluorescent probe that labels bound Ca and that, unlike other colorimetric probes, does not produce crosslinking of MBP or affect in any way the supramolecular structure of gels.
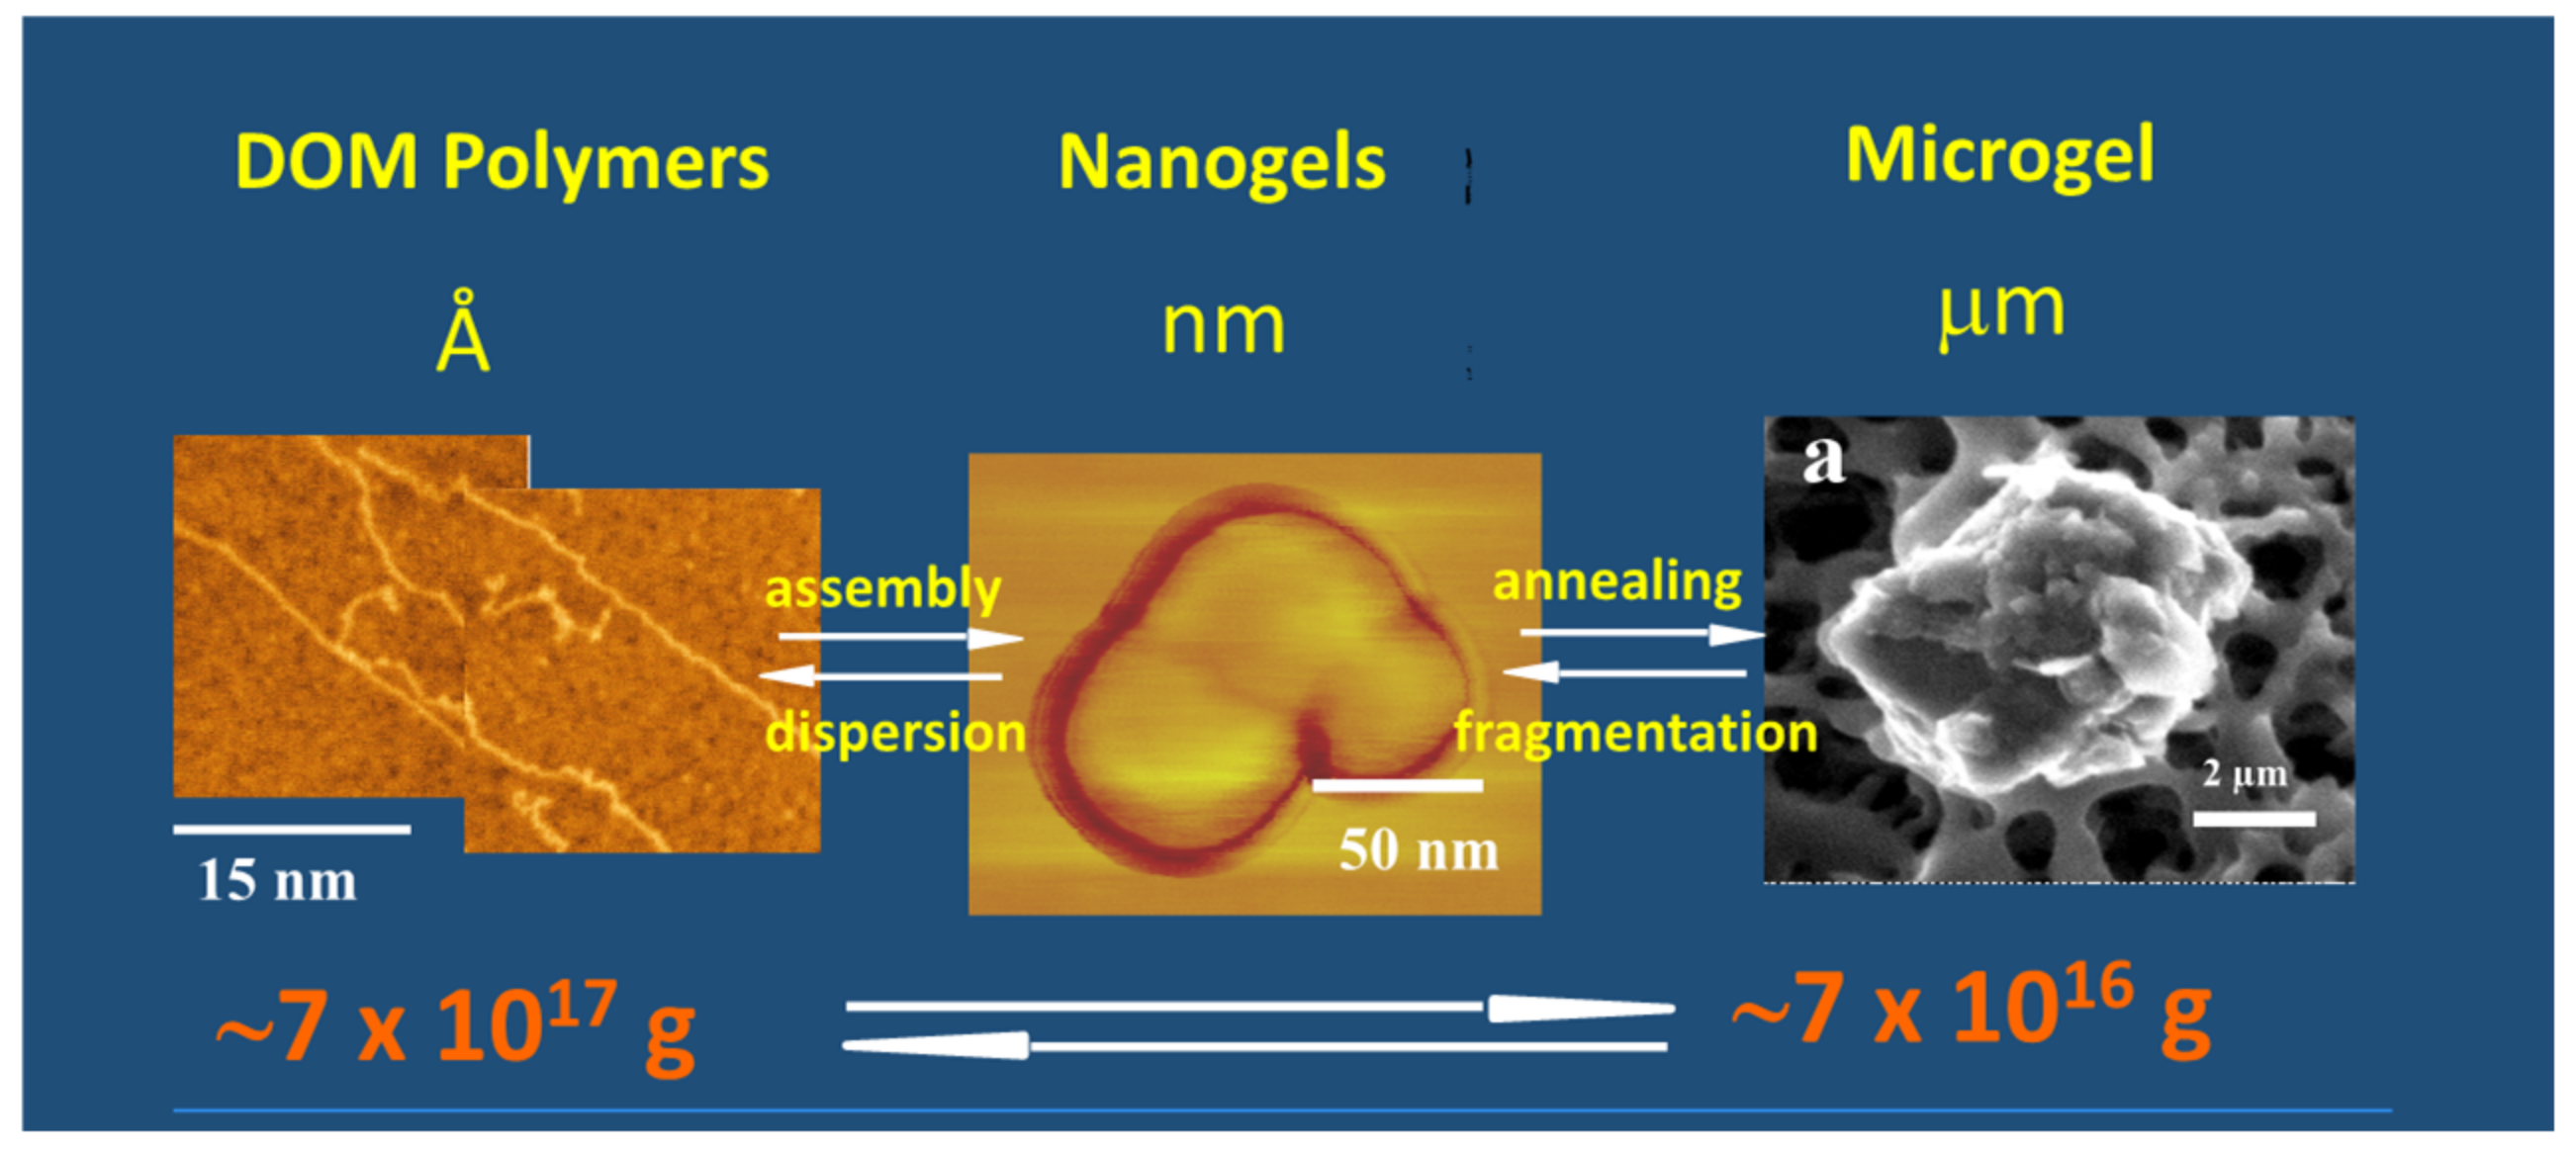
Figure 15.
This figure shows that the formation of MG starts from biopolymer precursors at Angstroms dimensions (left panel). They self-assemble forming nanogels (center panel) that anneal to final equilibrium gel size at micron scales (right panel). MBP and nanogels were set on mica substrate for ATM imaging. A filter surface can be seen in the background of the ESEM image on the right. Arrows indicate material flow between MBP, nanogels, and micron-size MG, and in the lower panel illustrate organic carbon mass equilibrium between DOM and MGs.
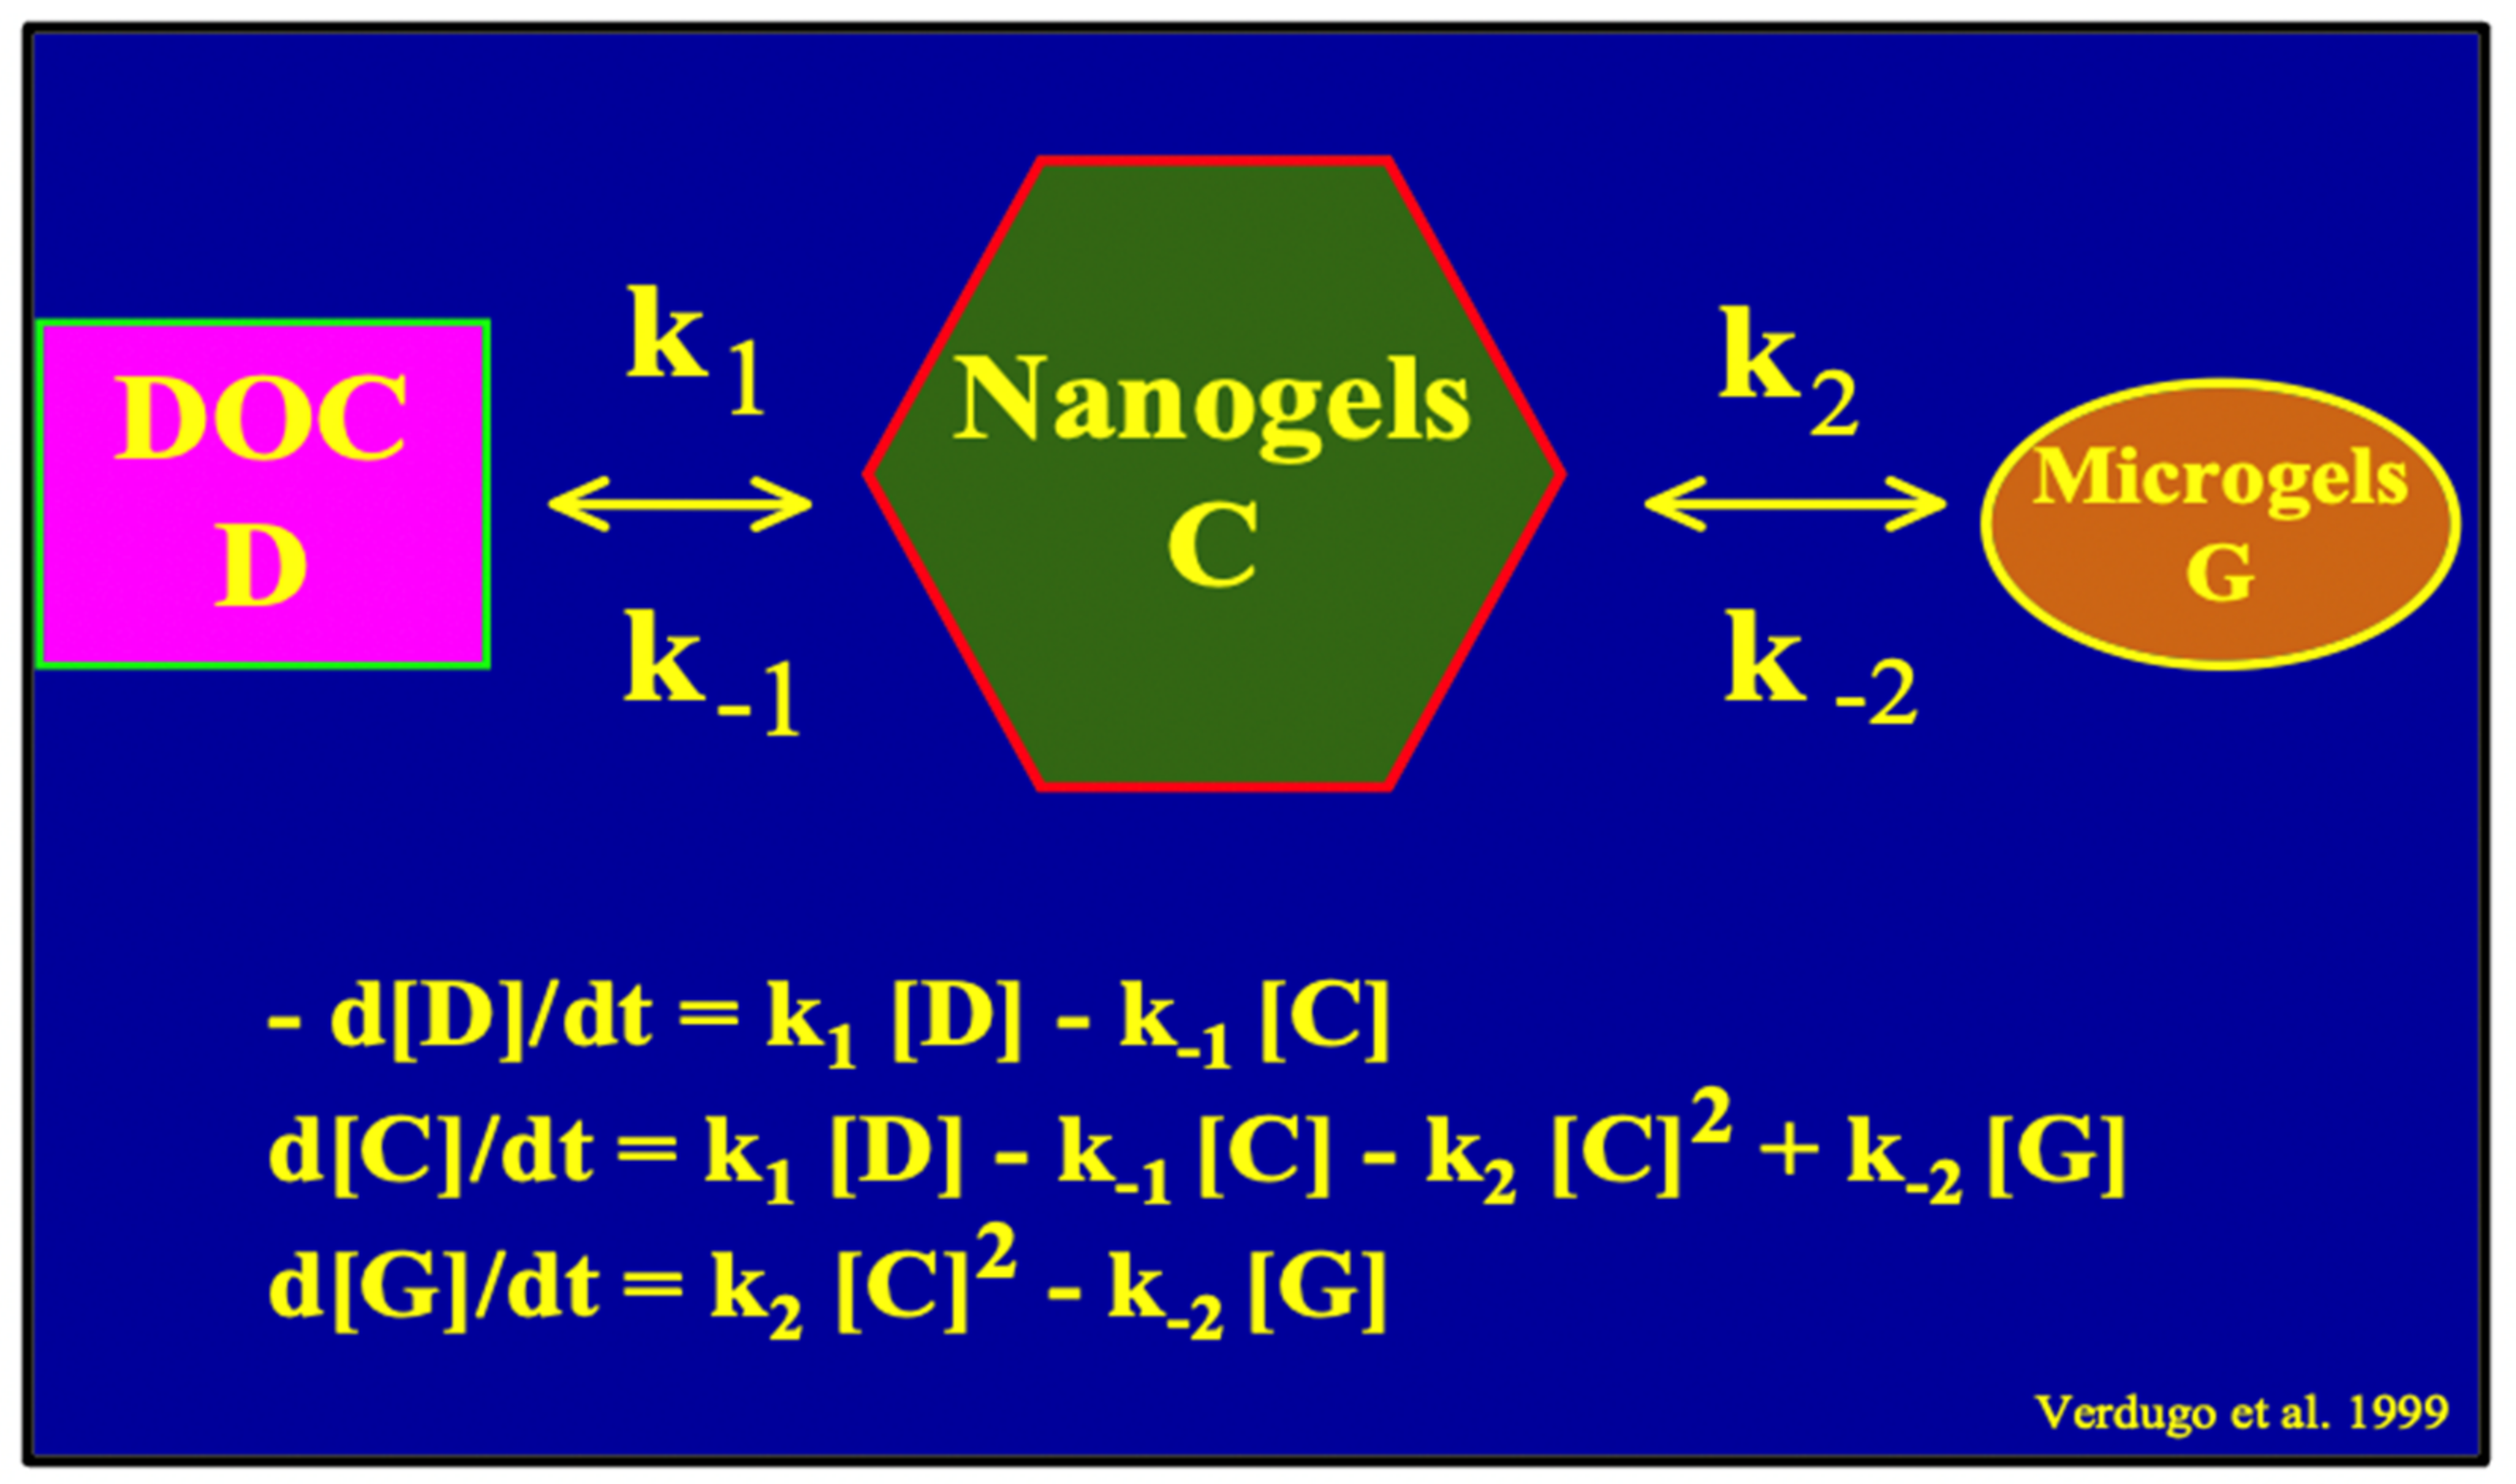
Figure 16.
A simple second-order kinetics mathematical model of MBP assembly can be formulated by assigning two correspondent equilibrium constants k
1 and k
2 to the assembly reaction. Square parenthesis refers to Carbon concentration in each of the subsequent steps from DOC to Nano and MGs. From the MG step, organic carbon becomes available to microorganisms, and flux becomes irreversible as carbon enters the food web escalator (
Figure 1). Notice that MGOC can be a sensitive indicator of the balance between supply and demand of carbon in marine carbon cycling.
Figure 17.
Assembly kinetics of DOM polymers in 0.2 μm-filtered seawater (circles) and self-assembly of SEP (100 μg × L−1 in ASW (triangles) monitored by DSL. Addition of 100 μg × L−1 to 0.2 μm-filtered seawater results in quick DOM assembly that reaches equilibrium in ~10 h yielding microgels of ~4–5 μm hydrodynamic diameter (squares). Points are the average ± SD of 15 outcomes of triplicate measurements in five samples.
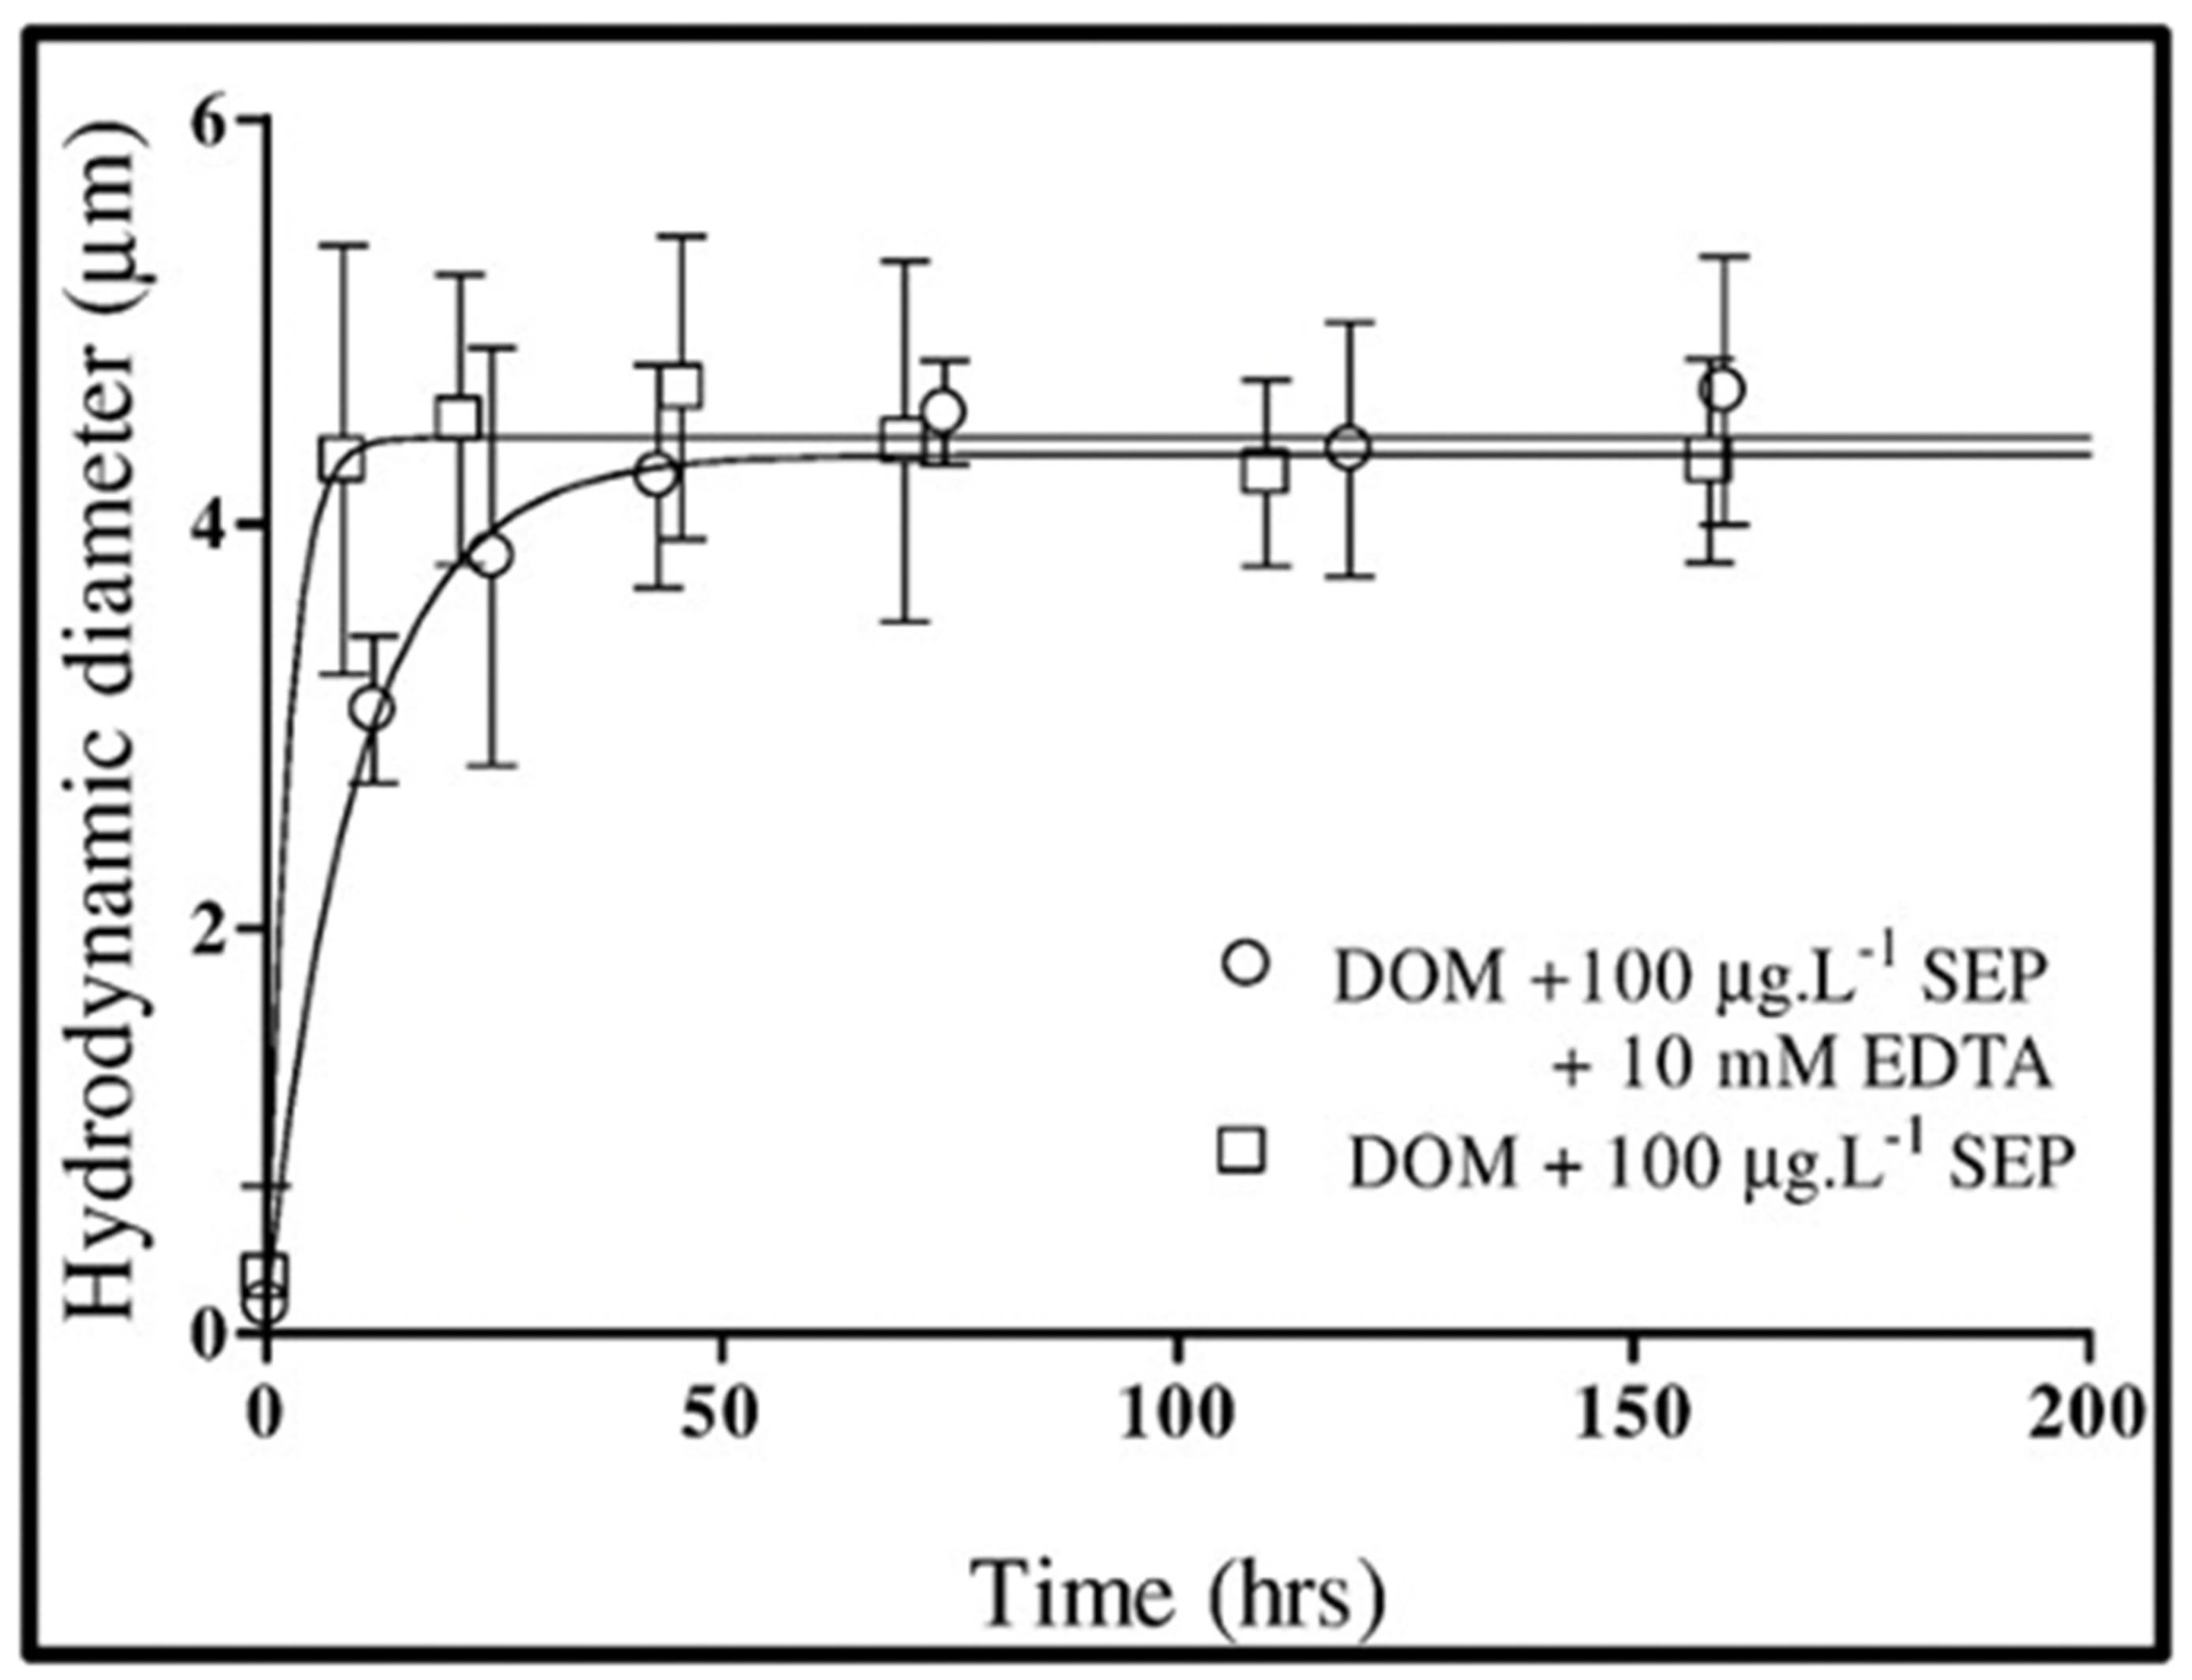
Figure 18.
Kinetics of self-assembly of DOM polymers induced by adding 100 μg × L−1 SEP to 0.2 μm-filtered seawater in the absence (open circles) or presence of 10 mM Ca2+ chelator EDTA (open squares) does not exhibit significant statistical differences. Points are the average ± SD of 15 outcomes of triplicate measurements by DSL in five samples.
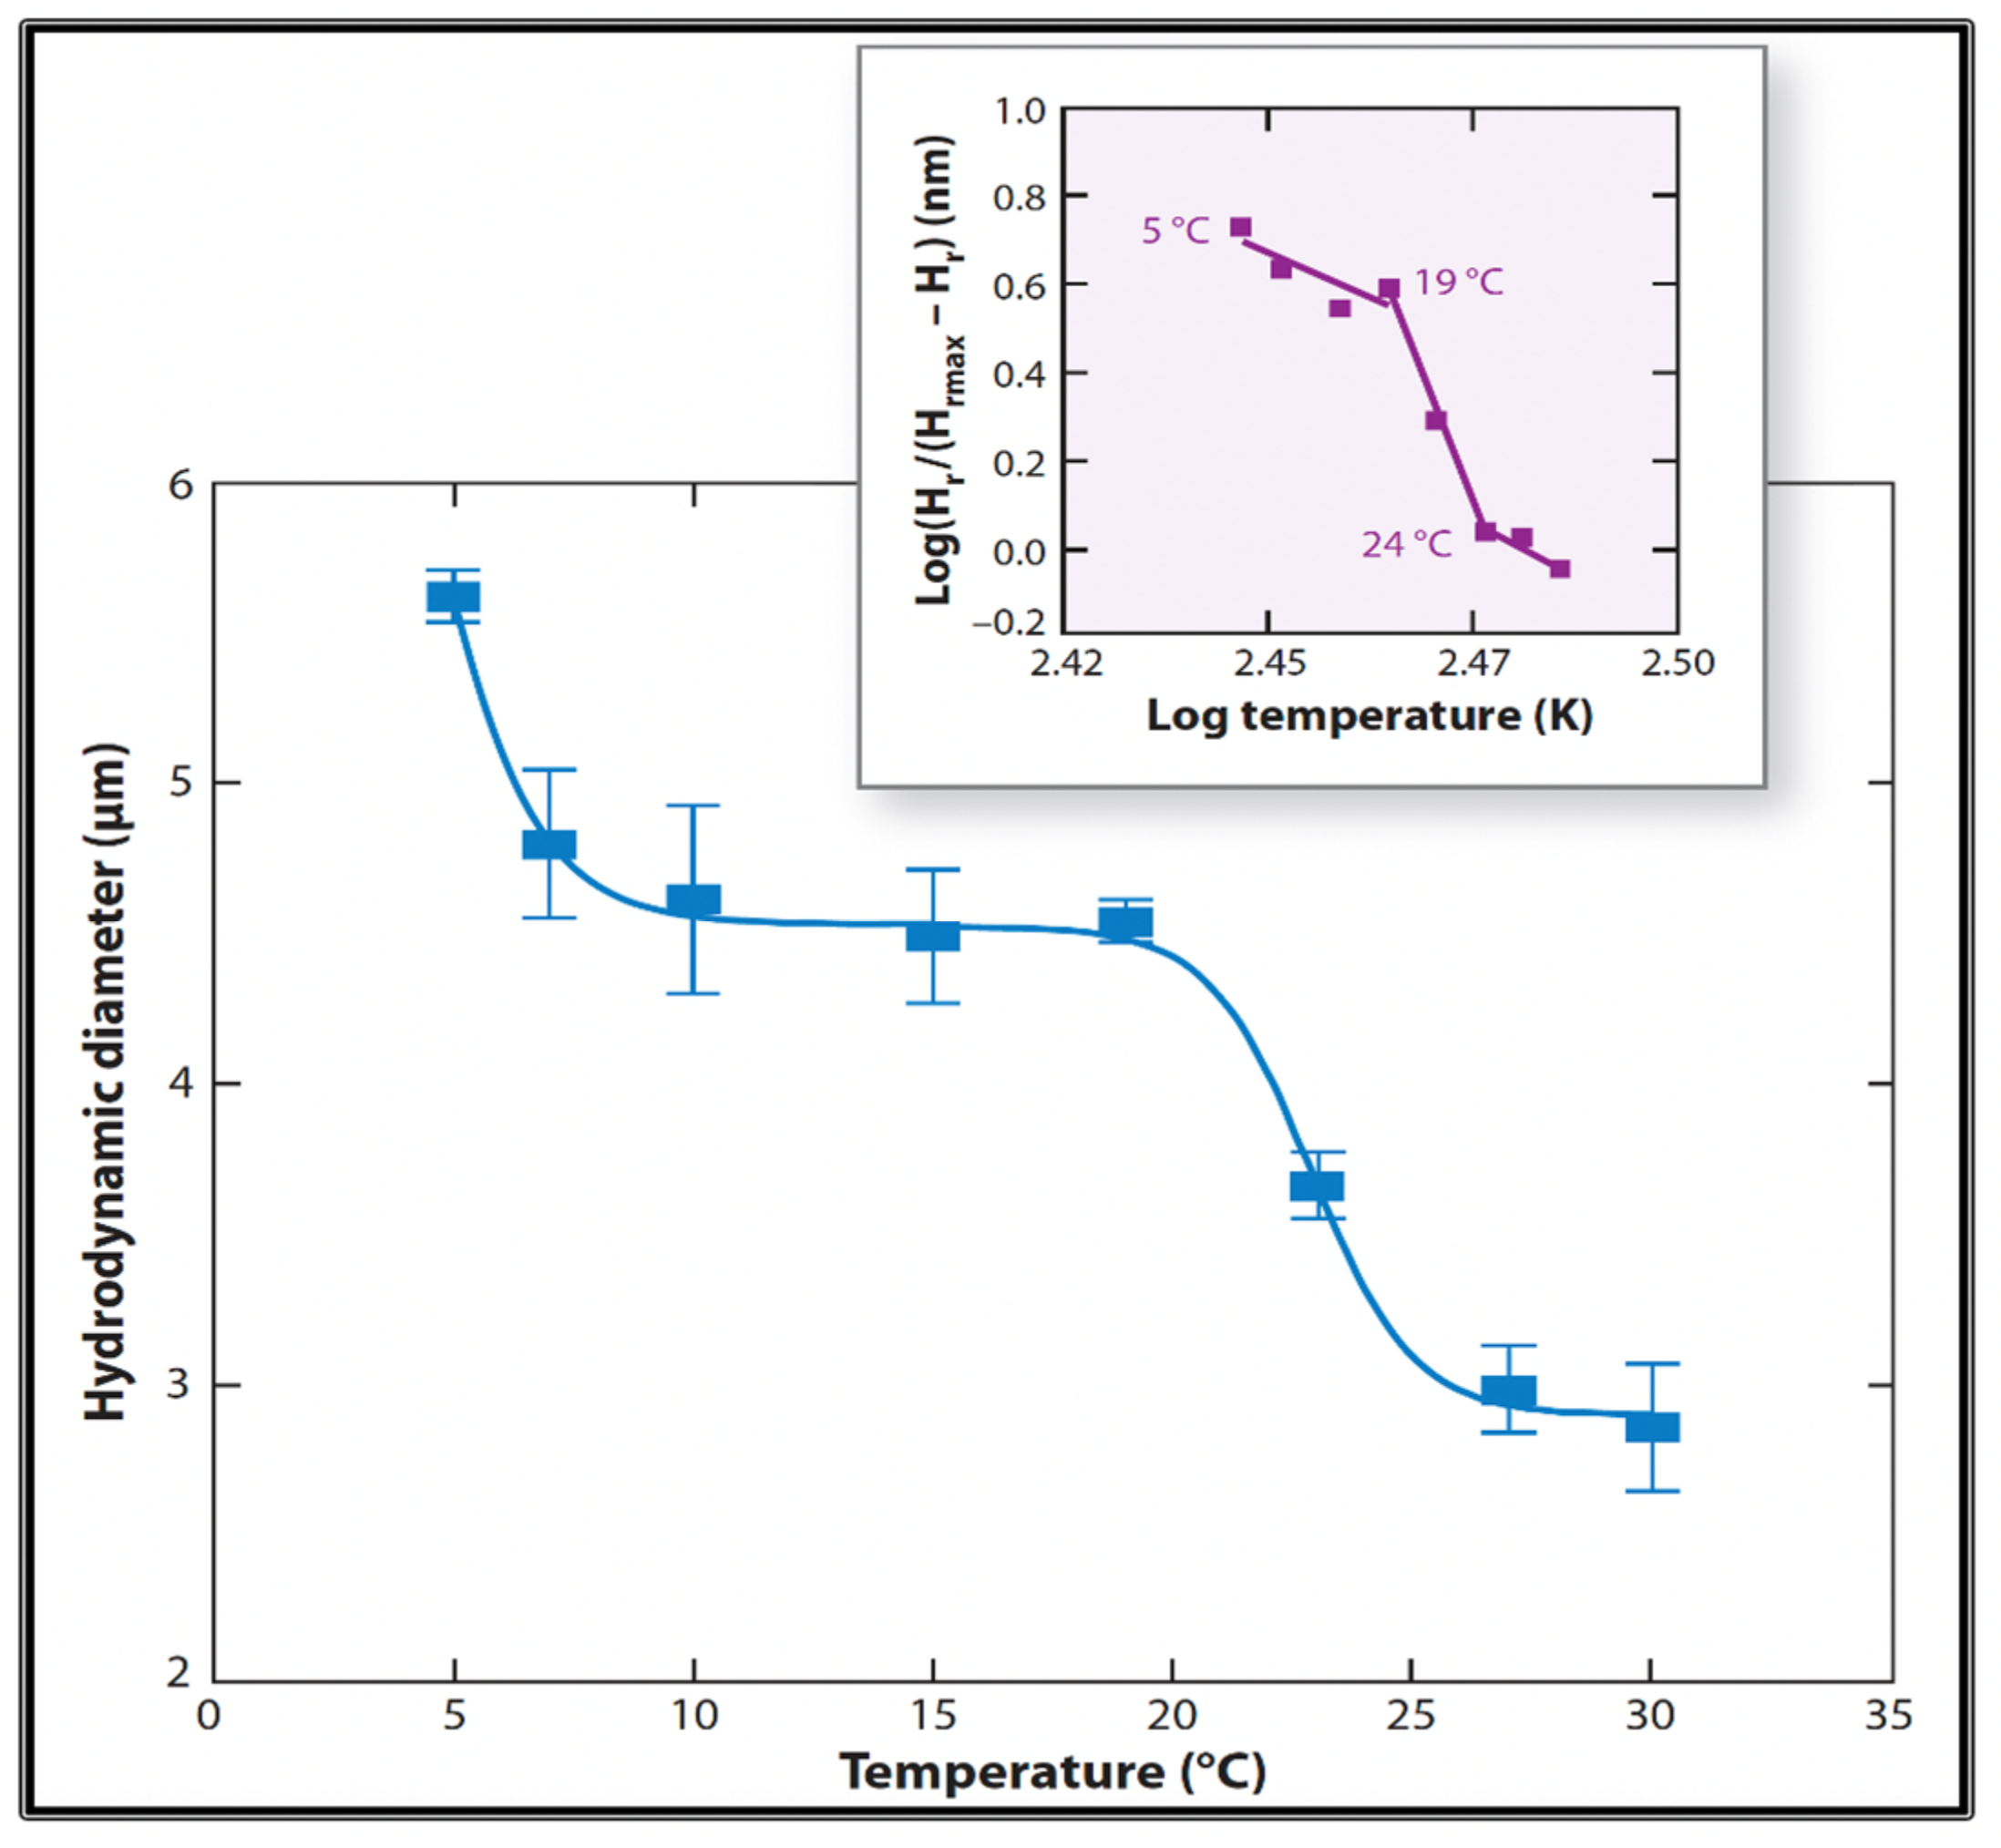
Figure 19.
Measurements of MG hydrodynamic diameter by Photon Correlation Spectroscopy show that MG exhibits a two-step temperature-induced phase transition, with critical points at ~7 °C and between 20 °C and 25 °C. Inset. The Hill coefficients in both cases exhibit values that portray the typical high cooperativity of critical phenomena. Each point corresponds to the average ± SD. of five measurements.
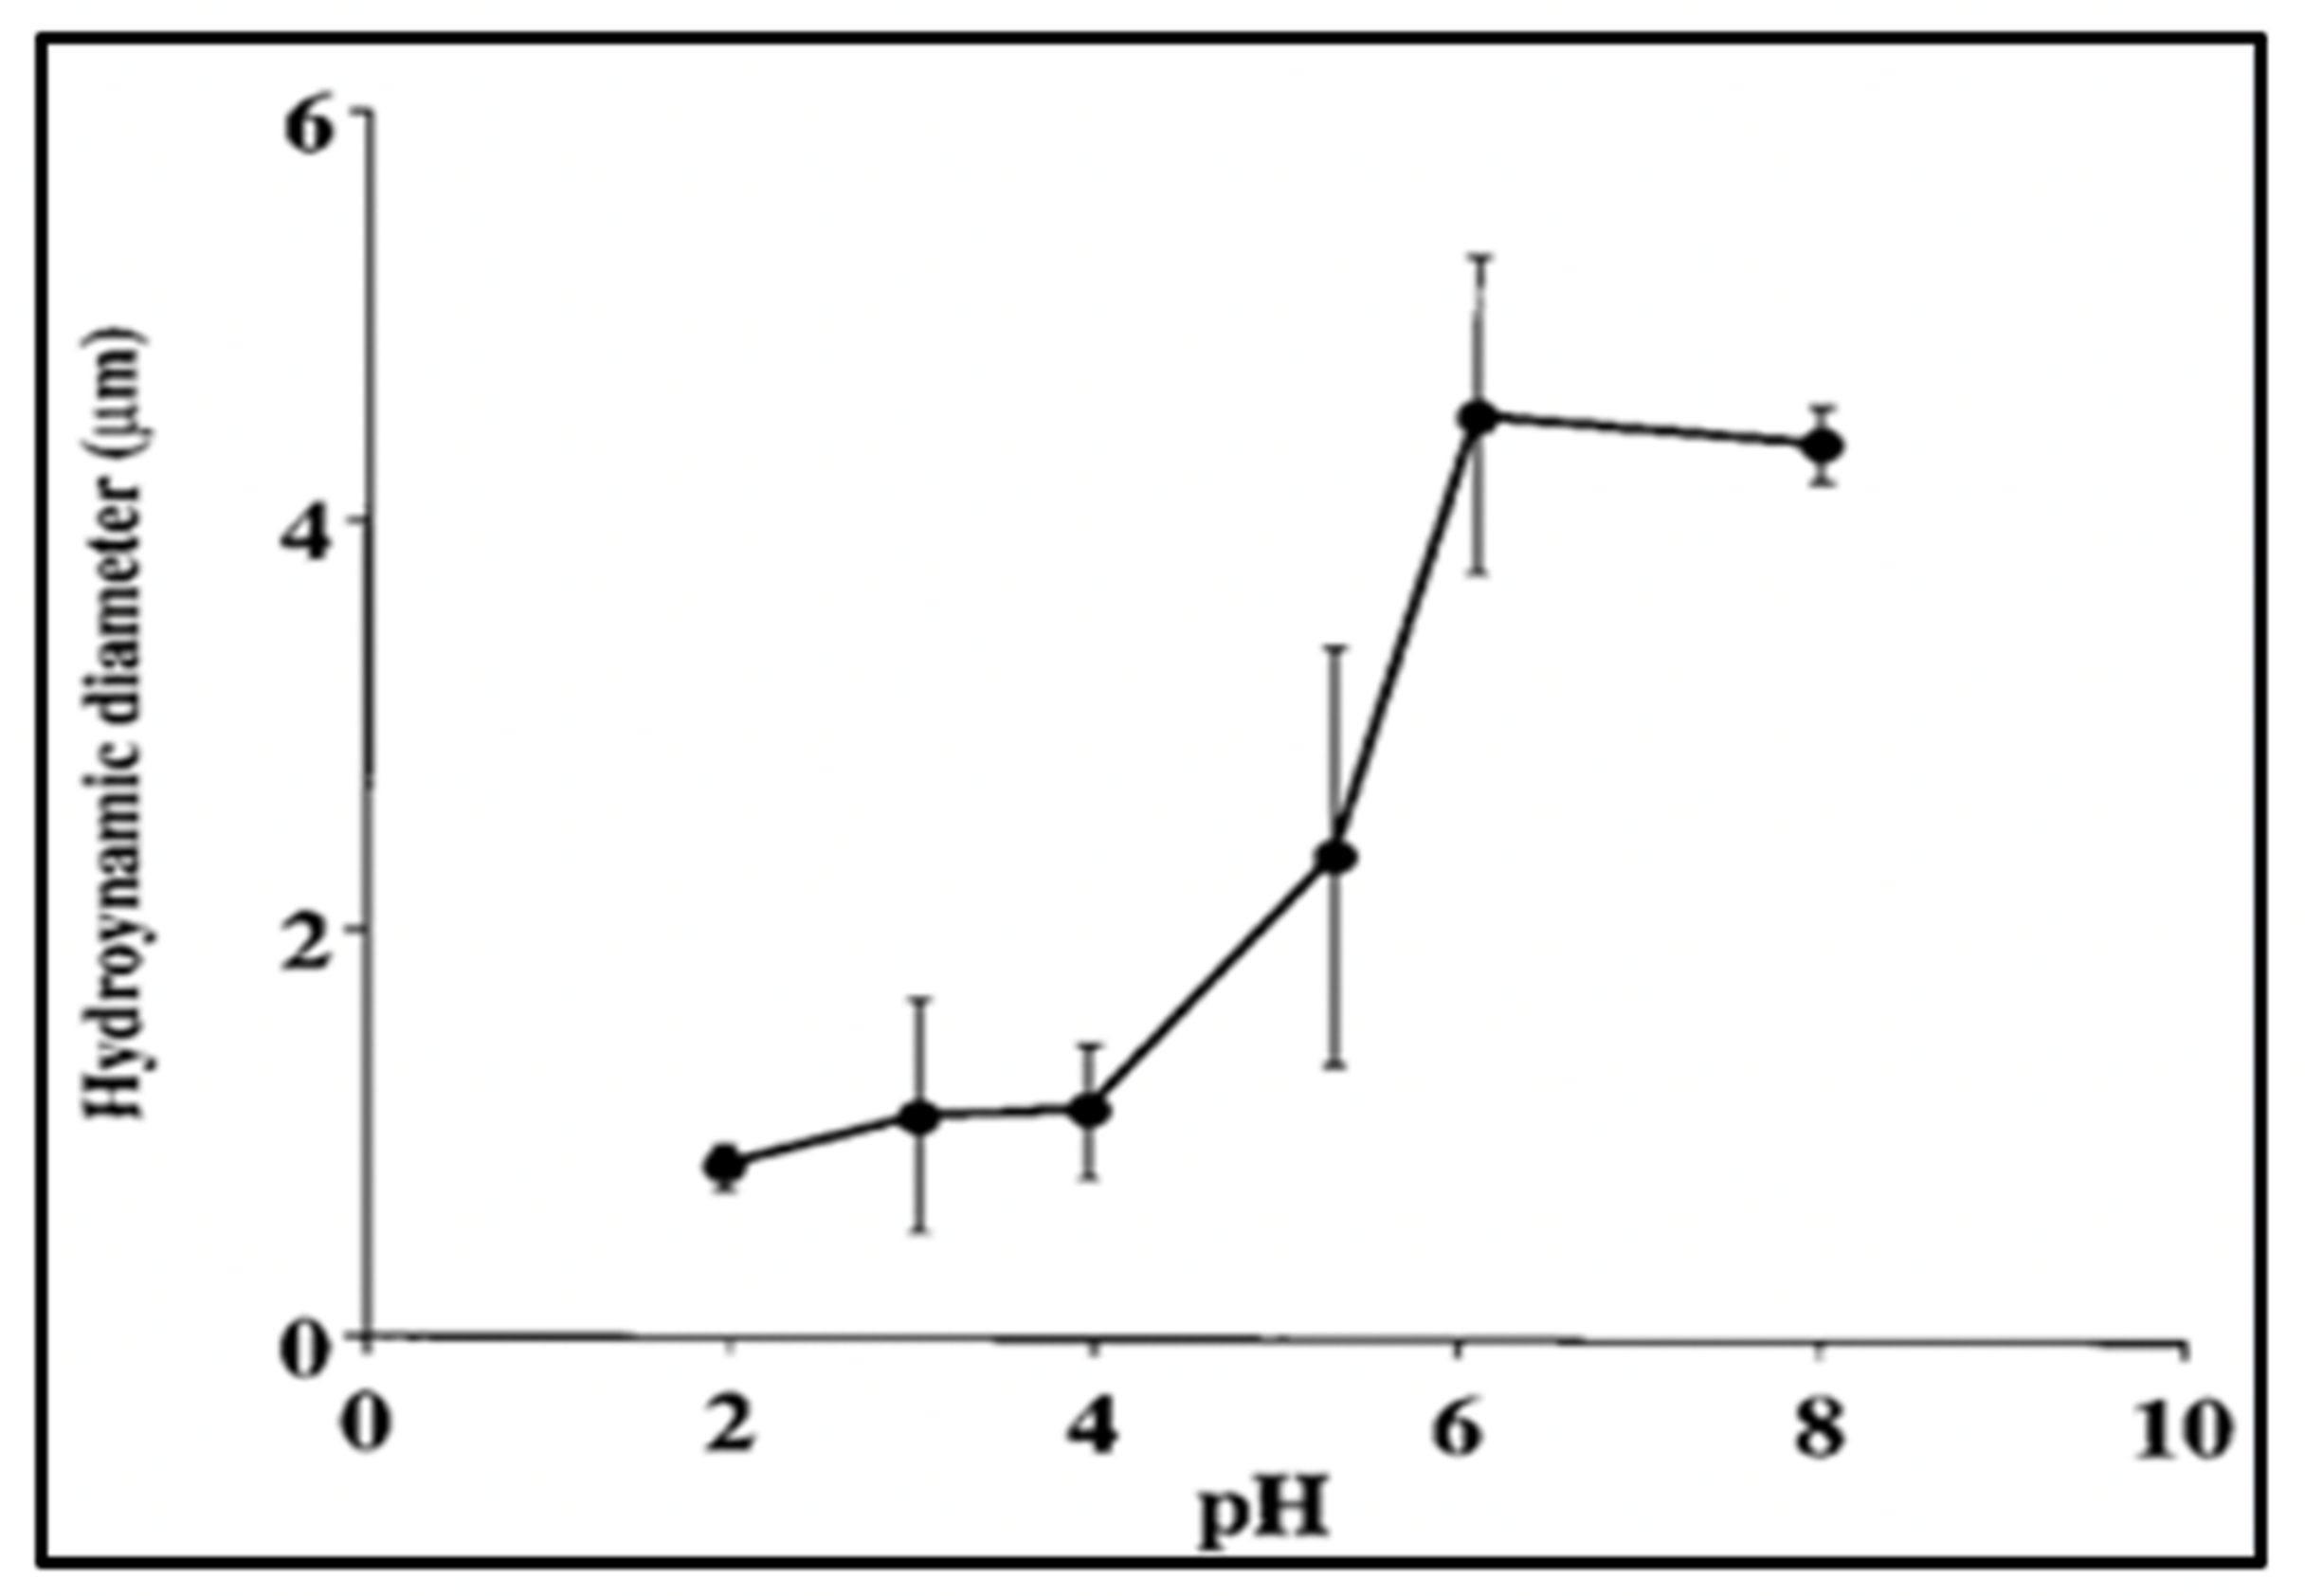
Figure 20.
pH-induced phase transition of MG. Notice that this transition occurs within the same range as the expected pKa (4.5–5) of carboxylic groups of DOM. Each point corresponds to the average ± SD of five measurements.
Figure 20.
pH-induced phase transition of MG. Notice that this transition occurs within the same range as the expected pKa (4.5–5) of carboxylic groups of DOM. Each point corresponds to the average ± SD of five measurements.
Figure 21.
Typical results of MGs detection by flow cytometry—in closed red circles—and fluorescent quenching method—in open green circles. MG was fluorescently tagged with Chlortetracycline (CTC) that labels bound Calcium present in MG. Notice that the concentration of MG follows very closely the concentration of DOM MBP, which is the feedstock for self-assembly. Notice also that while CTC colorimetric method allows flow cytometry to count MG, and to image gels by fluorescence microscopy, it does not allow measurements of reduced organic carbon in MG.
Figure 22.
These images illustrate the advantage of using computer-processed thin sections of confocal imaging to eliminate out-of-focus image noise and precisely count the number of MB per section of gel. In here MG were labeled with CTC (λem = 560 nm), and MB labeled with BacLigh-Red
TM (λem = 644 nm). Insert (
a) is a raw fluorescence image across the whole gel labeled with both CTC and BacLigh-Red
TM. Notice that that despite double fluoresces labeling, imaging across the whole MG does not allow to distinguish bacteria. Insert (
b) shows a 300 nm thin gel section where bacteria can be readily observed. The corresponding 3D plots of contrast ratios of BacLigh-Red
TM are in (
c) and (
d). Notice that the thin section in (
d) shows both the perimeter of the MG depicted by CTC fluorescence and the number of MB which can be identified by the sharp contrast peaks of BacLight fluorescence. It allows serial section tomography software, developed in our laboratory [
29], to readily quantitate bacteria lodged inside MGs, avoiding double-counting by defining the specific x-y coordinates of every peak in each thin section.
![Gels 07 00136 g022]()
Figure 23.
Panel (a) shows ~20 MB—labeled with BacLigh-RedTM, found inside an ~100 μm2 by 300 nm deep thin section of a MG, labeled with CTC. Panel (b) illustrates an equivalent field in the same preparation showing free MB—outside the MG—retained on top of the 0.2 µm pore filter. The bar = 10 µm.
Figure 23.
Panel (a) shows ~20 MB—labeled with BacLigh-RedTM, found inside an ~100 μm2 by 300 nm deep thin section of a MG, labeled with CTC. Panel (b) illustrates an equivalent field in the same preparation showing free MB—outside the MG—retained on top of the 0.2 µm pore filter. The bar = 10 µm.
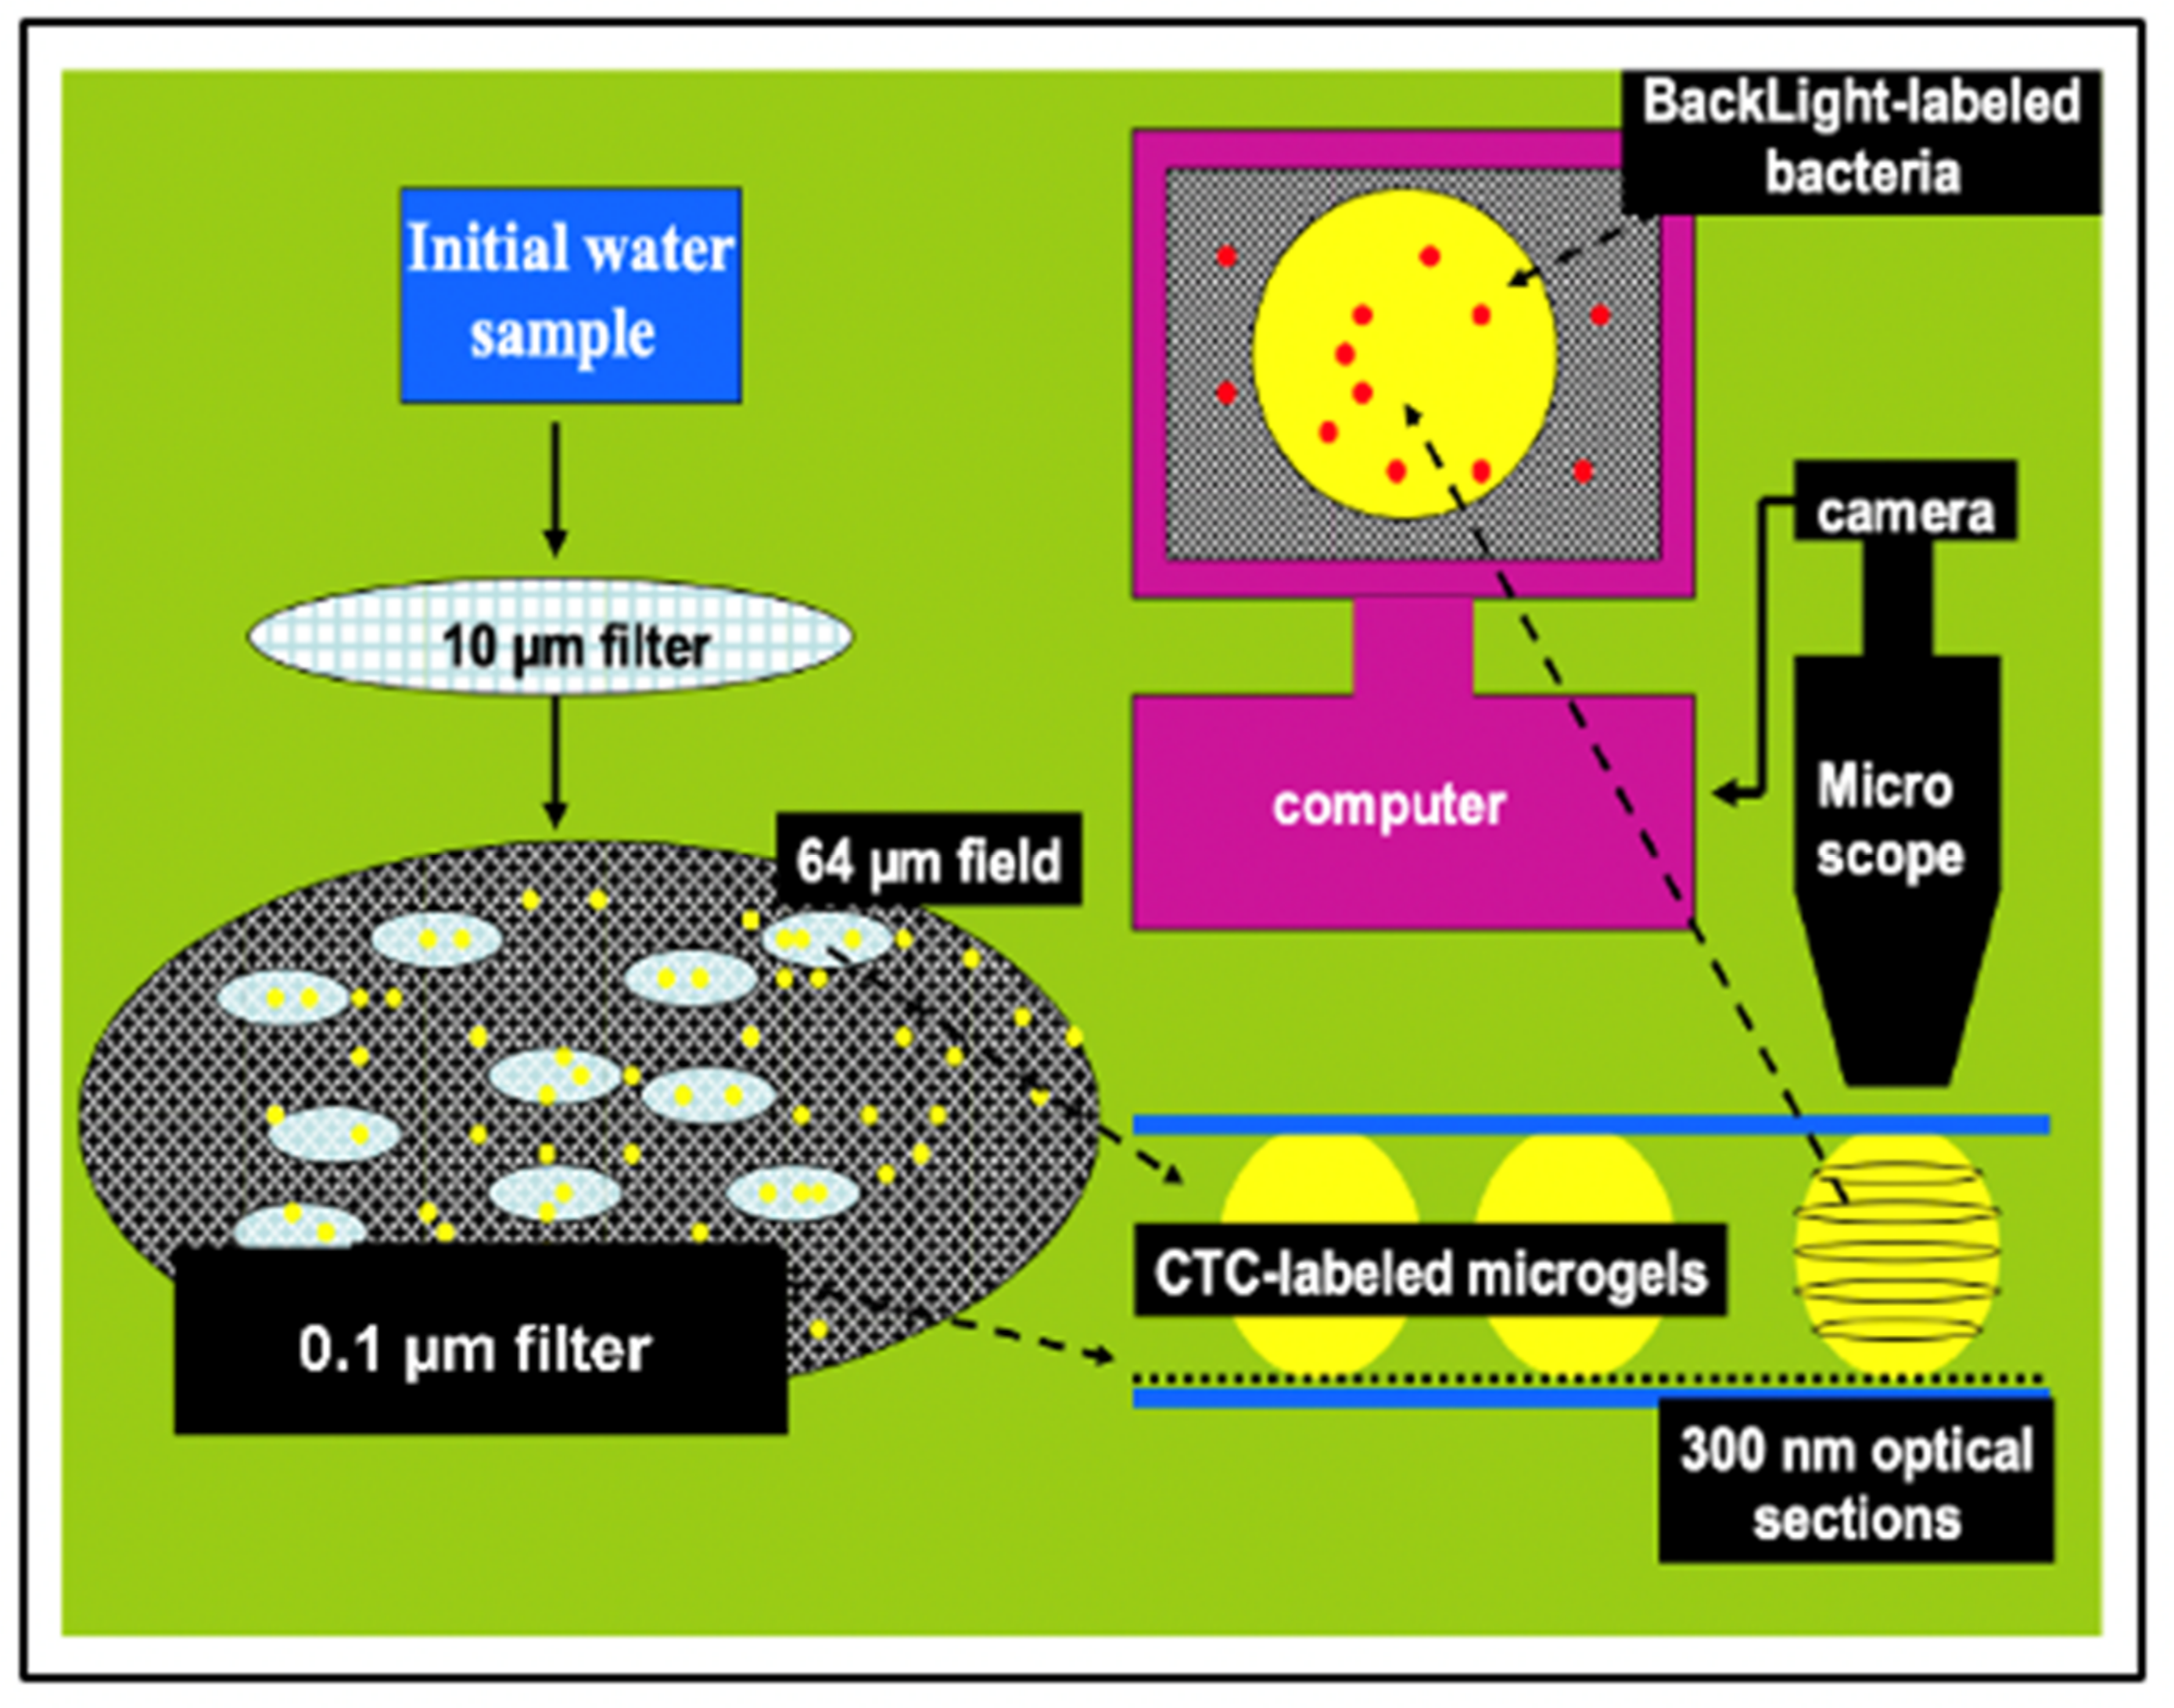
Figure 24.
This is an illustration of the method we implemented to count and measure the volume of MG, and count free MB and MB lodged inside MGs. Aliquots of 100 mL of SW are inoculated with: 1 mM sodium azide to arrest bacterial growth; 10 mM BacLigh-Red
TM (λex = 581 nm, λem = 644 nm) to label bacteria; and 100 μM chlortetracycline (CTC) (λex = 374 nm, λem = 560 nm) to label MG (
Figure 12). SW is first pre-filtered at 15 µm to retain larger particulate material. The filtrate is then filtered at 10 cm Hg vacuum pressure through a 0.1 µm black Nucleopore
® filter that retains both MB and MGs. The black filter is then set between two coverslips suspended by 4 µm microspheres to avoid compressing the MGs. This preparation is then positioned in a Nikon inverted fluorescence microscope with MCR-600 BioRad series laser scanning confocal imaging to perform thin sections tomography of MGs. Counting of both MGs and free bacteria found on top of the filter—outside MG—is conducted in randomly selected fields of ~65 µm diameter. The average ± SEM counts of free bacteria and gels found in 20 fields are scaled to the total diameter of the filter to report the total of free bacteria and MGs found in the 100 mL aliquot of SW that passed through the filter. Tomographic thin sections of ~300 nm of MGs are imaged at 2000× magnification and serially sampled at 1 µm spacing. MG volume is reconstructed by the computer based on the volume of thin sections over the whole serial stack. Bacterial count is performed by tomographic software based on the number of peaks found in 3D plots of contrast ratios of BacLigh-Red
TM emission (See
Figure 22). In these assays, concentration MB in MG is based on averages ± SEM of counts in 3 to 5 tomographic sections per MG in randomly selected MGs found on five filters per sample.
![Gels 07 00136 g024]()
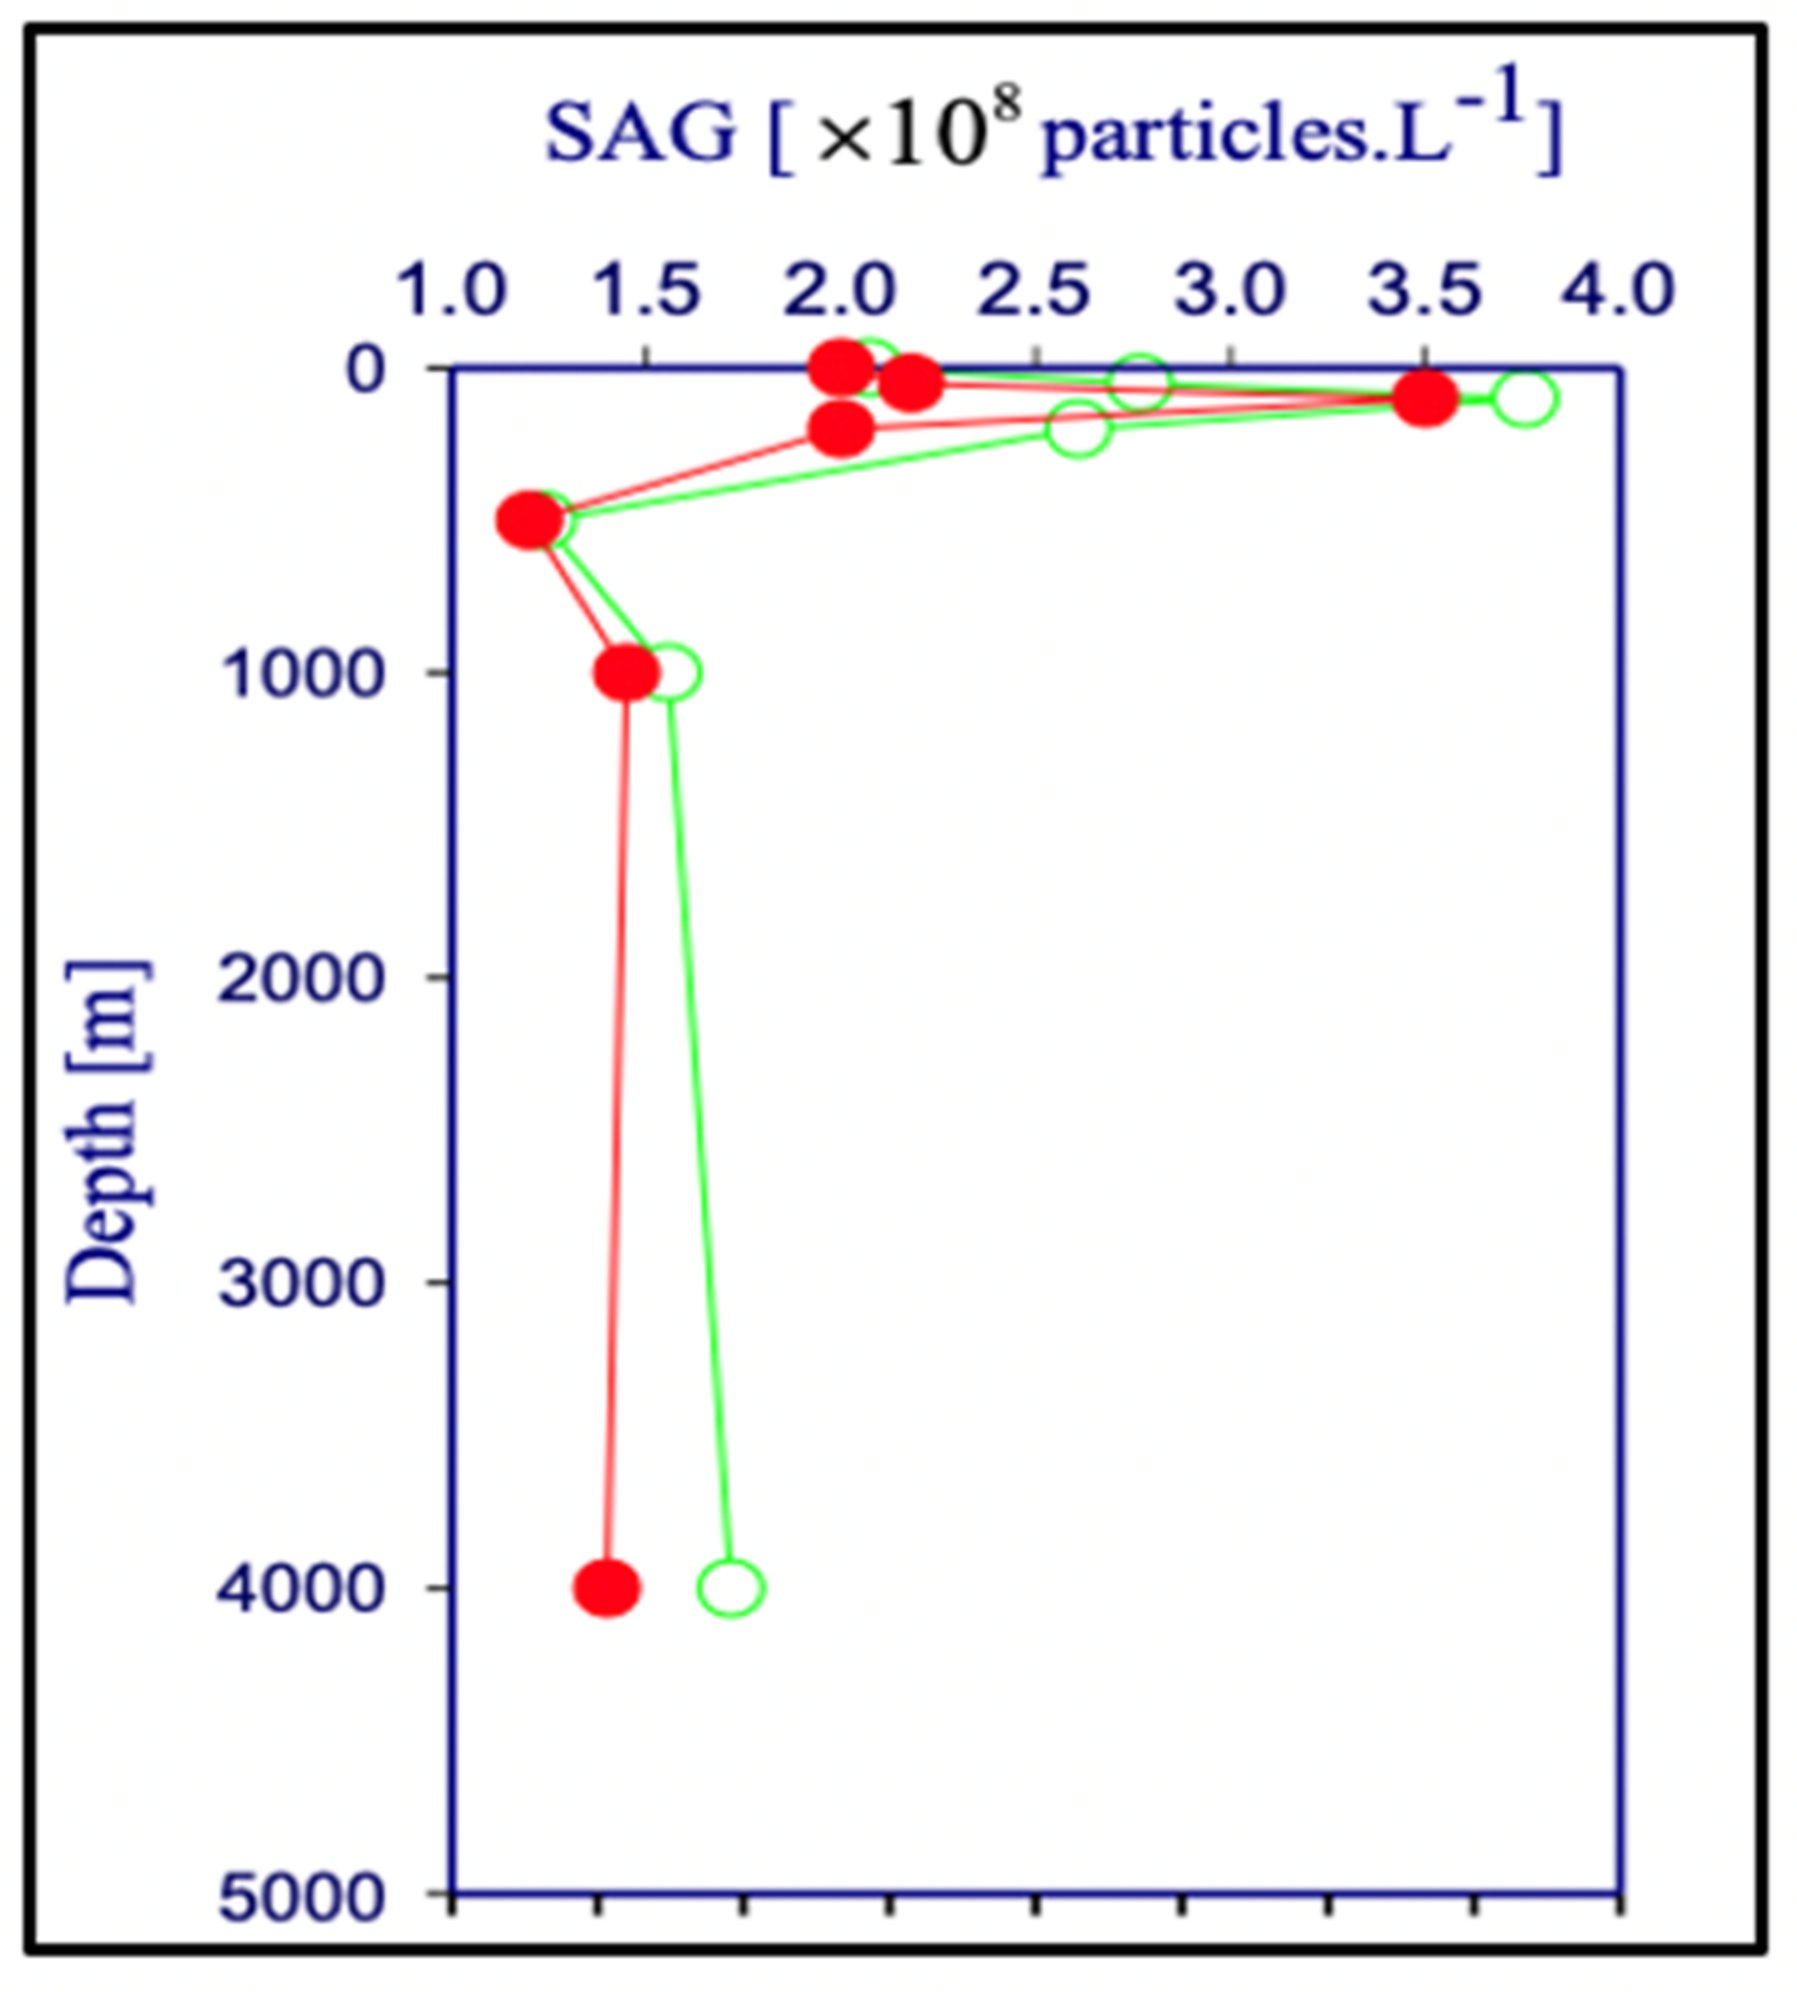
Figure 25.
Images of four fields captured at 1200× magnification, covering 60–80 μm2 each were randomly selected and recorded in each of five filters containing fluorescently labeled gels and bacteria found in the surface, 10, 50, and 100 m deep seawater samples. These images yielded 105 data sets reporting the count of MG and free MB found in each of the fields. These numbers were then averaged and scaled to the 78 mm2 areas of the filter to render the concentration of bacteria in seawater ([MB]SW = ΣBSW × mL−1 SW) and the SW gels concentration ([MG] = ΣMG × mL−1 SW) found in the 100 mL of seawater that passed through each filter. The volume of each MG (VMG) was calculated from the area and thickness of each serial optical section and the number of sections in the stack.
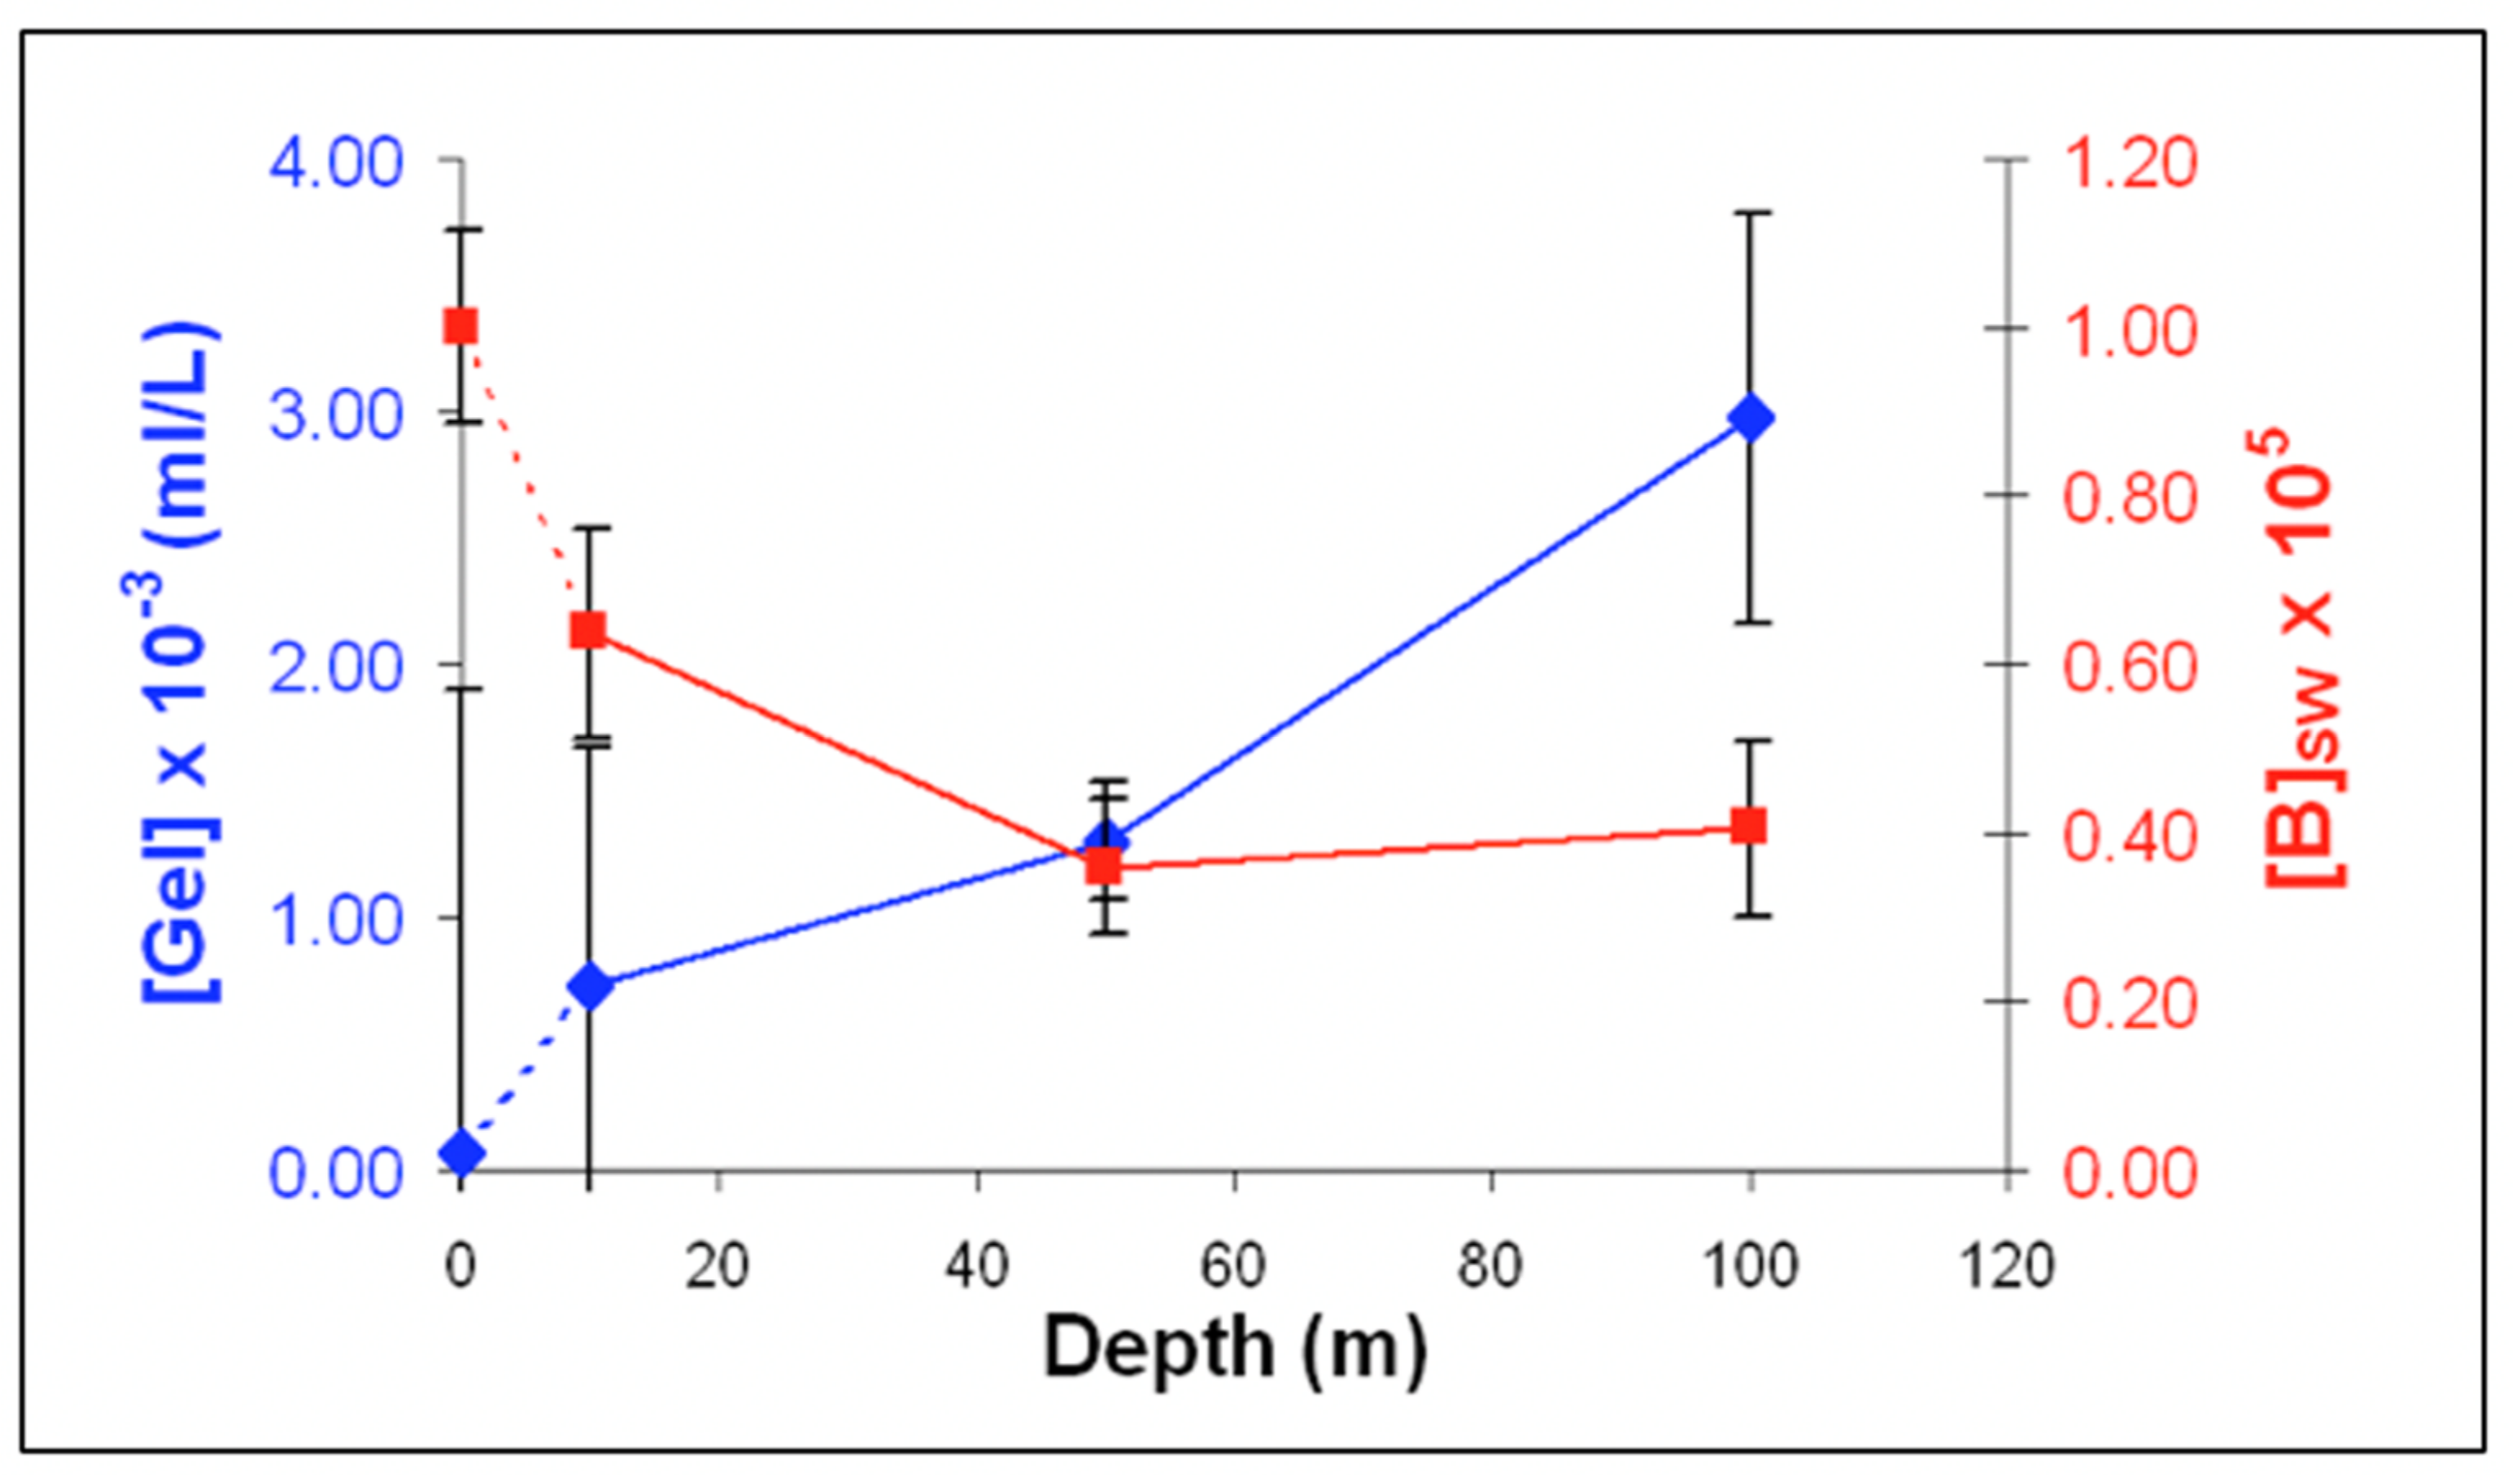
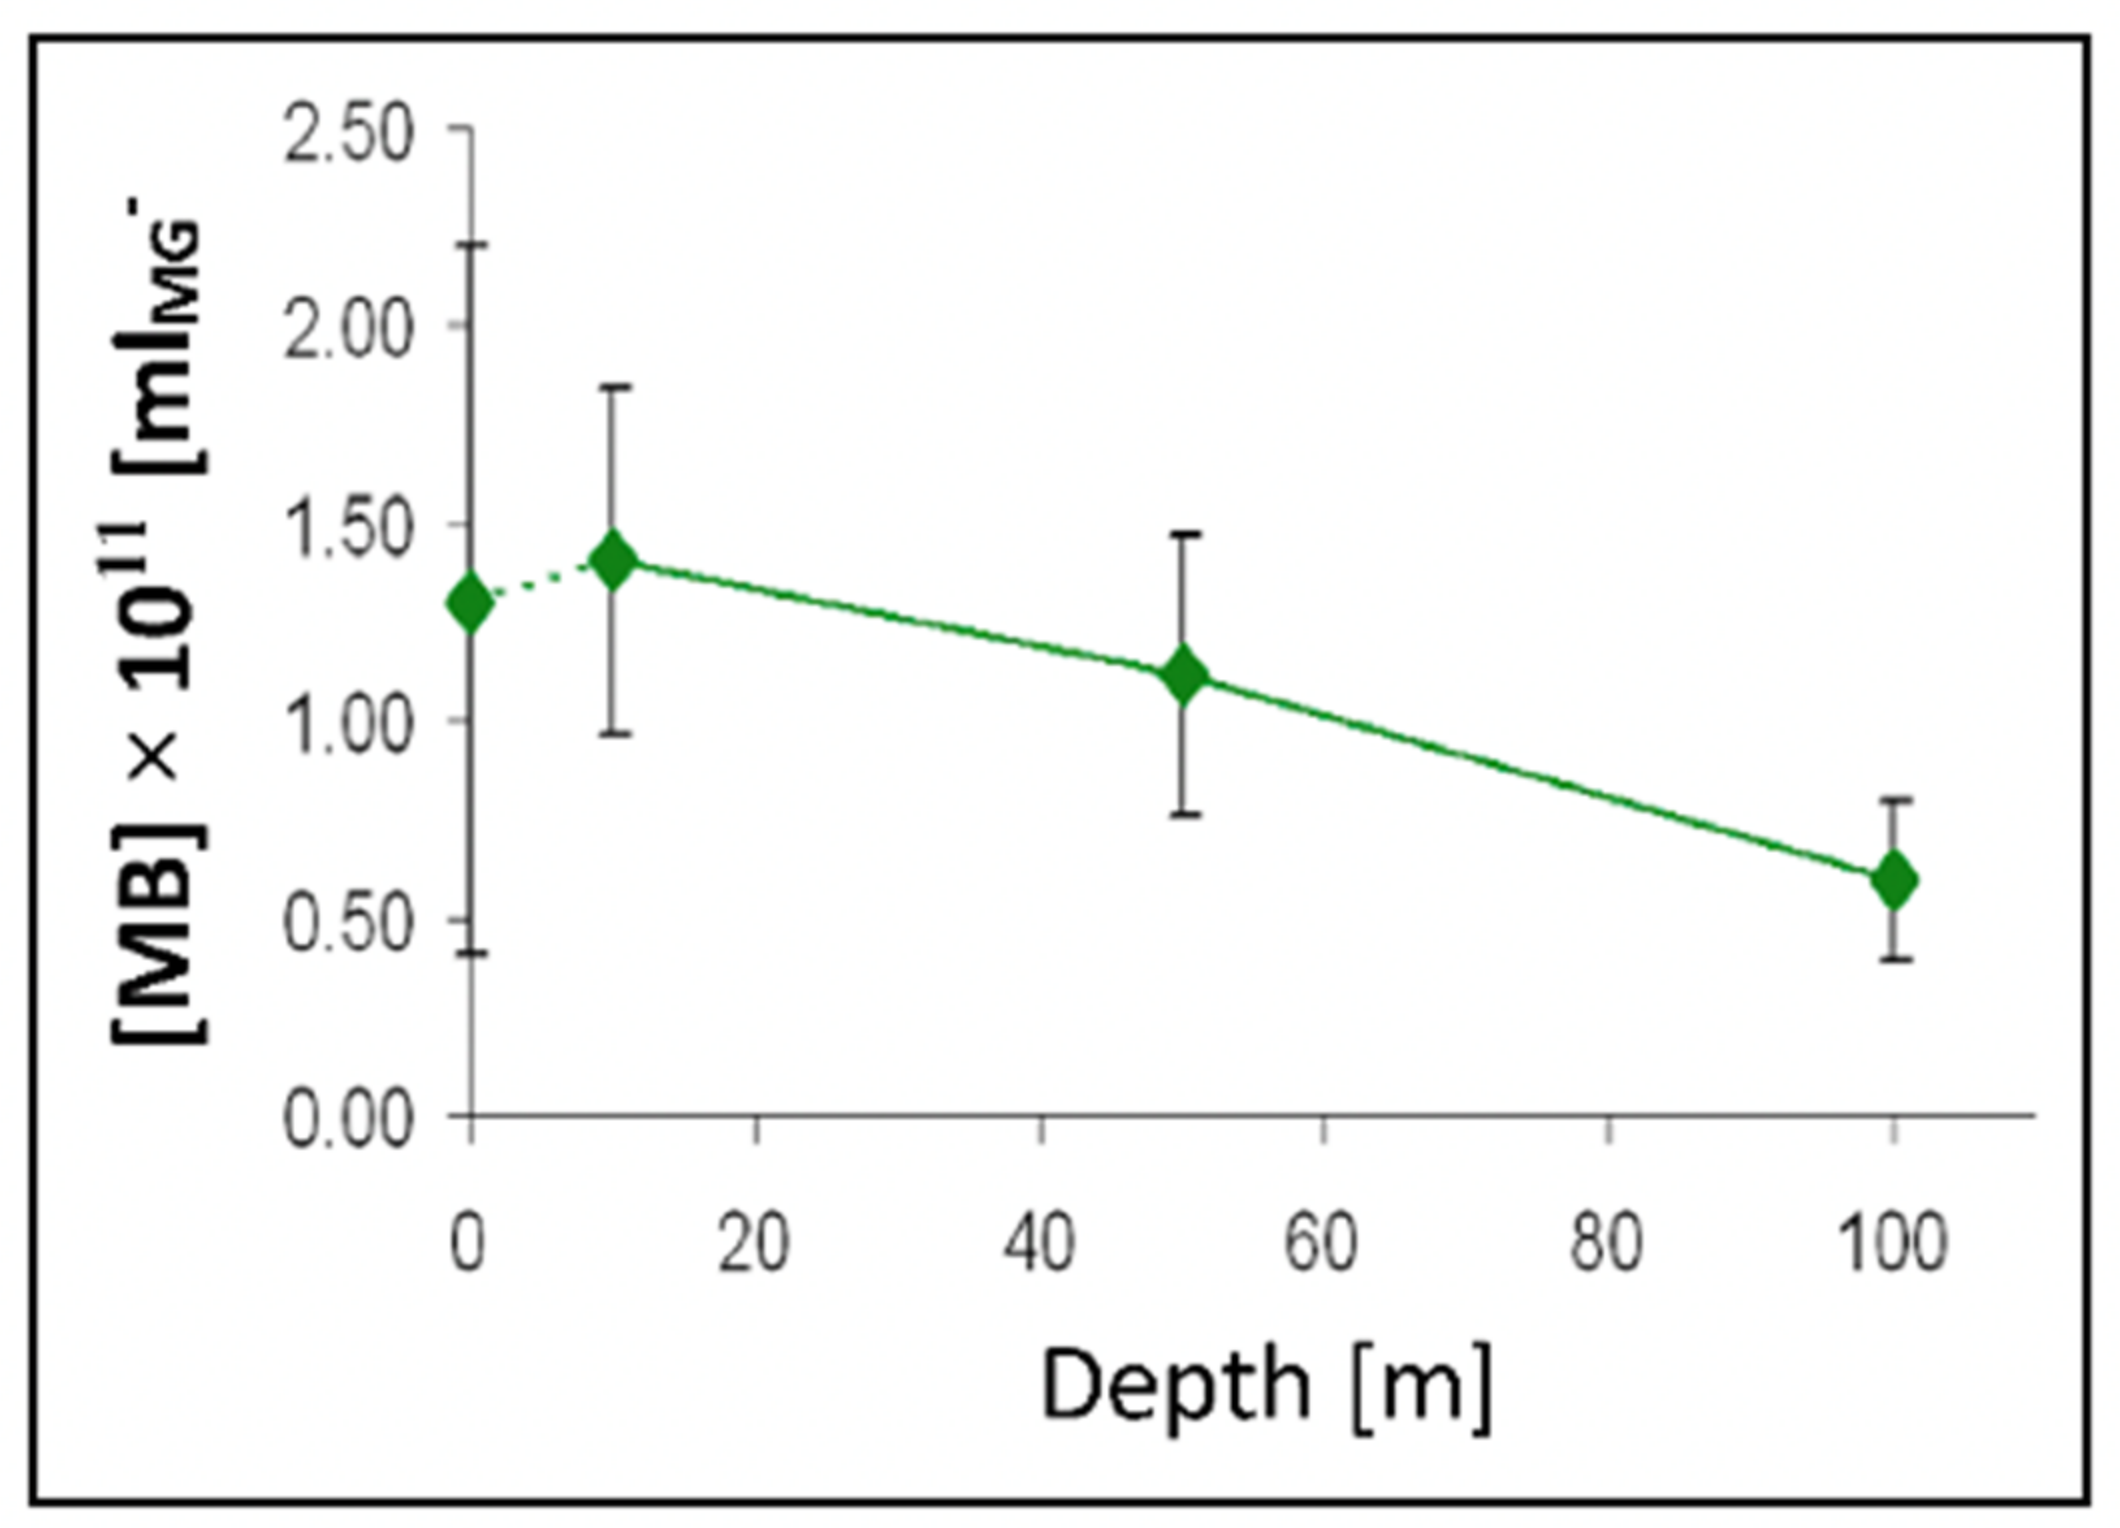
Figure 26.
The concentration of [MB]MG lodged inside MG ranged from 0.6 to 1.4 × 1011 MB × mL−1 SW. It is more than five orders of magnitude higher than the concentration of free [MB] in SW. Points are the average ± SD. of 72 sections in 12 microgels collected in each of two samples per depth.
Figure 26.
The concentration of [MB]MG lodged inside MG ranged from 0.6 to 1.4 × 1011 MB × mL−1 SW. It is more than five orders of magnitude higher than the concentration of free [MB] in SW. Points are the average ± SD. of 72 sections in 12 microgels collected in each of two samples per depth.
Figure 27.
Nine 100 mL samples of 0.2 μm-filtered seawater were incubated for 144 h. to produce self assemble gels. Each sample was then inoculated with bacteria isolated by filtration from seawater collected from the dock of Friday Harbor Laboratories and incubated at 10 °C. MB growth was then sequentially arrested in samples 1 through 9 every 80 min by exposure to 1 mM NaN3, and fluorescently tagged with CTC to label MG and BacLight Red to label MB. Each sample was then immediately filtered using 0.1-μm black Nucleopore filters. Filters were mounted in a Nikon fluorescence confocal microscope. Images of four fields captured at 1200× magnification, covering 60–80 μm2 each were randomly selected and recorded from each filter containing fluorescently labeled gels and bacteria found on the surface of the filter. MB lodged inside gels were counted in 300-nm confocal sections of MG. The points are the average ± SD of 256 sections in 16 microgels collected in each filter. Although the concentration of bacteria in seawater remained at ~2 × 10⁶–9.2 × 10⁶ bacteria × mL−1, within few minutes the concentration of bacteria inside microgels equilibrated with the bacterial concentration in seawater and then increased exponentially with time from ~2.8 × 10⁶ bacteria × mL−1 of gel to ~2.7 × 10⁹ bacteria × mL−1 of gel. Points are the average ± s.d. of 36 sections in 12 microgels collected in each of the nine filters corresponding to successive 80 min arrest of bacterial activity.
![Gels 07 00136 g027]()
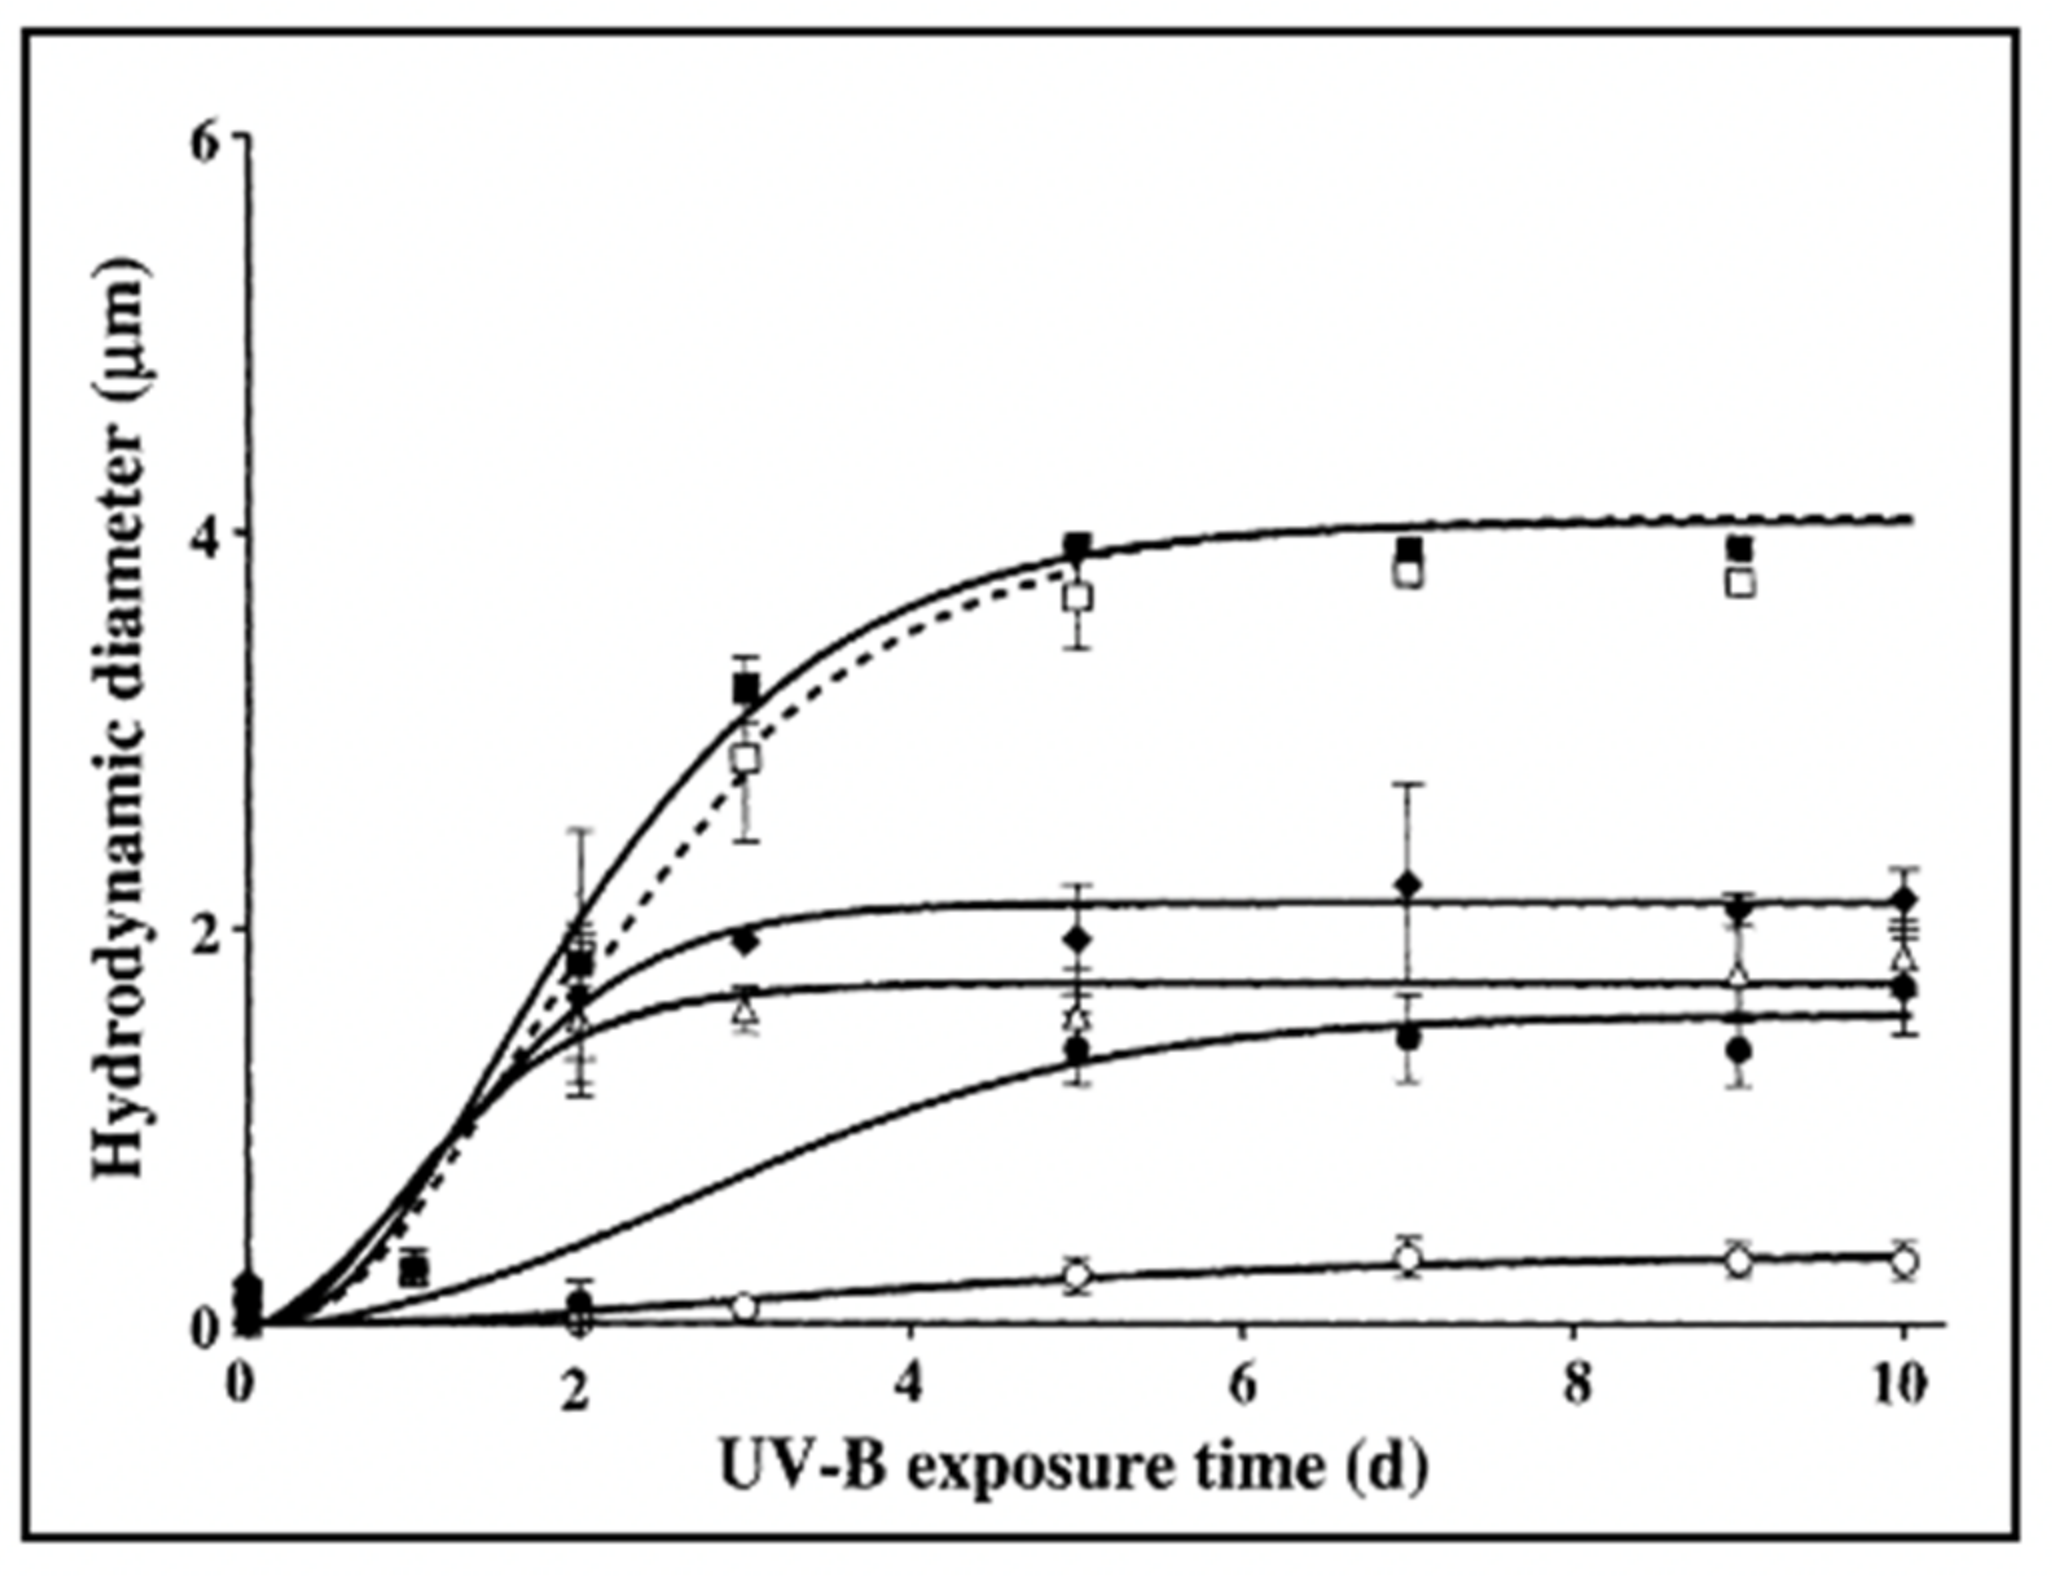
Figure 28.
In these experiments, six aliquots of 0.2 μm-filtered SW were UV irradiated for a progressively longer time, and then DOM was set to self assemble under continuous monitoring of particle size Dynamic Laser Scattering. Control not irradiated DOM (filled squares) or irradiated for 24 h at 10 W m
2 with UV-A light (λ = 230–400 nm (open squares). Samples of DOM irradiated at 500 mW m
2 with UV-B (λ = 280–315 nm) for 30 min (filled diamonds) 1 h (open triangles) 6 h (filled circles) or 12 h (open circles). Results reveal that the DOM polymer assembly in non-irradiated or samples by UV-A follows the typical second-order kinetics described in Chin et al. [
2]. However, as UV polymer cracking of DOM polymers increases with time of exposure to UV-B, DOM assembly and gel formation slow down, equilibrium size of the microgels size decreases, and finally, assembly virtually fails in DOM exposed to UVB for 12 h. Data points correspond to the mean ± s.d of 30 DSL measurements.
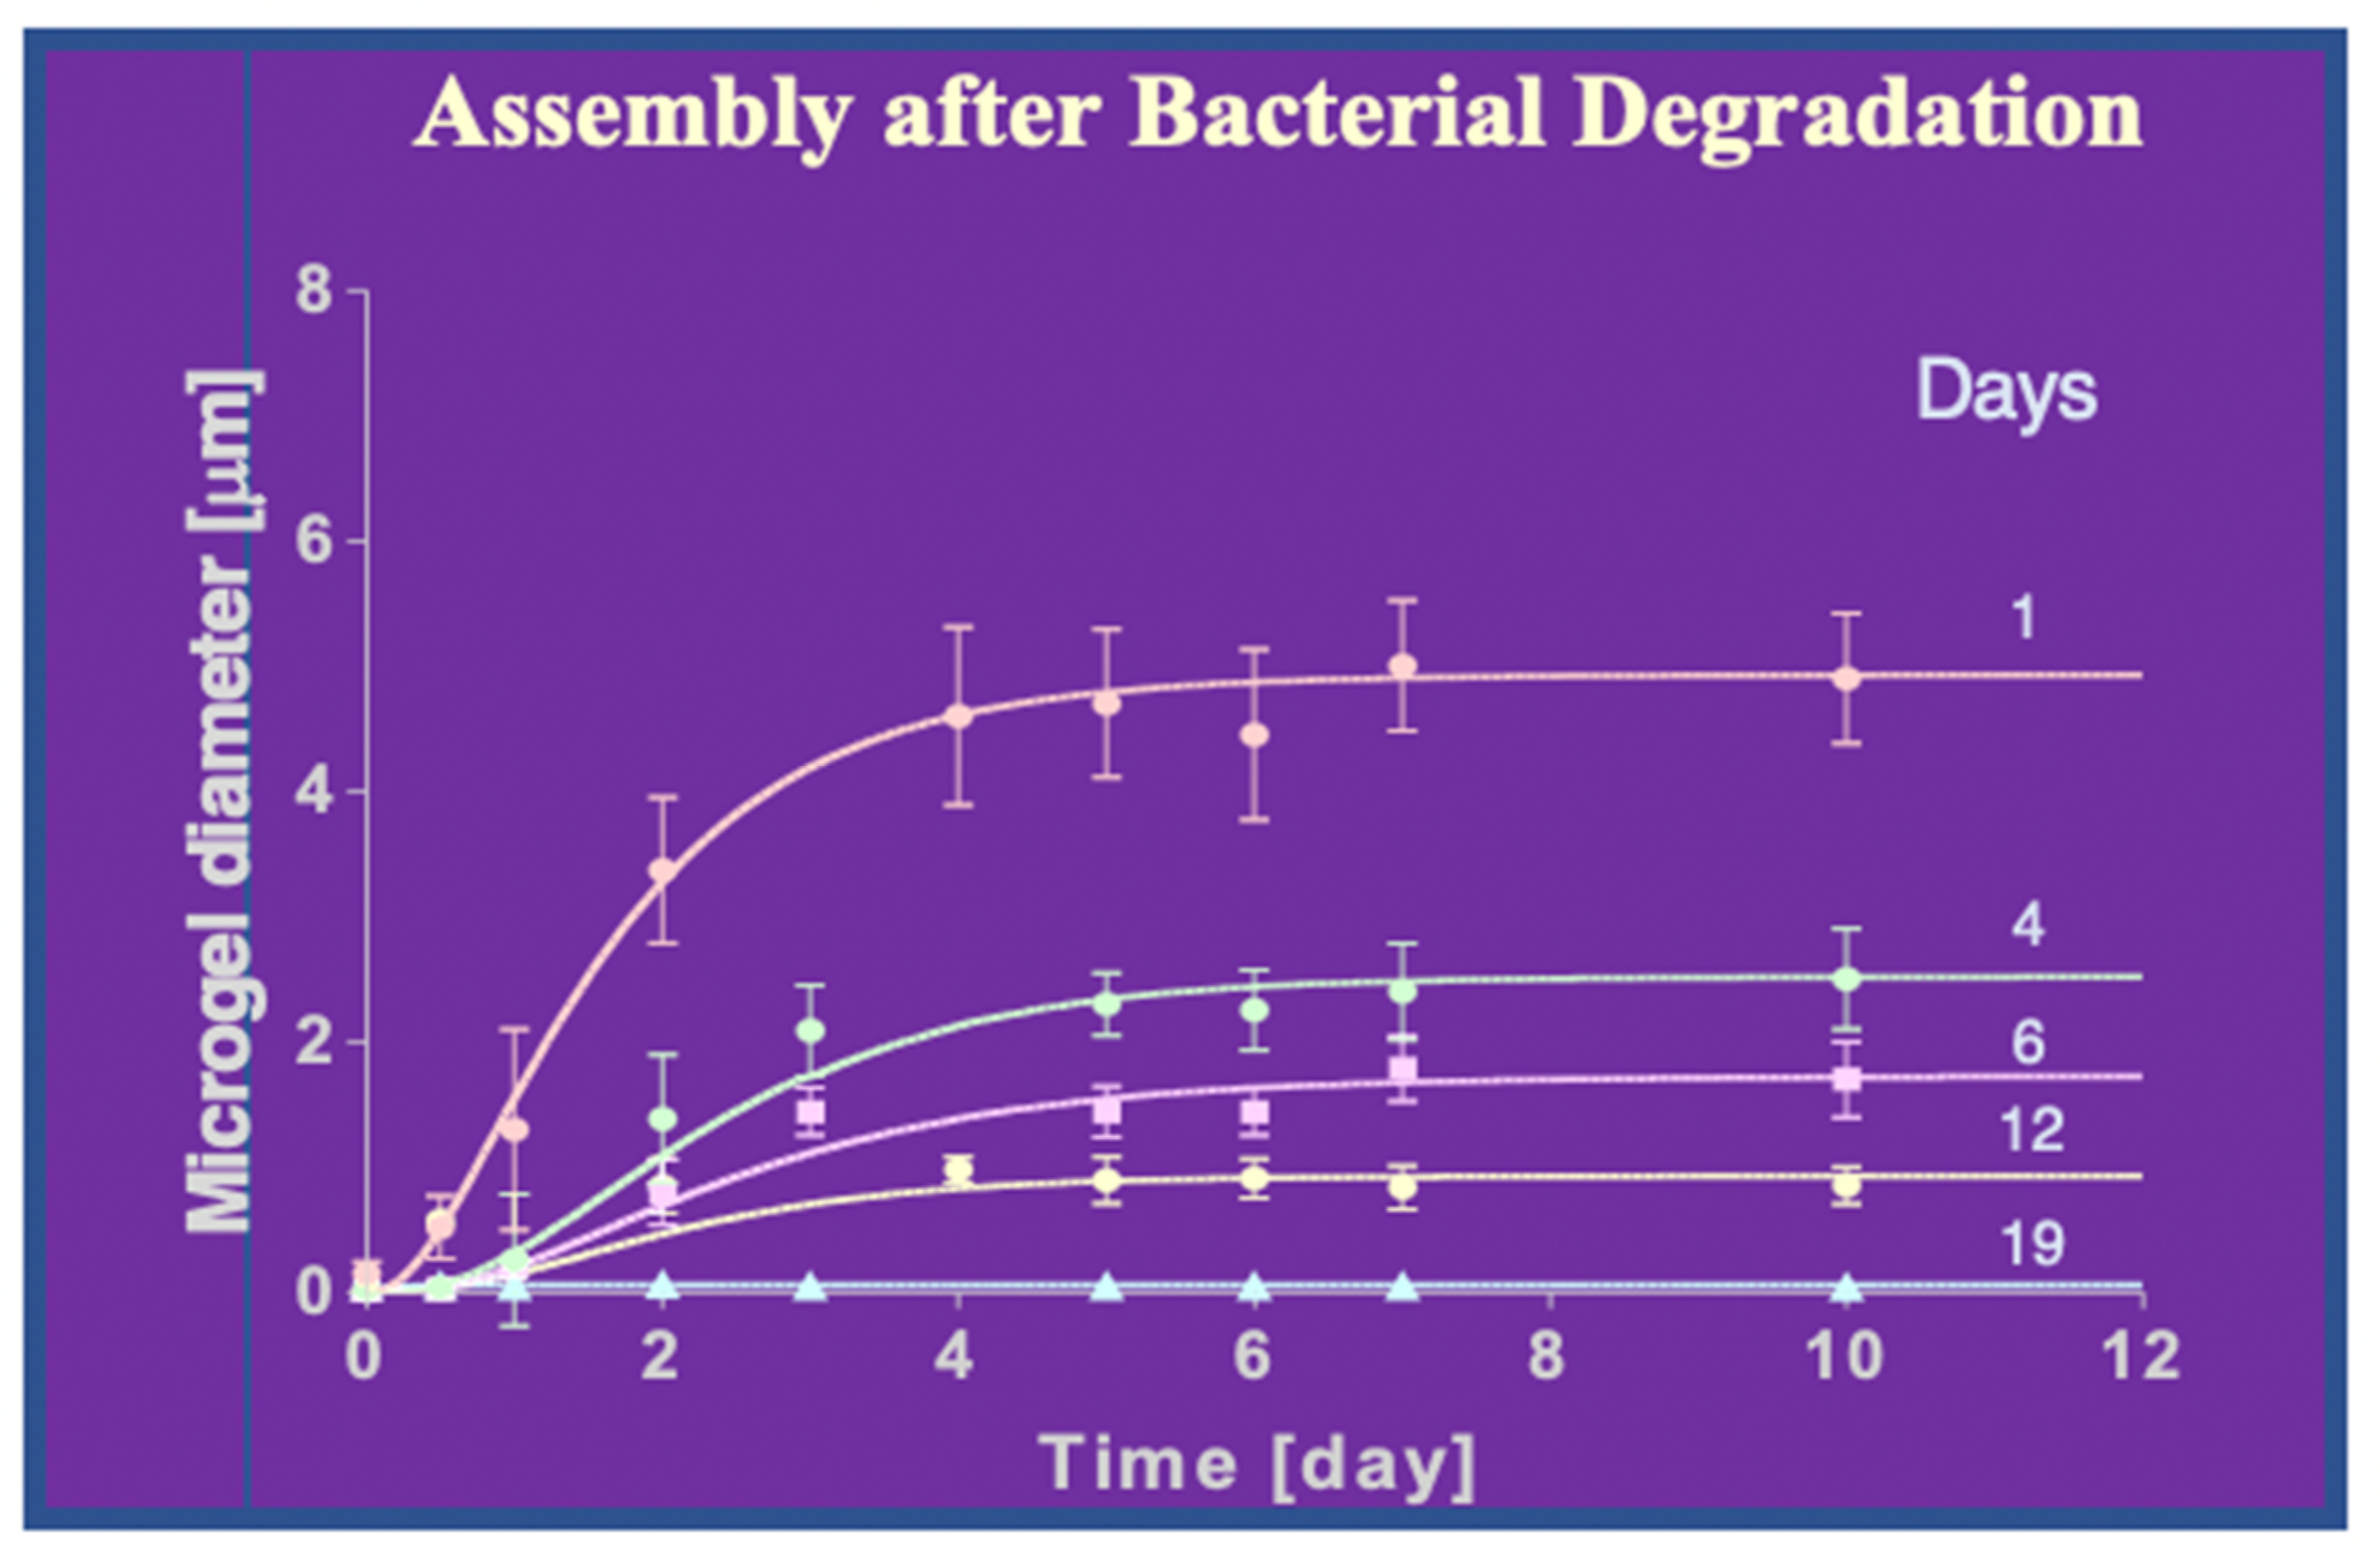
Figure 29.
Bacterial cleavage of DOM results in progressive compromise of MBP self-assembly. The protocol for these assays is described above. Data points correspond to the mean ± S.D of 18 DSL results.
Figure 29.
Bacterial cleavage of DOM results in progressive compromise of MBP self-assembly. The protocol for these assays is described above. Data points correspond to the mean ± S.D of 18 DSL results.
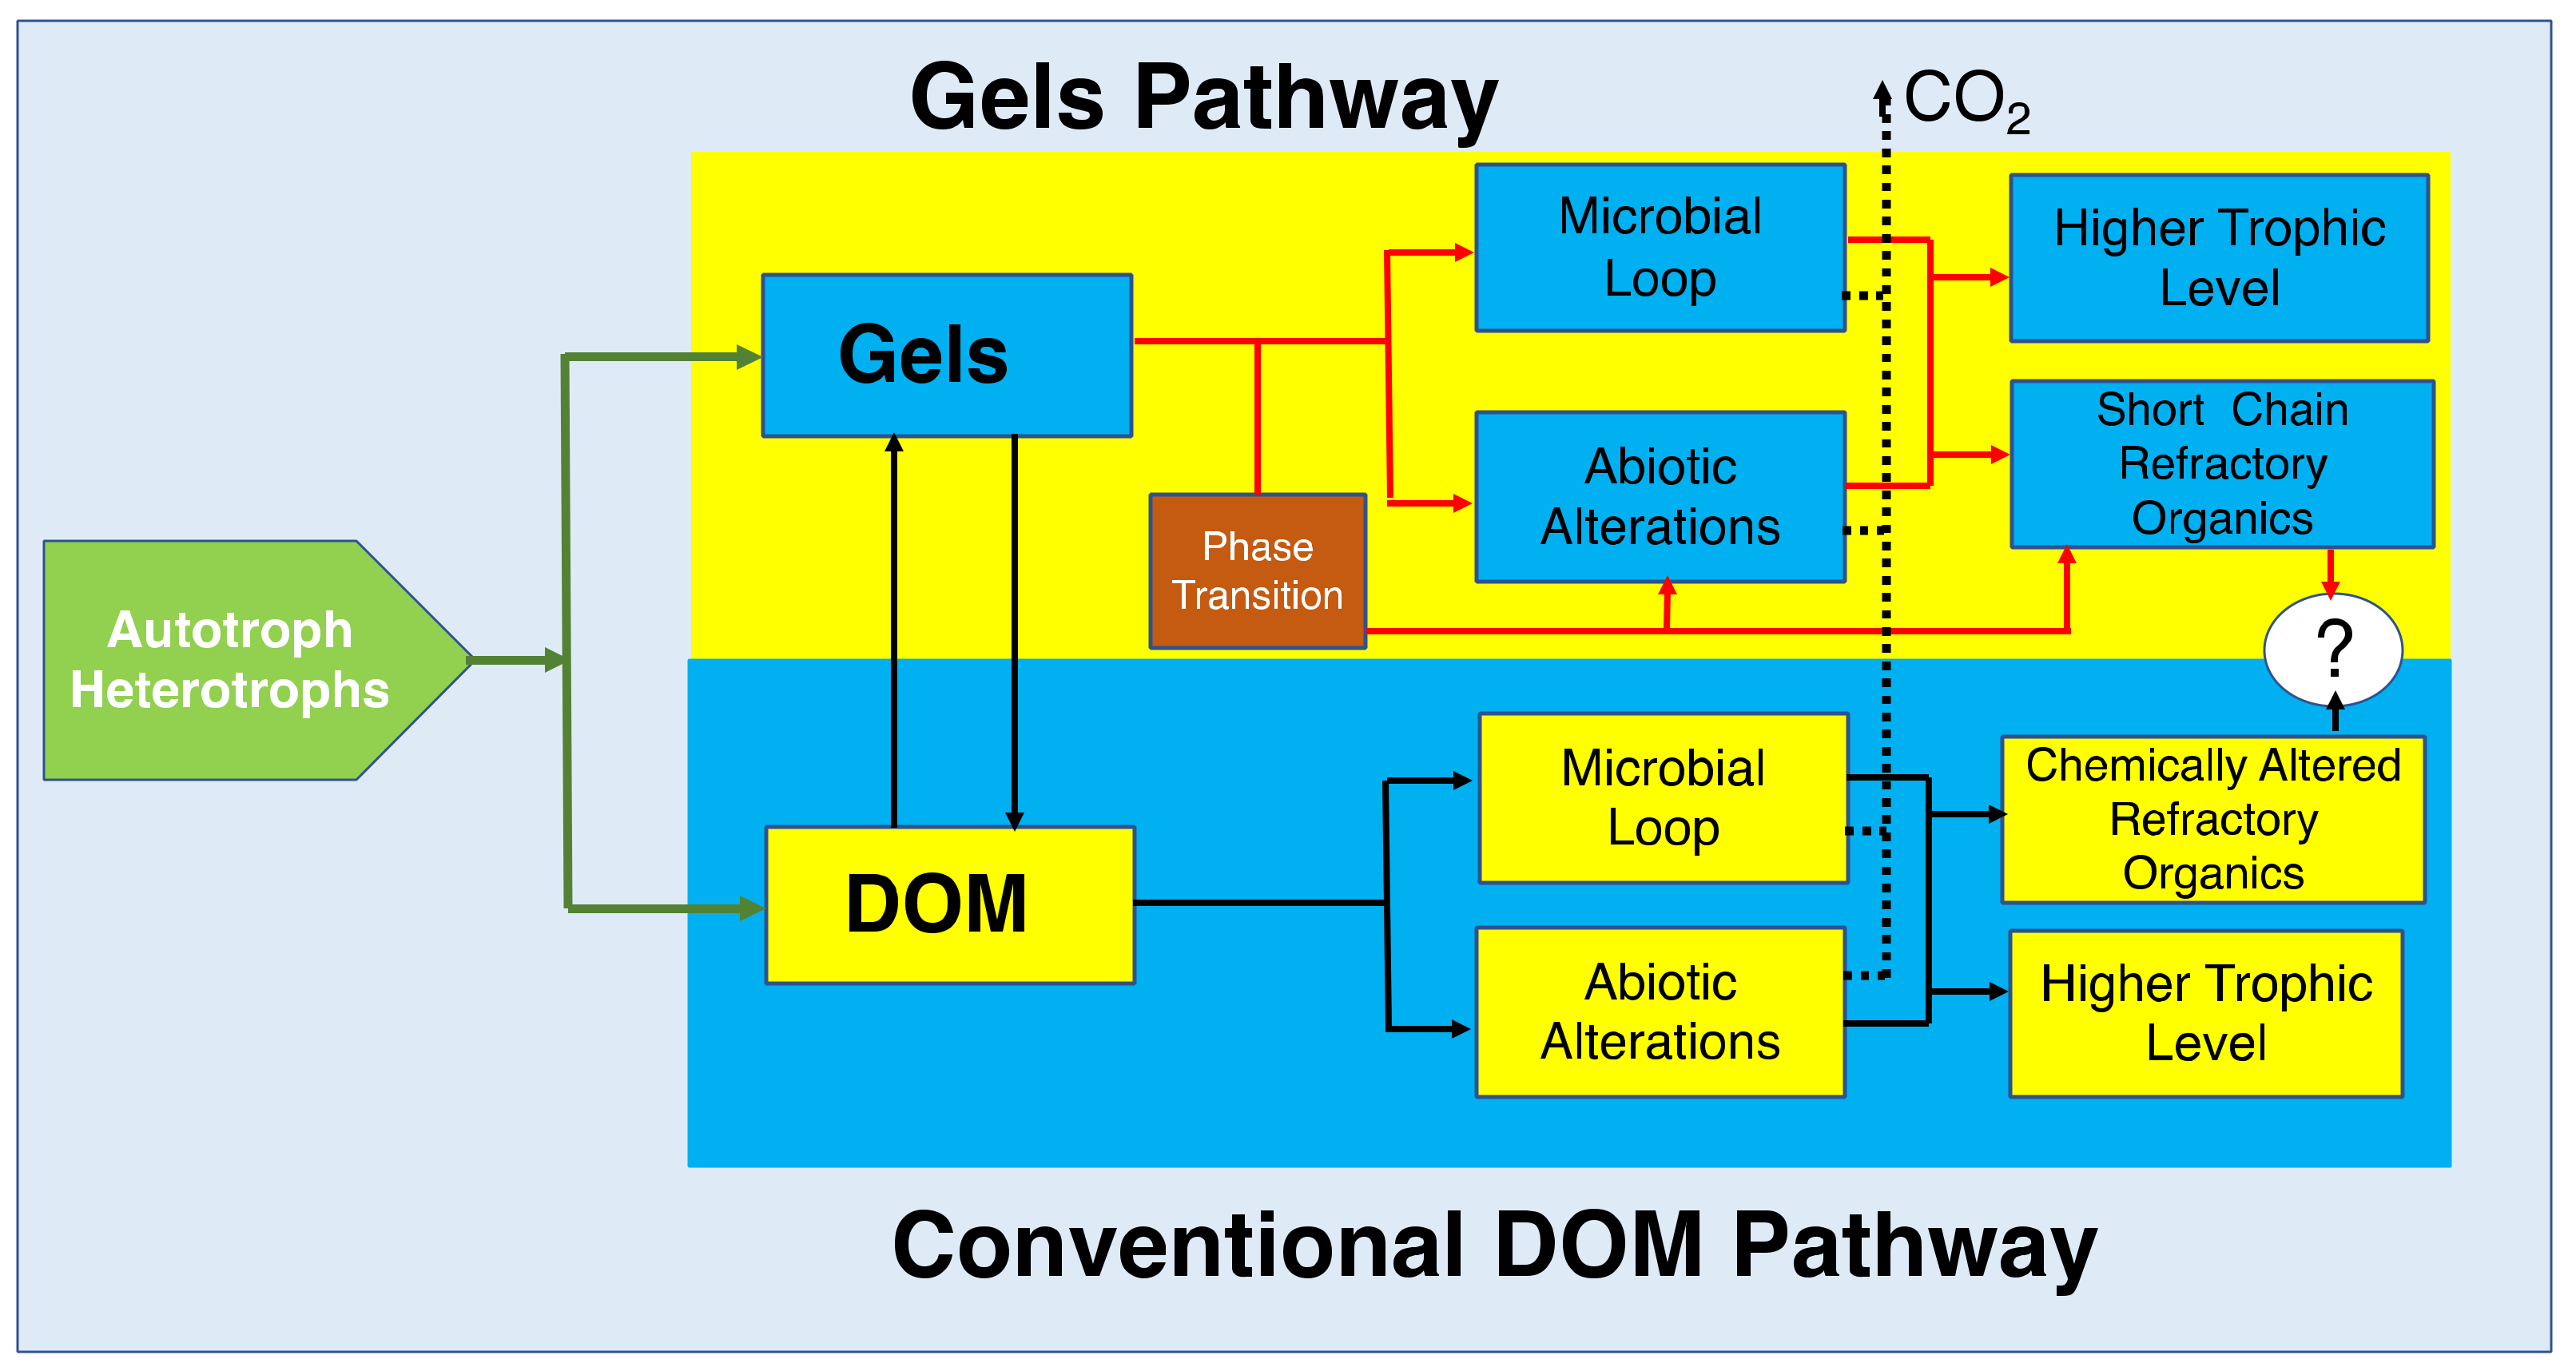
Figure 30.
Molecular reduced-organic-carbon-carriers probably have multiple ways to move up through the marine consumer’s conveyor. Two hypothetical pathways are illustrated here; one that postulates that DOM becomes directly available to marine bacteria primarily based on their molecular weight. The other proposes that bacteria feed primarily in marine gels made of large HMW moieties. According to the DOM hypothesis, the pass for moieties to become refractory is by potential chemical alterations that make these molecules resistant to bacterial enzymes. The Gel pathway hypothesis postulate that, while there are chemically altered species in SW, refractory molecules are simply those too large to be metabolized by bacteria and too small to self assemble. Implicit in this statement is the notion that marine gels are necessary and probably sufficient to drive carbon flux dynamics in the ocean.

