
Fabrication and Characterization of Poly (vinyl alcohol) and Chitosan Oligosaccharide-Based Blend Films

 , ,
, ,  , , , and
Abstract
1. Introduction
2. Results and Discussion
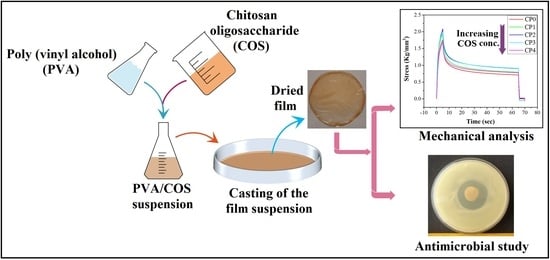
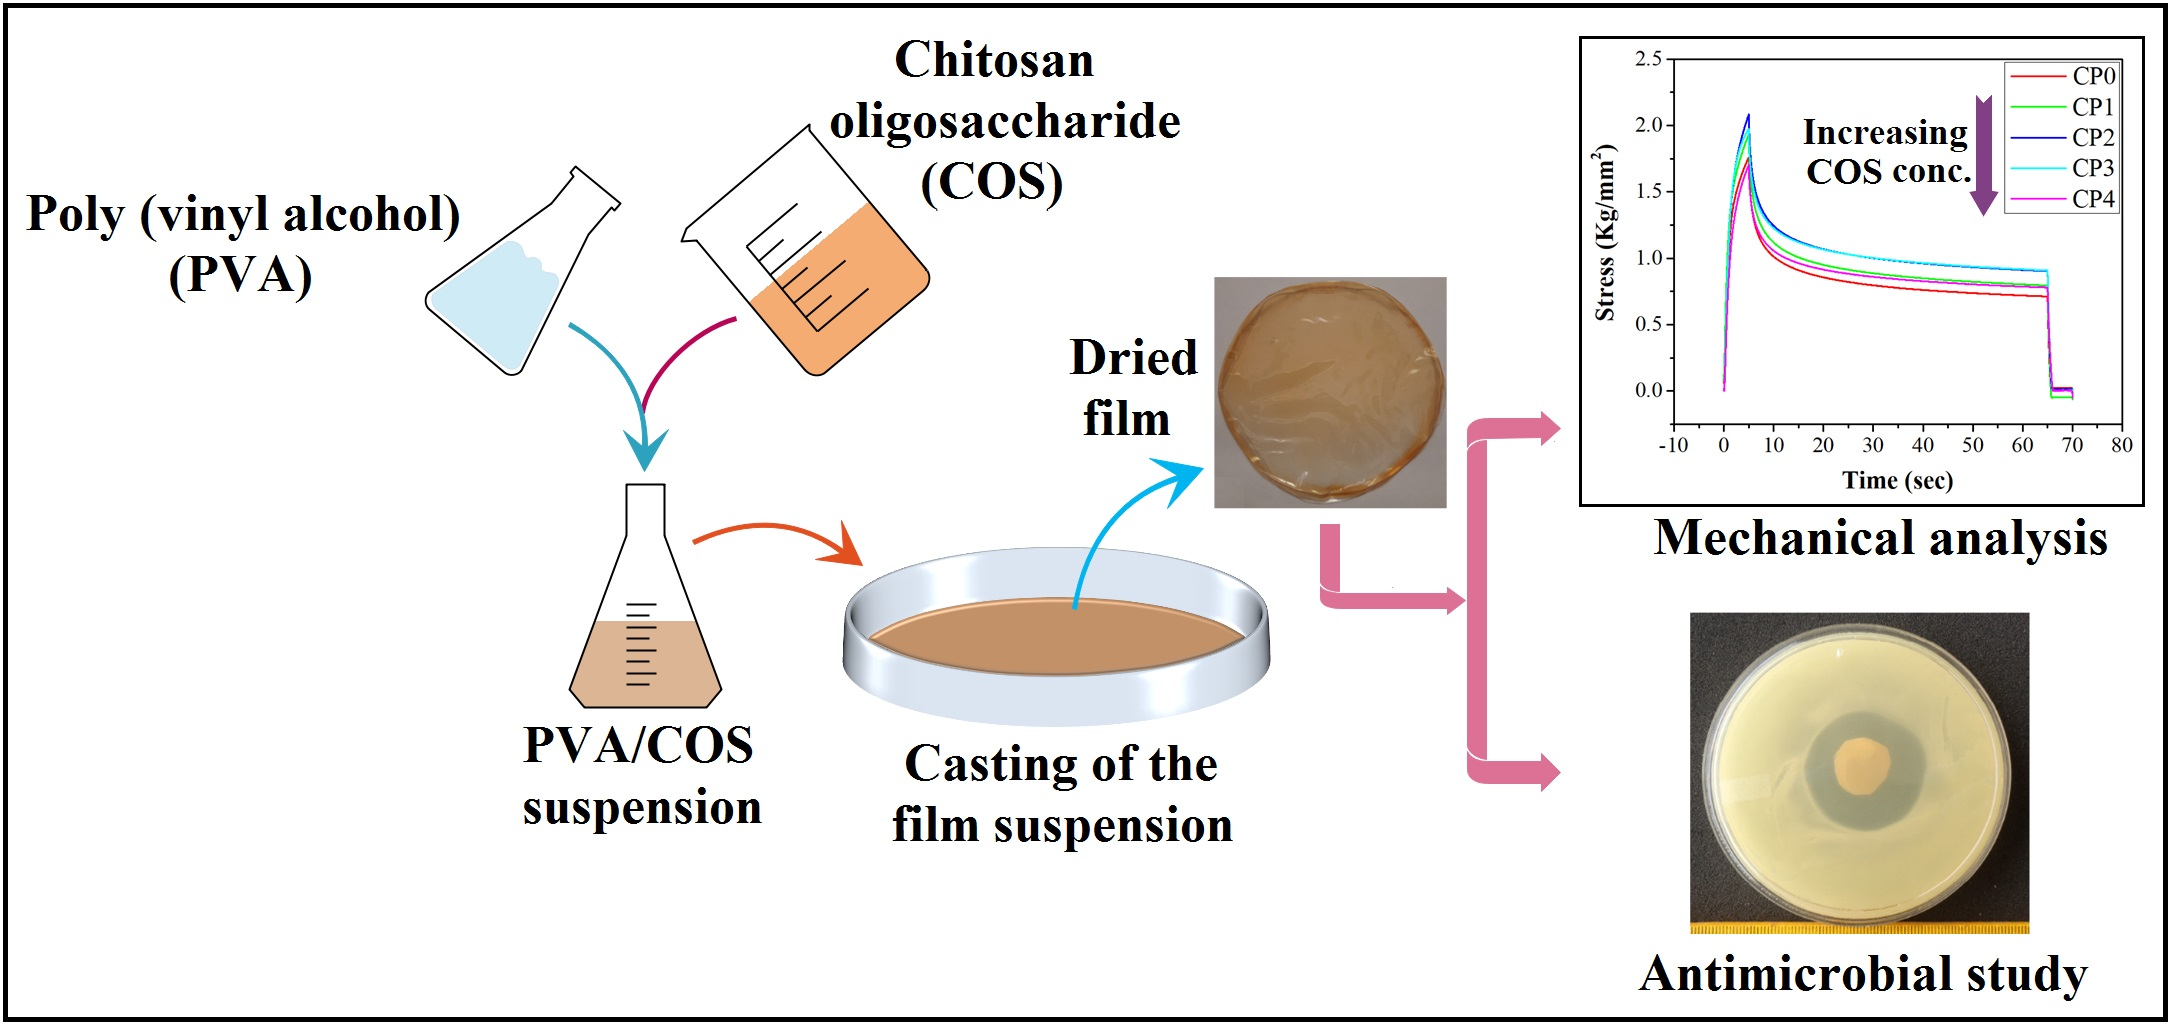
2.1. Preparation of the Films
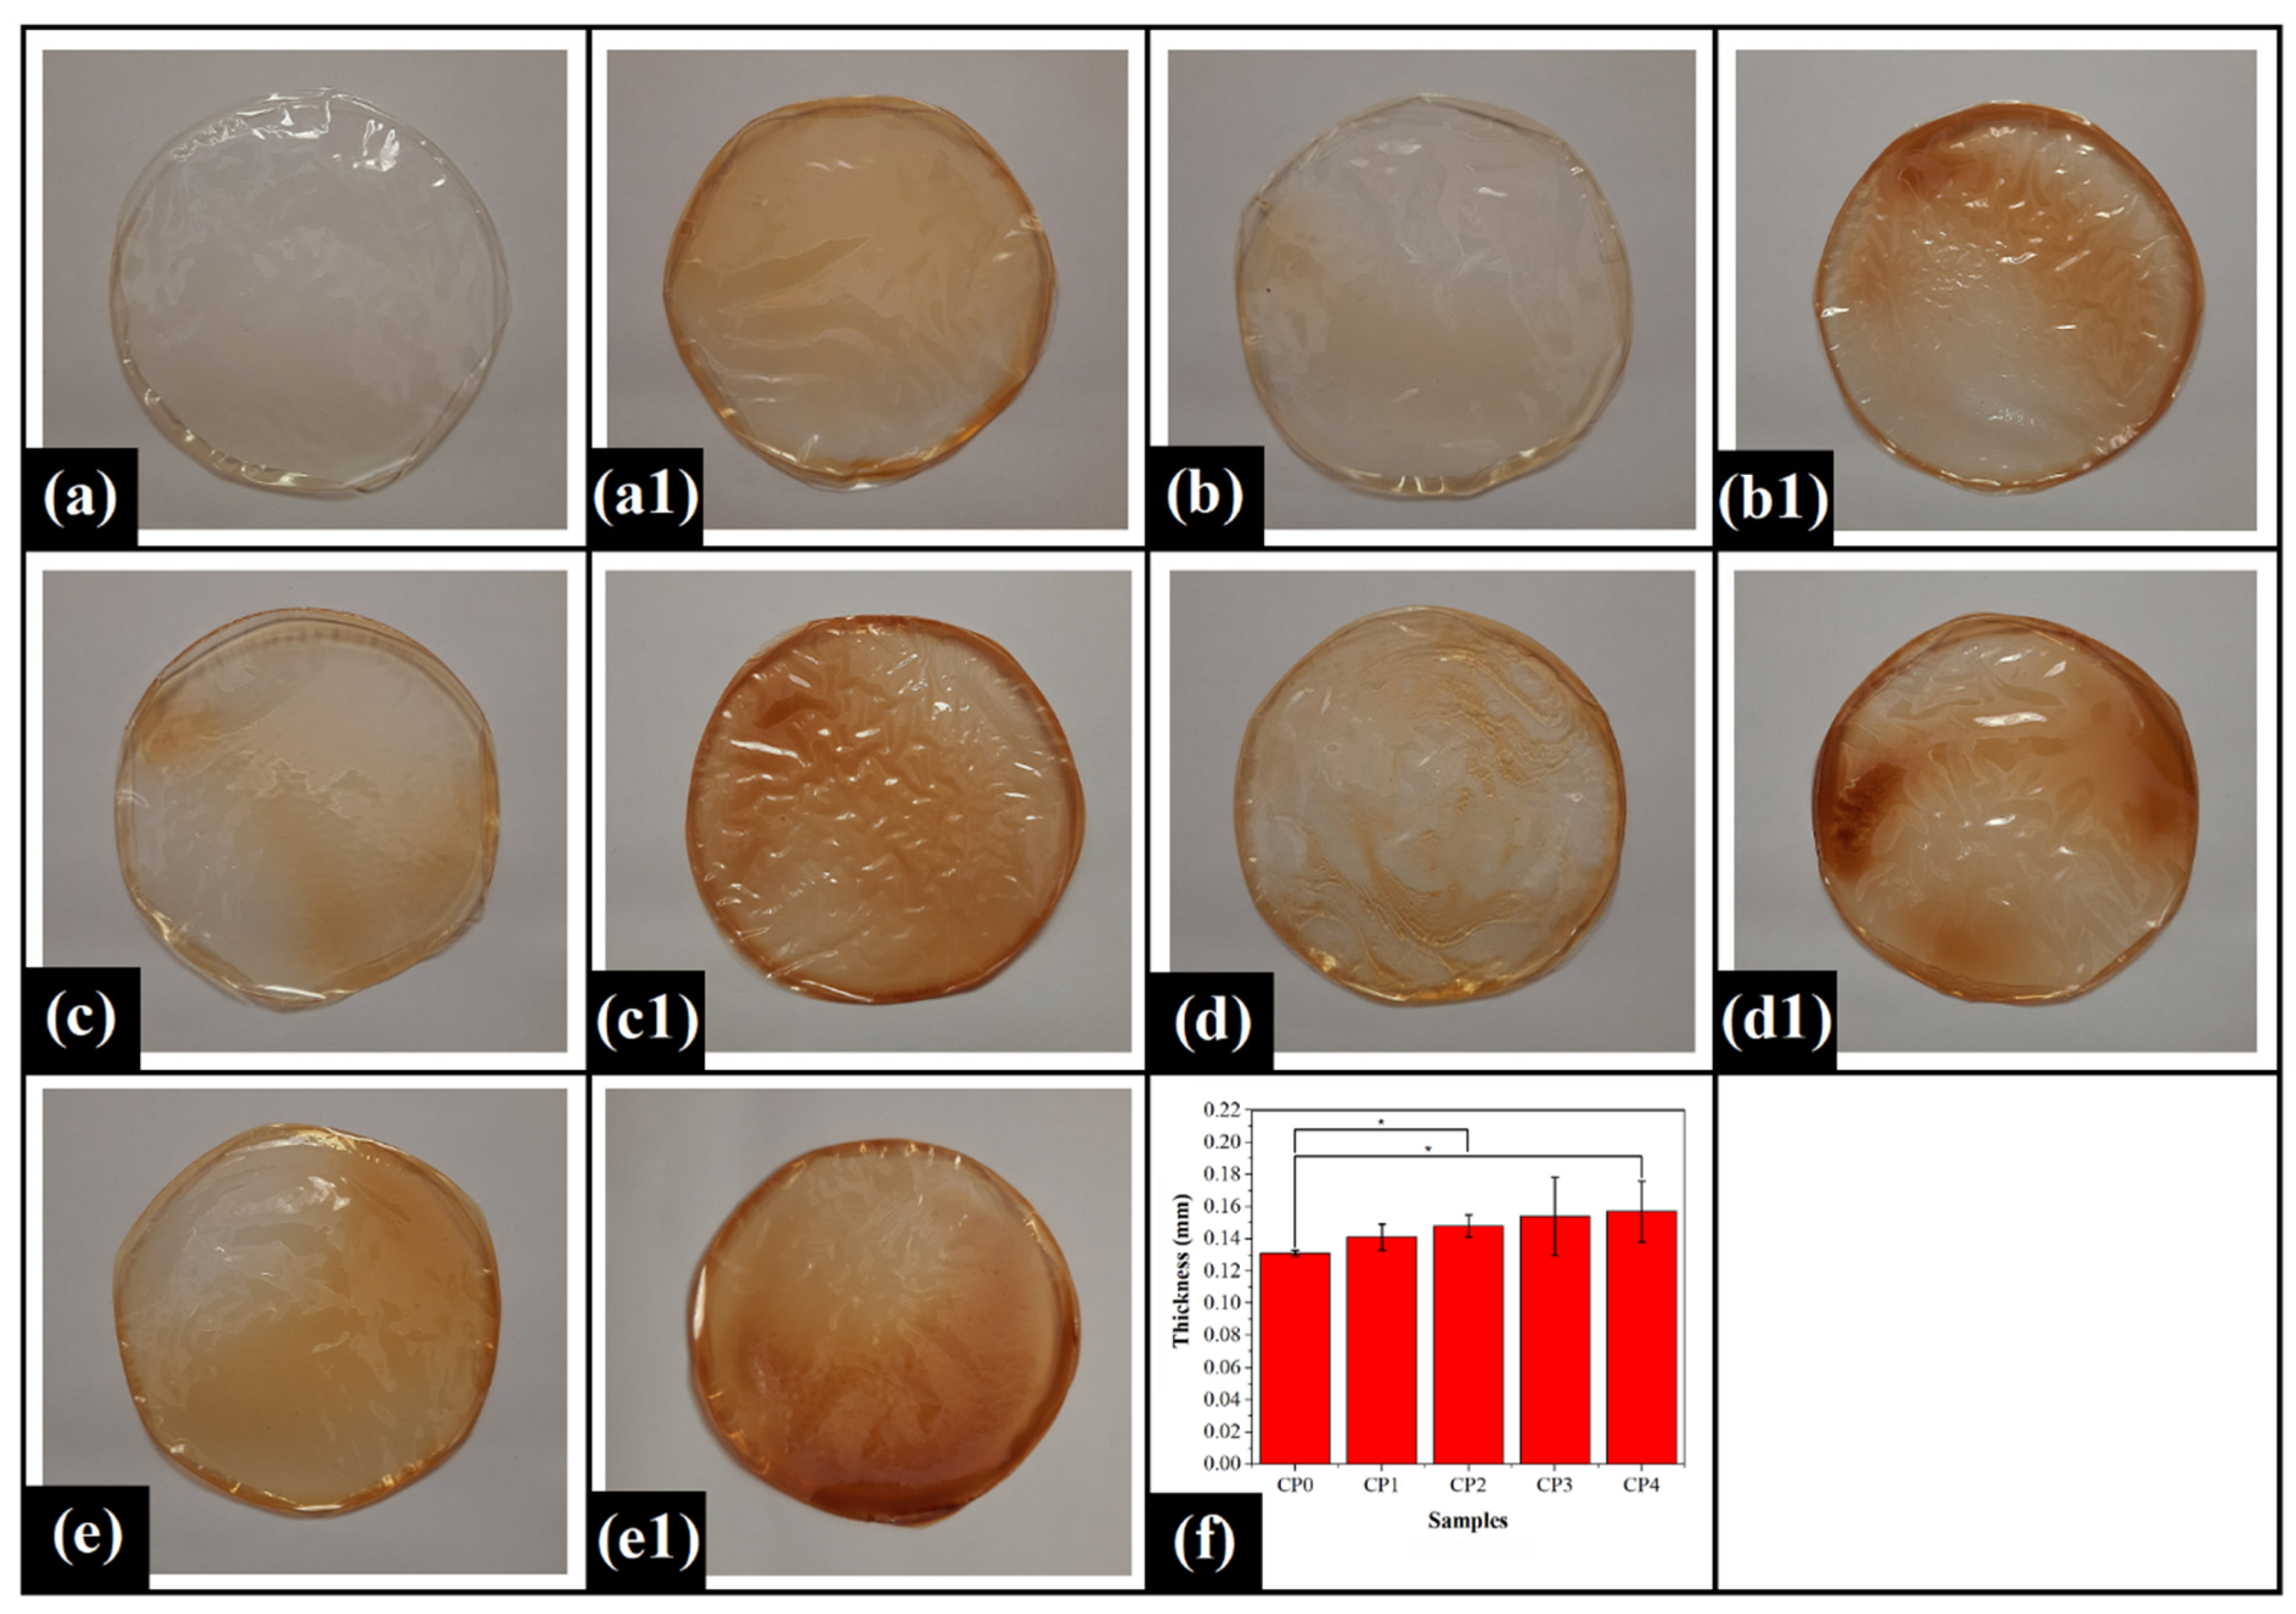
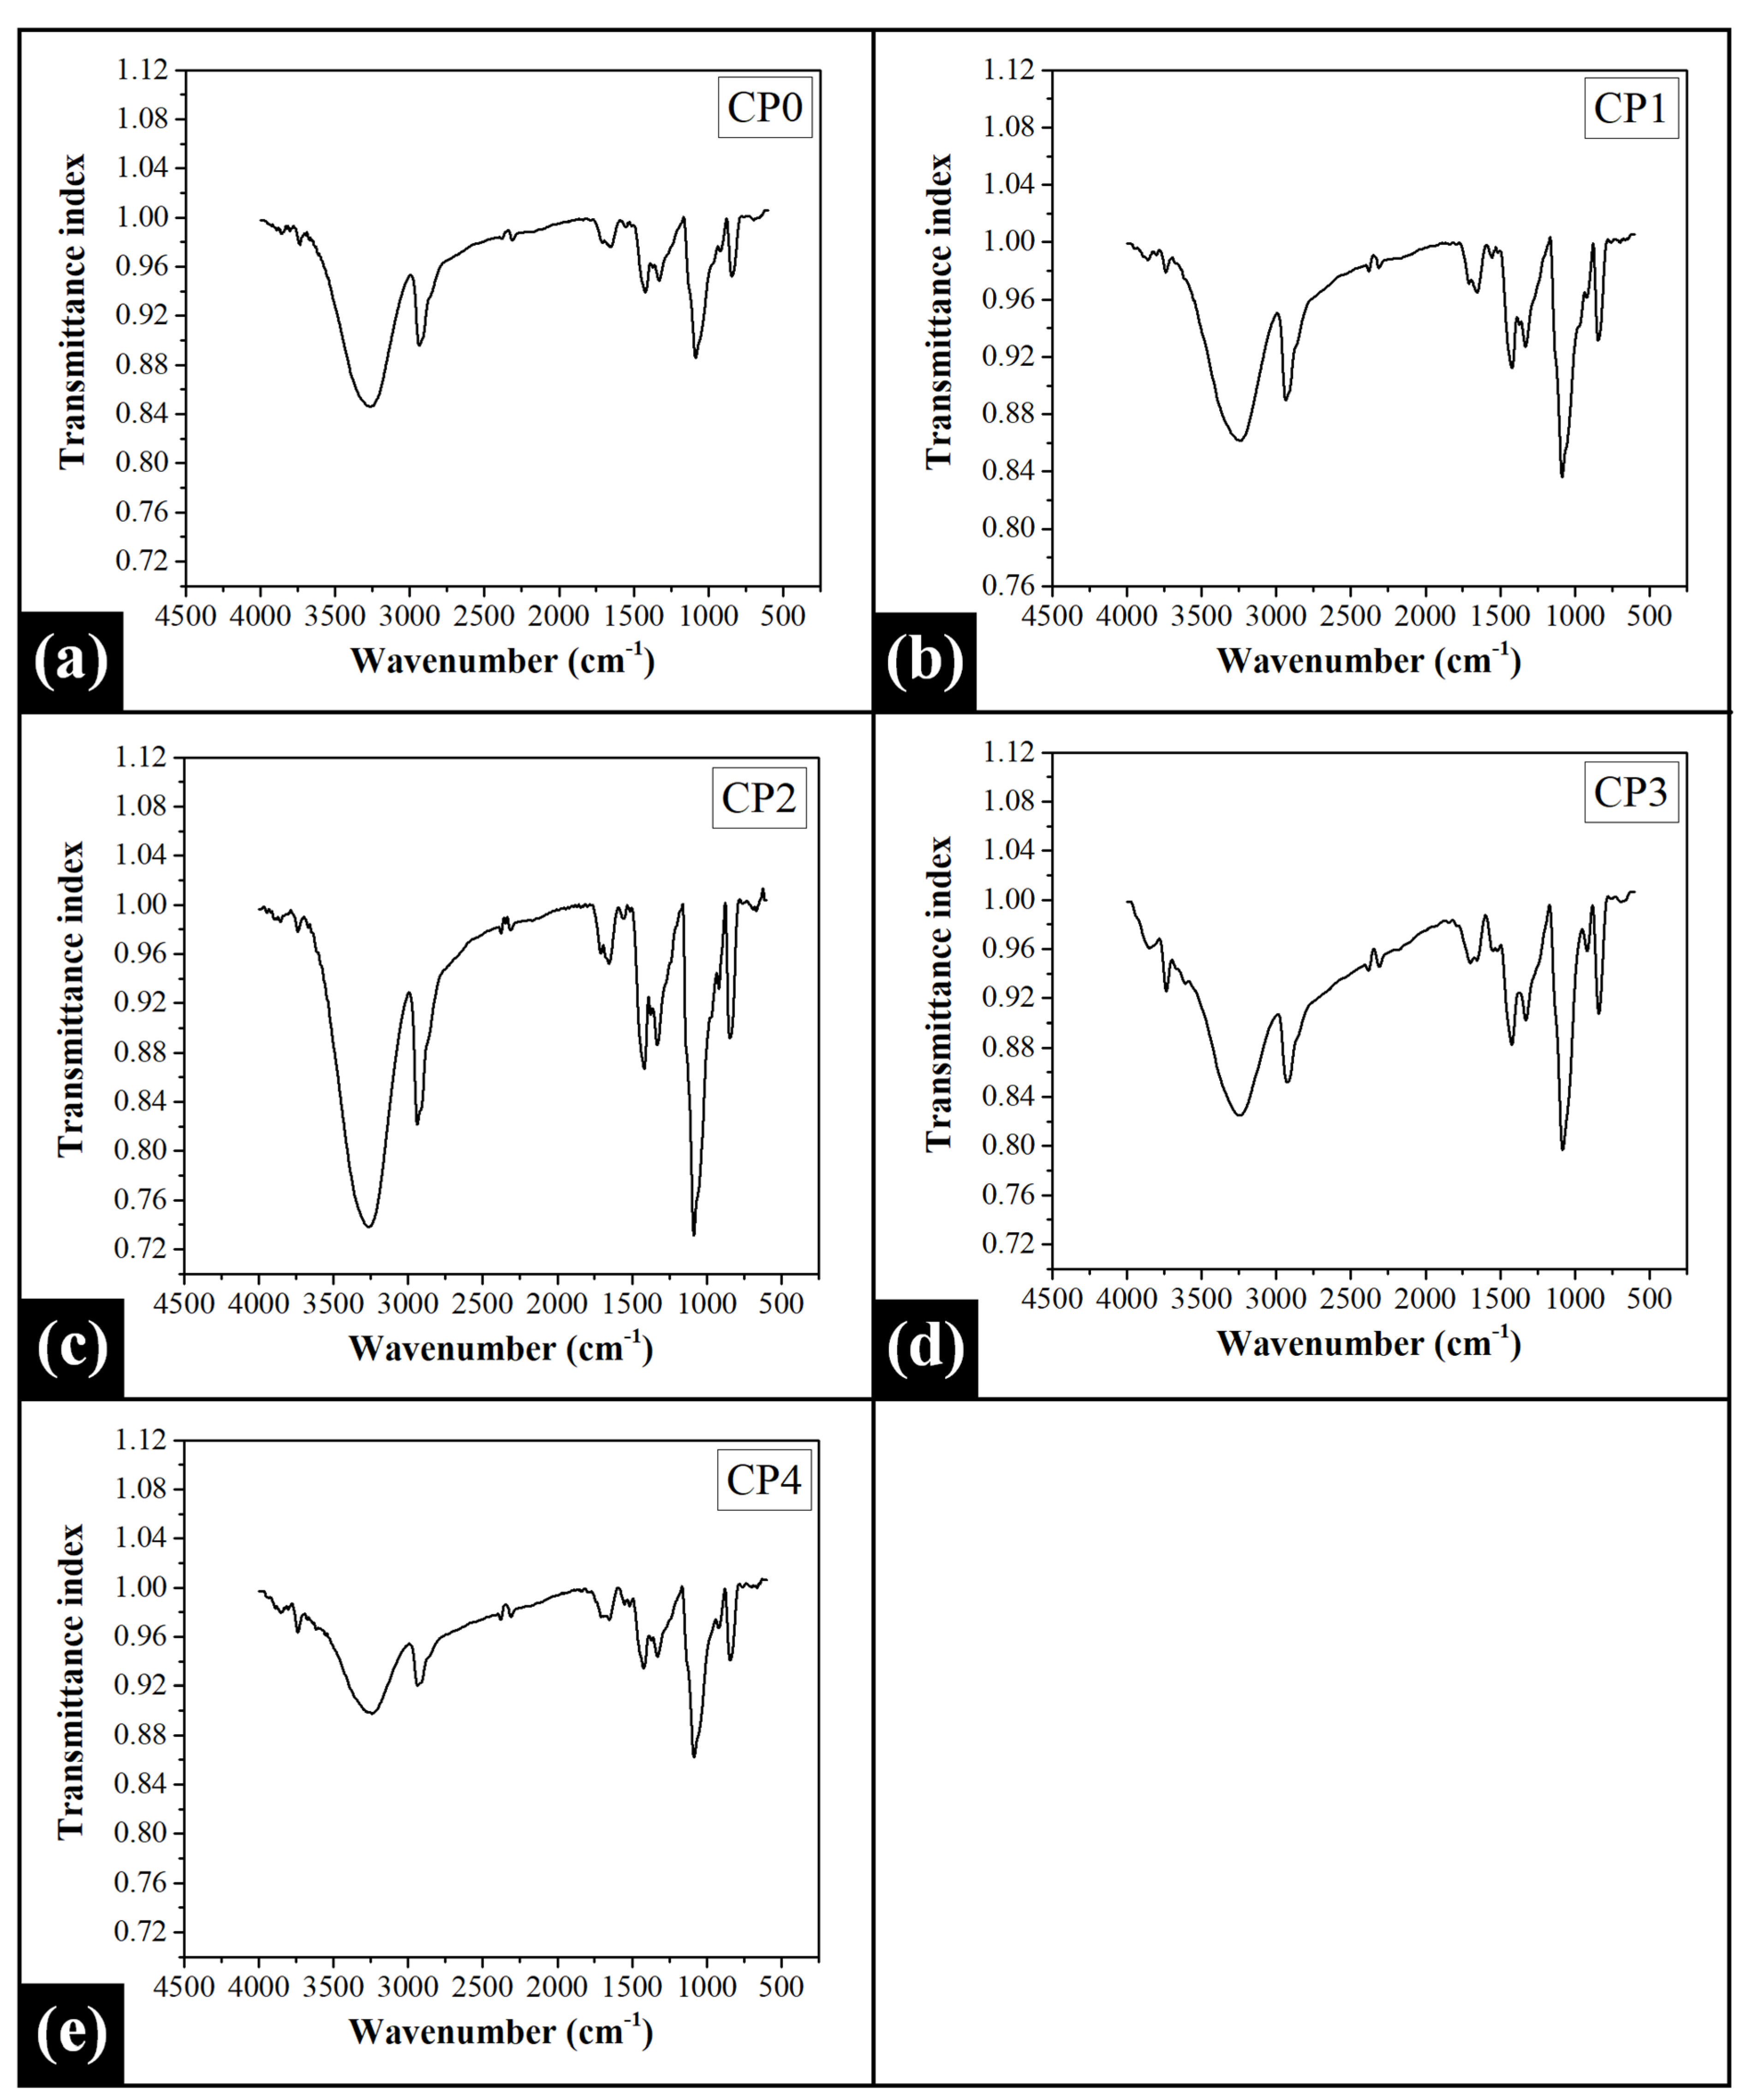
2.2. Fourier Transform Infrared (FTIR) Spectroscopy Analysis
2.3. X-ray Diffraction (XRD) Analysis
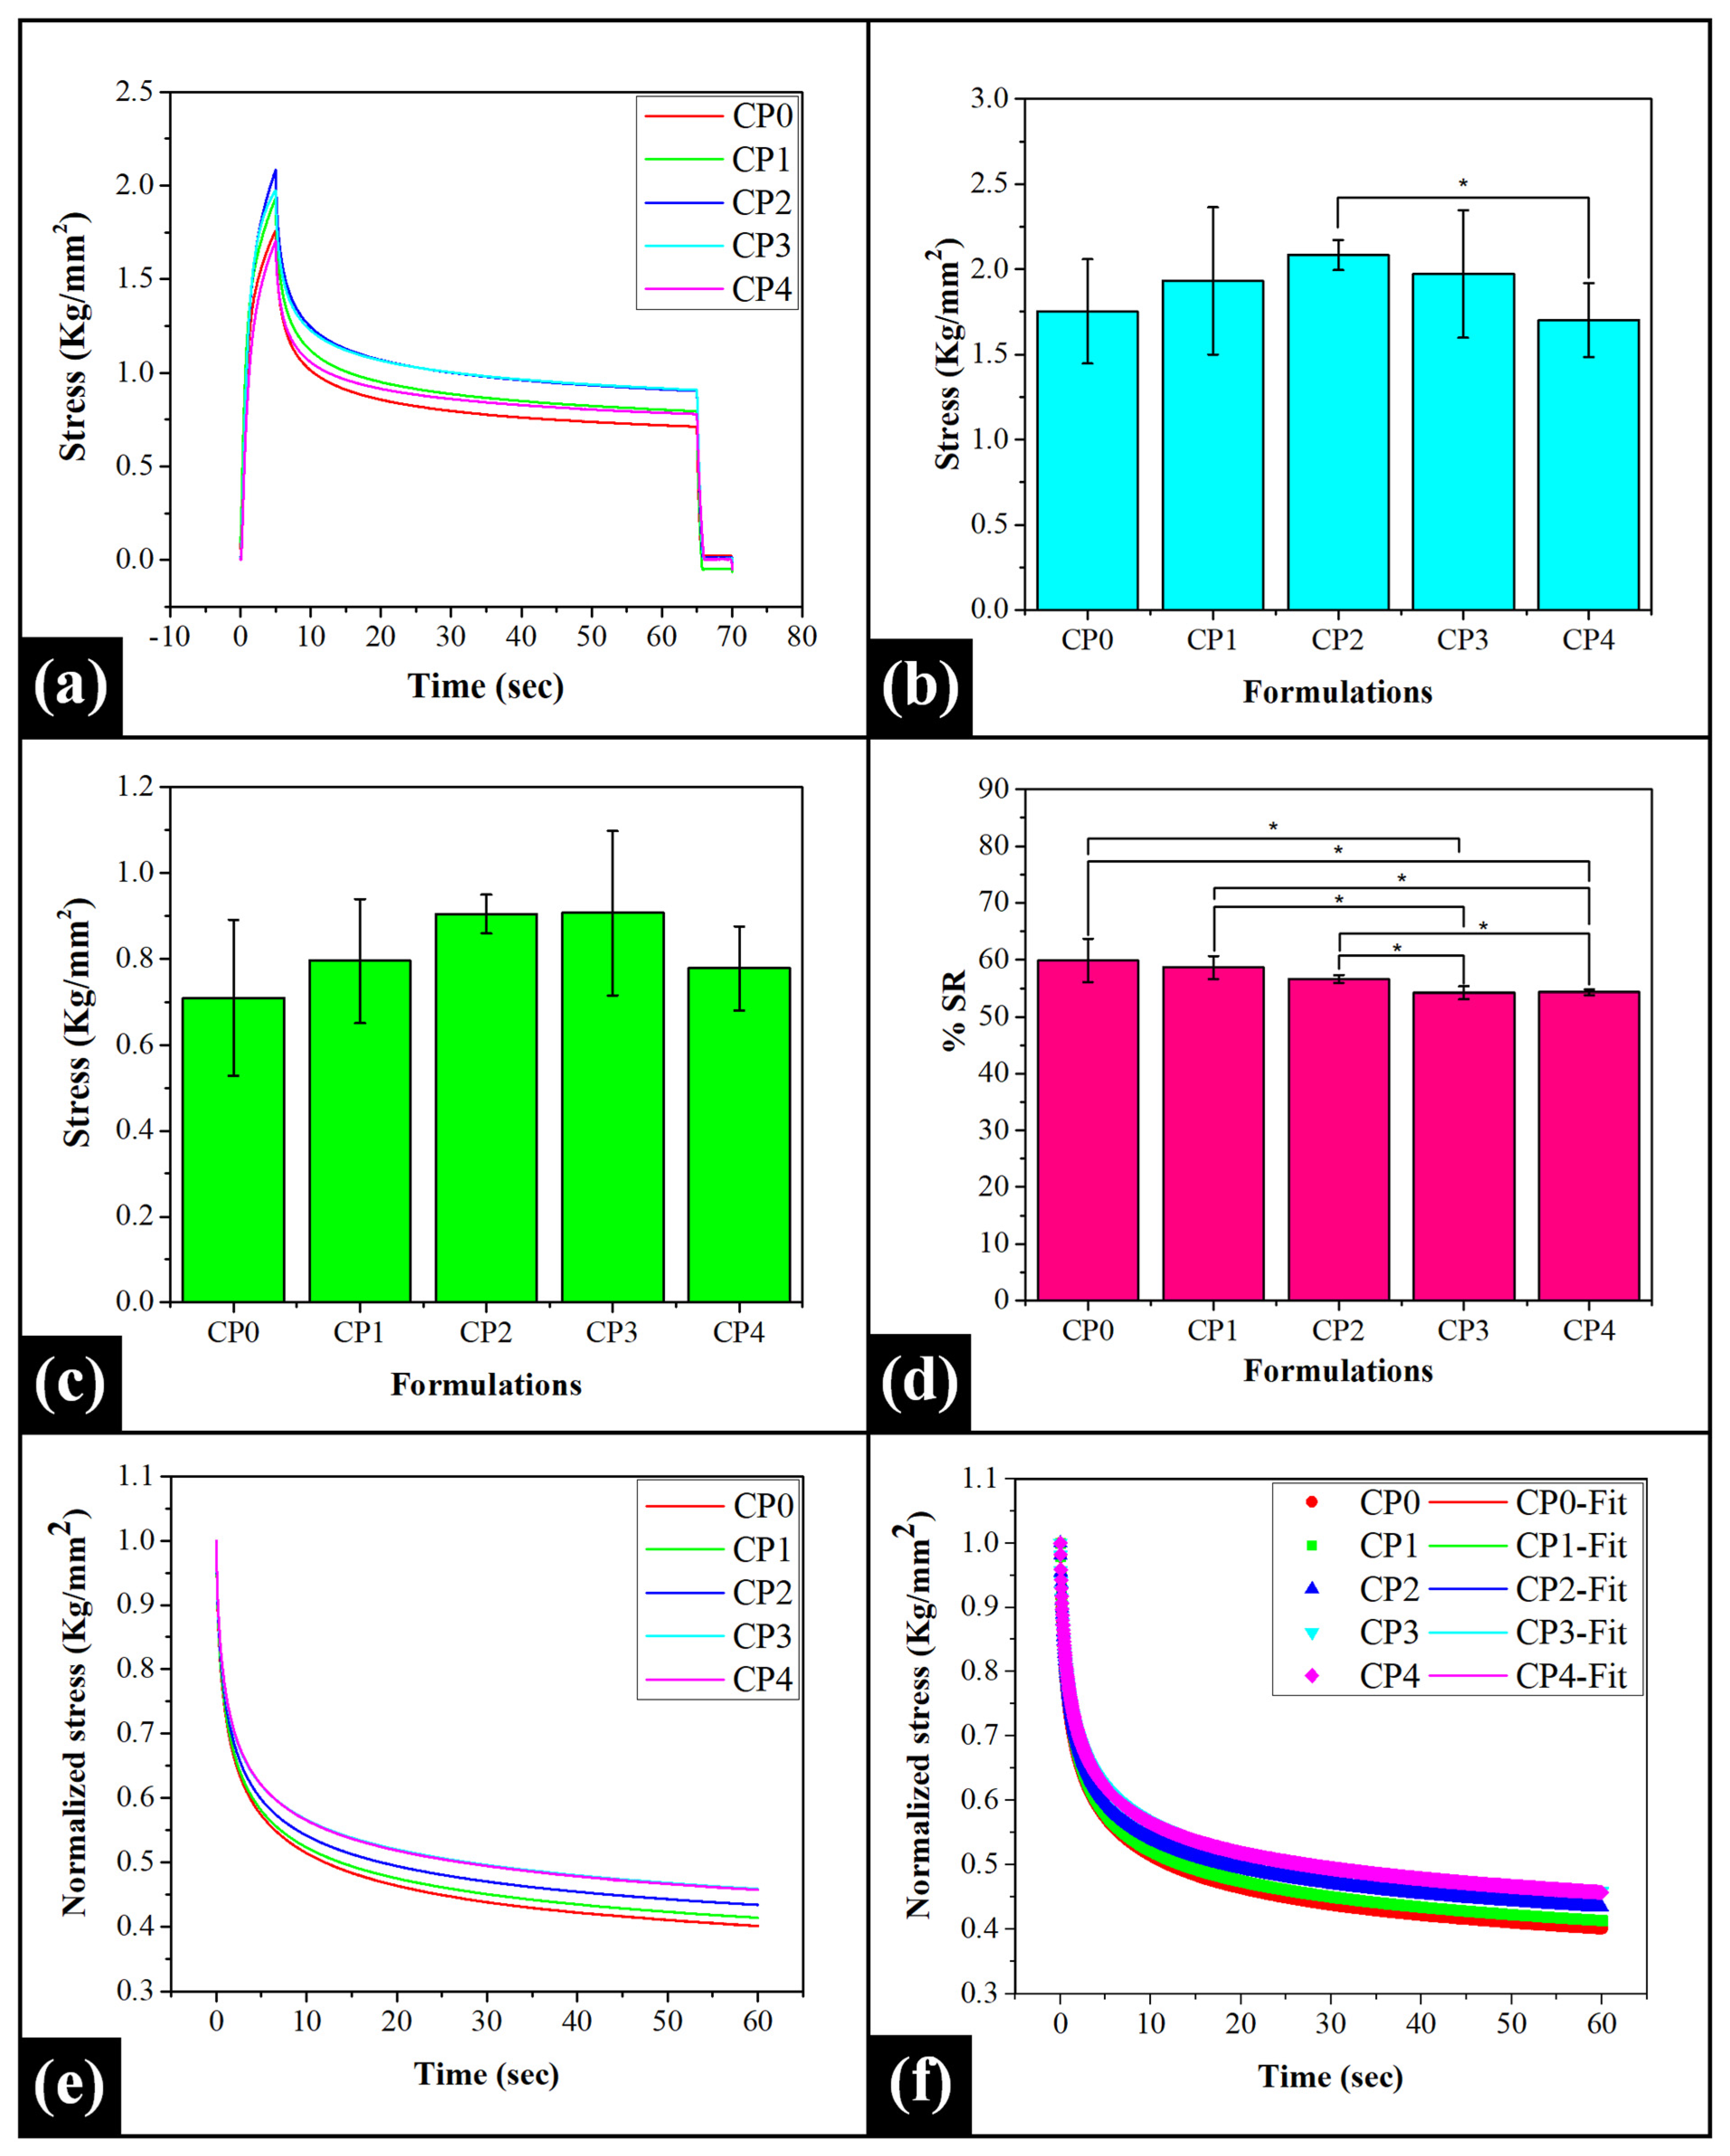
2.4. Mechanical Study
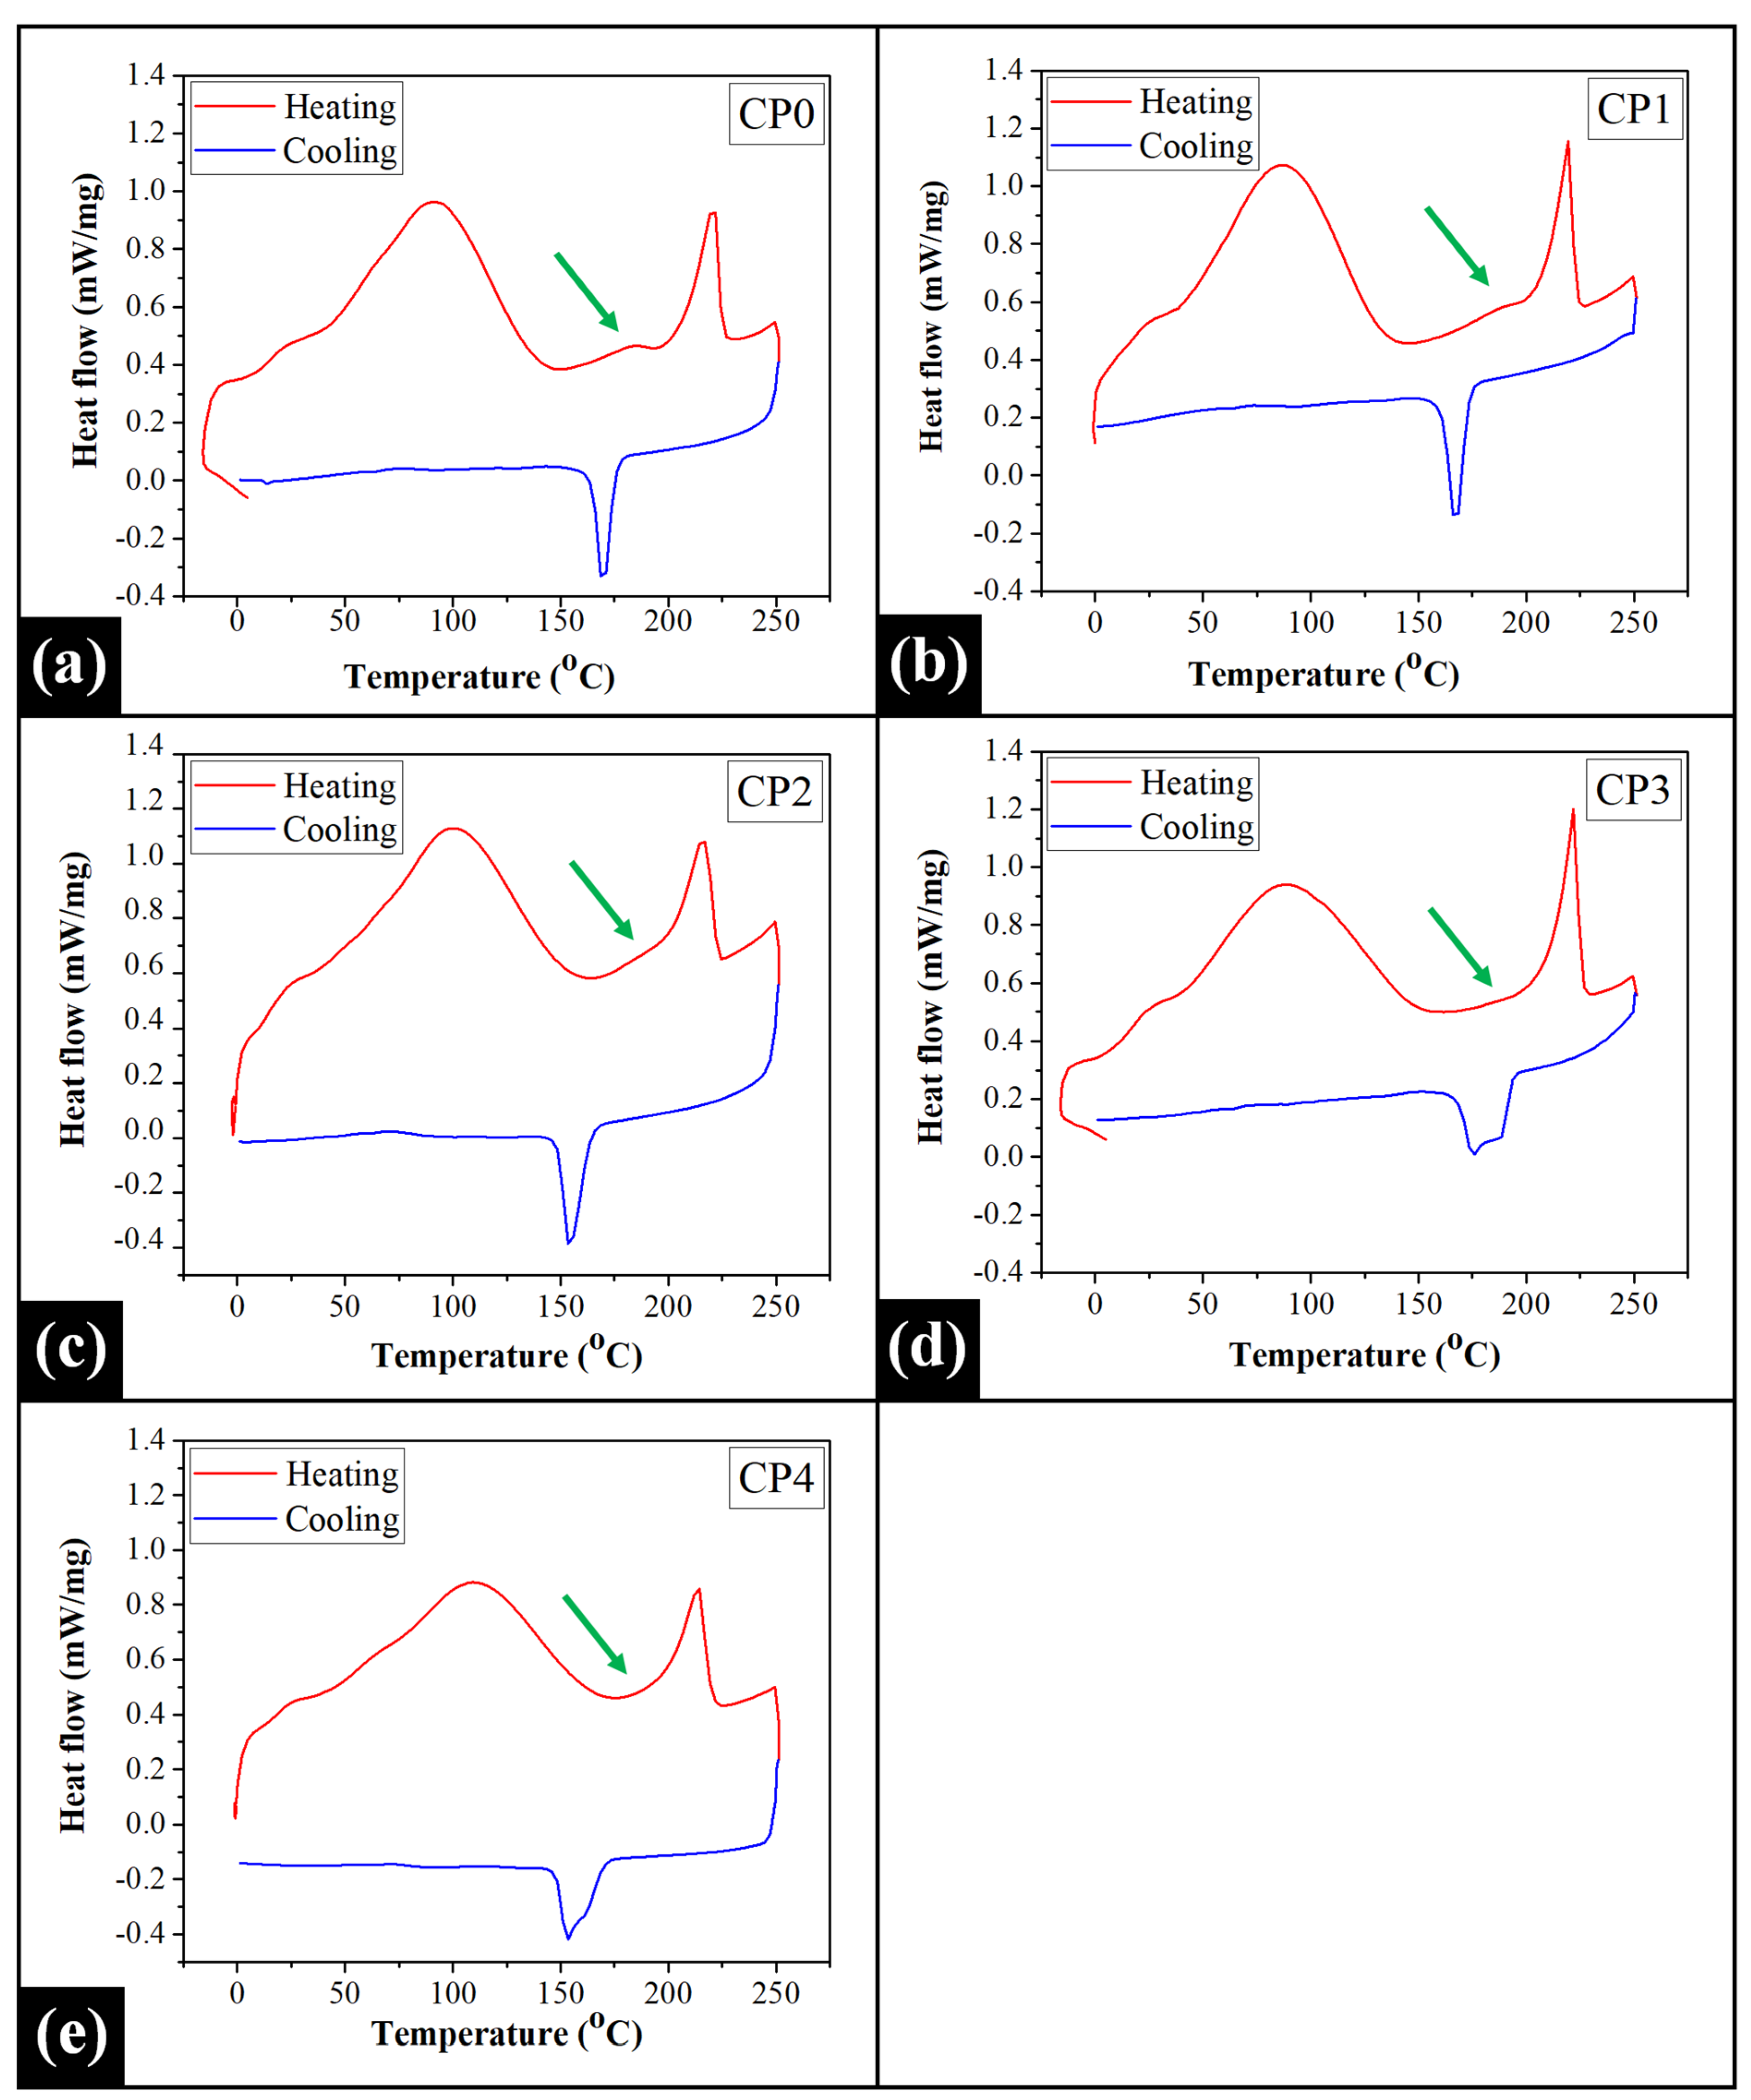
2.5. Differential Scanning Calorimetry (DSC) Analysis
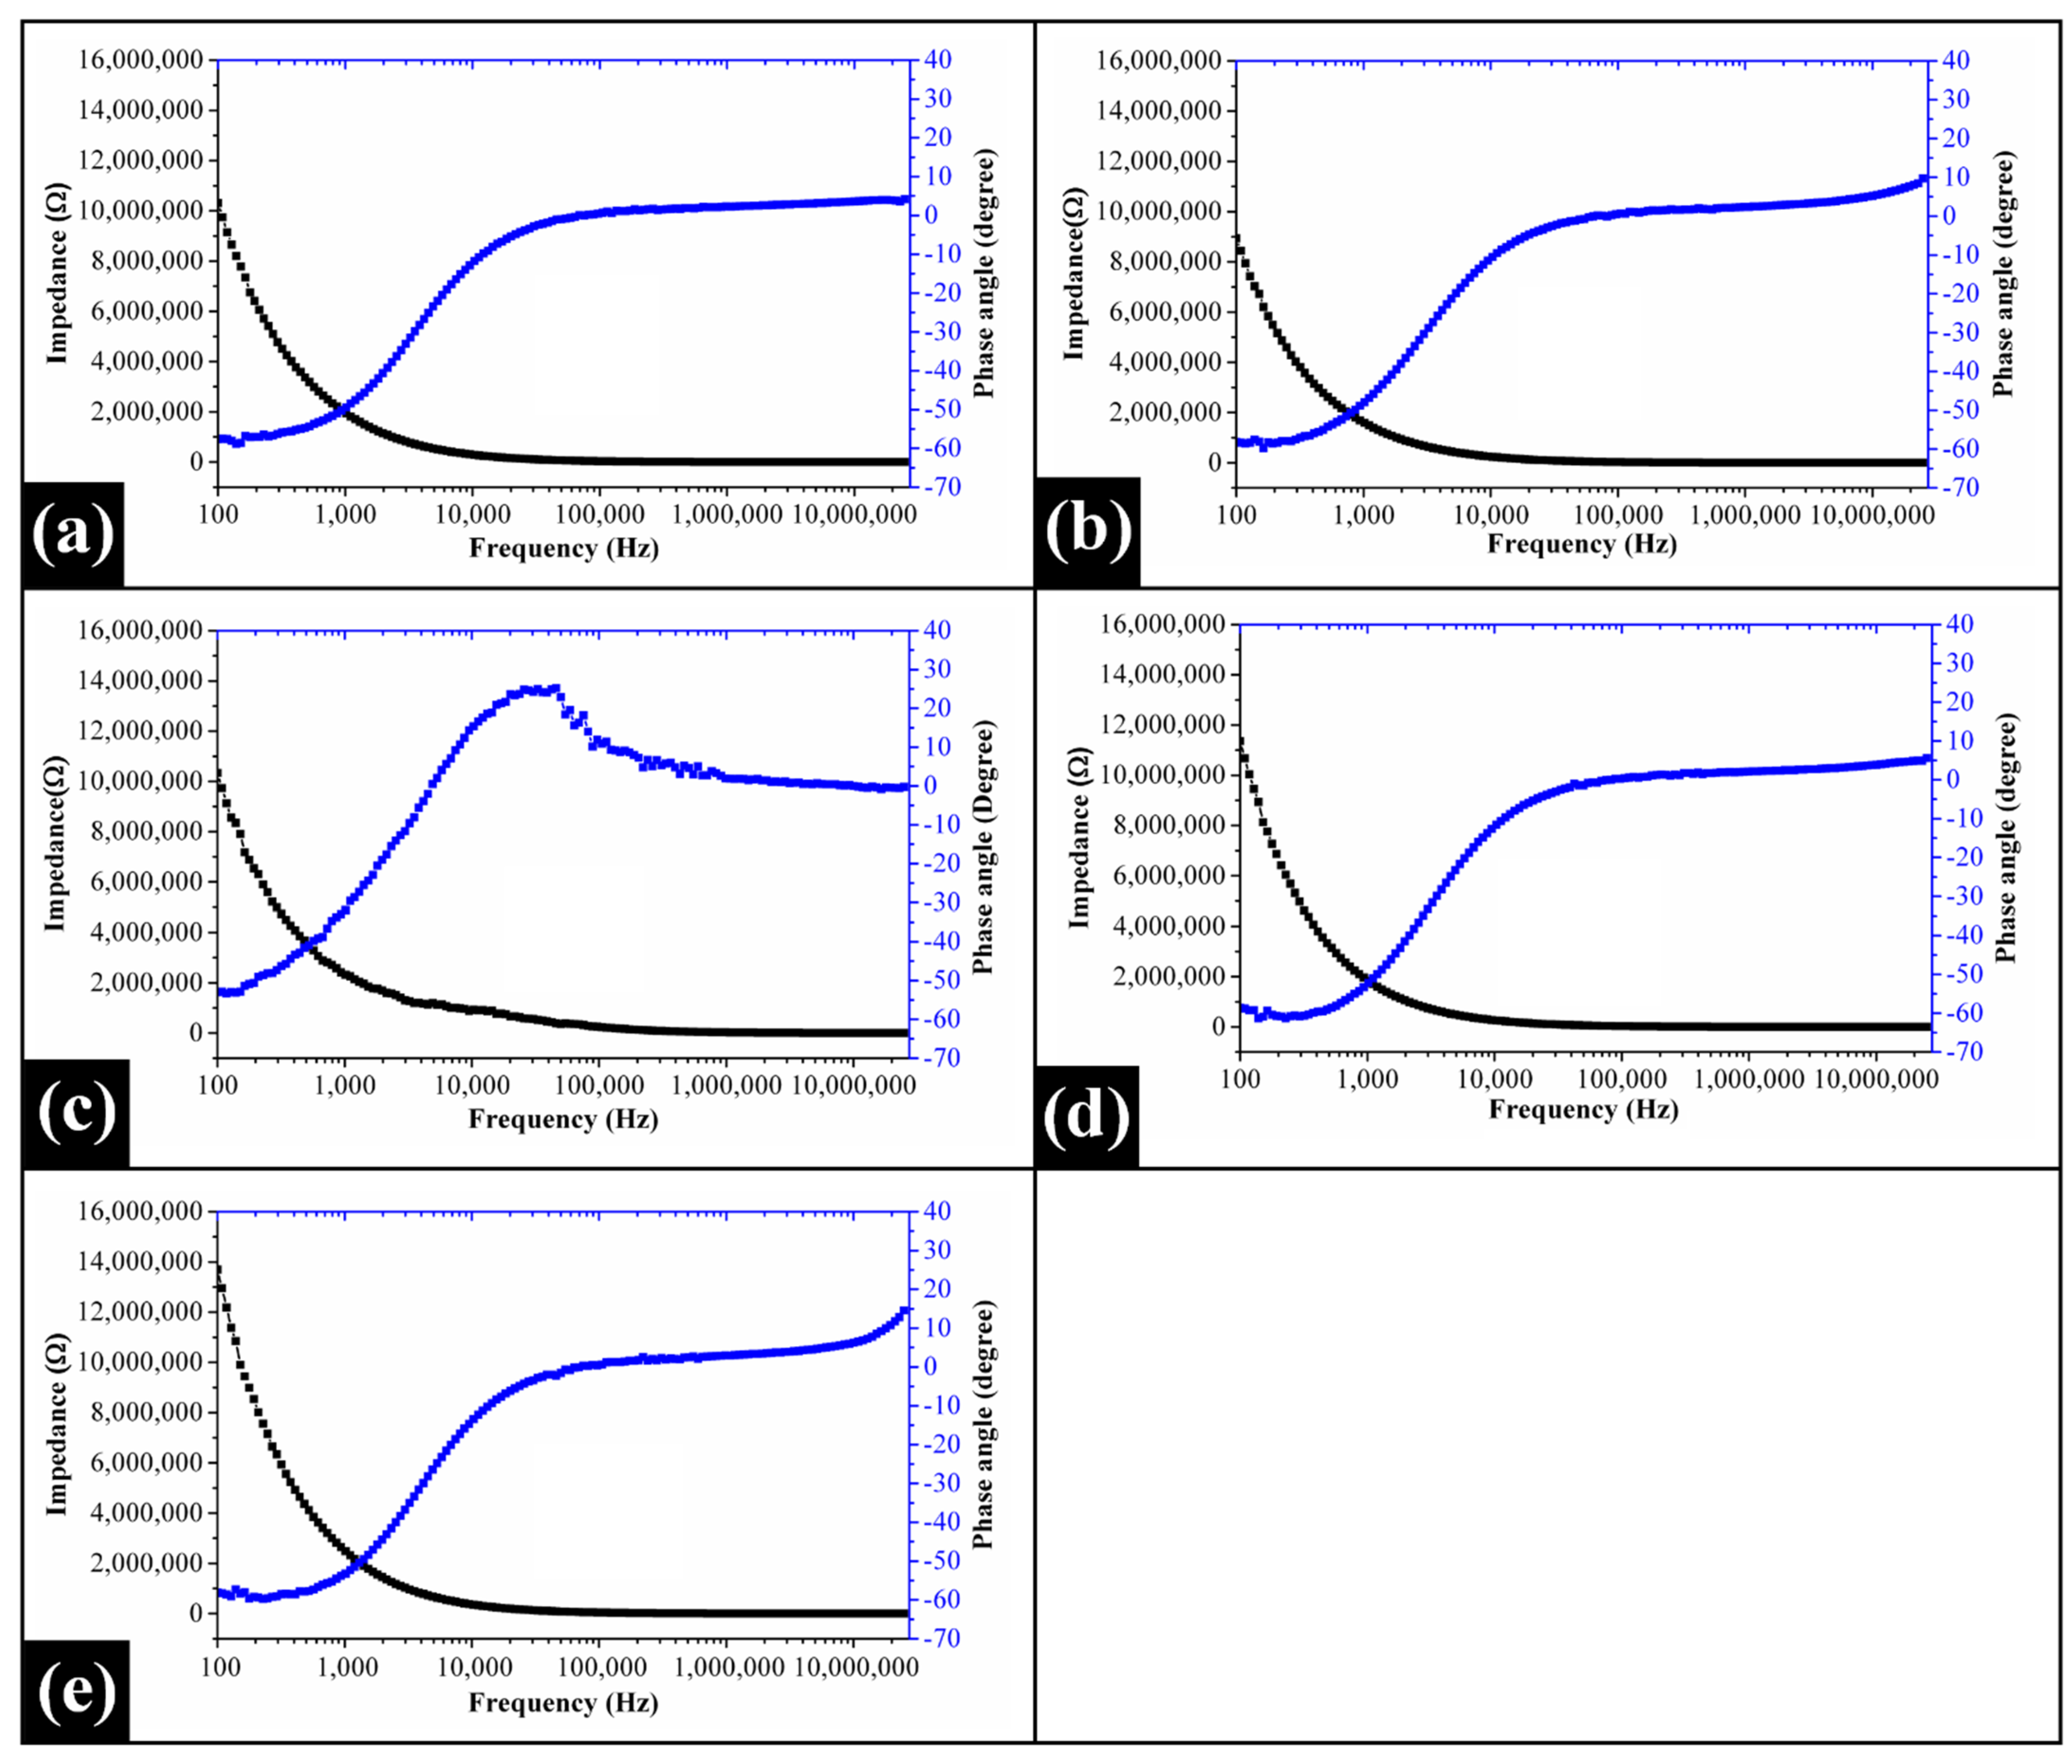
2.6. Impedance Spectroscopy Analysis
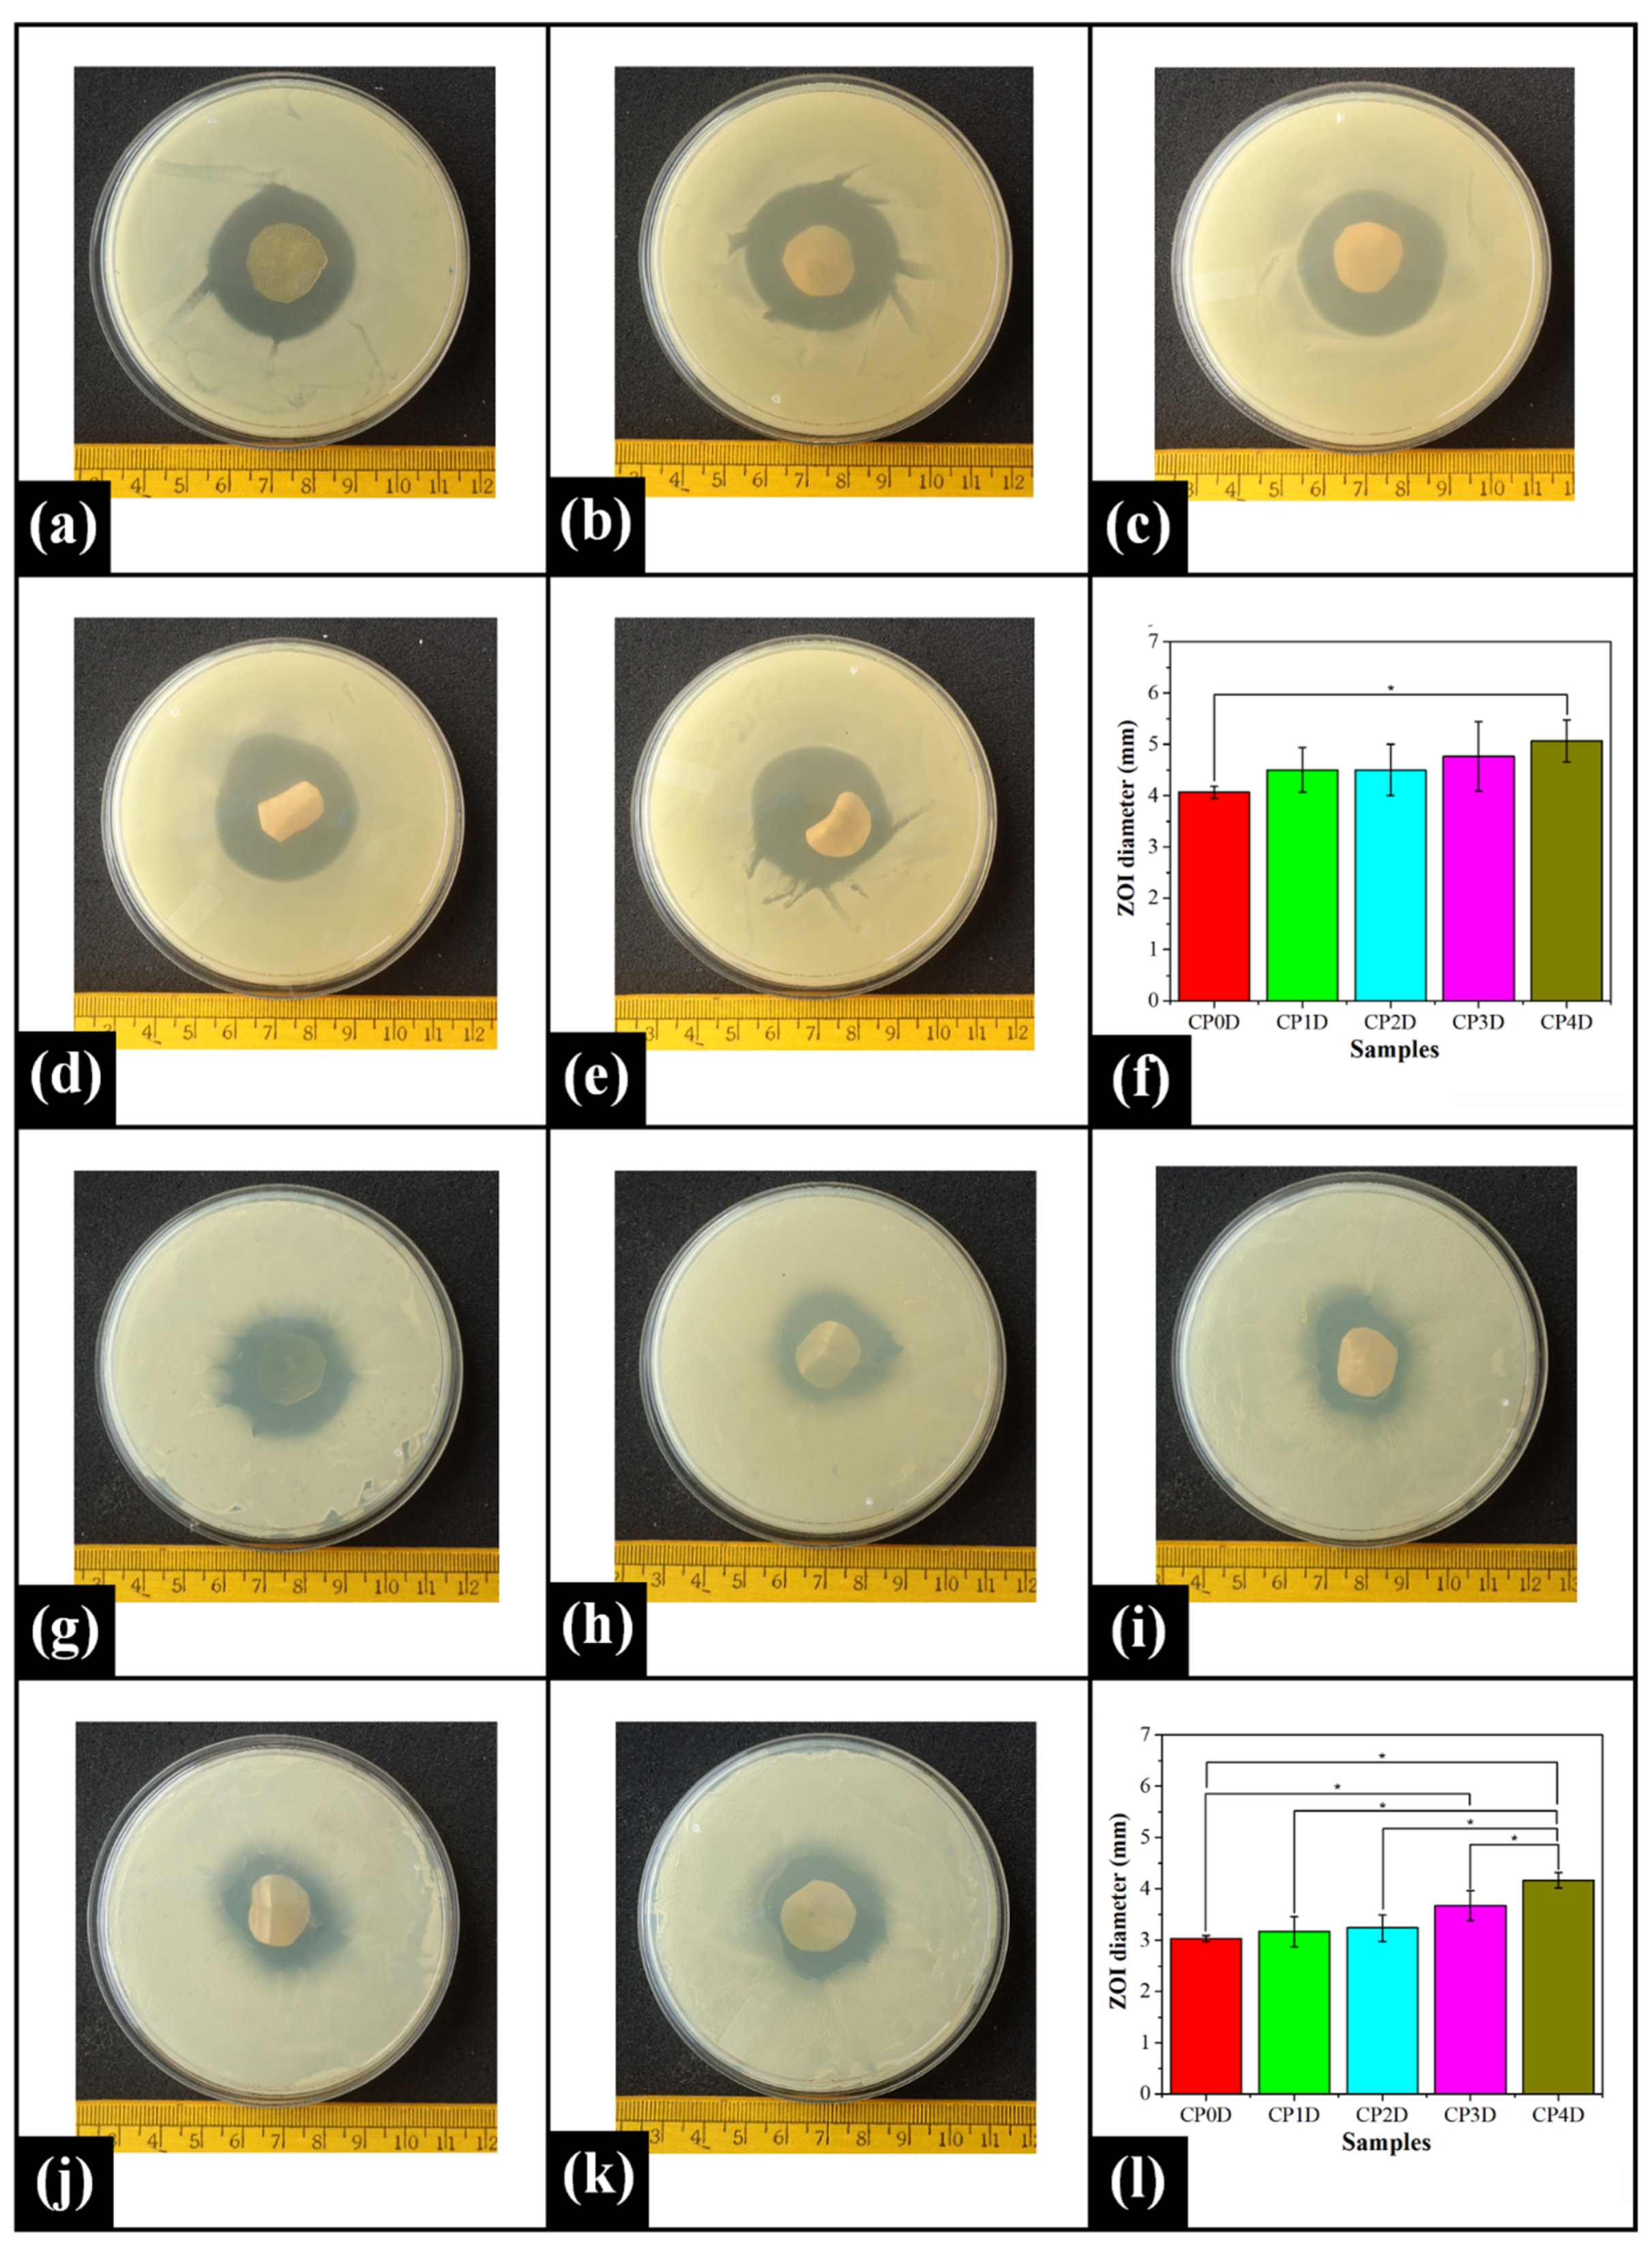
2.7. Antimicrobial Study
2.8. Hemocompatibility Test
3. Conclusions
4. Materials and Methods
4.1. Materials
4.2. Methods
4.2.1. Preparation of Films
4.2.2. FTIR Spectroscopy Analysis
4.2.3. XRD Study
4.2.4. Mechanical Study
4.2.5. DSC Analysis
4.2.6. Impedance Spectroscopy Analysis
4.2.7. Antimicrobial Study
4.2.8. Hemocompatibility Test
4.2.9. Statistical Analysis
Supplementary Materials
Author Contributions
Funding
Data Availability Statement
Acknowledgments
Conflicts of Interest
References
- Kang, Y.; Wu, X.; Chen, Q.; Ji, X.; Bo, S.; Liu, Y. Adsorption of poly(vinyl alcohol) on gel permeation chromatography columns depends on the degree of hydrolysis. J. Chromatogr. A 2019, 1585, 138–143. [Google Scholar] [CrossRef]
- Tampau, A.; González-Martínez, C.; Chiralt, A. Polyvinyl alcohol-based materials encapsulating carvacrol obtained by solvent casting and electrospinning. React. Funct. Polym. 2020, 153, 104603. [Google Scholar] [CrossRef]
- Gaaz, T.S.; Sulong, A.B.; Akhtar, M.N.; Kadhum, A.A.H.; Mohamad, A.B.; Al-Amiery, A.A. Properties and Applications of Polyvinyl Alcohol, Halloysite Nanotubes and Their Nanocomposites. Molecules 2015, 20, 22833–22847. [Google Scholar] [CrossRef]
- Zhang, H. Ice Templating and Freeze-Drying for Porous Materials and Their Applications; Wiley: Hoboken, NJ, USA, 2018. [Google Scholar]
- Aliasgharlou, N.; Sana, F.A.; Khoshbakht, S.; Zolfaghari, P.; Charkhian, H. Fabrication and characterization of boric acid-crosslinked ethyl cellulose and polyvinyl alcohol films as potential drug release systems for topical drug delivery. Turk. J. Chem. 2020, 44, 1723–1732. [Google Scholar] [CrossRef] [PubMed]
- Abraham, A.; Soloman, P.; Rejini, V. Preparation of Chitosan-Polyvinyl Alcohol Blends and Studies on Thermal and Mechanical Properties. Procedia Technol. 2016, 24, 741–748. [Google Scholar] [CrossRef]
- Nagarkar, R.; Patel, J. Polyvinyl alcohol: A comprehensive study. Acta Sci. Pharm. Sci. 2019, 3, 34–44. [Google Scholar]
- Gajra, B.; Pandya, S.S.; Vidyasagar, G.; Rabari, H.; Dedania, R.R.; Rao, S. Poly vinyl alcohol hydrogel and its pharmaceutical and biomedical applications: A review. Int. J. Pharm. Res. 2012, 4, 2026. [Google Scholar]
- Rynkowska, E.; Fatyeyeva, K.; Marais, S.; Kujawa, J.; Kujawski, W. Chemically and Thermally Crosslinked PVA-Based Membranes: Effect on Swelling and Transport Behavior. Polymers 2019, 11, 1799. [Google Scholar] [CrossRef]
- Yeom, C.-K.; Lee, K.-H. Pervaporation separation of water-acetic acid mixtures through poly(vinyl alcohol) membranes crosslinked with glutaraldehyde. J. Membr. Sci. 1996, 109, 257–265. [Google Scholar] [CrossRef]
- Long, J.; Nand, A.; Bunt, C.; Seyfoddin, A. Controlled release of dexamethasone from poly(vinyl alcohol) hydrogel. Pharm. Dev. Technol. 2019, 24, 839–848. [Google Scholar] [CrossRef]
- Hosseini, M.S.; Nabid, M.R. Synthesis of chemically cross-linked hydrogel films based on basil seed (Ocimum basilicum L.) mucilage for wound dressing drug delivery applications. Int. J. Biol. Macromol. 2020, 163, 336–347. [Google Scholar] [CrossRef] [PubMed]
- Soud, S.A.; Hasoon, B.A.; Abdulwahab, A.I.; Hussein, N.N.; Maeh, R.K. Synthesis and characterization of plant extracts loaded PVA/PVP blend films and evaluate their biological activities. EurAsian J. Biosci. 2020, 14, 2921–2931. [Google Scholar]
- Mozafari, M.; Moztarzadeh, F.; Jalali, N.; Alhosseini, S.N.; Asgari, S.; Dodel, M.; Samadikuchaksaraei, A.; Kargozar, S. Synthesis and characterization of electrospun polyvinyl alcohol nanofibrous scaffolds modified by blending with chitosan for neural tissue engineering. Int. J. Nanomed. 2012, 7, 25–34. [Google Scholar] [CrossRef]
- Thangprasert, A.; Tansakul, C.; Thuaksubun, N.; Meesane, J. Mimicked hybrid hydrogel based on gelatin/PVA for tissue engineering in subchondral bone interface for osteoarthritis surgery. Mater. Des. 2019, 183, 108113. [Google Scholar] [CrossRef]
- Lin, S.-P.; Lo, K.-Y.; Tseng, T.-N.; Liu, J.-M.; Shih, T.-Y.; Cheng, K.-C. Evaluation of PVA/dextran/chitosan hydrogel for wound dressing. Cell. Polym. 2019, 38, 15–30. [Google Scholar] [CrossRef]
- Safaee-Ardakani, M.R.; Hatamian-Zarmi, A.; Sadat, S.M.; Mokhtari-Hosseini, Z.B.; Ebrahimi-Hosseinzadeh, B.; Rashidiani, J.; Kooshki, H. Electrospun Schizophyllan/polyvinyl alcohol blend nanofibrous scaffold as potential wound healing. Int. J. Biol. Macromol. 2019, 127, 27–38. [Google Scholar] [CrossRef]
- Gallo, S.; Artuso, E.; Brambilla, M.G.; Gambarini, G.; Lenardi, C.; Monti, A.F.; Torresin, A.; Pignoli, E.; Veronese, I. Characterization of radiochromic poly (vinyl-alcohol)-glutaraldehyde Fricke gels for dosimetry in external X-ray radiation therapy. J. Phys. D Appl. Phys. 2019, 52, 225601. [Google Scholar] [CrossRef]
- Eyadeh, M.M.; Rabaeh, K.A.; Hailat, T.F.; Al-Shorman, M.Y.; Aldweri, F.M.; Kanan, H.M.; Awad, S.I. Investigation of a novel chemically cross-linked fricke-Methylthymol blue-synthetic polymer gel dosimeter with glutaraldehyde cross-linker. Radiat. Meas. 2018, 118, 77–85. [Google Scholar] [CrossRef]
- Marrale, M.; Collura, G.; Gallo, S.; Nici, S.; Tranchina, L.; Abbate, B.F.; Marineo, S.; Caracappa, S.; D’Errico, F. Analysis of spatial diffusion of ferric ions in PVA-GTA gel dosimeters through magnetic resonance imaging. Nucl. Instrum. Methods Phys. Res. Sect. B Beam Interact. Mater. At. 2017, 396, 50–55. [Google Scholar] [CrossRef]
- Jiang, S.; Liu, S.; Feng, W. PVA hydrogel properties for biomedical application. J. Mech. Behav. Biomed. Mater. 2011, 4, 1228–1233. [Google Scholar] [CrossRef]
- Kumar, A.; Han, S.S. PVA-based hydrogels for tissue engineering: A review. Int. J. Polym. Mater. 2016, 66, 159–182. [Google Scholar] [CrossRef]
- Chen, S.J.S.; Hellier, P.; Gauvrit, J.Y.; Marchal, M.; Morandi, X.; Collins, D.L. An anthropomorphic polyvinyl alcohol triple-modality brain phantom based on Colin27. In Proceedings of the International Conference on Medical Image Computing and Computer-Assisted Intervention; Springer: Berlin/Heidelberg, Germany, 2010; pp. 92–100. [Google Scholar]
- Yusong, P.; Jie, D.; Yan, C.; Qianqian, S. Study on mechanical and optical properties of poly(vinyl alcohol) hydrogel used as soft contact lens. Mater. Technol. 2016, 31, 266–273. [Google Scholar] [CrossRef]
- Liu, K.; Li, Y.; Xu, F.; Zuo, Y.; Zhang, L.; Wang, H.; Liao, J. Graphite/poly (vinyl alcohol) hydrogel composite as porous ringy skirt for artificial cornea. Mater. Sci. Eng. C 2009, 29, 261–266. [Google Scholar] [CrossRef]
- Burczak, K.; Gamian, E.; Kochman, A. Long-term in vivo performance and biocompatibility of poly(vinyl alcohol) hydrogel macrocapsules for hybrid-type artificial pancreas. Biomaterials 1996, 17, 2351–2356. [Google Scholar] [CrossRef]
- Kobayashi, M.; Oka, M. Characterization of a polyvinyl alcohol-hydrogel artificial articular cartilage prepared by injection molding. J. Biomater. Sci. Polym. Ed. 2004, 15, 741–751. [Google Scholar] [CrossRef] [PubMed]
- Kobayashi, M.; Hyu, H.S. Development and Evaluation of Polyvinyl Alcohol-Hydrogels as an Artificial Atrticular Cartilage for Orthopedic Implants. Materials 2010, 3, 2753–2771. [Google Scholar] [CrossRef]
- Karki, S.; Kim, H.; Na, S.-J.; Shin, D.; Jo, K.; Lee, J. Thin films as an emerging platform for drug delivery. Asian J. Pharm. Sci. 2016, 11, 559–574. [Google Scholar] [CrossRef]
- Kathe, K.; Kathpalia, H. Film forming systems for topical and transdermal drug delivery. Asian J. Pharm. Sci. 2017, 12, 487–497. [Google Scholar] [CrossRef] [PubMed]
- Silva, F.E.F.; di-Medeiros, M.C.B.; Batista, K.A.; Fernandes, K.F. PVA/Polysaccharides Blended Films: Mechanical Properties. J. Mater. 2013, 2013, 1–6. [Google Scholar] [CrossRef][Green Version]
- Patil, S.S.; Bade, A.; Tagalpallewar, A. Design, optimization and pharmacodynamic comparison of dorzolamide hydrochloride soluble ocular drug insert prepared by using 3 2 factorial design. J. Drug Deliv. Sci. Technol. 2018, 46, 138–147. [Google Scholar] [CrossRef]
- Shamma, R.; Elkasabgy, N. Design of freeze-dried Soluplus/polyvinyl alcohol-based film for the oral delivery of an insoluble drug for the pediatric use. Drug Deliv. 2014, 23, 489–499. [Google Scholar] [CrossRef]
- Amaral, B.R.; Saatkamp, R.H.; Junior, A.E.; Kroth, R.; Argenta, D.F.; Rebelatto, E.R.L.; Rauber, G.S.; Parize, A.L.; Caon, T. Development and characterization of thermopressed polyvinyl alcohol films for buccal delivery of benznidazole. Mater. Sci. Eng. C 2021, 119, 111546. [Google Scholar] [CrossRef]
- Anirudhan, T.; Nair, A.S.; Gopika, S. The role of biopolymer matrix films derived from carboxymethyl cellulose, sodium alginate and polyvinyl alcohol on the sustained transdermal release of diltiazem. Int. J. Biol. Macromol. 2018, 107, 779–789. [Google Scholar] [CrossRef]
- Traore, Y.L.; Fumakia, M.; Gu, J.; Ho, E.A. Dynamic mechanical behaviour of nanoparticle loaded biodegradable PVA films for vaginal drug delivery. J. Biomater. Appl. 2018, 32, 1119–1126. [Google Scholar] [CrossRef] [PubMed]
- Ma, Q.; Du, L.; Yang, Y.; Wang, L. Rheology of film-forming solutions and physical properties of tara gum film reinforced with polyvinyl alcohol (PVA). Food Hydrocoll. 2017, 63, 677–684. [Google Scholar] [CrossRef]
- Gómez-Aldapa, C.A.; Velazquez, G.; Gutierrez, M.C.; Rangel-Vargas, E.; Castro-Rosas, J.; Aguirre-Loredo, R.Y. Effect of polyvinyl alcohol on the physicochemical properties of biodegradable starch films. Mater. Chem. Phys. 2020, 239, 122027. [Google Scholar] [CrossRef]
- Engelke, L.; Winter, G.; Engert, J. Application of water-soluble polyvinyl alcohol-based film patches on laser microporated skin facilitates intradermal macromolecule and nanoparticle delivery. Eur. J. Pharm. Biopharm. 2018, 128, 119–130. [Google Scholar] [CrossRef]
- Lee, J.-Y.; Termsarasab, U.; Lee, M.Y.; Kim, D.-H.; Lee, S.Y.; Kim, J.S.; Cho, H.-J.; Kim, D.-D. Chemosensitizing indomethacin-conjugated chitosan oligosaccharide nanoparticles for tumor-targeted drug delivery. Acta Biomater. 2017, 57, 262–273. [Google Scholar] [CrossRef] [PubMed]
- De Queiroz Antonino, R.; Lia Fook, B.; de Oliveira Lima, V.; de Farias Rached, R.; Lima, E.; da Silva Lima, R.; Peniche Covas, C.; Lia Fook, M. Preparation and Characterization of Chitosan Obtained from Shells of Shrimp (Litopenaeus vannamei Boone). Mar. Drugs 2017, 15, 141. [Google Scholar] [CrossRef]
- Nageh, H.; Ezzat, M.; Ghanim, M.; Hassanin, A.; El-Moneim, A.A. Evaluation of Antibacterial Activity and Drug Release Behavior of Chitosan-Based Nanofibers (In Vitro Study). Pharm. Biosci. J. 2014, 2, 1. [Google Scholar] [CrossRef]
- Bae, K.H.; Park, M.; Do, M.J.; Lee, N.; Ryu, J.H.; Kim, G.W.; Kim, C.; Park, T.G.; Hyeon, T. Chitosan Oligosaccharide-Stabilized Ferrimagnetic Iron Oxide Nanocubes for Magnetically Modulated Cancer Hyperthermia. ACS Nano 2012, 6, 5266–5273. [Google Scholar] [CrossRef]
- Kean, T.; Thanou, M. Biodegradation, biodistribution and toxicity of chitosan. Adv. Drug Deliv. Rev. 2010, 62, 3–11. [Google Scholar] [CrossRef] [PubMed]
- Castro, L.F.-D.; Mengíbar, M.; Sánchez, Á.; Arroyo, L.; Villarán, M.C.; De Apodaca, E.D.; Heras, Á. Films of chitosan and chitosan-oligosaccharide neutralized and thermally treated: Effects on its antibacterial and other activities. LWT 2016, 73, 368–374. [Google Scholar] [CrossRef]
- Termsarasab, U.; Cho, H.-J.; Kim, D.H.; Chong, S.; Chung, S.-J.; Shim, C.-K.; Moon, H.T.; Kim, D.-D. Chitosan oligosaccharide–arachidic acid-based nanoparticles for anti-cancer drug delivery. Int. J. Pharm. 2013, 441, 373–380. [Google Scholar] [CrossRef] [PubMed]
- Mahato, K.K.; Sabbarwal, S.; Misra, N.; Kumar, M. Fabrication of polyvinyl alcohol/chitosan oligosaccharide hydrogel: Physicochemical characterizations and in vitro drug release study. Int. J. Polym. Anal. Charact. 2020, 25, 1–9. [Google Scholar] [CrossRef]
- Jiang, Z.; Li, H.; Qiao, J.; Yang, Y.; Wang, Y.; Liu, W.; Han, B. Potential Analysis and Preparation of Chitosan Oligosaccharides as Oral Nutritional Supplements of Cancer Adjuvant Therapy. Int. J. Mol. Sci. 2019, 20, 920. [Google Scholar] [CrossRef] [PubMed]
- Kumar, A.; Kumar, A. Fabrication of eggshell membrane-based novel buccal mucosa-mimetic surface and mucoadhesion testing of chitosan oligosaccharide films. J. Mater. Res. 2019, 34, 3777–3786. [Google Scholar] [CrossRef]
- Naveed, M.; Phil, L.; Sohail, M.; Hasnat, M.; Baig, M.M.F.A.; Ihsan, A.U.; Shumzaid, M.; Kakar, M.U.; Khan, T.M.; Akabar, M.D.; et al. Chitosan oligosaccharide (COS): An overview. Int. J. Biol. Macromol. 2019, 129, 827–843. [Google Scholar] [CrossRef]
- Guan, G.; Azad, A.K.; Lin, Y.; Kim, S.W.; Tian, Y.; Liu, G.; Wang, H. Biological Effects and Applications of Chitosan and Chito-Oligosaccharides. Front. Physiol. 2019, 10, 516. [Google Scholar] [CrossRef]
- Mengíbar, M.; Mateos-Aparicio, I.; Miralles, B.; Heras, Á. Influence of the physico-chemical characteristics of chito-oligosaccharides (COS) on antioxidant activity. Carbohydr. Polym. 2013, 97, 776–782. [Google Scholar] [CrossRef]
- Luo, Q.; Zhao, J.; Zhang, X.; Pan, W. Nanostructured lipid carrier (NLC) coated with Chitosan Oligosaccharides and its potential use in ocular drug delivery system. Int. J. Pharm. 2011, 403, 185–191. [Google Scholar] [CrossRef]
- Chatterjee, S.; Hui, P.C.-L.; Wat, E.; Kan, C.-W.; Leung, P.-C.; Wang, W. Drug delivery system of dual-responsive PF127 hydrogel with polysaccharide-based nano-conjugate for textile-based transdermal therapy. Carbohydr. Polym. 2020, 236, 116074. [Google Scholar] [CrossRef] [PubMed]
- Nugraheni, A.; Purnawati, D.; Kusumaatmaja, A. Physical Evaluation of PVA/Chitosan Film Blends with Glycerine and Calcium Chloride. J. Phys. Conf. Ser. 2018. [Google Scholar] [CrossRef]
- Dubey, N.K.; Dubey, R. Edible films and coatings: An update on recent advances. In Biopolymer-Based Formulations; Elsevier: Amsterdam, The Netherlands, 2020; pp. 675–695. [Google Scholar]
- Fahmya, A.; Abu-Saiedb, M.A.; Kamounb, E.A.; Khalila, H.F.; Youssefc, M.E.; Attiaa, A.M.; Esmaila, F.A. Polyelectrolyte Nanocomposite Membranes Based on PVA-HA-HAP for Fuel Cell Applications: Synthesis and Application. J. Adv. Chem. 2015, 11, 3426–3439. [Google Scholar]
- Zelkó, R.; Lamprou, D.A.; Sebe, I. Recent Development of Electrospinning for Drug Delivery. Pharmaceutics 2020, 12, 5. [Google Scholar] [CrossRef]
- Negim, E.S.M.; Rakhmetullayeva, R.K.; Yeligbayeva, G.Z.; Urkimbaeva, P.I.; Primzharova, S.T.; Kaldybekov, D.B.; Khatib, J.M.; Mun, G.A.; Craig, W. Improving biodegradability of polyvinyl alcohol/starch blend films for packaging applications. Int. J. Basic Appl. Sci. 2014, 3, 263. [Google Scholar] [CrossRef]
- Guo, L.; Sato, H.; Hashimoto, T.; Ozaki, Y. FTIR Study on Hydrogen-Bonding Interactions in Biodegradable Polymer Blends of Poly(3-hydroxybutyrate) and Poly(4-vinylphenol). Macromolecules 2010, 43, 3897–3902. [Google Scholar] [CrossRef]
- Hu, Y.; Wei, J.; Liang, Y.; Zhang, H.; Zhang, X.; Shen, W.; Wang, H. Zeolitic Imidazolate Framework/Graphene Oxide Hybrid Nanosheets as Seeds for the Growth of Ultrathin Molecular Sieving Membranes. Angew. Chem. 2016, 128, 2088–2092. [Google Scholar] [CrossRef]
- Choo, K.; Ching, Y.C.; Chuah, C.H.; Julai, S.; Liou, N.-S. Preparation and Characterization of Polyvinyl Alcohol-Chitosan Composite Films Reinforced with Cellulose Nanofiber. Materials 2016, 9, 644. [Google Scholar] [CrossRef] [PubMed]
- Zidan, H.M.; Abdelrazek, E.M.; Abdelghany, A.M.; Tarabiah, A.E. Characterization and some physical studies of PVA/PVP filled with MWCNTs. J. Mater. Res. Technol. 2019, 8, 904–913. [Google Scholar] [CrossRef]
- Omkaram, I.; Chakradhar, R.S.; Rao, J.L. EPR, optical, infrared and Raman studies of VO2+ ions in polyvinylalcohol films. Phys. B Condens. Matter. 2007, 388, 318–325. [Google Scholar] [CrossRef]
- Korbag, I.; Saleh, S.M. Studies on the formation of intermolecular interactions and structural characterization of polyvinyl alcohol/lignin film. Int. J. Environ. Stud. 2016, 73, 1–10. [Google Scholar] [CrossRef]
- John, N. Studies on the effect of crosslinking of Chitosan /PVA blend based hydrogel with Gluteraldehyde to be used as thin membranes. Asian J. Appl. Sci. Technol. 2018, 2, 1111–1117. [Google Scholar]
- Rashad, M. Tuning optical properties of polyvinyl alcohol doped with different metal oxide nanoparticles. Opt. Mater. 2020, 105, 109857. [Google Scholar] [CrossRef]
- Gupta, S.; Pramanik, A.K.; Kailath, A.; Mishra, T.; Guha, A.; Nayar, S.; Sinha, A. Composition dependent structural modulations in transparent poly(vinyl alcohol) hydrogels. Colloids Surf. B Biointerfaces 2009, 74, 186–190. [Google Scholar] [CrossRef] [PubMed]
- Hasda, A.M.; Vuppaladadium, S.S.R.; Qureshi, D.; Prasad, G.; Mohanty, B.; Banerjee, I.; Shaikh, H.; Anis, A.; Sarkar, P.; Pal, K. Graphene oxide reinforced nanocomposite oleogels improves corneal permeation of drugs. J. Drug Deliv. Sci. Technol. 2020, 60, 102024. [Google Scholar] [CrossRef]
- Tretinnikov, O.N.; Zagorskaya, S.A. Determination of the degree of crystallinity of poly(vinyl alcohol) by FTIR spectroscopy. J. Appl. Spectrosc. 2012, 79, 521–526. [Google Scholar] [CrossRef]
- Yadav, I.; Rathnam, V.S.; Yogalakshmi, Y.; Chakraborty, S.; Banerjee, I.; Anis, A.; Pal, K. Synthesis and characterization of polyvinyl alcohol- carboxymethyl tamarind gum based composite films. Carbohydr. Polym. 2017, 165, 159–168. [Google Scholar] [CrossRef]
- Sagiri, S.S.; Kasiviswanathan, U.; Shaw, G.S.; Singh, M.; Anis, A.; Pal, K. Effect of sorbitan monostearate concentration on the thermal, mechanical and drug release properties of oleogels. Korean J. Chem. Eng. 2016, 33, 1720–1727. [Google Scholar] [CrossRef]
- El-Hefian, E.A.; Nasef, M.M.; Yahaya, A.H. Preparation and Characterization of Chitosan/Poly(Vinyl Alcohol) Blended Films: Mechanical, Thermal and Surface Investigations. Eur. J. Chem. 2011, 8, 91–96. [Google Scholar] [CrossRef]
- Remiš, T.; Bělský, P.; Andersen, S.M.; Tomáš, M.; Kadlec, J.; Kovářík, T. Preparation and Characterization of Poly(Vinyl Alcohol) (PVA)/SiO2, PVA/Sulfosuccinic Acid (SSA) and PVA/SiO2/SSA Membranes: A Comparative Study. J. Macromol. Sci. Part B 2019, 59, 157–181. [Google Scholar] [CrossRef]
- Bernal-Ballen, A.; Lopez-Garcia, J.; Merchan-Merchan, M.-A.; Lehocky, M. Synthesis and Characterization of a Bioartificial Polymeric System with Potential Antibacterial Activity: Chitosan-Polyvinyl Alcohol-Ampicillin. Molecules 2018, 23, 3109. [Google Scholar] [CrossRef] [PubMed]
- Matsuo, M.; Nakano, Y.; Nakashima, T.; Bin, Y. Mechanical Properties of Chitosan and Chitosan–Poly(Vinyl Alcohol) Blend Films. Chitin Chitosan Oligosacch. Deriv. 2010, 95–116. [Google Scholar] [CrossRef]
- Nangia, R.; Shukla, N.K.; Sharma, A. Frequency and temperature-dependent impedance spectroscopy of PVA/PEG polymer blend film. High Perform. Polym. 2018, 30, 918–926. [Google Scholar] [CrossRef]
- Salman, Y.A. Conductivity and Electrical Properties of Chitosan—Methylcellulose Blend Biopolymer Electrolyte Incorporated with Lithium Tetrafluoroborate. Int. J. Electrochem. Sci. 2018, 13, 3185–3199. [Google Scholar] [CrossRef]
- Arya, A.; Sharma, A.L. Structural, electrical properties and dielectric relaxations in Na+-ion-conducting solid polymer electrolyte. J. Phys. Condens. Matter. 2018, 30, 165402. [Google Scholar] [CrossRef]
- Lehti-Polojärvi, M. Electrical Impedance Tomography Applied to Stem Cells in Hydrogel Scaffold. Master’s Thesis, Tempere University of Technology, Tampere, Finland, 2014. [Google Scholar]
- Davis, R.; Markham, A.; Balfour, J.A. Ciprofloxacin. Drugs 1996, 51, 1019–1074. [Google Scholar] [CrossRef]
- Page-Clisson, M.-E.; Pinto-Alphandary, H.; Ourevitch, M.; Andremont, A.; Couvreur, P. Development of ciprofloxacin-loaded nanoparticles: Physicochemical study of the drug carrier. J. Control. Release 1998, 56, 23–32. [Google Scholar] [CrossRef]
- Sharma, P.C.; Jain, A.; Jain, S.; Pahwa, R.; Yar, M.S. Ciprofloxacin: Review on developments in synthetic, analytical, and medicinal aspects. J. Enzym. Inhib. Med. Chem. 2010, 25, 577–589. [Google Scholar] [CrossRef]
- Walters, J.D.; Zhang, F.; Nakkula, R.J. Mechanisms of Fluoroquinolone Transport by Human Neutrophils. Antimicrob. Agents Chemother. 1999, 43, 2710–2715. [Google Scholar] [CrossRef][Green Version]
- Tamer, T.M.; Sabet, M.M.; Omer, A.M.; Abbas, E.; Eid, A.I.; Mohy-Eldin, M.S.; Hassan, M.A. Hemostatic and antibacterial PVA/Kaolin composite sponges loaded with penicillin-streptomycin for wound dressing applications. Sci. Rep. 2021, 11, 1–15. [Google Scholar] [CrossRef] [PubMed]
- Pal, K.; Banthia, A.K.; Majumdar, D.K. Biomedical evaluation of polyvinyl alcohol-gelatin esterified hydrogel for wound dressing. J. Mater. Sci. Mater. Electron. 2007, 18, 1889–1894. [Google Scholar] [CrossRef] [PubMed]
- Kandra, R.; Bajpai, S. Synthesis, mechanical properties of fluorescent carbon dots loaded nanocomposites chitosan film for wound healing and drug delivery. Arab. J. Chem. 2020, 13, 4882–4894. [Google Scholar] [CrossRef]
- Kamoun, E.A.; Kenawy, E.-R.S.; Tamer, T.M.; El-Meligy, M.A.; Eldin, M.S.M. Poly (vinyl alcohol)-alginate physically crosslinked hydrogel membranes for wound dressing applications: Characterization and bio-evaluation. Arab. J. Chem. 2015, 8, 38–47. [Google Scholar] [CrossRef]
- Chophi, R.; Sharma, S.; Singh, R. Forensic analysis of red lipsticks using ATR-FTIR spectroscopy and chemometrics. Forensic Chem. 2020, 17, 100209. [Google Scholar] [CrossRef]


| Samples | Peaks | Peak Position (xc) (° 2θ) | FWHM (° 2θ) | d-Spacing (Å) | Crystallite Size (D) (nm) | Lattice Strain |
|---|---|---|---|---|---|---|
| CP0 | Peak A | 22.699 | 7.104 | 4.545 | 1.380 | 0.154 |
| Peak B | 22.699 | 1.877 | 4.545 | 5.240 | 0.041 | |
| Average | 4.491 | 4.545 | 3.310 | 0.098 | ||
| CP1 | Peak A | 22.677 | 7.007 | 4.550 | 1.400 | 0.153 |
| Peak B | 22.677 | 1.896 | 4.550 | 5.190 | 0.041 | |
| Average | 4.452 | 4.550 | 3.295 | 0.097 | ||
| CP2 | Peak A | 22.871 | 7.305 | 4.512 | 1.350 | 0.158 |
| Peak B | 22.871 | 1.906 | 4.512 | 5.160 | 0.041 | |
| Average | 4.606 | 4.512 | 3.255 | 0.099 | ||
| CP3 | Peak A | 22.864 | 6.843 | 4.513 | 1.440 | 0.148 |
| Peak B | 22.864 | 1.827 | 4.513 | 5.380 | 0.039 | |
| Average | 4.335 | 4.513 | 3.410 | 0.094 | ||
| CP4 | Peak A | 22.789 | 7.104 | 4.528 | 1.380 | 0.154 |
| Peak B | 22.789 | 1.904 | 4.528 | 5.160 | 0.041 | |
| Average | 4.504 | 4.528 | 3.270 | 0.098 |
| Formulations | % Hemolysis |
|---|---|
| CP0 | 0.256 ± 0.171 |
| CP1 | 0.034 ± 0.085 |
| CP2 | 0.057 ± 0.053 |
| CP3 | 0.036 ± 0.073 |
| CP4 | 0.115 ± 0.136 |
| Film Samples | PVA Solution (g; 10% w/w) | COS Solution (g) | Water (g) | Crosslinker Reagent (mL) | CPH (g) | wt% of COS in Films | ||||
|---|---|---|---|---|---|---|---|---|---|---|
| 0% (water) | 2.5% | 5.0% | 7.5% | 10.0% | ||||||
| CP0 | 18.00 | 2.00 | -- | -- | -- | -- | 20.00 | 2.00 | 0.00 | 0.00 |
| CP1 | 18.00 | -- | 2.00 | -- | -- | 20.00 | 2.00 | 0.00 | 2.70 | |
| CP2 | 18.00 | -- | -- | 2.00 | -- | -- | 20.00 | 2.00 | 0.00 | 5.40 |
| CP3 | 18.00 | -- | -- | -- | 2.00 | -- | 20.00 | 2.00 | 0.00 | 8.11 |
| CP4 | 18.00 | -- | -- | -- | -- | 2.00 | 20.00 | 2.00 | 0.00 | 10.81 |
| CP0D | 18.00 | 2.00 | -- | -- | -- | -- | 20.00 | 2.00 | 0.17 | 0.00 |
| CP1D | 18.00 | -- | 2.00 | -- | -- | 20.00 | 2.00 | 0.17 | 2.70 | |
| CP2D | 18.00 | -- | -- | 2.00 | -- | -- | 20.00 | 2.00 | 0.17 | 5.40 |
| CP3D | 18.00 | -- | -- | -- | 2.00 | -- | 20.00 | 2.00 | 0.17 | 8.11 |
| CP4D | 18.00 | -- | -- | -- | -- | 2.00 | 20.00 | 2.00 | 0.17 | 10.81 |
Publisher’s Note: MDPI stays neutral with regard to jurisdictional claims in published maps and institutional affiliations. |
© 2021 by the authors. Licensee MDPI, Basel, Switzerland. This article is an open access article distributed under the terms and conditions of the Creative Commons Attribution (CC BY) license (https://creativecommons.org/licenses/by/4.0/).
Share and Cite
Qureshi, D.; Sahoo, A.; Mohanty, B.; Anis, A.; Kulikouskaya, V.; Hileuskaya, K.; Agabekov, V.; Sarkar, P.; Ray, S.S.; Maji, S.; et al. Fabrication and Characterization of Poly (vinyl alcohol) and Chitosan Oligosaccharide-Based Blend Films. Gels 2021, 7, 55. https://doi.org/10.3390/gels7020055
Qureshi D, Sahoo A, Mohanty B, Anis A, Kulikouskaya V, Hileuskaya K, Agabekov V, Sarkar P, Ray SS, Maji S, et al. Fabrication and Characterization of Poly (vinyl alcohol) and Chitosan Oligosaccharide-Based Blend Films. Gels. 2021; 7(2):55. https://doi.org/10.3390/gels7020055
Chicago/Turabian StyleQureshi, Dilshad, Ayasharani Sahoo, Biswaranjan Mohanty, Arfat Anis, Viktoryia Kulikouskaya, Kseniya Hileuskaya, Vladimir Agabekov, Preetam Sarkar, Sirsendu Sekhar Ray, Samarendra Maji, and et al. 2021. "Fabrication and Characterization of Poly (vinyl alcohol) and Chitosan Oligosaccharide-Based Blend Films" Gels 7, no. 2: 55. https://doi.org/10.3390/gels7020055
APA StyleQureshi, D., Sahoo, A., Mohanty, B., Anis, A., Kulikouskaya, V., Hileuskaya, K., Agabekov, V., Sarkar, P., Ray, S. S., Maji, S., & Pal, K. (2021). Fabrication and Characterization of Poly (vinyl alcohol) and Chitosan Oligosaccharide-Based Blend Films. Gels, 7(2), 55. https://doi.org/10.3390/gels7020055