

Rheological Insight into the 3D Printability of Carboxymethyl Cellulose-Based Hydrogels

 , ,
, ,  and
and
Abstract

1. Introduction
2. Results and Discussion
2.1. CMC-Based Hydrogels
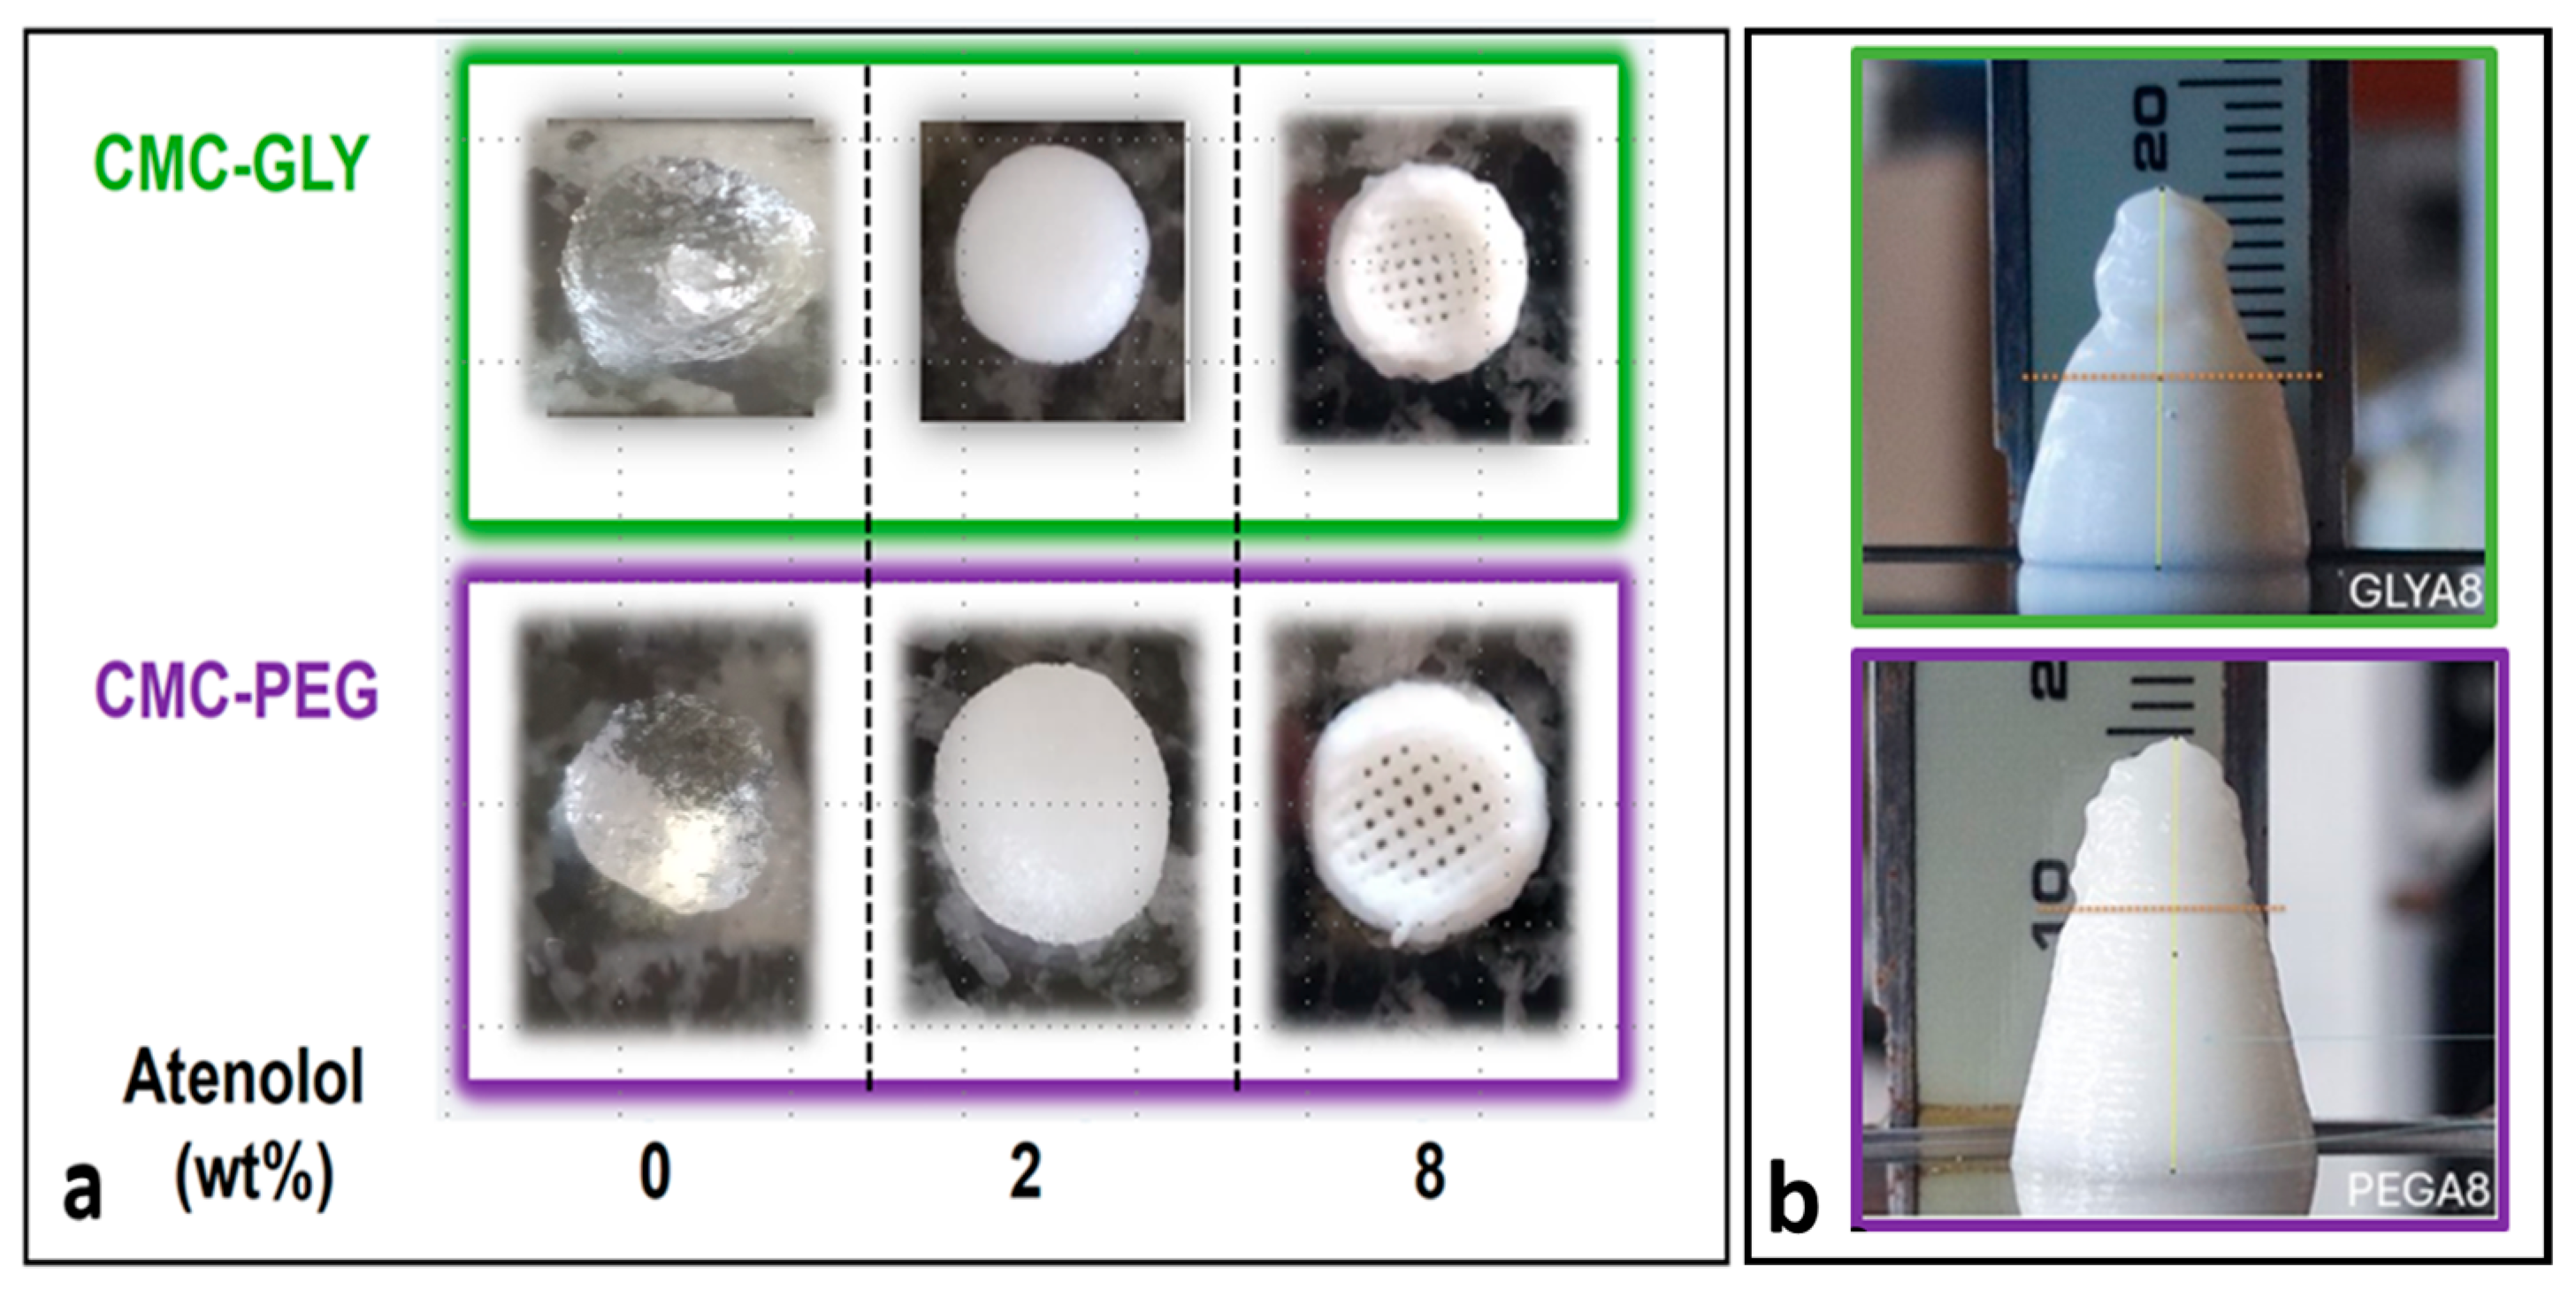
2.2. Direct Ink Writing of CMC-Based Hydrogel: Printing-Strength Characterization
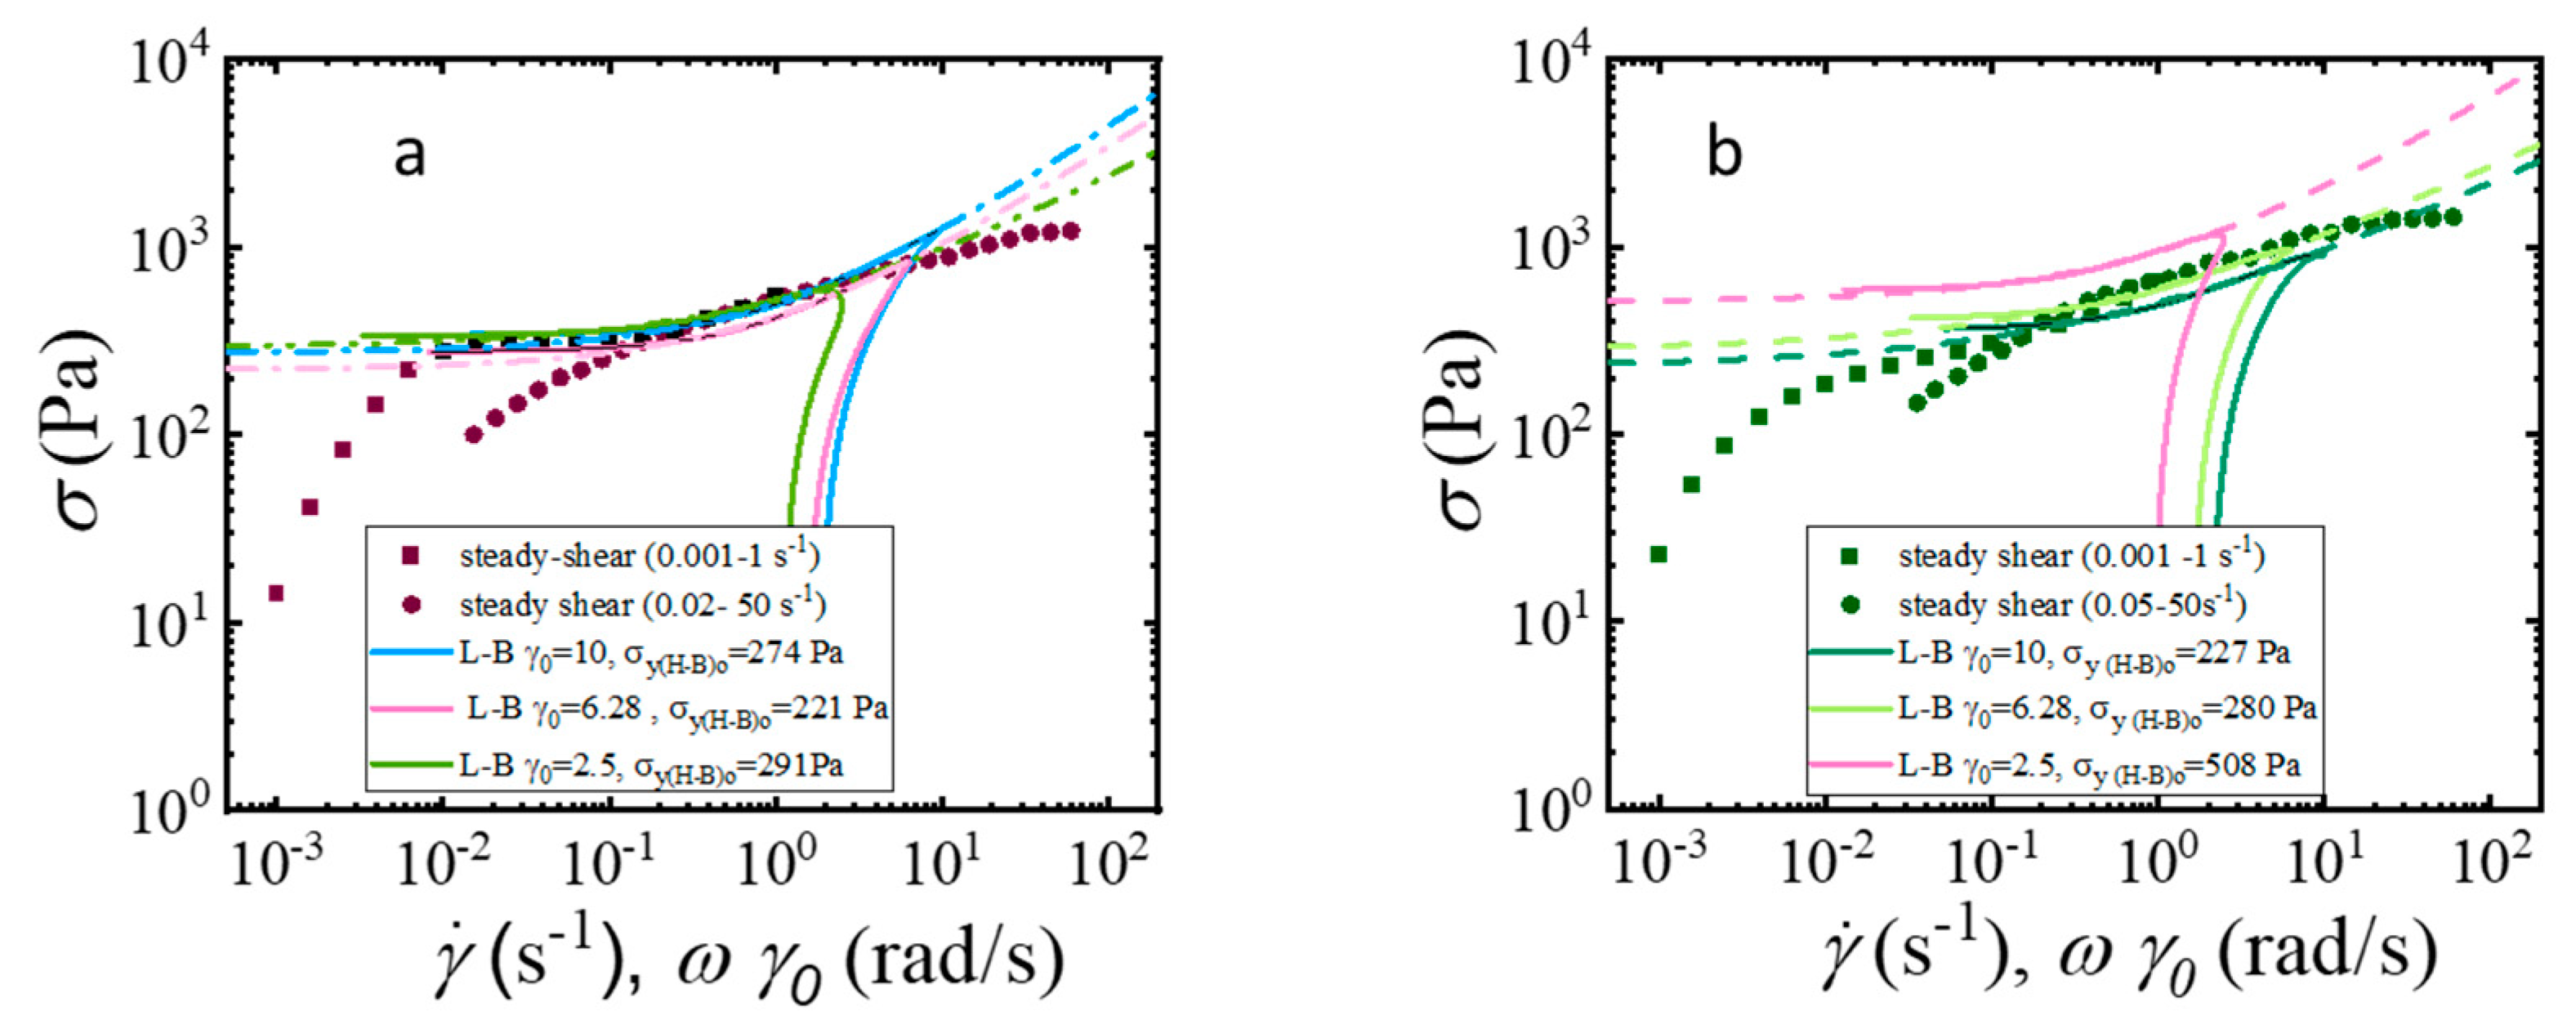
2.3. Basic Rheological Characterization: The Cox–Merz Rule
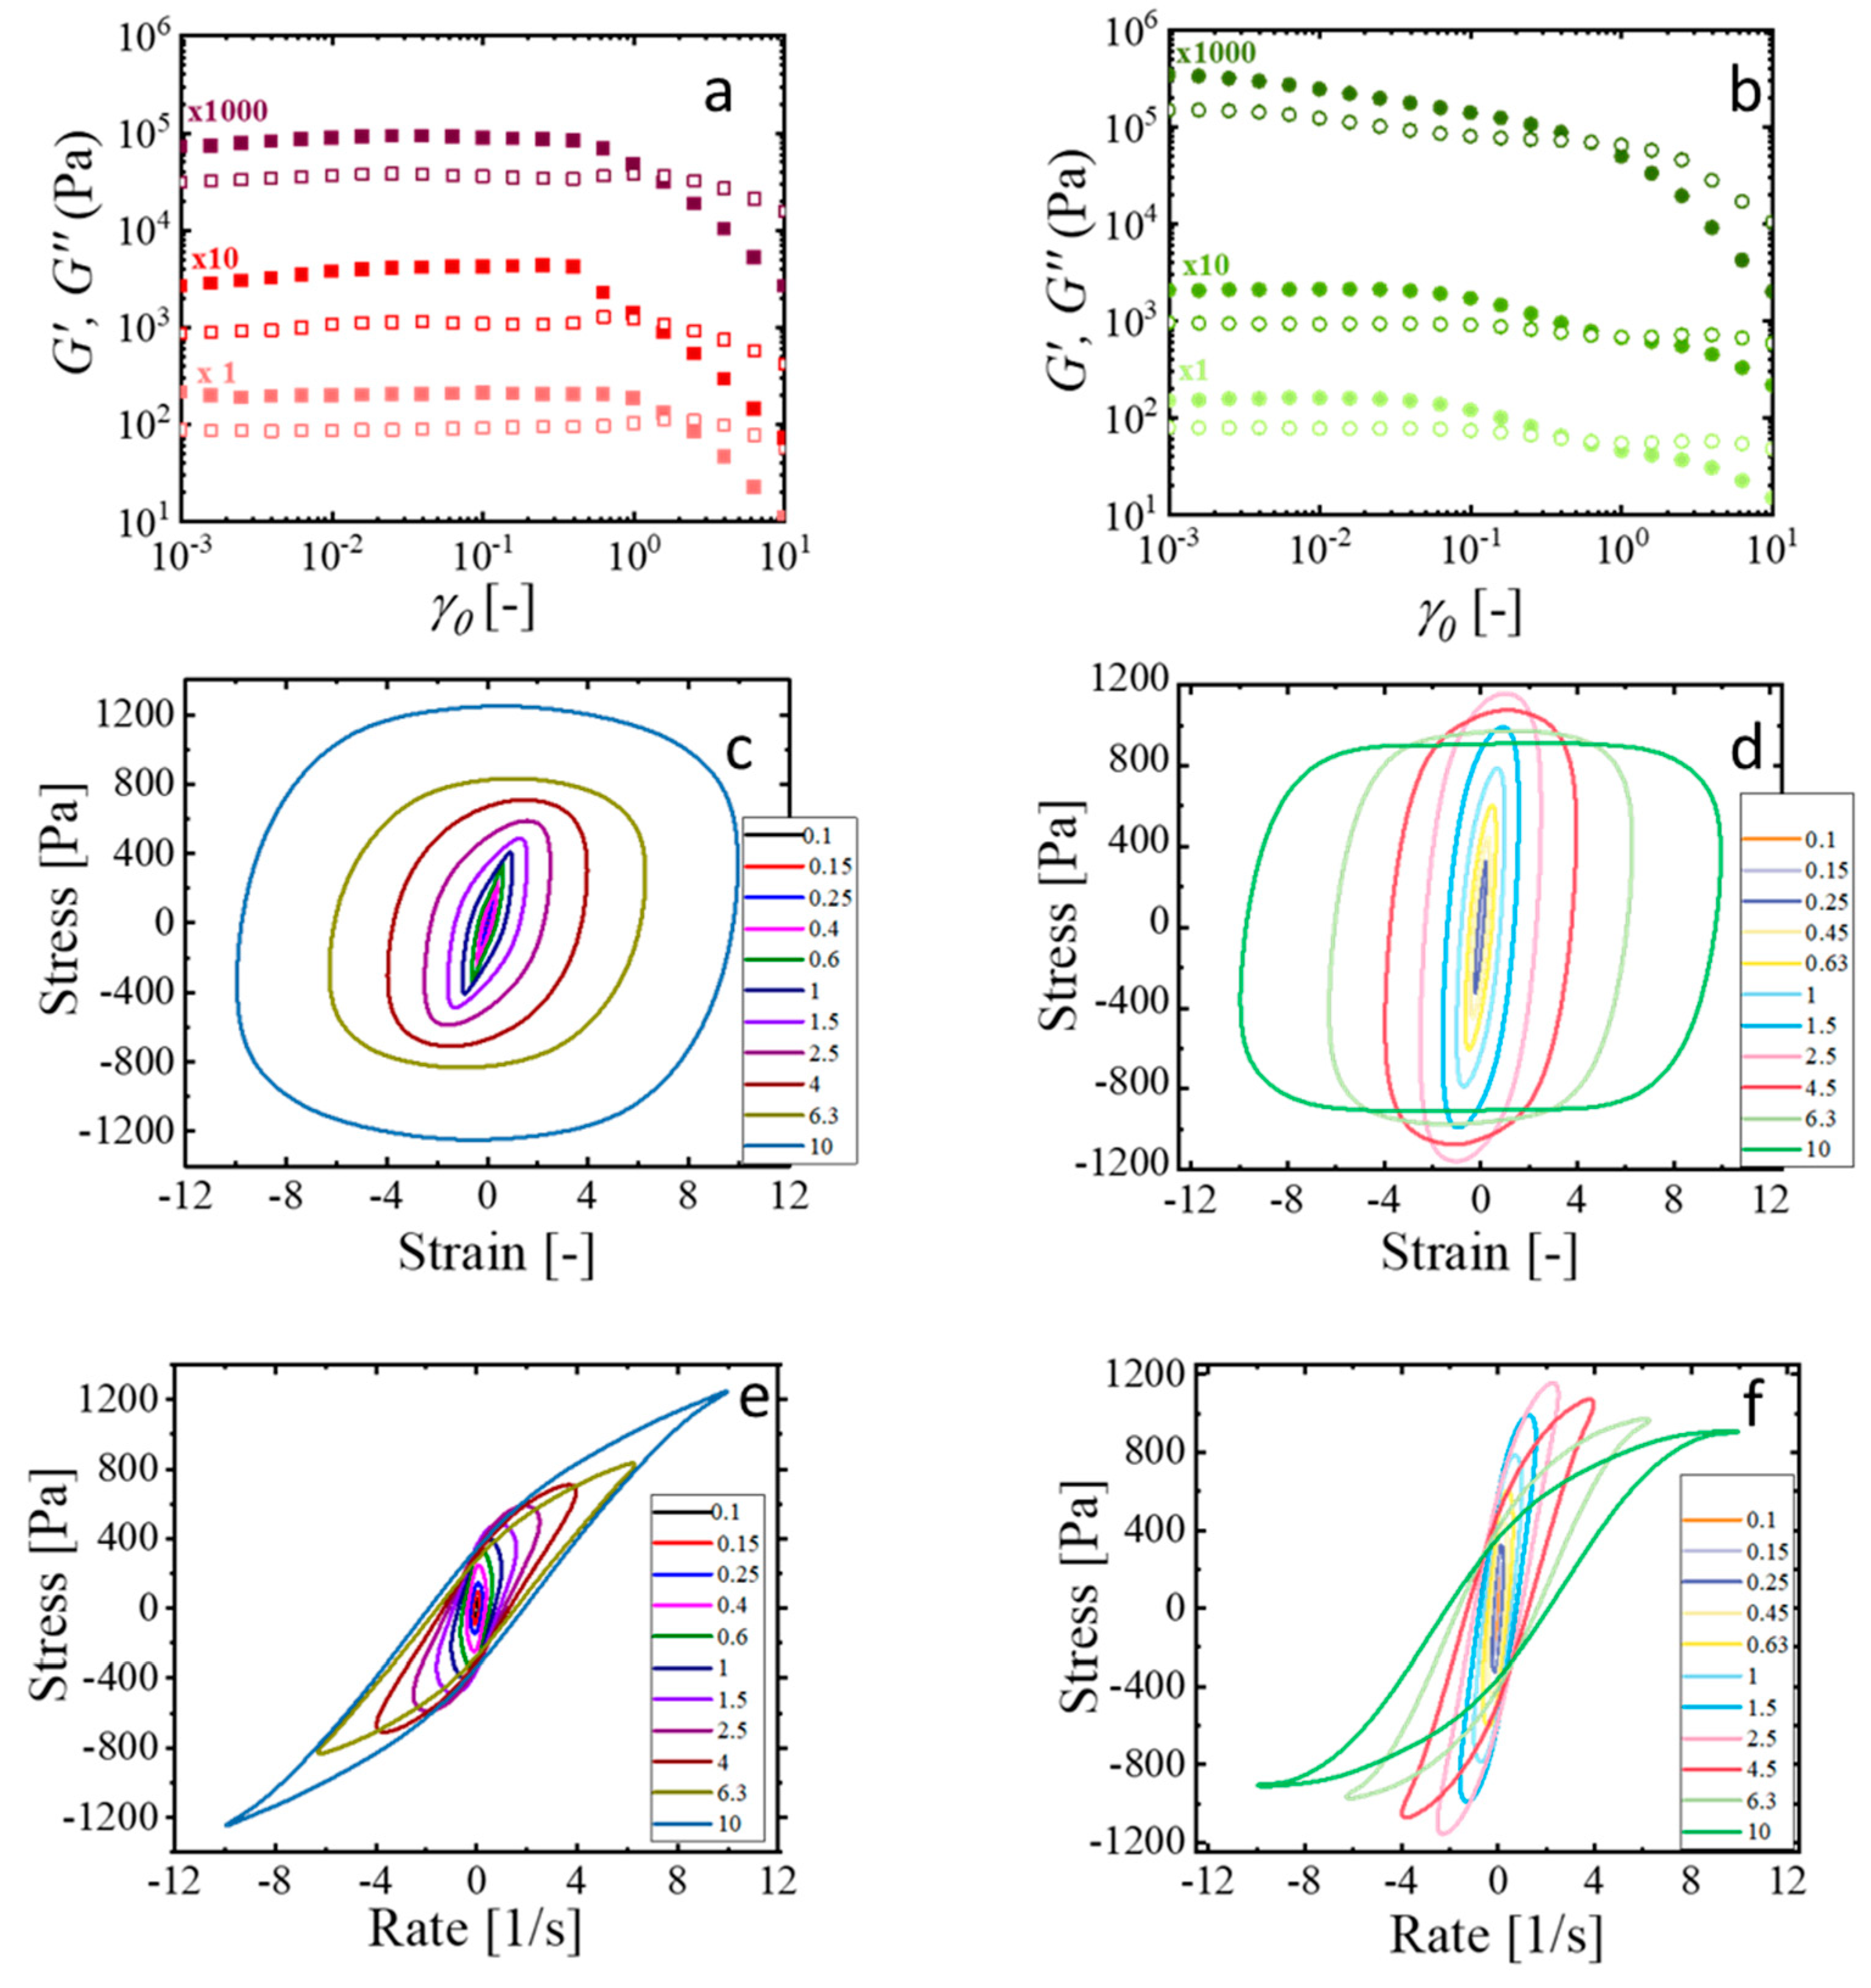
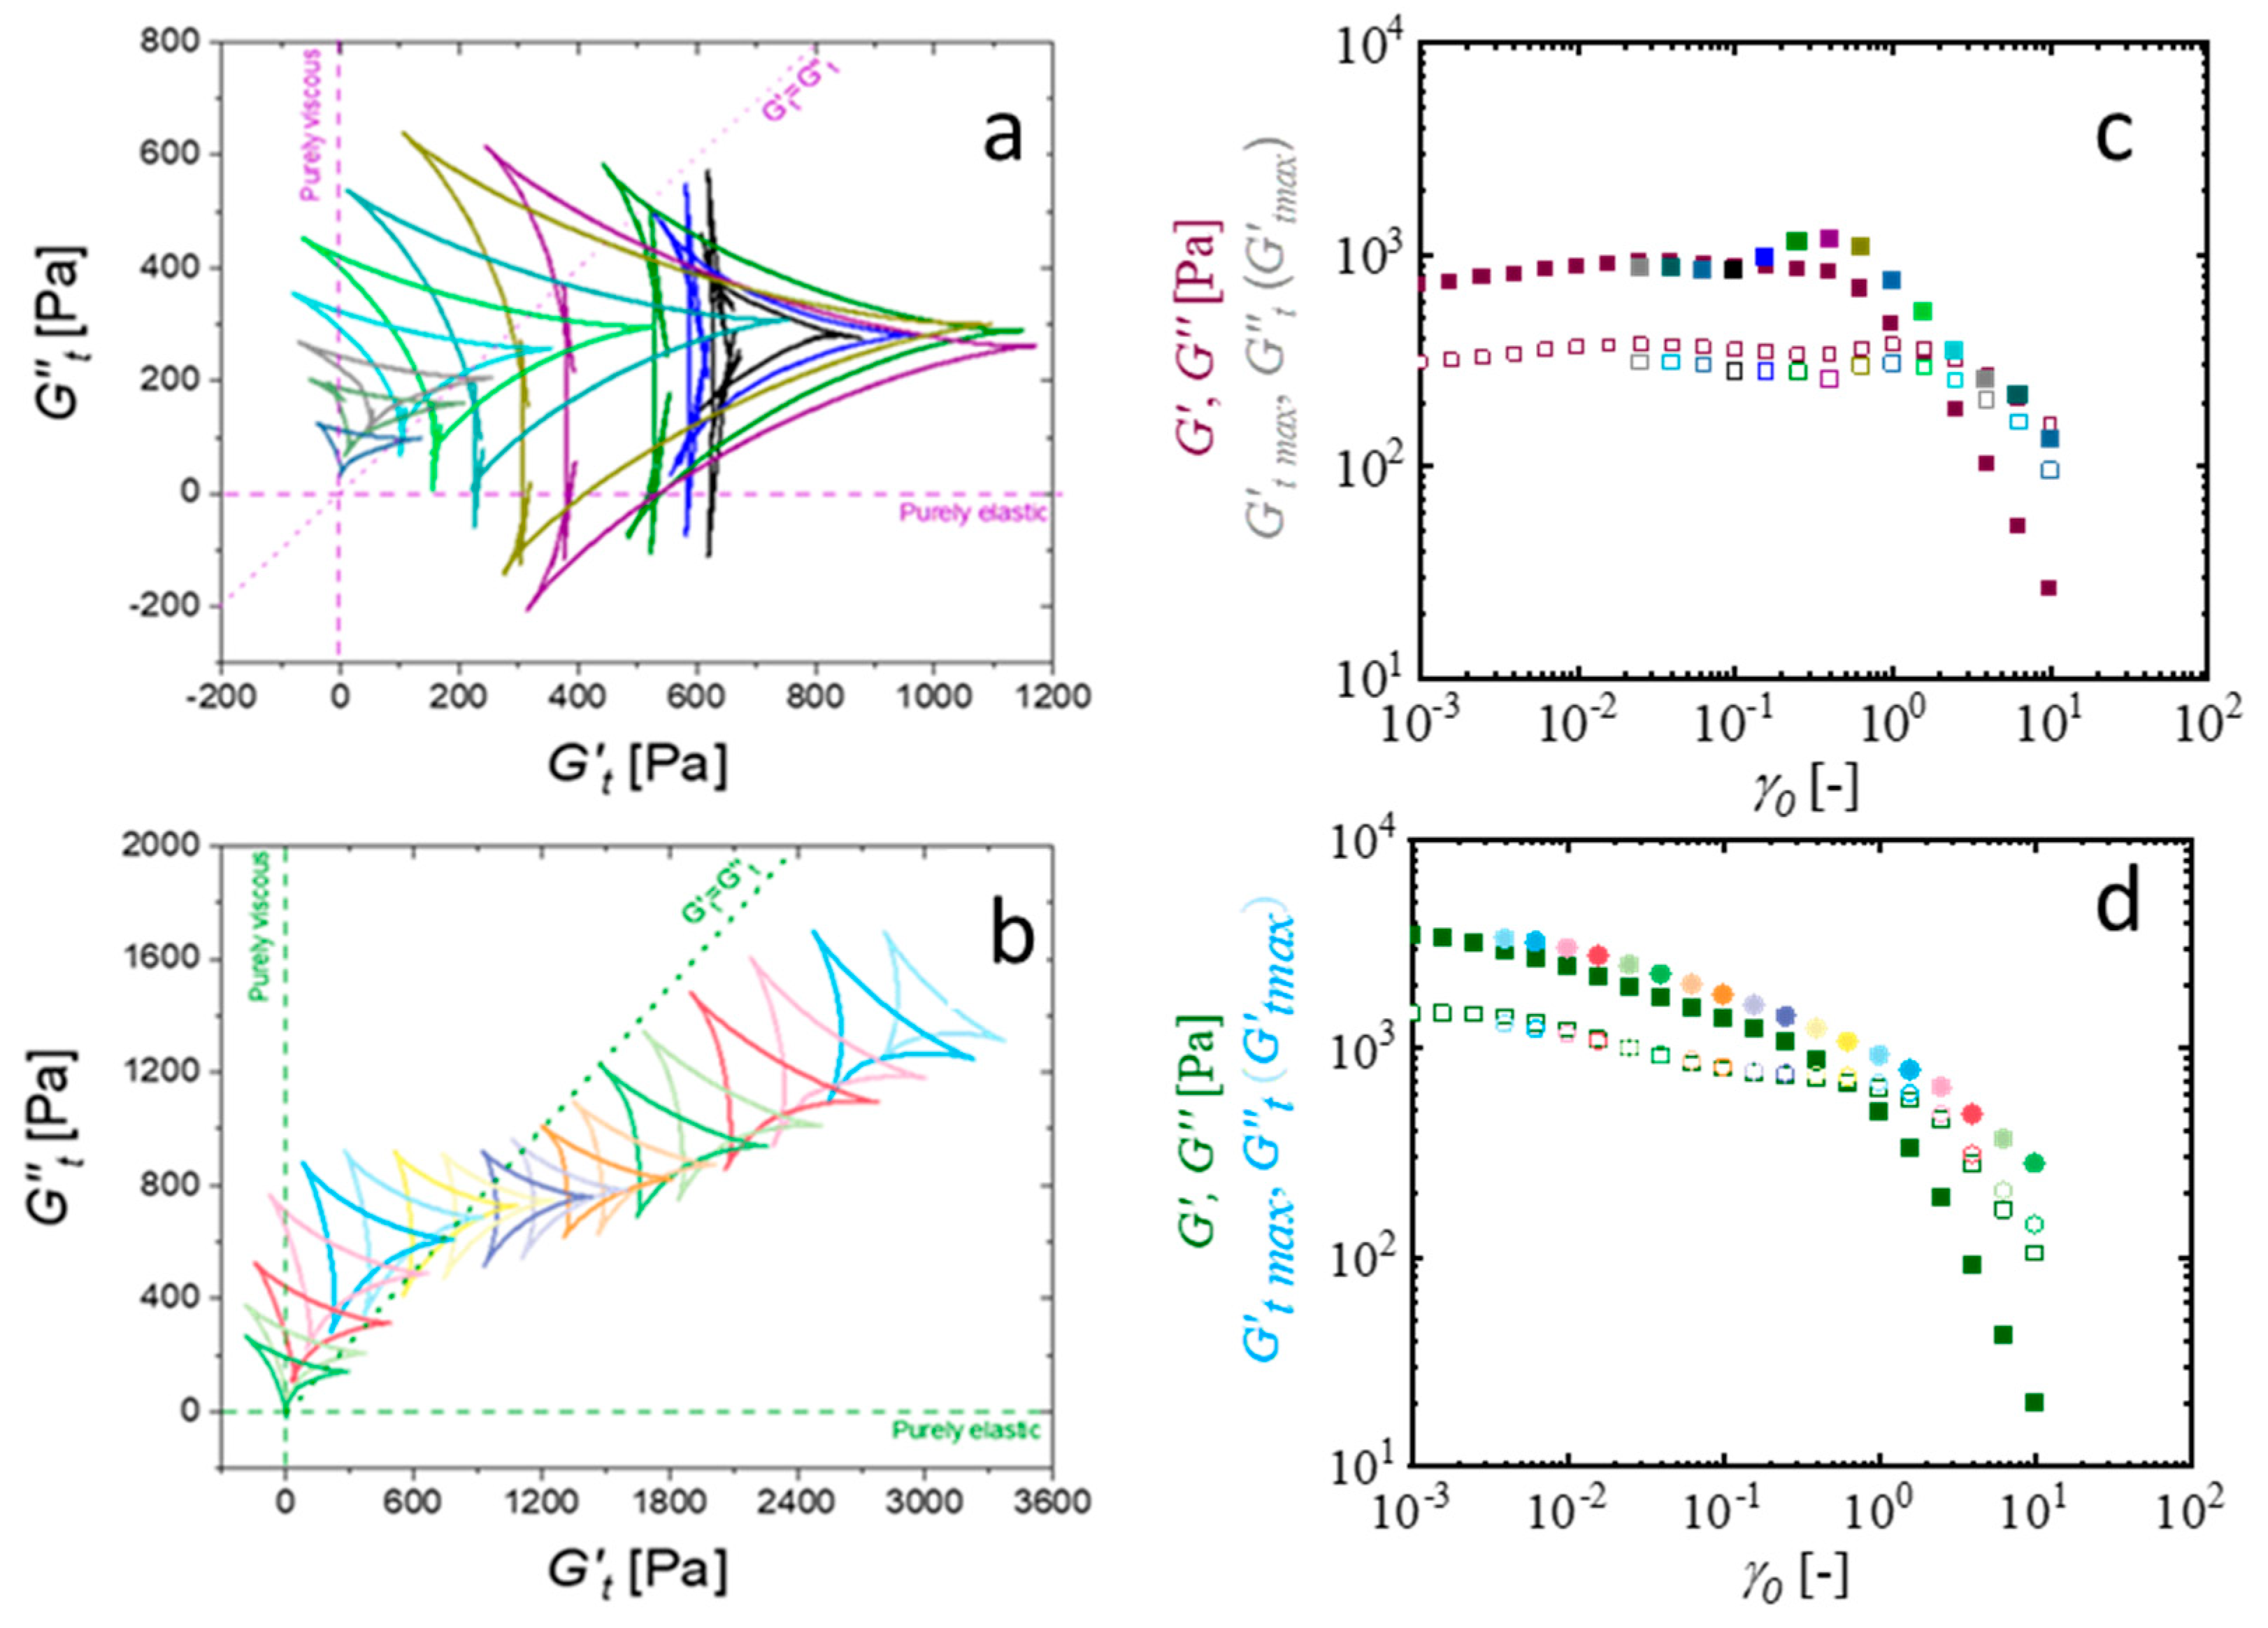
2.4. Nonlinear Viscoelastic Characterization Using LAOS
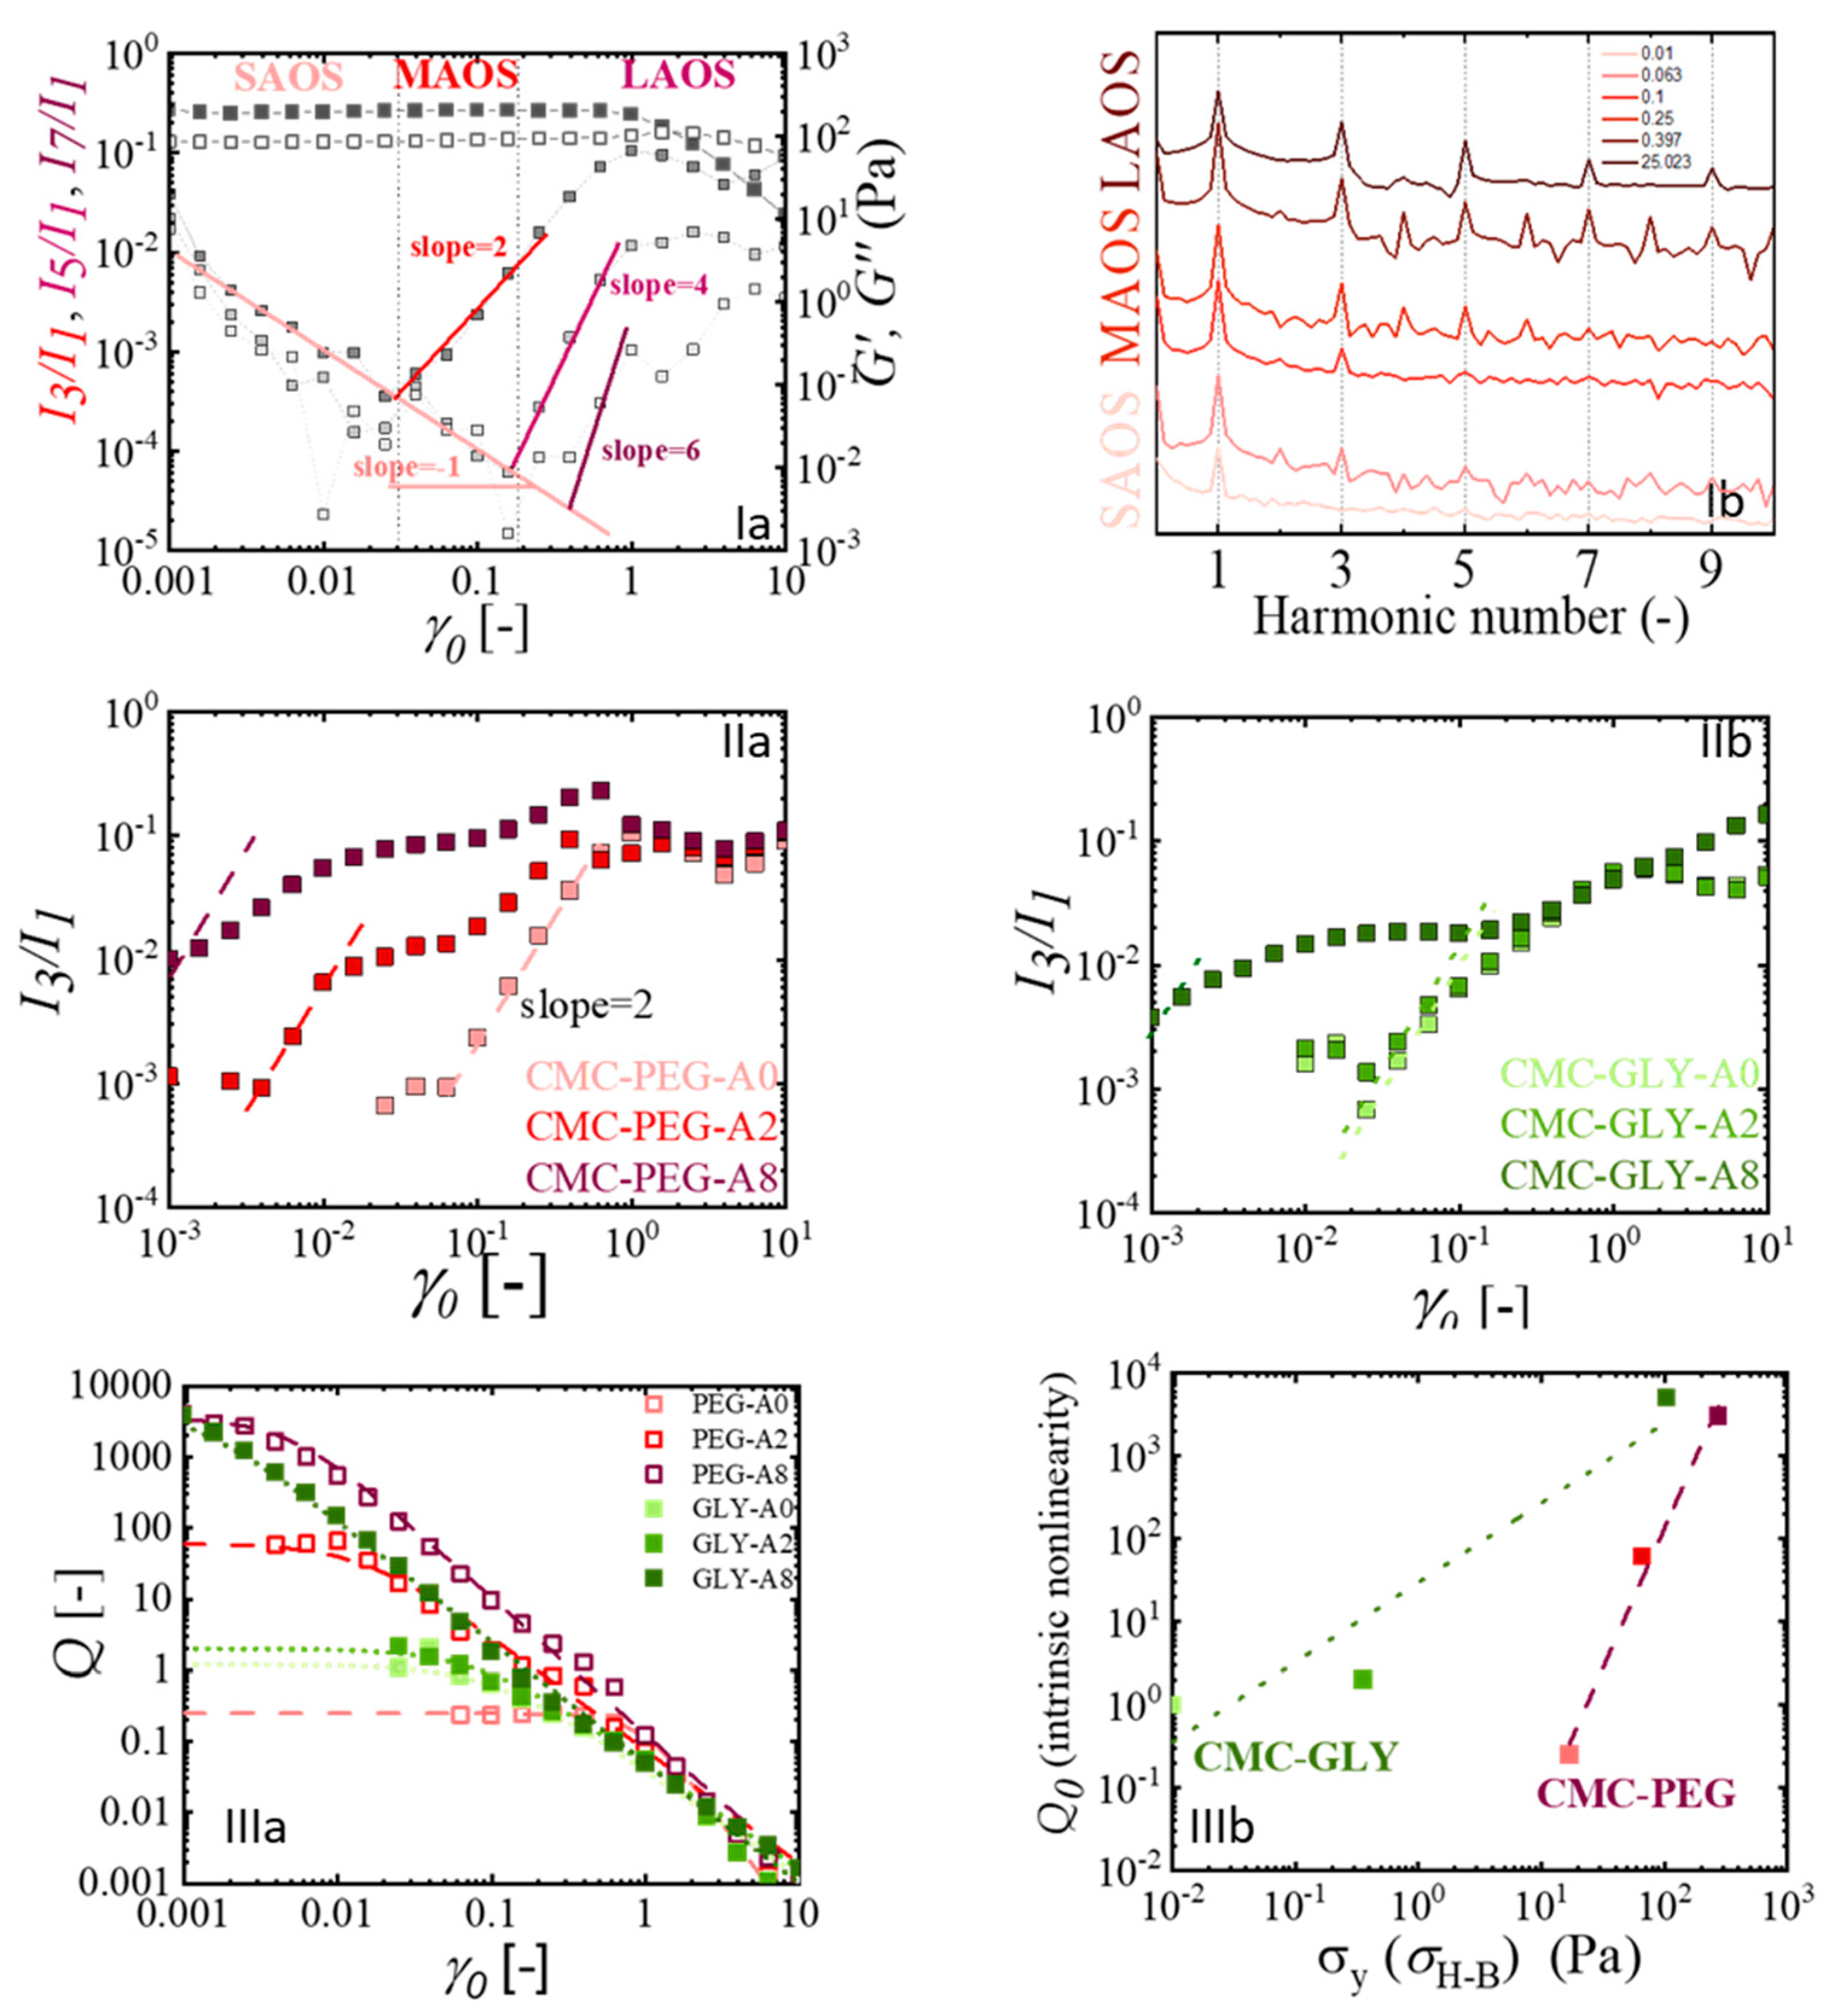
2.4.1. Quantification of the Intrinsic Nonlinear Viscoelasticity
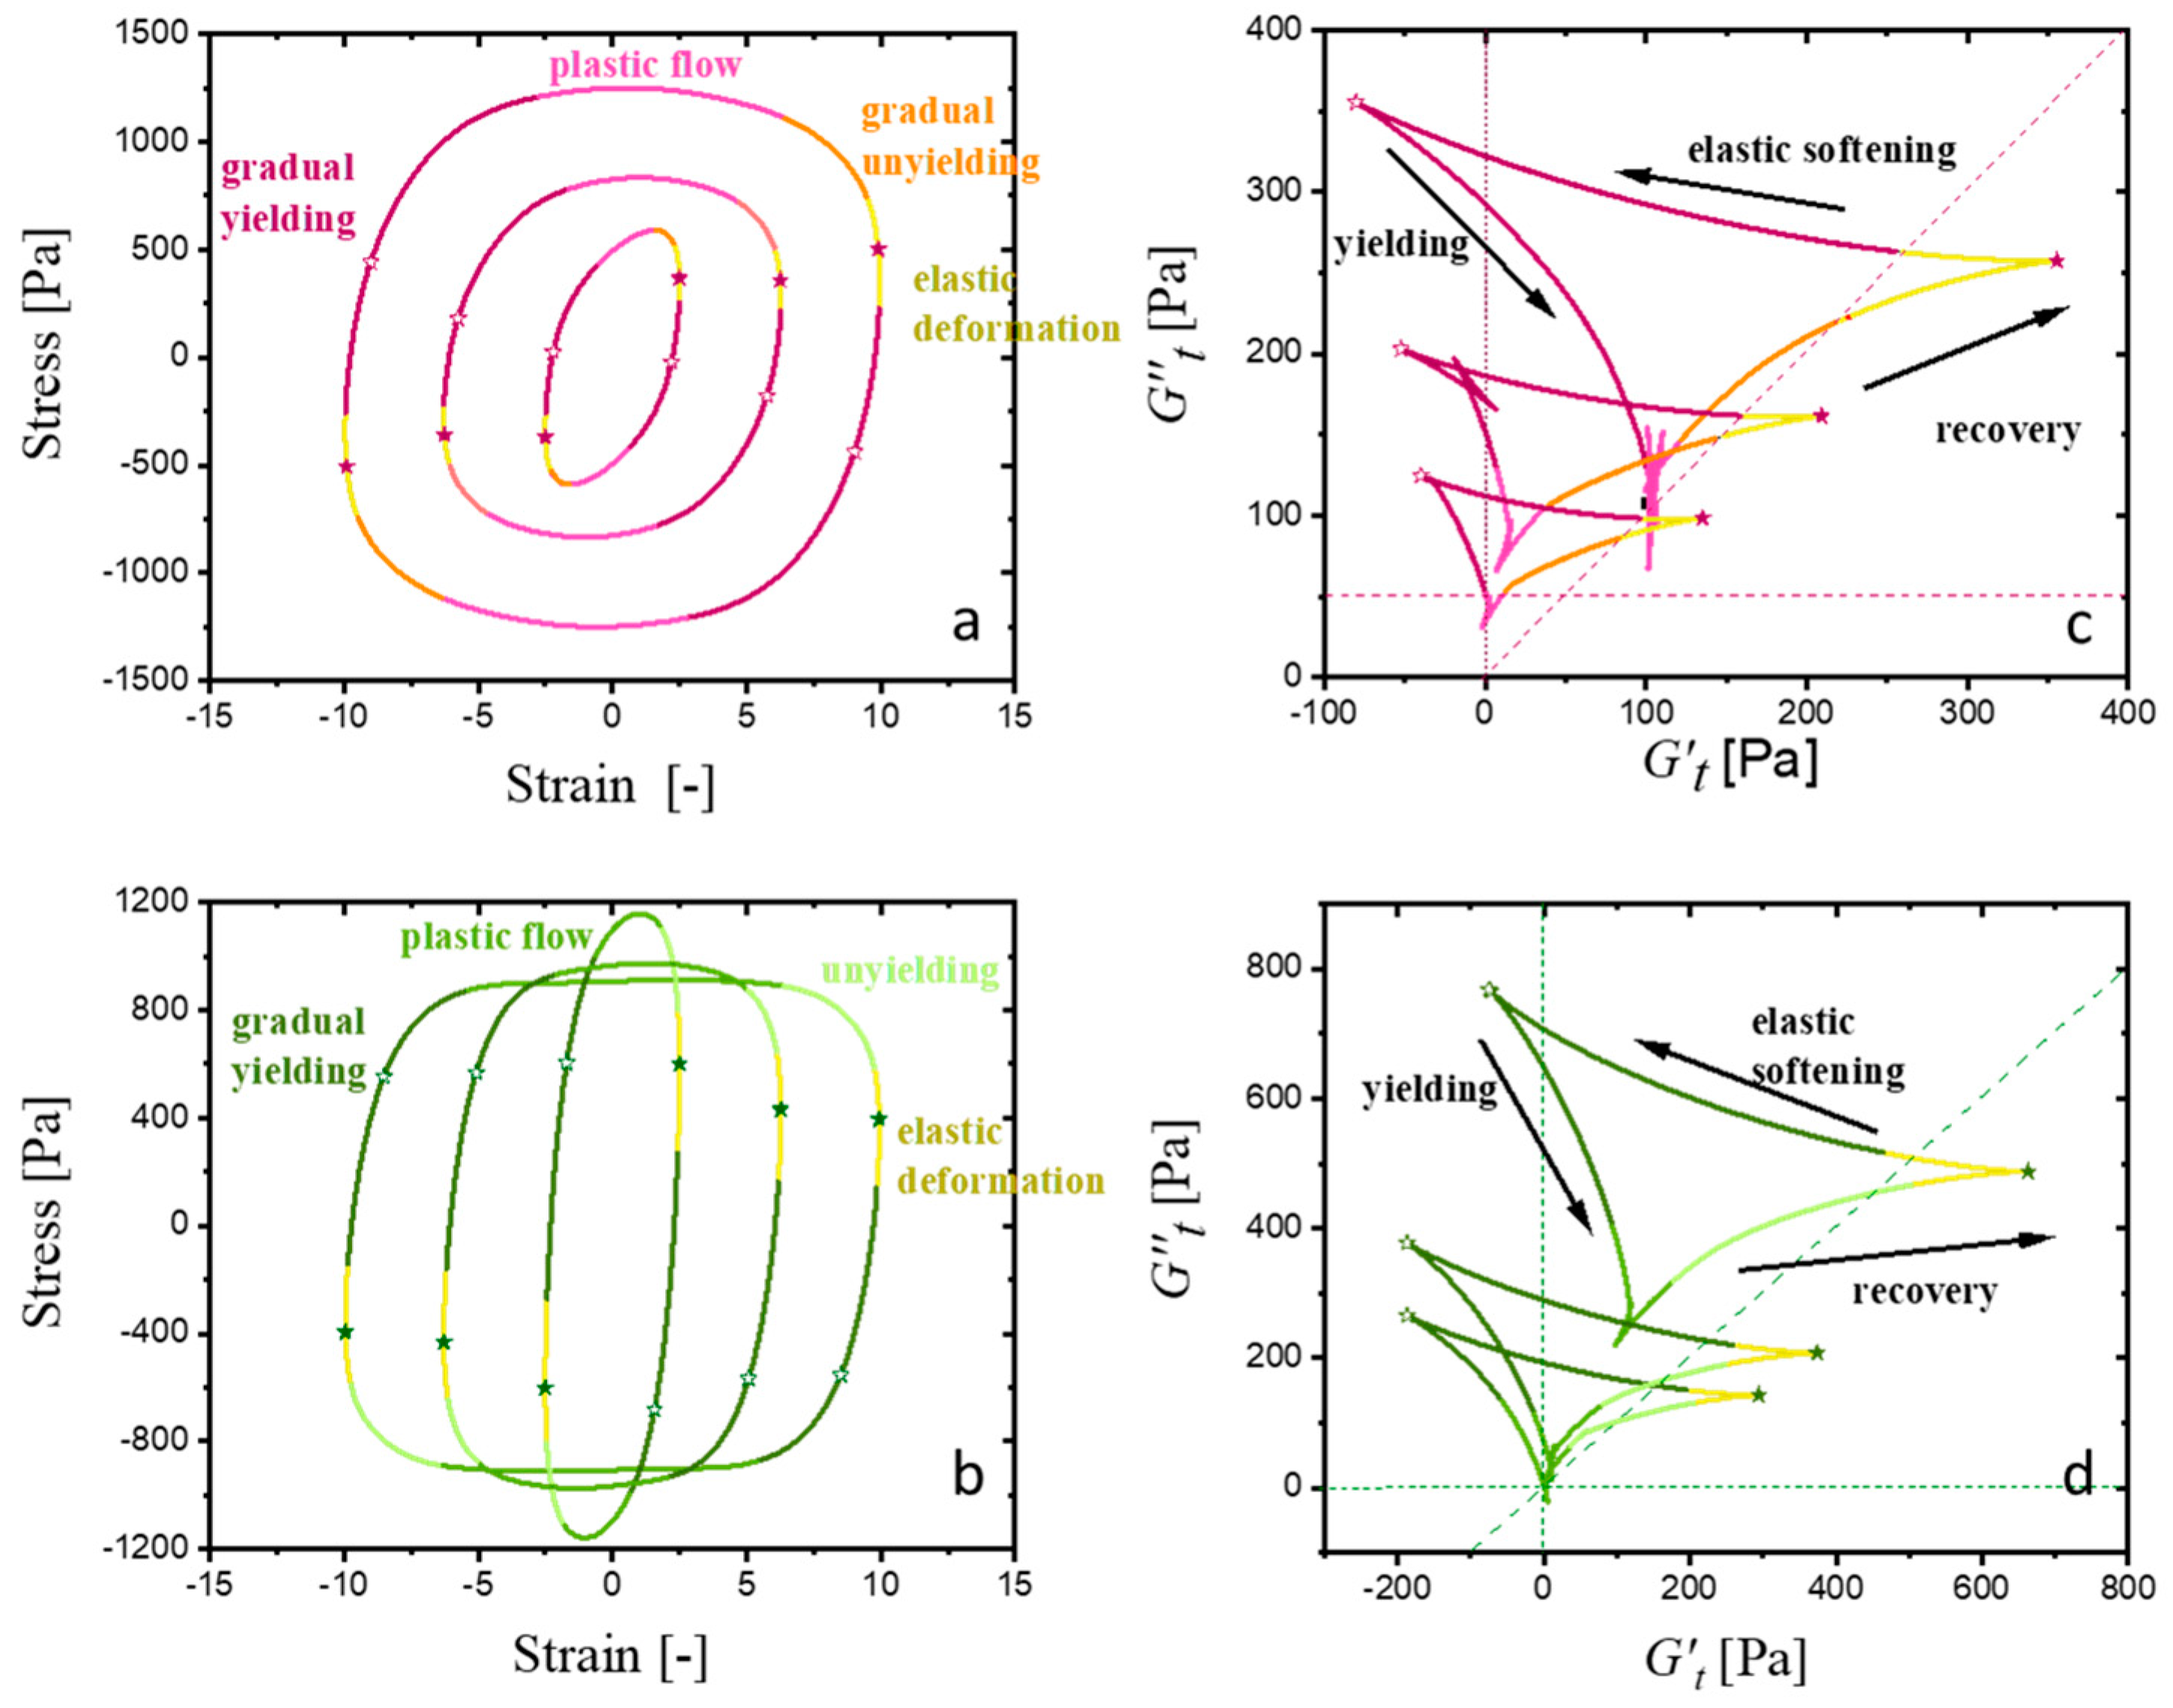
2.4.2. The Elastic and Viscous Nature of the Nonlinearity
2.4.3. Physical Approach to the Yielding Process
3. Conclusions
4. Materials and Methods
4.1. CMC-Based Hydrogels Formulations
4.2. Three-Dimensional Printing
4.3. Rheological Measurements
4.3.1. Fourier-Transform Rheology, FTR
4.3.2. Fourier-Transform–Stress-Decomposition Rheology, FTR-SD
4.3.3. Sequence of Physical Processes Analysis, SPP
Author Contributions
Funding
Institutional Review Board Statement
Informed Consent Statement
Data Availability Statement
Conflicts of Interest
References
- Soleymani, S.; Naghib, S.M. 3D and 4D printing hydroxyapatite-based scaffolds for bone tissue engineering and regeneration. Heliyon 2023, 9, e19363. [Google Scholar] [CrossRef] [PubMed]
- Honkamäki, L.; Kulta, O.; Puistola, P.; Hopia, K.; Emeh, P.; Isosaari, L.; Mörö, A.; Narkilahti, S. Hyaluronic Acid-Based 3D Bioprinted Hydrogel Structure for Directed Axonal Guidance and Modeling Innervation In Vitro. Adv. Healthc. Mater. 2024, 14, 2402504. [Google Scholar] [CrossRef]
- Qiu, B.; Bessler, N.; Figler, K.; Buchholz, M.B.; Rios, A.C.; Malda, J.; Levato, R.; Caiazzo, M. Bioprinting Neural Systems to Model Central Nervous System Diseases. Adv. Funct. Mater. 2020, 30, 1910250. [Google Scholar] [CrossRef] [PubMed]
- Baniasadi, H.; Abidnejad, R.; Fazeli, M.; Lipponen, J.; Niskanen, J.; Kontturi, E.; Seppälä, J.; Rojas, O.J. Innovations in hydrogel-based manufacturing: A comprehensive review of direct ink writing technique for biomedical applications. Adv. Colloid Interface 2024, 324, 103095. [Google Scholar] [CrossRef]
- Chen, J.X.M.; Chen, T.; Zhang, Y.; Fang, W.; Li, W.E.; Li, T.; Popovic, M.R.; Naguib, H.E. Conductive Bio-based Hydrogel for Wearable Electrodes via Direct Ink Writing on Skin. Adv. Funct. Mater. 2024, 34, 2403721. [Google Scholar] [CrossRef]
- Jiang, P.; Yan, C.; Guo, Y.; Zhang, X.; Cai, M.; Jia, X.; Wang, X.; Zhou, F. Direct ink writing with high-strength and swelling-resistant biocompatible physically crosslinked hydrogels. Biomater. Sci. 2019, 7, 1805–1814. [Google Scholar] [CrossRef]
- Liu, Y.; Hildner, M.; Roy, O.; Bogert, W.A.V.D.; Lorenz, J.; Desroches, M.; Koppi, K.; Shih, A.; Larson, R.G. On the selection of rheological tests for the prediction of 3D printability. J. Rheol. 2023, 67, 791. [Google Scholar] [CrossRef]
- Wei, P.; Cipriani, C.; Hsieh, C.M.; Kamani, K.; Rogers, S.; Pentzer, E. Go with the flow: Rheological requirements for direct ink write printability. J. Appl. Phys. 2023, 134, 100701. [Google Scholar] [CrossRef]
- Rau, D.A.; Bortner, M.J.; Williams, C.B. A rheology roadmap for evaluating the printability of material extrusion inks. Addit. Manuf. 2023, 75, 103745. [Google Scholar] [CrossRef]
- Rau, D.A.; Williams, C.B.; Bortner, M.J. Rheology and printability: A survey of critical relationships for direct ink write materials design. Prog. Mater. Sci. 2023, 140, 101188. [Google Scholar] [CrossRef]
- Agrawal, R.; García-Tuñón, E. Interplay between yielding, “recovery”, and strength of yield stress fluids for direct ink writing: New insights from oscillatory rheology. Soft Matter 2024, 20, 7429–7447. [Google Scholar] [CrossRef]
- García-Tuñón, E.; Agrawal, R.; Ling, B.; Dennis, D.J.C. Fourier-transform rheology and printability maps of complex fluids for three-dimensional printing. Phys. Fluids 2023, 35, 017113. [Google Scholar] [CrossRef]
- Calafel, I.; Aguirresarobe, R.H.; Peñas, M.I.; Santamaria, A.; Tierno, M.; Conde, J.I.; Pascual, B. Searching for rheological conditions for FFF 3D printing with PVC based flexible compounds. Materials 2020, 13, 178. [Google Scholar] [CrossRef] [PubMed]
- Corker, A.; Ng, H.C.H.; Poole, R.J.; García-Tuñón, E. 3D printing with 2D colloids: Designing rheology protocols to predict “printability” of soft-materials. Soft Matter 2019, 15, 1444–1456. [Google Scholar] [CrossRef] [PubMed]
- Capitani, D.; Del Nobile, M.A.; Mensitieri, G.; Sannino, A.; Segre, A.L. 13C solid-state NMR determination of cross-linking degree in superabsorbing cellulose-based networks. Macromolecules 2000, 33, 430–437. [Google Scholar] [CrossRef]
- Mallakpour, S.; Tukhani, M.; Hussain, C.M. Recent advancements in 3D bioprinting technology of carboxymethyl cellulose-based hydrogels: Utilization in tissue engineering. Adv. Colloid Interface Sci. 2021, 292, 102415. [Google Scholar] [CrossRef] [PubMed]
- Coussot, P.; Rogers, S.A. Oldroyd’s model and the foundation of modern rheology of yield stress fluids. J. Non-Newton. Fluid. Mech. 2021, 295, 104604. [Google Scholar] [CrossRef]
- Kamani, K.; Donley, G.J.; Rogers, S.A. Unification of the Rheological Physics of Yield Stress Fluids. Phys. Rev. Lett. 2021, 126, 218002. [Google Scholar] [CrossRef]
- Erturk, M.Y.; Rogers, S.A.; Kokini, J. Comparison of Sequence of Physical Processes (SPP) and Fourier Transform Coupled with Chebyshev Polynomials (FTC) methods to Interpret Large Amplitude Oscillatory Shear (LAOS) Response of Viscoelastic Doughs and Viscous Pectin Solution. Food Hydrocoll. 2022, 128, 107558. [Google Scholar] [CrossRef]
- Rogers, S.A.; Erwin, B.M.; Vlassopoulos, D.; Cloitre, M. A sequence of physical processes determined and quantified in LAOS: Application to a yield stress fluid. J. Rheol. 2011, 55, 435–458. [Google Scholar] [CrossRef]
- Donley, G.J.; Singh, P.K.; Shetty, A.; Rogers, S.A.; Weitz, D.A. Elucidating the G″ overshoot in soft materials with a yield transition via a time-resolved experimental strain decomposition. Proc. Natl. Acad. Sci. USA 2020, 117, 21945–21952. [Google Scholar] [CrossRef]
- Kamani, K.M.; Donley, G.J.; Rao, R.; Grillet, A.M.; Roberts, C.; Shetty, A.; Rogers, S.A. Understanding the transient large amplitude oscillatory shear behavior of yield stress fluids. J. Rheol. 2023, 67, 331–352. [Google Scholar] [CrossRef]
- Rogers, S. Large amplitude oscillatory shear: Simple to describe, hard to interpret. Phys. Today 2018, 71, 34–40. [Google Scholar] [CrossRef]
- Rogers, S.A.; Park, J.D.; Lee, C.W.J. Instantaneous dimensionless numbers for transient nonlinear rheology. Rheol. Acta 2019, 58, 539–556. [Google Scholar] [CrossRef]
- Hyun, K.; Wilhelm, M.; Klein, C.O.; Cho, K.S.; Nam, J.G.; Ahn, K.H.; Lee, S.J.; Ewoldt, R.H.; McKinley, G.H. A review of nonlinear oscillatory shear tests: Analysis and application of large amplitude oscillatory shear (LAOS). Prog. Polym. Sci. 2011, 36, 1697–1753. [Google Scholar] [CrossRef]
- Wilhelm, M. Fourier-transform rheology. Macromol. Mater. Eng. 2002, 287, 83–105. [Google Scholar] [CrossRef]
- Vittorias, I.; Wilhelm, M. Application of FT rheology to industrial linear and branched polyethylene blends. Macromol. Mater. Eng. 2007, 292, 935–948. [Google Scholar] [CrossRef]
- Wilhelm, M.; Reinheimer, P.; Ortseifer, M. High sensitivity Fourier-transform rheology. Rheol. Acta 1999, 38, 349–356. [Google Scholar] [CrossRef]
- Hassanabadi, H.M.; Wilhelm, M.; Rodrigue, D. A rheological criterion to determine the percolation threshold in polymer nano-composites. Rheol. Acta 2014, 53, 869–882. [Google Scholar] [CrossRef]
- Reinheimer, K.; Grosso, M.; Hetzel, F.; Kübel, J.; Wilhelm, M. Fourier Transform Rheology as an innovative morphological characterization technique for the emulsion volume average radius and its distribution. J. Colloid Interface Sci. 2012, 380, 201–212. [Google Scholar] [CrossRef]
- Ahirwal, D.; Filipe, S.; Neuhaus, I.; Busch, M.; Schlatter, G.; Wilhelm, M. Large amplitude oscillatory shear and uniaxial extensional rheology of blends from linear and long-chain branched polyethylene and polypropylene. J. Rheol. 2014, 58, 635–658. [Google Scholar] [CrossRef]
- Kempf, M.; Ahirwal, D.; Cziep, M.; Wilhelm, M. Synthesis and linear and nonlinear melt rheology of well-defined comb architectures of PS and PpMS with a low and controlled degree of long-chain branching. Macromolecules 2013, 46, 4978–4994. [Google Scholar] [CrossRef]
- Hoyle, D.M.; Auhl, D.; Harlen, O.G.; Barroso, V.C.; Wilhelm, M.; McLeish, T.C.B. Large amplitude oscillatory shear and Fourier transform rheology analysis of branched polymer melts. J. Rheol. 2014, 58, 969–997. [Google Scholar] [CrossRef]
- Song, H.Y.; Faust, L.; Son, J.; Kim, M.; Park, S.J.; Ahn, S.-K.; Wilhelm, M.; Hyun, K. Small and medium amplitude oscillatory shear rheology of model branched polystyrene (PS) melts. Polymers 2020, 12, 365. [Google Scholar] [CrossRef]
- Cho, K.S.; Hyun, K.; Ahn, K.H.; Lee, S.J. A geometrical interpretation of large amplitude oscillatory shear response. J. Rheol. 2005, 49, 747–758. [Google Scholar] [CrossRef]
- Dimitriou, C.J.; Ewoldt, R.H.; McKinley, G.H. Describing and prescribing the constitutive response of yield stress fluids using large amplitude oscillatory shear stress (LAOStress). J. Rheol. 2013, 57, 27–70. [Google Scholar] [CrossRef]
- Ewoldt, R.H.; Hosoi, A.E.; McKinley, G.H. New measures for characterizing nonlinear viscoelasticity in large amplitude oscillatory shear. J. Rheol. 2008, 52, 1427–1458. [Google Scholar] [CrossRef]
- Lee, C.W.; Rogers, S.A. A sequence of physical processes quantified in LAOS by continuous local measures. Korea Aust. Rheol. J. 2017, 29, 269–279. [Google Scholar] [CrossRef]
- Rogers, S.A.; Lettinga, M.P. A sequence of physical processes determined and quantified in large-amplitude oscillatory shear (LAOS): Application to theoretical nonlinear models. J. Rheol. 2012, 56, 1–25. [Google Scholar] [CrossRef]
- Park, J.D.; Rogers, S.A. Rheological manifestation of microstructural change of colloidal gel under oscillatory shear flow. Phys. Fluids 2020, 32, 063102. [Google Scholar] [CrossRef]
- Rogers, S.A. In search of physical meaning: Defining transient parameters for nonlinear viscoelasticity. Rheol. Acta 2017, 56, 501–525. [Google Scholar] [CrossRef]
- Shim, Y.H.; Griebler, J.J.; Rogers, S.A. A reexamination of the Cox–Merz rule through the lens of recovery rheology. J. Rheol. 2024, 68, 381–396. [Google Scholar] [CrossRef]
- Kim, Y.; Kim, S.; Kim, B.S.; Park, J.H.; Ahn, K.H.; Park, J.D. Yielding behavior of concentrated lithium-ion battery anode slurry. Phys. Fluids 2022, 34, 123112. [Google Scholar] [CrossRef]
- Song, H.Y.; Kim, S.Y.; Park, M.S.; Park, J.D.; Hyun, K. Effect of stirring time on viscoelastic properties of liquid gallium-oxide amalgams. Korea Aust. Rheol. J. 2024, 36, 375–386. [Google Scholar] [CrossRef]
- Ulbricht, J.; Jordan, R.; Luxenhofer, R. On the biodegradability of polyethylene glycol, polypeptoids and poly(2-oxazoline)s. Biomaterials 2014, 35, 4848–4861. [Google Scholar] [CrossRef]
- Safaei, H.R.; Shekouhy, M.; Rahmanpur, S.; Shirinfeshan, A. Glycerol as a biodegradable and reusable promoting medium for the catalyst-free one-pot three component synthesis of 4H-pyrans. Green Chem. 2012, 14, 1696. [Google Scholar] [CrossRef]
- Patel, D.; Doshi, D.H.; Desai, A. Short-term stability of atenolol in oral liquid formulations. Int. J. Pharm. Compd. 1997, 1, 437–439. [Google Scholar]
- Laracuente, M.-L.; Yu, M.H.; McHugh, K.J. Zero-order drug delivery: State of the art and future prospects. J. Control. Release 2020, 327, 834–856. [Google Scholar] [CrossRef]
- Hossieni-Aghdam, S.J.; Foroughi-Nia, B.; Zare-Akbari, Z.; Mojarad-Jabali, S.; Motasadizadeh, H.; Farhadnejad, H. Facile fabrication and characterization of a novel oral pH-sensitive drug delivery system based on CMC hydrogel and HNT-AT nanohybrid. Int. J. Biol. Macromol. 2018, 107, 2436–2449. [Google Scholar] [CrossRef]
- Adhikari, S.N.R.; Nayak, B.S.; Nayak, A.K.; Mohanty, B. Formulation and Evaluation of Buccal Patches for Delivery of Atenolol. AAPS Pharmscitech 2010, 11, 1038–1044. [Google Scholar] [CrossRef]
- Cassano, R.; Sole, R.; Siciliano, C.; Baldino, N.; Mileti, O.; Procopio, D.; Curcio, F.; Calviello, G.; Serini, S.; Trombino, S.; et al. Eutectogel-Based Drug Delivery: An Innovative Approach for Atenolol Administration. Pharmaceutics 2024, 16, 1552. [Google Scholar] [CrossRef]
- Preeti; Sambhakar, S.; Malik, R.; Bhatia, S.; Al Harrasi, A.; Saharan, R.; Aggarwal, G.; Kumar, S.; Sehrawat, R.; Rani, C. Lipid Horizons: Recent Advances and Future Prospects in LBDDS for Oral Administration of Antihypertensive Agents. Int. J. Hypertens. 2024, 2024, 2430147. [Google Scholar] [CrossRef] [PubMed]
- ASTM C143/C143M-20; Test Method for Slump of Hydraulic-Cement Concrete. ASTM International: West Conshohocken, PA, USA, 2020. [CrossRef]
- Herrada-Manchón, H.; Rodríguez-González, D.; Fernández, M.A.; Kucko, N.W.; Groot, F.B.-D.; Aguilar, E. Effect on Rheological Properties and 3D Printability of Biphasic Calcium Phosphate Microporous Particles in Hydrocolloid-Based Hydrogels. Gels 2022, 8, 28. [Google Scholar] [CrossRef] [PubMed]
- Mueller, S.; Llewellin, E.W.; Mader, H.M. The rheology of suspensions of solid particles. Proc. R. Soc. A Math. Phys. Eng. Sci. 2010, 466, 1201–1228. [Google Scholar] [CrossRef]
- Nelson, A.Z.; Ewoldt, R.H. Design of yield-stress fluids: A rheology-to-structure inverse problem. Soft Matter 2017, 13, 7578–7594. [Google Scholar] [CrossRef] [PubMed]
- Doraiswamy, D.; Mujumdar, A.N.; Tsao, I.; Beris, A.N.; Danforth, S.C.; Metzner, A.B. The Cox–Merz rule extended: A rheological model for concentrated suspensions and other materials with a yield stress. J. Rheol. 1991, 35, 647–685. [Google Scholar] [CrossRef]
- Merger, D. Large Amplitude Oscillatory Shear Investigations of Colloidal Systems: Experiments and Constitutive Model Predictions. Doctoral Dissertation, Karlsruher Institut für Technologie (KIT), Karlsruhe, Germany, 2015. [Google Scholar] [CrossRef]
- Hyun, K.; Kim, W. A new non-linear parameter Q from FT-Rheology under nonlinear dynamic oscillatory shear for polymer melts system. Korea Aust. Rheol. J. 2011, 23, 227–235. [Google Scholar] [CrossRef]
- Sangroniz, L.; Palacios, J.K.; Fernández, M.; Eguiazabal, J.I.; Santamaria, A.; Müller, A.J. Linear and non-linear rheological behavior of polypropylene/polyamide blends modified with a compatibilizer agent and nanosilica and its relationship with the morphology. Eur. Polym. J. 2016, 83, 10–21. [Google Scholar] [CrossRef]
- Sandoval, A.J.; Fernández, M.; Sanz, O.; Santamaría, A.; Penott-Chang, E.; Müller, A.J. Large amplitude oscillatory shear (LAOS) behavior of chocolates of different compositions. J. Rheol. 2022, 66, 859–879. [Google Scholar] [CrossRef]
- Leblanc, J.L. Investigating the Non-Linear Viscoelastic Behavior of Filled Rubber Compounds Through Fourier Transform Rheometry. Rubber Chem. Technol. 2005, 78, 54–75. [Google Scholar] [CrossRef]
- Heymann, L.; Peukert, S.; Aksel, N. Investigation of the solid–liquid transition of highly concentrated suspensions in oscillatory amplitude sweeps. J. Rheol. 2002, 46, 93–112. [Google Scholar] [CrossRef]
- Kallus, S.; Willenbacher, N.; Kirsch, S.; Distler, D.; Neidhöfer, T.; Wilhelm, M.; Spiess, H.W. Characterization of polymer dispersions by Fourier transform rheology. Rheol. Acta 2001, 40, 552–559. [Google Scholar] [CrossRef]
- Hyun, K.; Nam, J.G.; Wilhellm, M.; Ahn, K.H.; Lee, S.J. Large amplitude oscillatory shear behavior of PEO-PPO-PEO triblock copolymer solutions. Rheol. Acta 2006, 45, 239–249. [Google Scholar] [CrossRef]
- Shi, J.; Rogers, S.A. The benefits of a formalism built on recovery: Theory, experiments, and modeling. J. Non-Newton. Fluid. Mech. 2023, 321, 105113. [Google Scholar] [CrossRef]
- Park, J.D.; Rogers, S.A. The transient behavior of soft glassy materials far from equilibrium. J. Rheol. 2018, 62, 869–888. [Google Scholar] [CrossRef]
- Lee, J.C.W.; Porcar, L.; Rogers, S.A. Unveiling temporal nonlinear structure-rheology relationships under dynamic shearing. Polymers 2019, 11, 1189. [Google Scholar] [CrossRef]
- van der Vaart, K.; Rahmani, Y.; Zargar, R.; Hu, Z.; Bonn, D.; Schall, P. Rheology of concentrated soft and hard-sphere suspensions. J. Rheol. 2013, 57, 1195–1209. [Google Scholar] [CrossRef]
- Radhakrishnan, R.; Fielding, S.M. Shear banding in large amplitude oscillatory shear (LAOStrain and LAOStress) of soft glassy materials. J. Rheol. 2018, 62, 559–576. [Google Scholar] [CrossRef]
- Poulos, A.S.; Stellbrink, J.; Petekidis, G. Flow of concentrated solutions of starlike micelles under large-amplitude oscillatory shear. Rheol. Acta 2013, 52, 785–800. [Google Scholar] [CrossRef]


 ,
,  ), A2 (
 ,
,  ) A8 (
 ,
,  ); CMC-GLY-A0 (
 ,
,  )A2 (
)A2 ( ,
,  ), A8 (
 ,
,  ).
, ), A2 (, ) A8 (, ); CMC-GLY-A0 (, )A2 (, ), A8 (, ).
).
, ), A2 (, ) A8 (, ); CMC-GLY-A0 (, )A2 (, ), A8 (, ).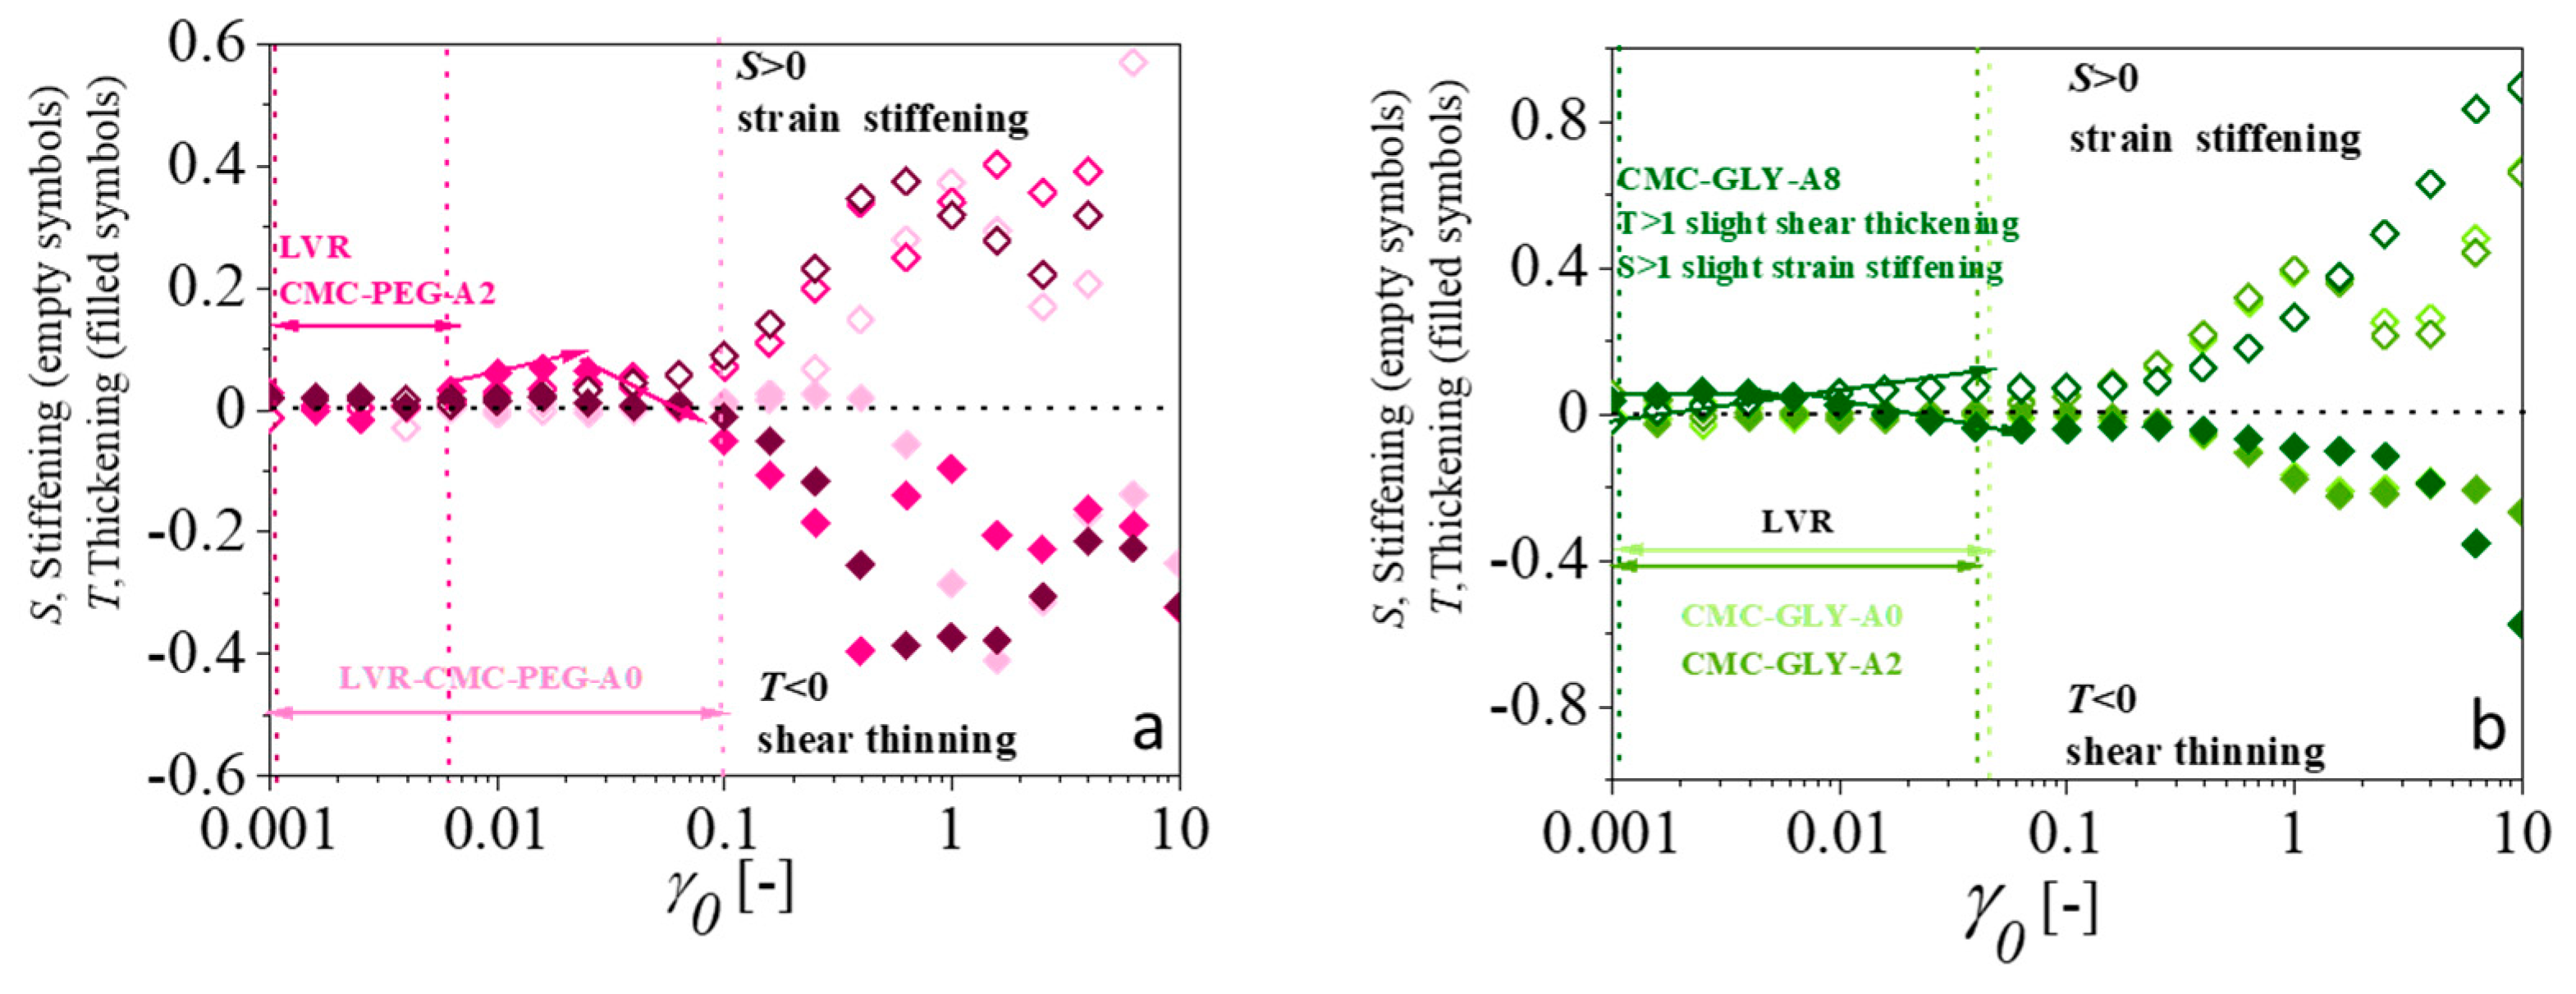


| CMC-Based Formulation | Yield Stress, (Pa) | Consistency Index, | Flow Index, n | R2 |
|---|---|---|---|---|
| CMC-PEG-A0 | 17.98 | 17.60 | 0.69 | 0.9856 |
| CMC-PEG-A2 | 66.24 | 39.55 | 0.51 | 0.9972 |
| CMC-PEG-A8 | 275 | 279 | 0.85 | 0.9904 |
| CMC-GLY-A0 | 0 | 76.35 | 0.74 | 0.9999 |
| CMC-GLY-A2 | 0.36 | 78.19 | 0.70 | 0.9998 |
| CMC-GLY-A8 | 104.78 | 525.43 | 0.43 | 0.9875 |
| Yield Stress (Pa) | CMC-PEG-A8 | CMC-GLY-A8 | Rheological Methodology |
|---|---|---|---|
DIW cone slump | >147 | 80 | Printing strength (Equation (1)) |
| (H-B) Steady-shear flow | 275 | 104 | Herschel–Bulkley model (Equation (2)) |
| (H-B)o L-B plot with = 10 strain units | 274 | 227 | Herschel–Bulkley model (Equation (2)) |
| (G′ = G″) Oscillatory strain sweep at ω = 1 rad/s | 549 | 434 | Viscoelastic flow condition G′ = G″ |
| at G′tmax Cole–Cole plot at = 10 strain units | 504 | 405 | SPP analysis Stress at the maximum elasticity |
| Formulation (wt%) | PEG-A0 | PEG-A2 | PEG-A8 | GLY-A0 | GLY-A2 | GLY-A8 |
|---|---|---|---|---|---|---|
| Atenolol | - | 2 | 8 | - | 2 | 8 |
| CMC | 5 | 5 | 5 | 12.5 | 12.5 | 12.5 |
| PEG6000 | 20 | 20 | 20 | |||
| water | 75 | 73 | 67 | 5 | 5 | 5 |
| Glycerol | - | - | - | 82.5 | 80.5 | 74.5 |
Disclaimer/Publisher’s Note: The statements, opinions and data contained in all publications are solely those of the individual author(s) and contributor(s) and not of MDPI and/or the editor(s). MDPI and/or the editor(s) disclaim responsibility for any injury to people or property resulting from any ideas, methods, instructions or products referred to in the content. |
© 2025 by the authors. Licensee MDPI, Basel, Switzerland. This article is an open access article distributed under the terms and conditions of the Creative Commons Attribution (CC BY) license (https://creativecommons.org/licenses/by/4.0/).
Share and Cite
Insua, I.; Etzold, O.; Calafel, I.; Aguirresarobe, R.; Calderón, M.; Fernández, M. Rheological Insight into the 3D Printability of Carboxymethyl Cellulose-Based Hydrogels. Gels 2025, 11, 259. https://doi.org/10.3390/gels11040259
Insua I, Etzold O, Calafel I, Aguirresarobe R, Calderón M, Fernández M. Rheological Insight into the 3D Printability of Carboxymethyl Cellulose-Based Hydrogels. Gels. 2025; 11(4):259. https://doi.org/10.3390/gels11040259
Chicago/Turabian StyleInsua, Itziar, Oliver Etzold, Itxaso Calafel, Robert Aguirresarobe, Marcelo Calderón, and Mercedes Fernández. 2025. "Rheological Insight into the 3D Printability of Carboxymethyl Cellulose-Based Hydrogels" Gels 11, no. 4: 259. https://doi.org/10.3390/gels11040259
APA StyleInsua, I., Etzold, O., Calafel, I., Aguirresarobe, R., Calderón, M., & Fernández, M. (2025). Rheological Insight into the 3D Printability of Carboxymethyl Cellulose-Based Hydrogels. Gels, 11(4), 259. https://doi.org/10.3390/gels11040259