Article

Biogeography of Fungal Communities Associated with Pinus sylvestris L. and Picea abies (L.) H. Karst. along the Latitudinal Gradient in Europe

by
Valeriia Mishcherikova
1,
Jūratė Lynikienė
1,
Adas Marčiulynas
1,
Artūras Gedminas
1,
Oleh Prylutskyi
2,
Diana Marčiulynienė
1,* and
Audrius Menkis
3
1
Institute of Forestry, Lithuanian Research Centre for Agriculture and Forestry, Liepų Str. 1, Girionys, 53101 Kaunas, Lithuania
2
Department of Mycology and Plant Resistance, V.N. Karazin Kharkiv National University, Svobody Sq., 61022 Kharkiv, Ukraine
3
Department of Forest Mycology and Plant Pathology, Uppsala BioCenter, Swedish University of Agricultural Sciences, 75007 Uppsala, Sweden
*
Author to whom correspondence should be addressed.
J. Fungi 2023, 9(8), 829; https://doi.org/10.3390/jof9080829
Submission received: 5 July 2023 / Revised: 31 July 2023 / Accepted: 4 August 2023 / Published: 6 August 2023
(This article belongs to the Special Issue Fungal Biodiversity and Ecology, 3rd Edition)

Abstract

:
We assessed the diversity and composition of fungal communities in different functional tissues and the rhizosphere soil of Pinus sylvestris and Picea abies stands along the latitudinal gradient of these tree species distributions in Europe to model possible changes in fungal communities imposed by climate change. For each tree species, living needles, shoots, roots, and the rhizosphere soil were sampled and subjected to high-throughput sequencing. Results showed that the latitude and the host tree species had a limited effect on the diversity and composition of fungal communities, which were largely explained by the environmental variables of each site and the substrate they colonize. The mean annual temperature and mean annual precipitation had a strong effect on root fungal communities, isothermality on needle fungal communities, mean temperature of the warmest quarter and precipitation of the driest month on shoot fungal communities, and precipitation seasonality on soil fungal communities. Fungal communities of both tree species are predicted to shift to habitats with a lower annual temperature amplitude and with increasing precipitation during the driest month, but the suitability of these habitats as compared to the present conditions is predicted to decrease in the future.

1. Introduction

Climate change as a combination of changing precipitation, warming, an altered pattern of extreme events, and a changing disturbance regime is predicted to significantly impact the structure of forest ecosystems, changing geographic ranges, species abundance, and interdependence [1].
In Europe, P. sylvestris and P. abies are among the most economically and environmentally important tree species [2,3]. Pinus sylvestris is one of the most widely distributed pine species in the world, which can be found all the way across Eurasia [4]. However, despite the ecological plasticity of P. sylvestris, it is predicted that changing climate will affect its climatic optimum in southern and central Europe [5]. Additionally, P. sylvestris is expected to be more susceptible to droughts in the western part of its current range, which will impair its growth [6,7]. All of this may indicate that as the climate changes, the pine will gradually disappear from its current habitats in the south and move to the north. Assuming an average temperature increase of 2.6–4.8 °C by 2100, it is likely that P. sylvestris may disappear from southern and central Europe [8], and other tree species, often geographically alien to European ecosystems, will take their place and negatively impact the environment [9]. As P. sylvestris is a principal tree species in large forest ecosystems, any changes in the distribution range or health status are likely to have great environmental and economic consequences [10]. Picea abies was extensively planted outside the limits of its natural range, where it can be particularly vulnerable to higher temperatures and droughts due to the shallow root system [11,12]. For this reason, it is expected that climate change will have severe consequences for the health and growth of P. abies. Indeed, weakened trees can be more easily attacked by pathogenic fungi such as Heterobasidion annosum s.l. ((FR.) Bref., 1889) or Armillaria spp., but especially by bark beetles [13]. Although in northern Europe, climate change is expected to increase the overall forest productivity due to a longer and warmer growing season, conditions for P. abies will become less favorable [14].
Over the years, our understanding of the role of microbial communities in the functioning of ecosystems, including microbes associated with trees, has improved significantly [15,16,17,18]. Plant-associated microbiota colonizes a majority of plant tissues and plays crucial roles supplying nutrients to plants, promoting seed germination, promoting plant growth, and protecting plants against biotic and abiotic stresses [19,20]. The rhizosphere is rich in microbial species, which are influenced by the deposition of plant mucilage and root exudates [21]. The phyllosphere, in contrast, is relatively poor in nutrients and exposed to extremes of temperature, radiation, and humidity [22]. Microbial inhabitants of the rhizosphere and phyllosphere (located near or on plant tissues) are considered to be epiphytes, while microbes found in plant tissues (endosphere), such as leaves, roots, or stems, are considered to be endophytes. Microbes in these niches can form beneficial, neutral, or harmful associations of varying intimacy with their host plants [20]. Thus, they are an integral part of many functions important for tree survival [20,21]. In addition, host-associated microbial communities may provide a basis for adaptation to new climatic conditions and increase plant tolerance to climatic stress [22,23]. Although aboveground (plant) and belowground (soil) microbial communities together regulate ecosystem processes and responses to change, they are still frequently studied separately [24]. However, the different sensitivities of plant microbial and soil microbial communities suggest that these communities may respond differently to environmental factors [24,25]. Therefore, establishing whether environmental changes drive parallel shifts above- and belowground is pivotal, predicting how ecosystems will respond to future global change [24]. In recent years, high-throughput sequencing has allowed exploring the taxonomic and functional diversity of microorganisms to a much larger extent than before [26]. However, in some areas, the available knowledge is still limited, especially on environmental and host effects, principles of community assembly, and microbe–microbe interactions [27].
Fungi constitute an essential part of the tree-associated microbiota [28]. Many fungi can be important to plant growth and nutrition, especially under challenging conditions, as they can increase tolerance to different abiotic and biotic stressors including heat, drought, salinity, heavy metal toxicity, pests, and pathogens [27,29,30,31]. Fungi can also be seen as bioindicators of tree health as many tree-associated fungi have diverse effects on the function of both individual trees and entire forest ecosystems [32,33]. Changes in the composition of fungal communities associated with trees may reflect not only changes in environmental conditions but also changes in their health condition and viability [34,35].
Environmental conditions are among the principal determinants that drive the formation and composition of fungal communities [36,37,38,39]. However, disturbances associated with climate change can significantly alter the composition and functioning of these communities [40]. These alterations may occur either in response to a change in the biology of the host or as a result of direct exposure of fungi to abiotic stressors [41]. Climate change can be expected to affect different trophic groups of fungi. For example, an increase in temperature is predicted to increase the enzymatic activity of saprotrophic fungi, leading to potentially more rapid degradation of organic matter and release of CO2; it may also create conditions for the spread and establishment of pathogens in new areas, resulting in increased economic losses [42,43,44,45,46]. Understanding how climate change may affect the tree microbiome is challenging due to the complexity and interconnectedness of factors driving this process.
To evaluate the potential impact of climate change, the latitudinal gradient was proposed as it may reflect the corresponding climate change due to gradual changes in temperature and precipitation along such gradient [47]. Furthermore, understanding the dependencies of microorganisms associated with trees to certain climatic regimes is the key to displaying their diversity and role in forest ecosystems on a regional and global scale [38]. For example, using a latitudinal gradient, it was shown that going towards the north there was a tendency for a reduction in diversity of both ectomycorrhizal fungi and leaf-associated fungal pathogens [48,49]. However, the diversity and specialization of fungi do not always follow a latitudinal gradient, which repeatedly highlights the complexity of the response of different taxa.
The aim of the present study was to determine the diversity and composition of fungal communities in different functional tissues and the rhizosphere soil of P. sylvestris and P. abies stands along the latitudinal gradient of these tree species distributions in Europe to model possible changes in fungal communities imposed by climate change. We hypothesized that fungal communities associated with P. sylvestris and P. abies will qualitatively (e.g., fungal species composition) and quantitatively (e.g., fungal species richness) respond to changes in latitude owing to site-specific adaptations of specific fungal species, and, therefore, will be differently affected by climate change.

2. Materials and Methods

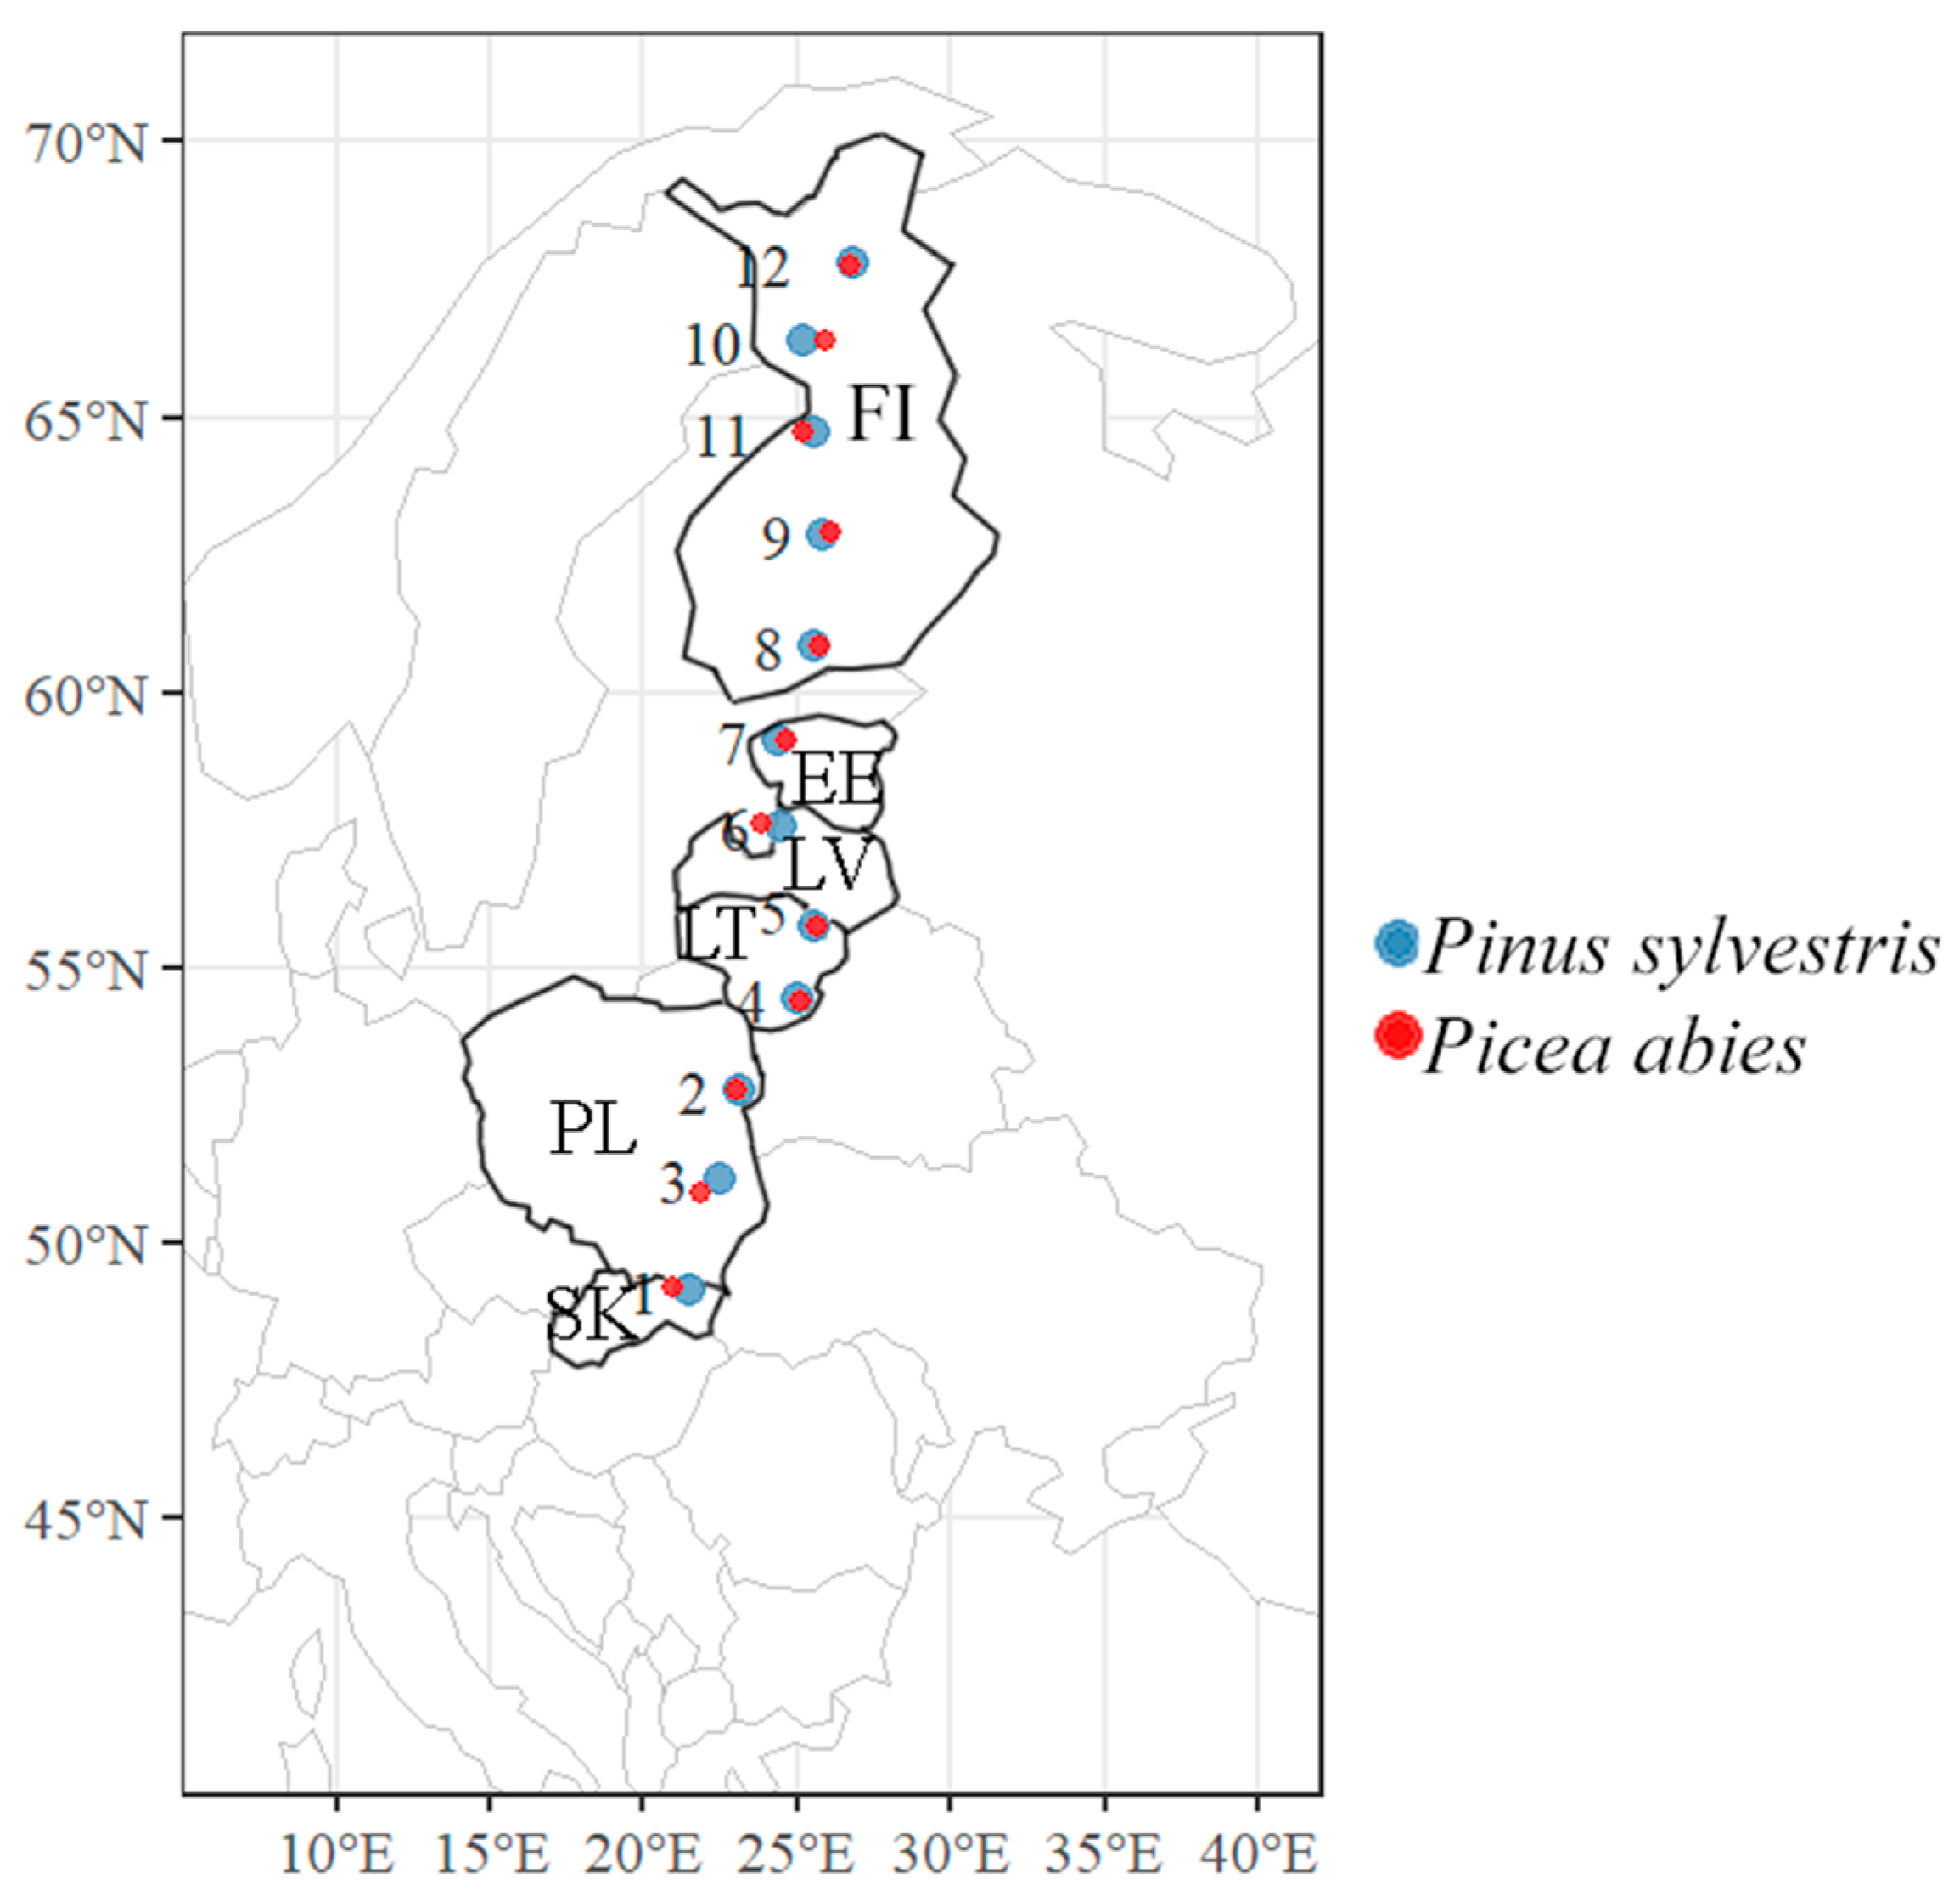
2.1. Study Sites and Sampling

Study sites were in pure 50- to 90-year-old stands of P. sylvestris and in pure 30- to 70-year-old stands of P. abies situated approximately every 200 km along the south–north gradient, i.e., between 49° and 68° latitudes and between 20° and 30° longitudes, covering countries such as Slovakia, Poland, Lithuania, Latvia, Estonia, and Finland (Figure 1 and Table 1). All study sites were situated along a 2200 km-long transect and included 12 sites in P. sylvestris forest stands and 12 sites in P. abies forest stands (Figure 1 and Table 1). Within the same sampling area, the distance between P. sylvestris and P. abies sites was not more than 5 km.
At each study site, roots, needles, shoots, and rhizosphere soil samples were collected in July and August 2019. For the collection of soil, the litter layer was removed and five random rhizosphere soil samples per site were taken separately in the vicinity (no more than 30 cm from the trunk) of five randomly selected P. sylvestris or P. abies trees using a 2 cm diameter soil core, taking at least 50 g of soil at a depth of 0–25 cm.
Samples of fine roots were excavated in the vicinity (no more than 1 m from the trunk) of five random P. abies or P. sylvestris trees. The soil was gently removed from the roots, and each sample consisted of up to seven fine lateral roots with root tips (approximately 10 cm long). Previous year’s shoots with needles were taken in the middle part of the canopy from ten random P. abies or P. sylvestris trees using telescopic secateurs. An individual needle sample (one per tree) consisted of 25 healthy-looking needles, which were randomly collected from cut shoots using forceps. All tools were carefully cleaned between individual samples. Shoot samples were prepared by removing the remaining needles and cutting them into ca. 5 cm-long segments. Individual needle, shoot, root, and soil samples were placed in separate plastic bags and transported on ice to the laboratory, where they were kept at −20 °C before further analysis. The total number of samples for each site and tree species is shown in Table 1.
The climate data for each study site were collected from the WorldClim database (version 2.0, http://worldclim.org/version2, accessed 10 November 2021) [50]. Climate variables, which were used in the analysis, are in Section 2.4.2 and Table 2.

2.2. Molecular Analyses

Before DNA extraction, all samples of needles, shoots, roots, and soil were freeze-dried for 48 h using a Labconco FreeZone Benchtop Freeze Dryer (Cole-Parmer, Vernon Hills, IL, USA) and individually grounded to a fine powder using Fast prep shaker (Montigny-le-Bretonneux, France). DNA was extracted from 0.5 g (dry weight) of shoots, needles, roots, and soil samples using the CTAB protocol [53]. After DNA extraction, DNA quality, and concentration were measured using a NanoDrop™ One spectrophotometer (Thermo Scientific, Rochester, NY, USA) and adjusted to 10 ng/µL.
The PCR amplification of the ITS2 rRNA region was performed using barcoded fungal-specific primer gITS7 [54] and barcoded universal primer ITS4 [55]. PCR was performed in 50 μL reactions containing 4 µL of DNA template. Each reaction included 1% of DreamTaq Green Polymerase (5 μ/μL) (Thermo Scientific, Waltham, MA, USA); 11% of 10× Buffer; 11% of dNTPs (10 mM); 1% of MgCl2 (25 mM); 2% of each primer (200 nM); and 74% of milli-Q water. Amplifications were performed using the Applied Biosystems 2720 thermal cycler (Foster City, CA, USA). The PCR was started with an initial denaturation at 95 °C for 5 min, followed by 30 cycles of 95 °C for 30 s, annealing at 56 °C for 30 s and 72 °C for 30 s, followed by a final extension step at 72 °C for 7 min. The PCR products were analyzed using gel electrophoresis on 1% agarose gels stained with Nancy-520 (Sigma-Aldrich, Stockholm, Sweden). PCR products were purified by centrifugation in 1:20 volume of 3 M sodium acetate (pH 5.2) (Applichem Gmbh, Darmstadt, Germany) and 96% ethanol mixture. An equimolar mix of all PCR products was used for high-throughput sequencing. Construction of the sequencing library and sequencing using the Pacific Biosciences RS II platform (Menlo Park, CA, USA) and one SMRT cell was performed at the SciLifeLab in Uppsala, Sweden.

2.3. Bioinformatics

The sequences generated were subjected to quality control and clustering in the SCATA NGS sequencing pipeline (http://scata.mykopat.slu.se, accessed on 23 May 2021). Quality filtering of the sequences included the removal of short sequences (<200 base pairs (bp)), sequences with low read quality, dimers, and homopolymers, which collapsed to 3 bp before clustering. Sequences with a missing tag or primer were excluded. The primer and sample tags were then removed from the sequence, but information on the sequence association with the sample were stored as meta-data. The sequences were clustered into different taxa using single-linkage clustering based on 98.5% similarity. The most common genotype (real read) for each cluster was used to represent each operational taxonomic unit (OTU). For clusters containing only two sequences, a consensus sequence was produced. Fungal OTUs were taxonomically classified using PlutoF biodiversity platform (available at https://plutof.ut.ee/, accessed on 14 August 2021) and UNITE database [56]. Representative sequences of fungal nonsingletons as the Targeted Locus Study project have been deposited at DDBJ/EMBL/GenBank under accession number KHZQ00000000. FUNGuild was used to identify fungal functional groups (guilds) (FUNGuild v1.0) [36].

2.4. Statistical Analyses

2.4.1. Fungal Community Richness, Diversity, and Structure

All analyses were performed in R version 4.1.2 [57]. The comprehensiveness of the sampling was evaluated by the Good’s coverage estimator with goods function from QsRutils [36]. To estimate the relationship between the cumulative number of fungal OTUs and the number of ITS2 rRNA sequences, rarefaction analysis was carried out using iNext function from iNext [58]. To analyze factors affecting biodiversity indicators of fungal communities associated with P. sylvestris and P. abies, linear regression with a l m function was used from the stats [57]. The data were checked for multicollinearity using Variance Inflation Factor (VIF) function from regclass [59]. Variables with a high VIF (>10) were excluded from the analysis.
A-diversity (the Shannon index, Chao 1) and β-diversity (the Bray–Curtis index) were calculated using a specnumber function to describe the abundance and richness of fungal communities using resampled OTU table. Diversity estimates were carried out using linear regression (l m function) and marginal means estimated by emmans function. Hierarchical clustering of the 30 most abundant fungal OTUs was performed using function hclust based on the Bray–Curtis distance matrix. For visualization, the heatmap function was used. A Hellinger transformation (square root of relative abundance data) was applied to the fungal community matrix to limit the influence of abundant OTUs using a function decostan from vegan package [60]. Key parameters that were influencing fungal communities associated with trees were selected using a redundancy analysis based on a function rda form vegan [60] and using a function ordistep with forward stepwise model selection using permutation tests [60], using the transformed community matrix as the response variable. Constrained Redundancy Analysis (RDA) followed by a pseudo-F test was used to assess the presence or absence of significant differences. Differences in untransformed community structure were visualized using nonmetric multidimensional scaling (NMDS) based on Bray–Curtis distance using a metaMDS function with 1000 maximum and 20 minimum number of random starts from the vegan package. The function ordistep with forward stepwise model selection using permutation tests [61].

2.4.2. Climate Variables and Selection of Model for Future Predictions

For the data analysis, we use a bioclimatic variable set with a resolution of 10 min. The bioclimatic variables represented annual trends (e.g., mean annual temperature and annual precipitation), seasonality (e.g., annual range in temperature and precipitation), and extreme or limiting environmental factors (e.g., temperature of the coldest and warmest month, and precipitation of the most wet and dry quarters). In total, there were 19 different variables (Table 2). To predict the change in fungal communities over time, we used climate estimates from Coupled Model Intercomparison Project Phase 6 (CMIP6), using BCC-CSM2-MR GCM with SSP585 for the periods 2019–2040, 2019–2060, 2019–2080, and 2019–2100 with the same bioclimatic variables.
To predict the community changes, we followed Kindt (2021) [62]. The model evaluated where fungal communities would move after the change of principal bioclimatic parameters. We used the environmental.novel function, which identifies populations with future environmental conditions that are outside of the present range. Then, the probability of future conditions was calculated using pnorm with the mean and standard deviation of the present climatic conditions. If one or more variables were outside of the present range, the variable with the lowest probability was used. For the prediction and its visualization, we used the function population.shift based on RDA from AlleleShift package [62]. All visualizations of the data were based on the package ggplot2 [61].

3. Results

3.1. Sequence Quality and Fungal Diversity

High-throughput sequencing of pooled needle, shoot, root, and soil samples resulted in 349,594 reads. Filtering showed the presence of 181,342 (51.8%) high-quality reads, while 168,252 (48.2%) low-quality reads were excluded. Clustering of high-quality reads showed the presence of 3751 nonsingleton contigs at 98.5% similarity representing different OTUs, among which 3417 (91.1%) were fungal (Tables S1 and S2), which were retained, while 334 (8.9%) nonfungal OTUs were excluded. There were 2068 singletons, which were excluded. Good’s estimated coverage was >99.4%, showing that only < 0.6% of reads in individual samples appeared only once. Rarefaction analysis showed that species accumulation curves did not reach the asymptote, showing that a higher species richness could be detected with deeper sequencing (Figure 2).
Differences between the distribution of fungal OTUs associated with P. sylvestris (2116) and P. abies (2391) into different phyla was insignificant (F = 0.81, p = 0.54) (Tables S1 and S2). Ascomycota was the most abundant phylum, followed by Basidiomycota, Zygomycota, Chytridiomycota, and Glomeromycota, accounting for 69.0%, 24.9%, 5.7%, 0.3%, and 0.1% of sequences of P. abies, and 73.0%, 22.5%, 4.1%, 0.2%, and 0.2% of P. sylvestris, respectively. Ascomycota and Basidiomycota were significantly more abundant as compared to other phyla of both P. sylvestris (F = 41.54, p < 0.05) and P. abies (F = 38.14, p < 0.05) (Tables S1 and S2).
The relative abundance of different fungal classes between P. sylvestris and P. abies did not differ significantly (F = 0.2, p = 0.9). The most abundant fungal classes were Dothideomycetes (27.1% of P. sylvestris and 33.4% of P. abies), Agaricomycetes (16.7% and 20.0%), Eurotiomycetes (10.6% and 12.3%), and Leotiomycetes (14.7% and 8.8%), respectively (Figure 3).
In different samples, the dominant fungal classes, respectively, for P. sylvestris and P. abies were: in needles, Dothideomycetes (47.7% and 49.3%), Eurotiomycetes (9.9% and 3.6%), and Leotiomycetes (9.3% and 510%); in shoots, Dothideomycetes (43.4% and 44.0%), Eurotiomycetes (15.1% and 12.5%), and Leotiomycetes (15.3% and 68%); in roots, Agaricomycetes (12.8% and 39.4%), Pezizomycetes (9.5% and 5.8%), and Leotiomycetes (19.3% and 18.4%); and in the soil, Agaricomycetes (20.3% and 22.7%), Dothideomycetes (21.4% and 18.9%), and Eurotiomycetes (13.3% and 22.5%) (Figure 3).
The 20 most common fungal OTUs, accounting for 35.8% of fungal sequences of P. sylvestris and 39.4% of P. abies are shown in Table 3 and Table 4, respectively. The most common fungal OTUs associated with P. sylvestris were Sydowia polyspora (5.8%) and Acrodontium luzulae (5.0%) (Table 3). The most common fungal OTUs associated P. abies were S. polyspora (11.5%) and Penicillium camemberti (4.6%) (Table 4). These most abundant fungal species were present in all sample types but in different relative abundances. For instance, in P. sylvestris, S. polyspora showed the highest relative abundance in shoots (15. 6%) followed by needles (3.9%), roots (0.6%), and the soil (2.4%). A. luzulae was abundant in the soil (11.87%) and root (7.0%) samples, but rare in needles (0.31%), and shoots (0.22%) (Table 3). In P. abies, S. polyspora was the most abundant in needles (49.7%) than in all other sample types (shoots 12.3%, roots 0.2%, or the soil 0.4%). In P. abies, P. camemberti was most abundant in the soil (12.9%) as compared with other samples (needles 0.06%, shoots 0.03%, and roots 1.93%) (Table 4). Many dominant fungal OTUs associated with P. sylvestris or P. abies at variable abundances were detected in all four substrates (Table 3 and Table 4). Some of the most common OTUs were specific to only one substrate. Unidentified sp. 5210_30 (0.95%) was only found in P. sylvestris root samples, while Unidentified sp. 5208_24 (2.03%), Unidentified sp. 5210_39 (0.86%), and Piloderma lanatum (0.81%) were only found in P. abies soil samples. The descriptive data for each tree species, substrate, and sampling site showing the detected number of fungal OUTs, the number of fungal sequences, and the Shannon diversity index are in Table 5.
The Chao1 index of fungal richness did not show significant differences among different substrates (needles, shoots, roots, and the soil) or sampling sites (p > 0.05), except for shoots of P. abies, where the species richness was significantly higher than in other substrates (Figure 4A,B). When fungal richness was compared between corresponding samples of P. sylvestris and P. abies (e.g., needles vs. needles), the difference was also insignificant. Consequently, the linear regression analysis showed that the latitude did not have a significant effect on the Chao1 index (p > 0.05) (Figure 4A,B). The Shannon diversity index of fungal communities associated with P. sylvestris and P. abies was in the majority of cases similar in different sampling sites (Table 5 and Figure 4C). Similarly, the linear regression analysis showed that the latitude did not have a significant effect on the Shannon diversity index (p > 0.05) (Table 5 and Figure 4C).
Hierarchical clustering of the 30 most common fungal OTUs associated with each tree species showed differences in their relative abundance at different study sites (Figure 5). The analysis also revealed certain specificity of particular OTUs in different geographical regions. In P. sylvestris, fungal OTUs such as A. luzulae, Tomentella sp. 5210_8 or Coniothyrium olivaceum were more common in the southern part of the gradient, Scoliciosporum umbrinum, Archaeorhizomyces sp. 5208_0 or Unidentified sp. 5210_5 in the central part of the gradient, and Phyllactinia fraxini, Acrodontium crateriforme, or Hyphodiscus hymeniophilus in the northern part of the gradient (Figure 5A). In P. abies, fungal OTUs, such as Fusarium langsethiae, P. camemberti, or Tylospora asterophora, were more common in the southern part of the gradient; Russula firmula, Piloderma lanatum, or Inocybe geophyla in the central part of the gradient; and Helicodendron coniferarum, Suillus luteus, or Rhizoctonia solani in the northern part of the gradient (Figure 5B). Additionally, several OTUs, such as Unidentified sp. 5210_5, Unidentified sp. 5210_19, Unidentified sp. 5210_7, Mycena septentrionalis, and Tomentella sp. 5210_8 were common both in the southern and in the northern part of this gradient (Figure 5B).

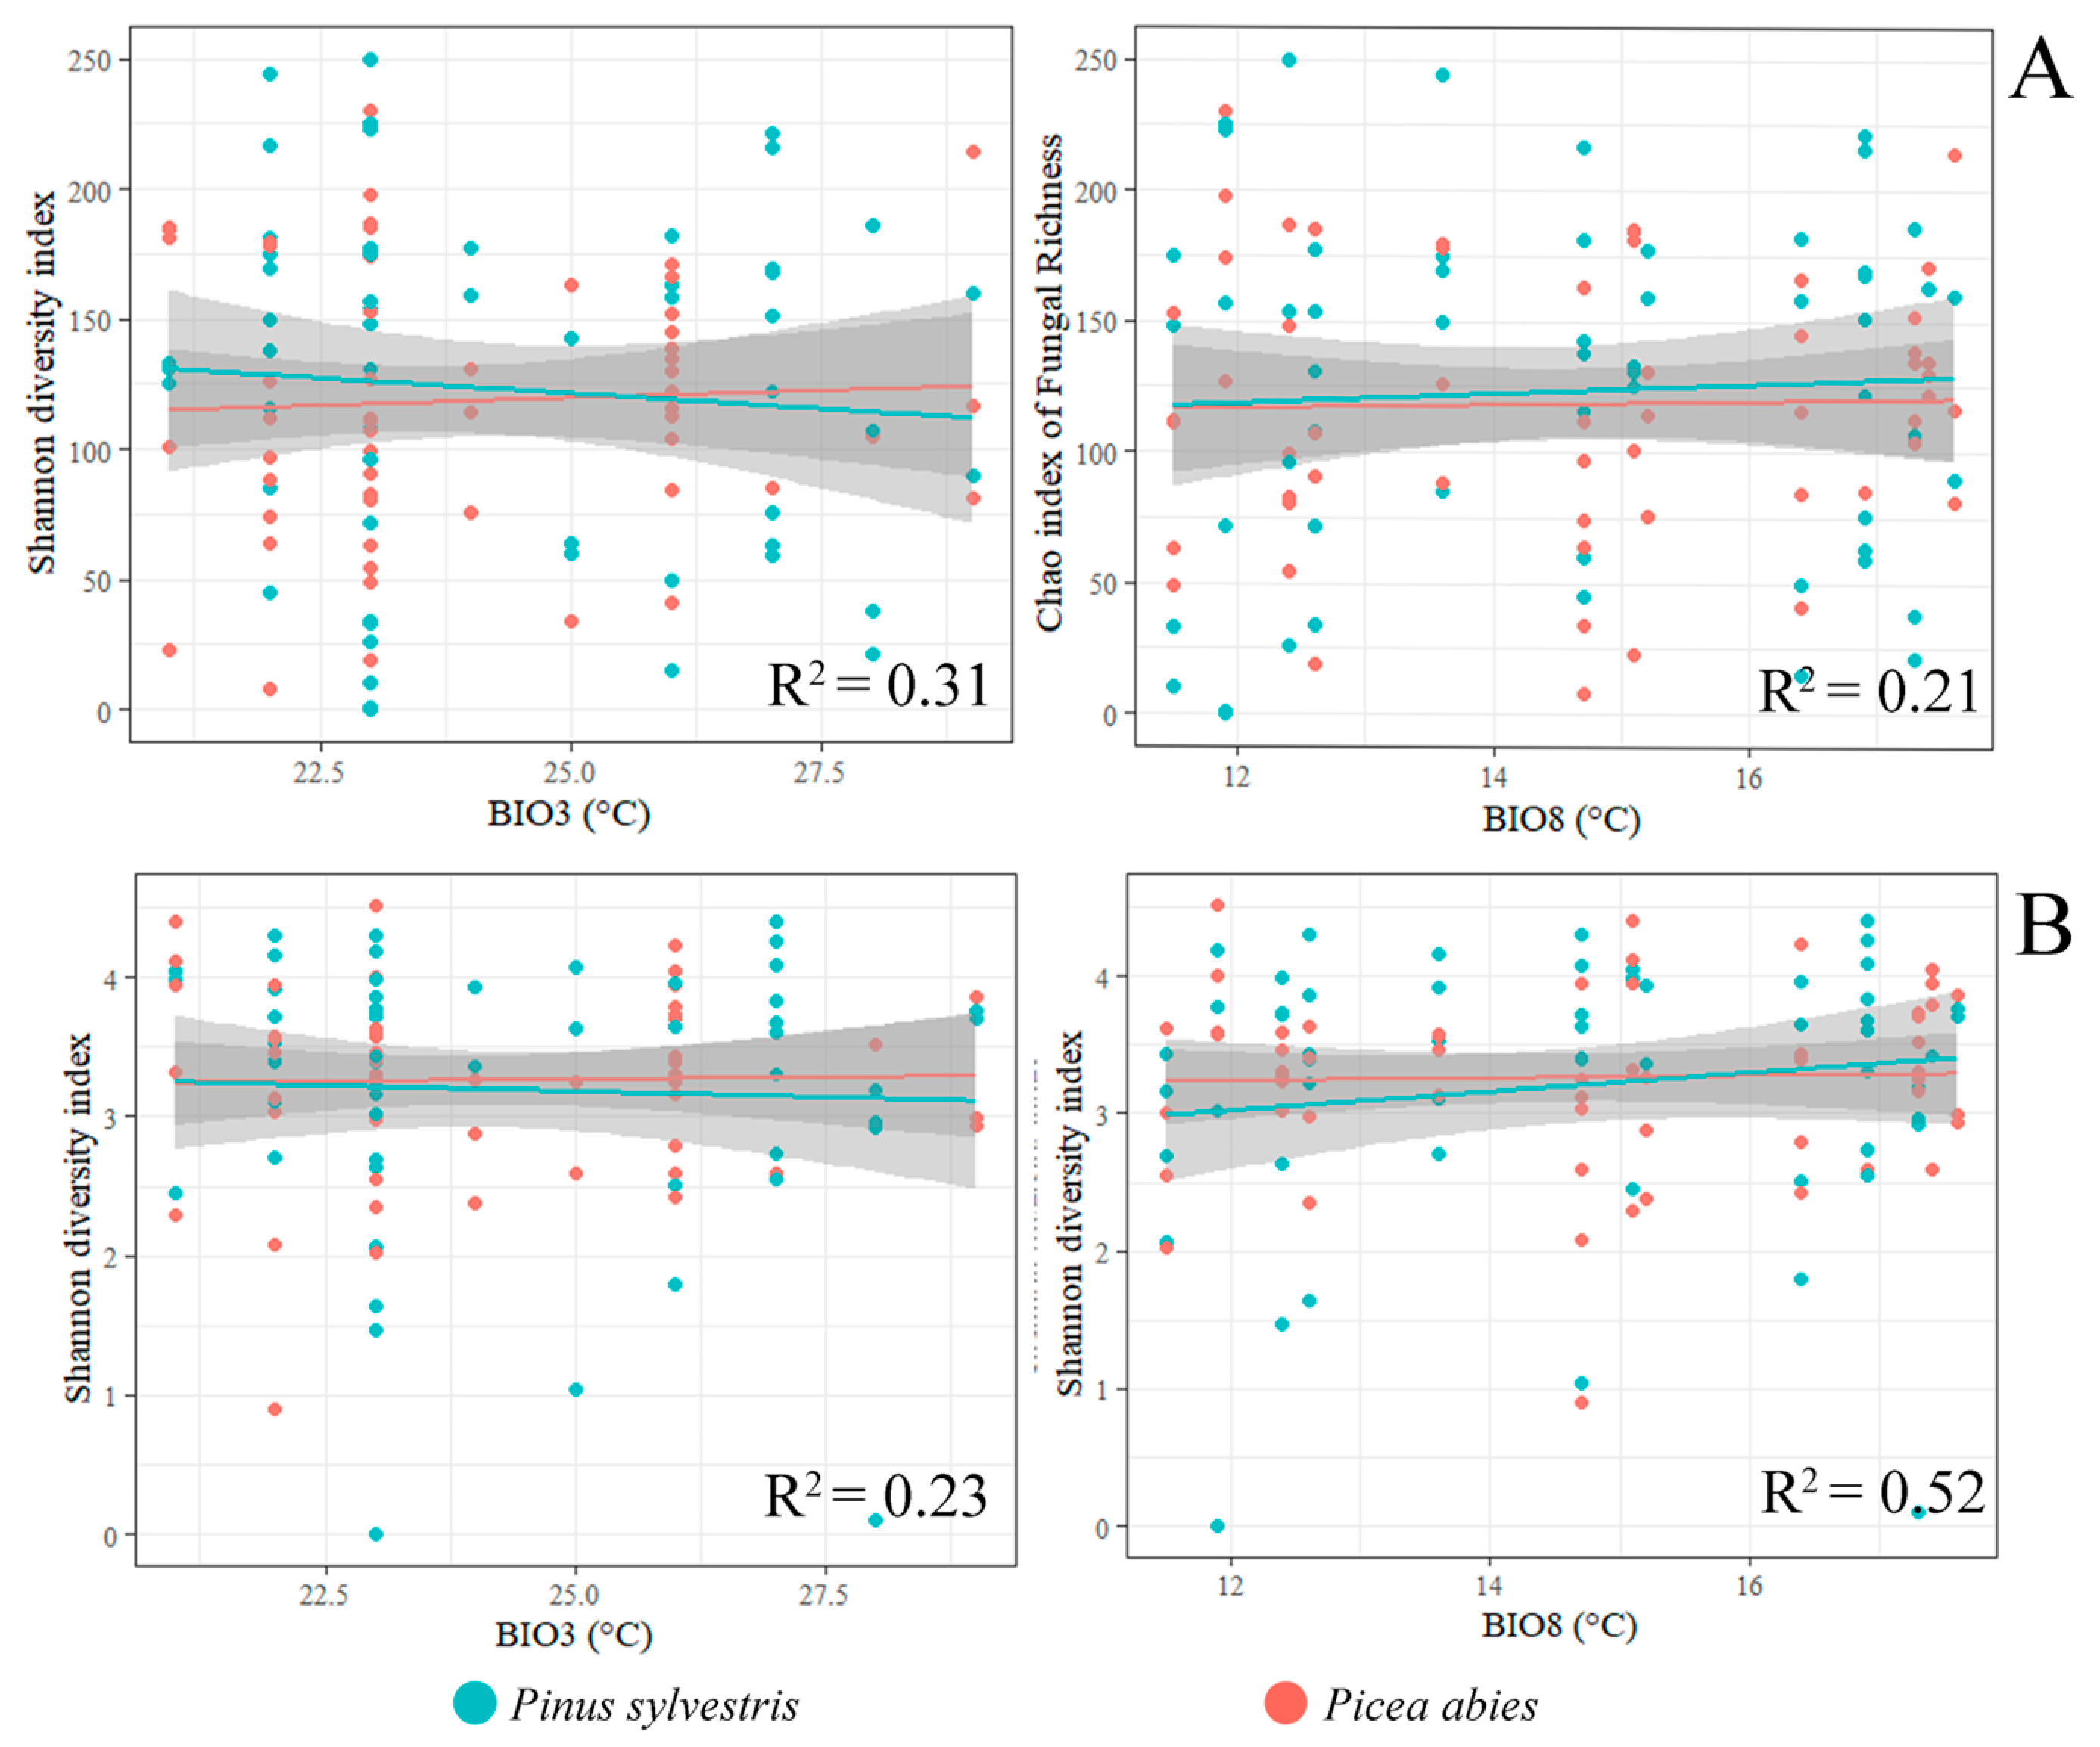
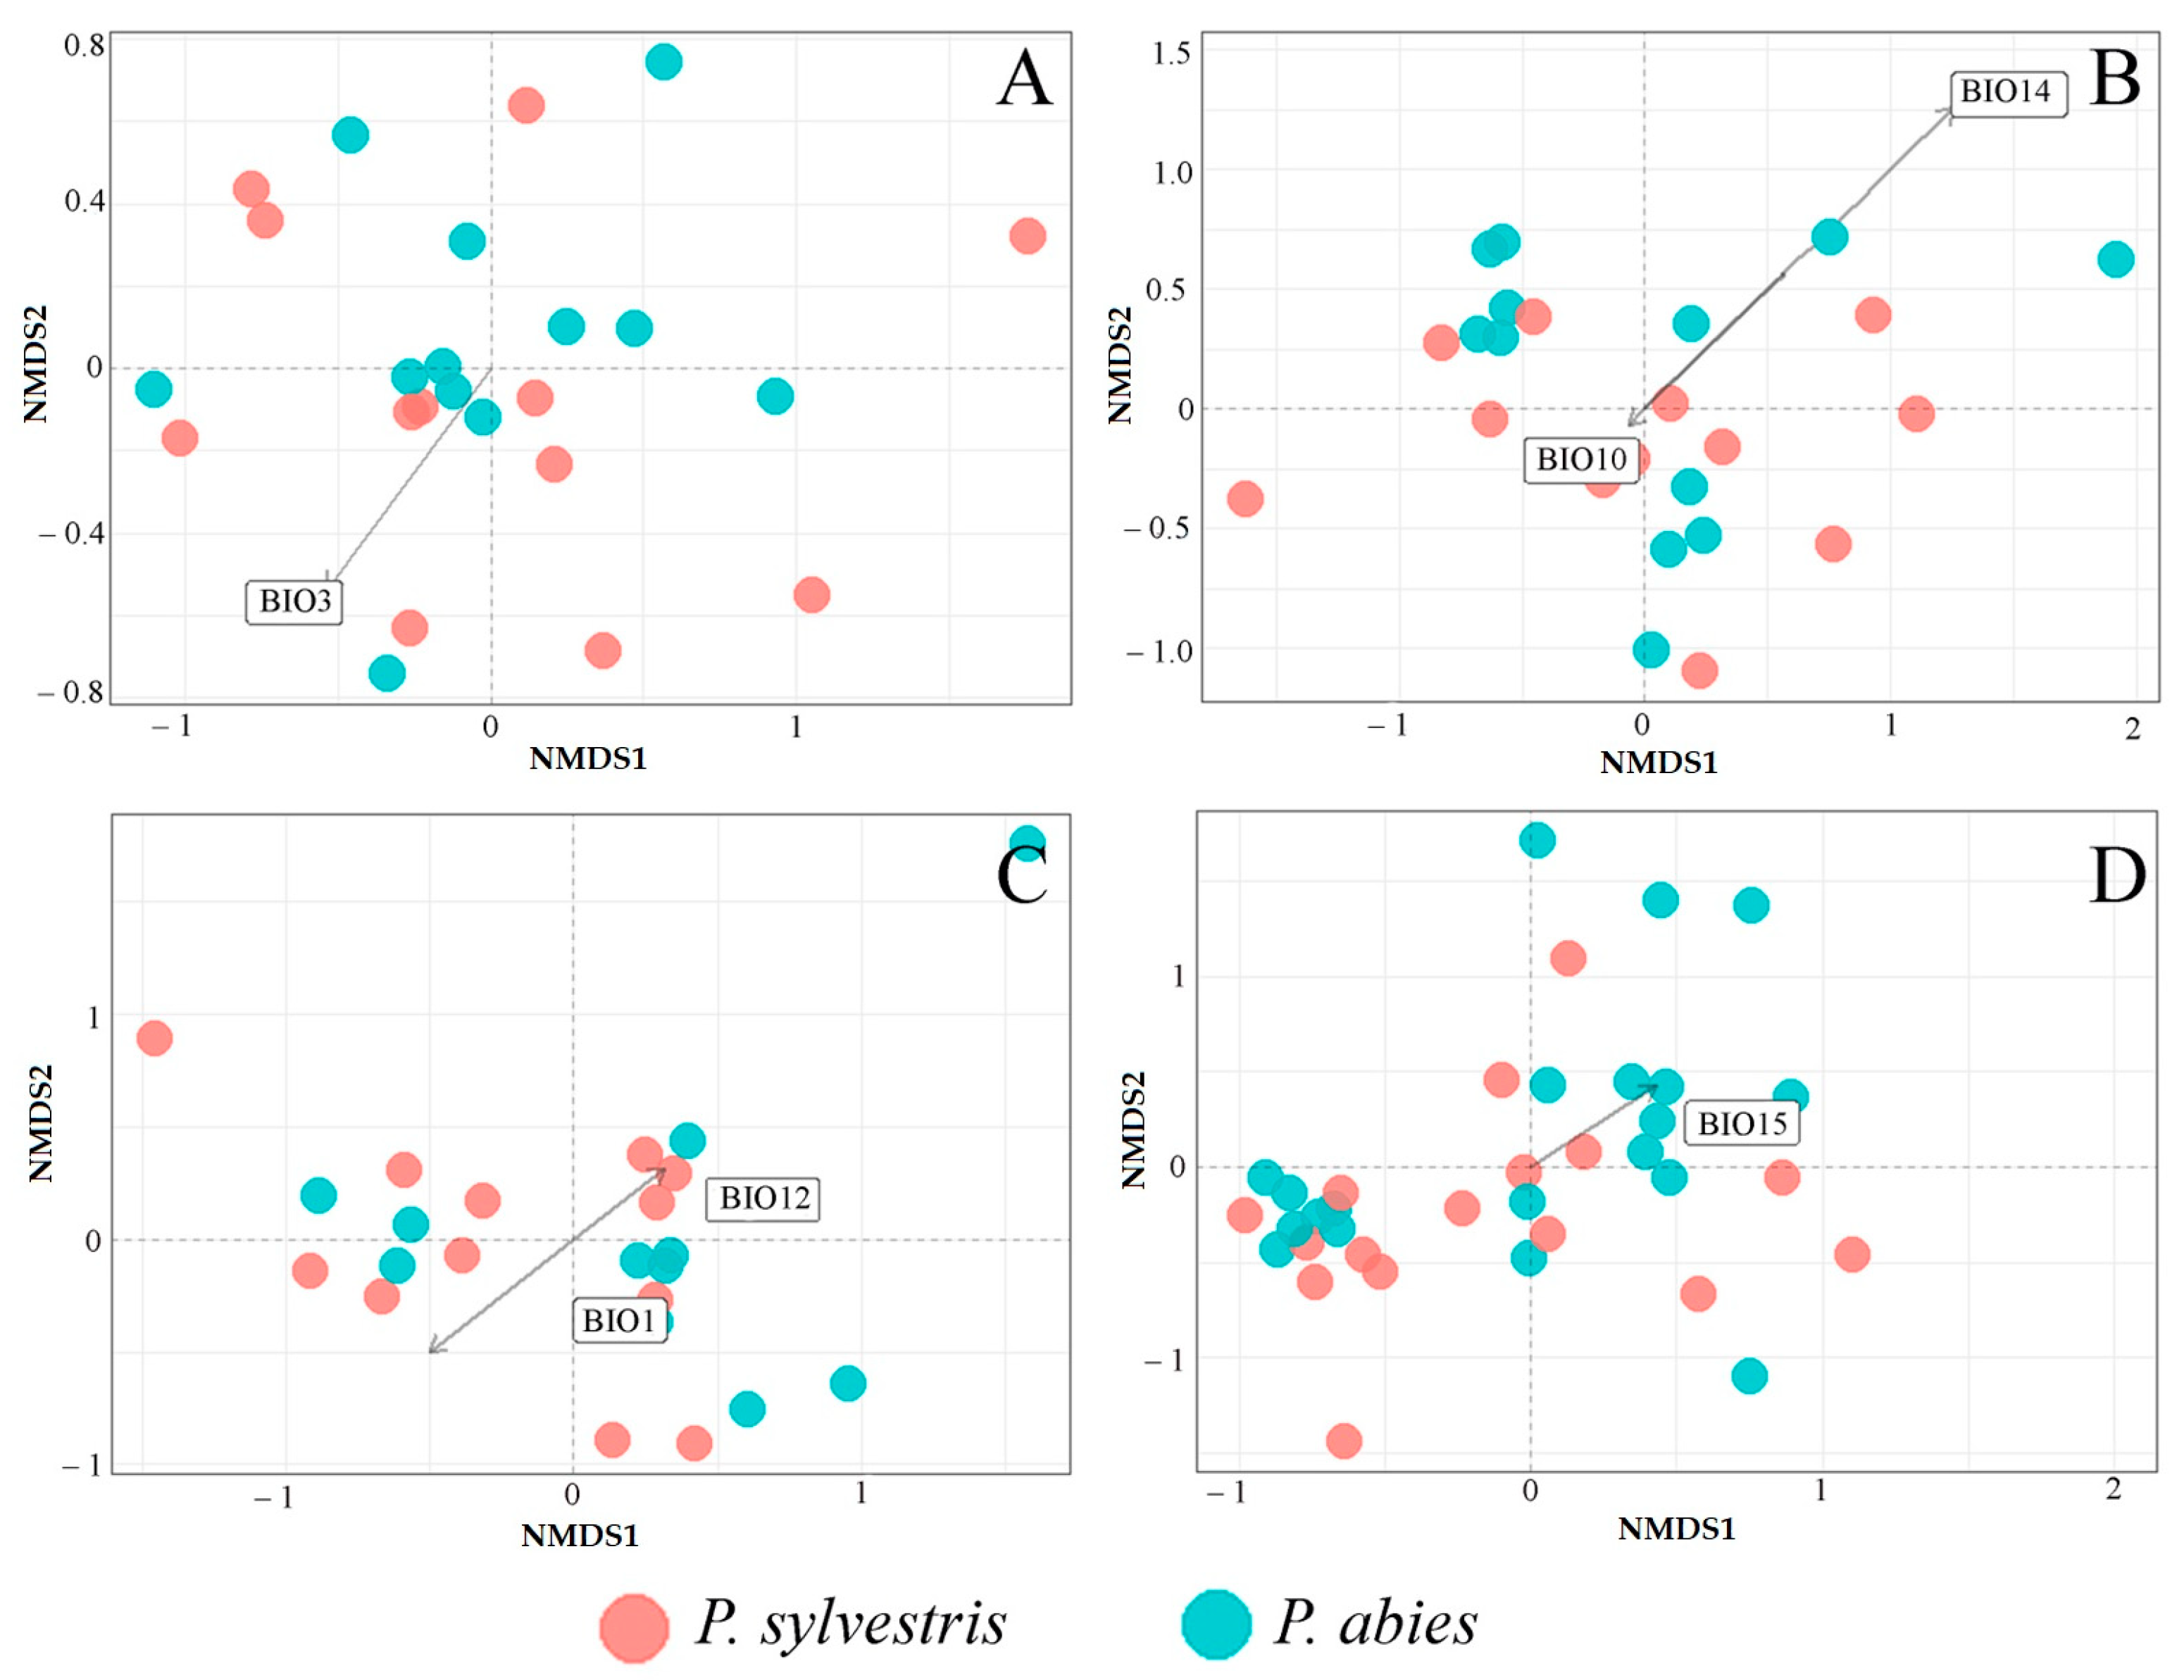
3.2. Fungal Communities and Bioclimatic Factors Explaining the Community Structure

The primary analysis included temperature variables (BIO1-BIO11), precipitation variables (BIO12–BIO19), and latitude. However, latitude was excluded from further analyses as this parameter had in most cases insignificant (p > 0.05) effect on the Chao1 richness index and the Shannon diversity index of fungal communities (Figure 4A–C). The bioclimatic variables best explaining variance in the Chao1 richness index were the isotermality (BIO3) and mean temperature of the wettest quarter (BIO8). The primary analysis showed a strong correlation (r > 0.8) among the remaining variables representing temperature (BIO1, BIO2, BIO4-BIO11) and precipitation (BIO12-BIO14, BIO16-BIO19), which were excluded from the linear regression model. Precipitation variables (BIO12–BIO19) had an insignificant (p > 0.05) effect on the Shannon diversity index. The bioclimatic variables best explaining the variance in the Shannon diversity index were the isotermality (BIO3) and mean temperature of the wettest quarter (BIO8). Due to a strong correlation among other precipitation variables (BIO12-BIO14, BIO17-BIO19), these were excluded from the linear regression model.
For both P. sylvestris and P. abies, the linear regression model of biodiversity showed a significant (F = 7.042, R2 = 0.31, p = 0.01) effect of isothermality (BIO3) and mean temperature of the wettest quarter (BIO8) (F = 6.01, R2 = 0.21, p = 0.01) on the richness of fungal communities (Figure 6A). Both mean temperature of the wettest quarter (BIO8) (F = 2.51, R2 = 0.23, p = 0.05), and isothermality (BIO3) (F = 4.91, R2 = 0.52, p = 0.02) had a significant effect on the Shannon diversity index (Figure 6B). In general, the Chao1 richness index and the Shannon diversity index of both P. sylvestris and P. abies responded similarly to changes in isothermality (BIO3) (Figure 6A,B). By contrast, the Chao1 richness index and the Shannon diversity index of each tree species responded differently to changes in mean temperature of the wettest quarter (BIO8) (Figure 6A,B).
MANOVA showed a significant effect (F = 4.06, p < 0.05) of the bioclimatic variables on fungal communities detected in different samples (needles, shoots, roots, and the soil) at P. sylvestris and P. abies study sites (Figure 7A–D). NMDS showed that isothermality (BIO3; R2 = 0.46, p = 0.04) was one of the most important factors determining the variation of fungal communities in needles of both tree species (Figure 7A). Bioclimatic variables best explaining the variance of fungal communities in shoots were the mean temperature of the warmest quarter (BIO10; R2 = 0.31, p = 0.04) and precipitation of the driest month (BIO14; R2 = 0.33, p = 0.02) (Figure 7B). However, the mean temperature of the warmest quarter (BIO10) had a more pronounced effect on P. abies shoot fungal communities than on these of P. sylvestris (Figure 7B). The bioclimatic variables best explaining the variation of fungal communities in roots were the annual mean temperature (BIO1; R2 = 0.21, p = 0.01) and annual precipitation (BIO12; R2 = 0.25, p = 0.04). Root-associated fungal communities followed both directions of decreasing annual mean temperature (BIO1) and increasing annual precipitation (BIO12) (Figure 7C). The variation of fungal communities in the rhizosphere soil was most affected by the precipitation seasonality (BIO15; R2 = 0.32, p = 0.001). Fungal communities of the rhizosphere soil of P. abies were largely distributed under the increasing precipitation seasonality (BIO15), while these of P. sylvestris were largely distributed under the decreasing precipitation seasonality (Figure 7D).

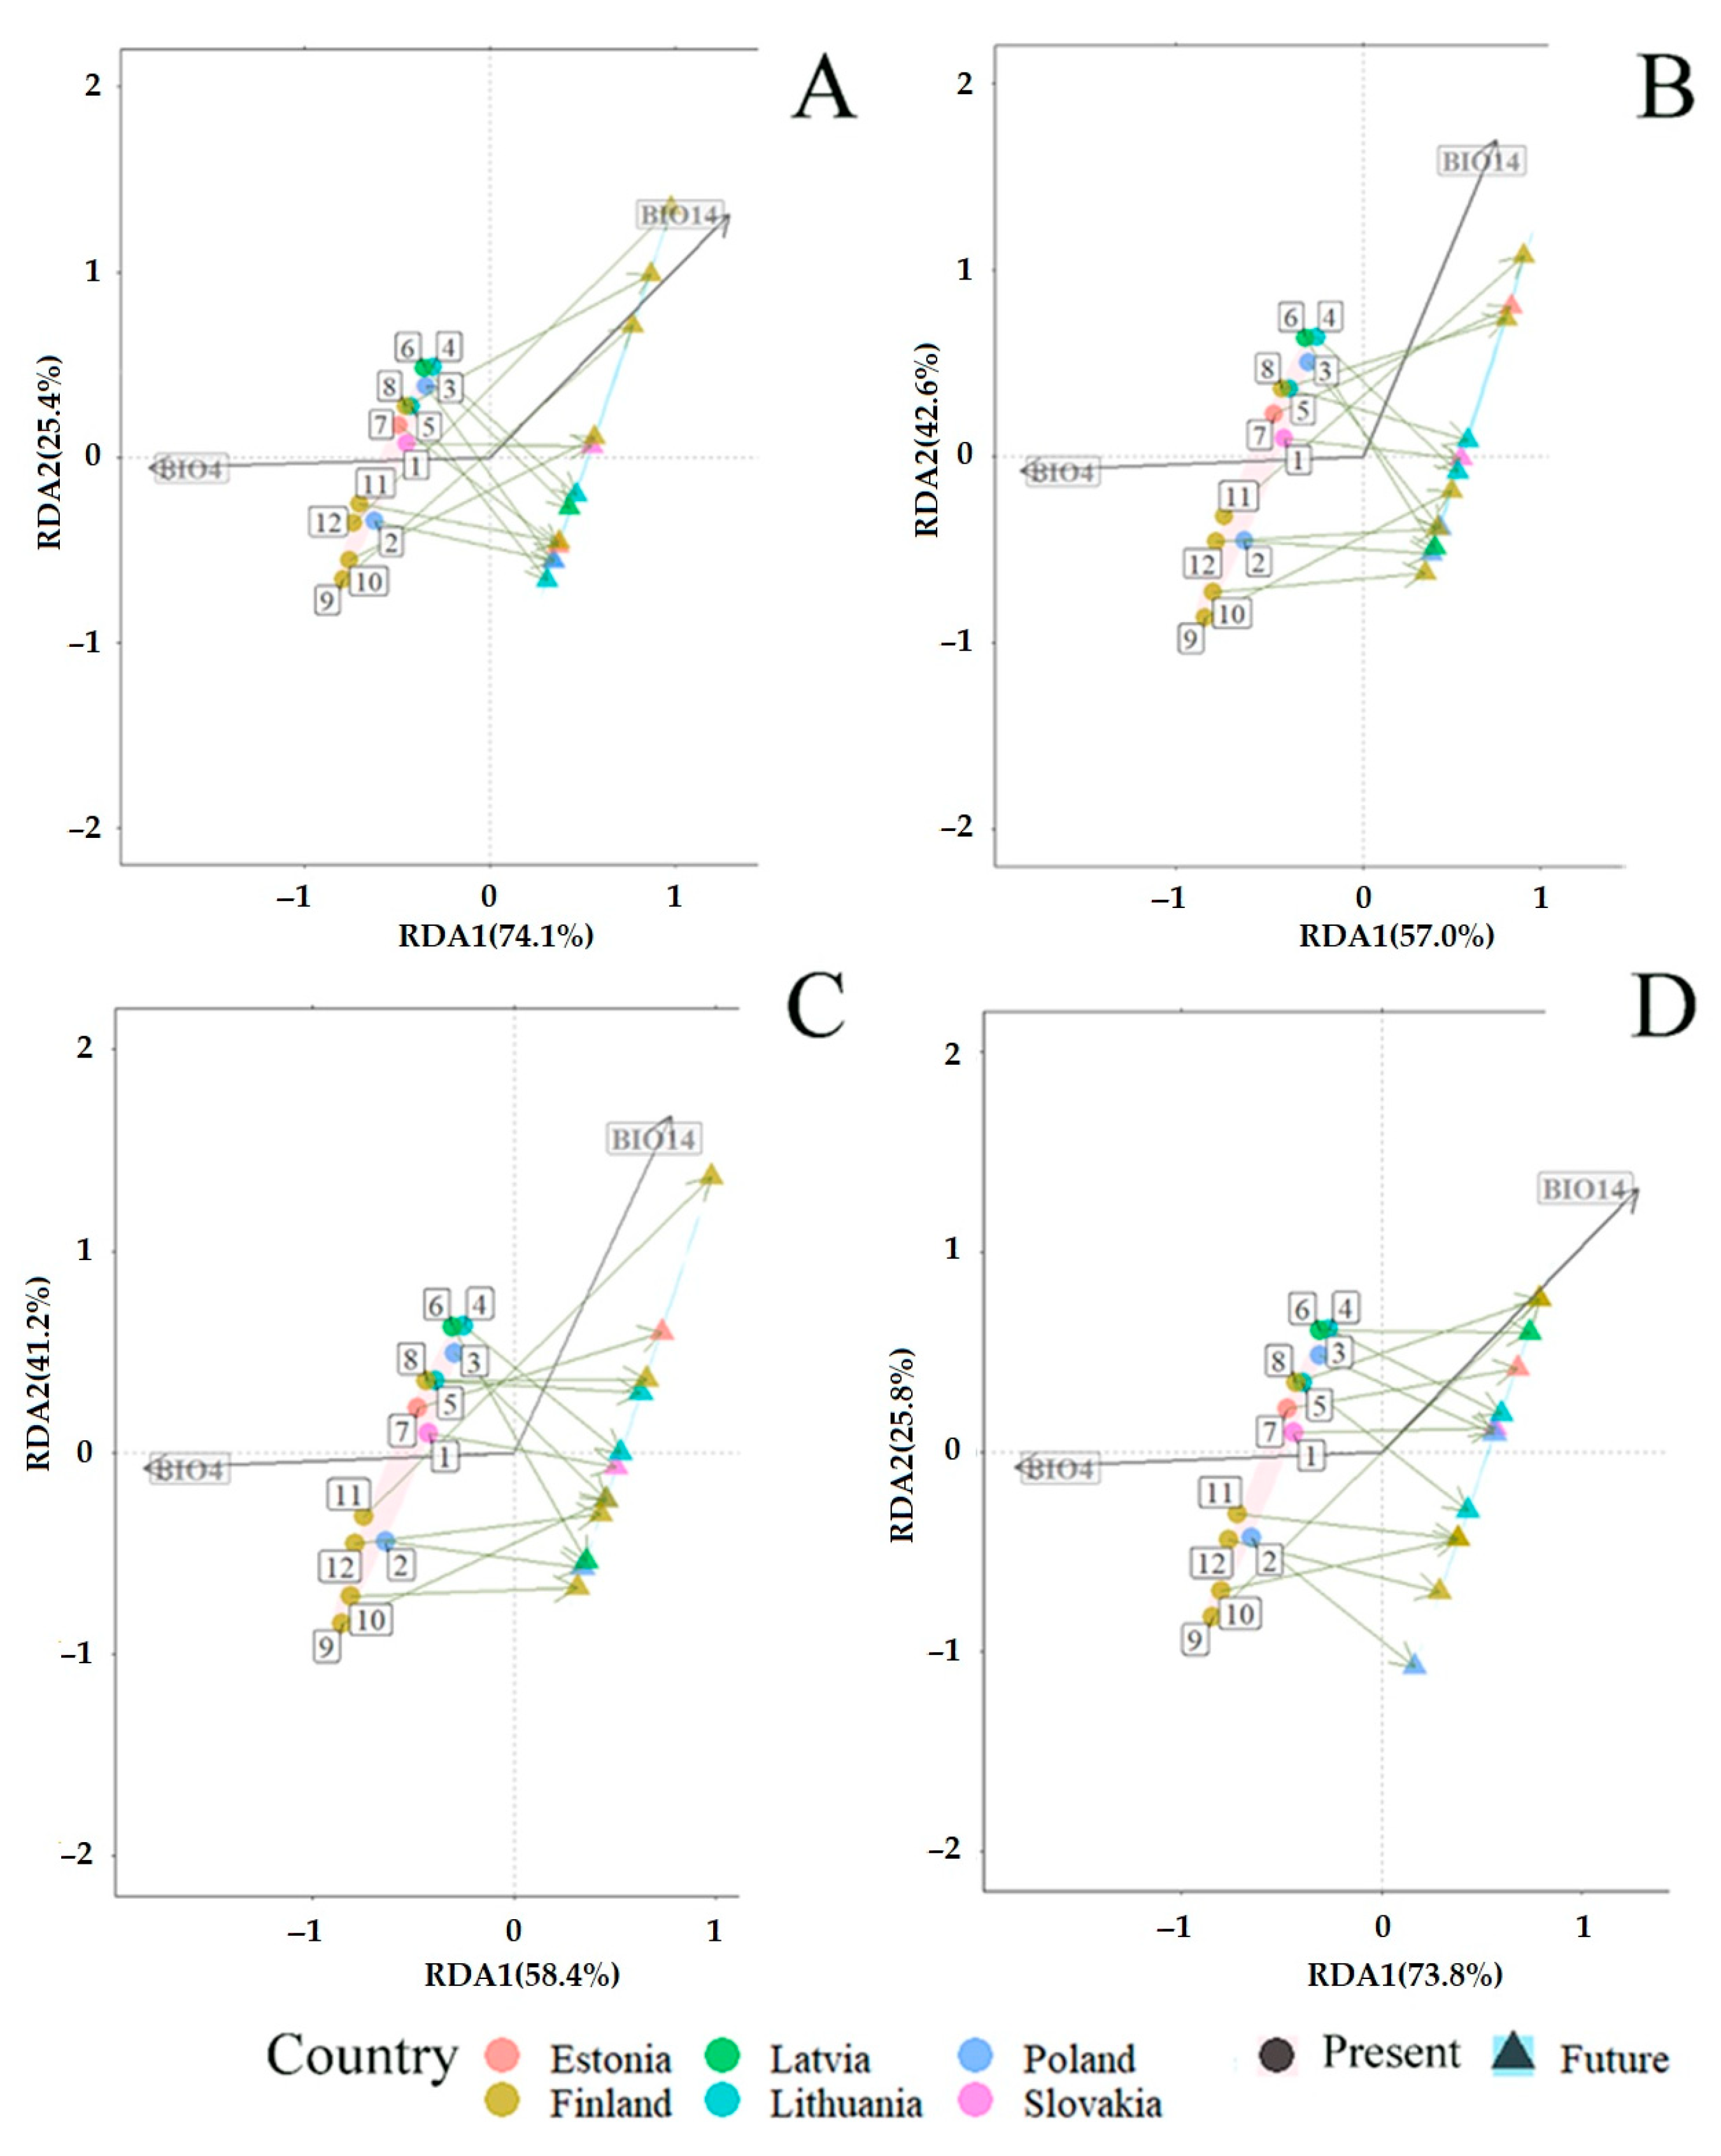
3.3. Projected Shifts in Fungal Communities under the CMIP6 Model

Redundancy analysis (RDA) revealed the predicted mid-term (periods 2019–2040 and 2019–2060) and long-term (periods 2019–2080 and 2019–2100) changes in fungal communities associated with P. sylvestris and P. abies (Figure 8 and Figure 9). RDA included bioclimatic variables, representing temperature (BIO1–BIO11) and precipitation (BIO12–BIO19) (Table 2), which were present at different sampling sites. Bioclimatic variables such as temperature seasonality (BIO4) and precipitation of the driest month (BIO14) best explained the variance of total fungal communities, i.e., in needles, shoots, roots, and the rhizosphere soil, they had the lowest variance of inflation factor (VIF < 10); therefore, they were used to predict changes of fungal communities associated with both P. sylvestris (Figure 8A–D) and P. abies (Figure 9A–D). In the primary analysis, the remaining variables associated with either temperature or precipitation showed a strong correlation (r > 0.8), and thus, were excluded from RDA.
RDA showed significant (R2  =  0.72, p  <  0.001) predicted mid- and long-term changes in fungal communities associated with P. sylvestris. The constrained proportion variance of RDA Axis 2 explained by RDA Axis 1 was 55.9% and the unconstrained proportion unexplained variance in RDA Axis 2 was 44.1%. The RDA diagram showed that mid-term (2019–2040 and 2019–2060) and long-term (2019–2080 and 2019–2100) changes in fungal communities associated with P. sylvestris will be determined by the decreasing temperature seasonality (BIO4) and increasing precipitation of the driest month (BIO14) (Figure 8A–D). Therefore, when compared between individual sampling sites, fungal communities associated with P. sylvestris are expected to change differently. During the period of 2019–2040, fungal communities at the sampling sites 1 (SK), 8–10, and 12 (FI) are predicted to be more affected by increasing precipitation of the driest month (BIO14) than by decreasing temperature seasonality (BIO4). On the contrary, fungal communities at all other sampling sites, i.e., 2–3 (PL), 4–5 (LT), 6 (LV), 7 (EE), and 11 (FI), are predicted to be more affected by decreasing temperature seasonality (BIO4) than by increasing precipitation of the driest month (BIO14) (Figure 8A).
During the period 2019–2060, fungal communities at P. sylvestris study sites such as seven (EE), eight, and 11 (FI) are predicted to change depending on increasing precipitation of the driest month (BIO14), while fungal communities at other sites, i.e., 1 (SK), 2–3 (PL), 4–5 (LT), 6 (LV), 9–10, and 12 (FI), are predicted to follow the decreasing temperature seasonality (BIO4) (Figure 8B). During the period 2019–2080, fungal communities detected at 4–5 (LT), 7 (EE), 8, and 11 (FI) study sites are predicted to follow increasing vectors of BIO14, while these at study sites, such as 1 (SK), 2–3 (PL), 6 (LV), 9–10, and 12 (FI), are predicted to follow decreasing temperature seasonality (BIO4) (Figure 8C). During the period 2019–2100, fungal communities at the study sites, such as one (SK), 3three (PL), four (LT), six (LV), seven (EE), and eight (FI), are predicted to follow increasing BIO14, while these at all other study sites, i.e., 2 (PL), 5 (LT), and 9–12 (FI), are predicted to change following the decrease of BIO4 (Figure 8D). These results show that fungal communities associated with P. sylvestris at northern study sites during the mid-term period (2019–2040 and 2019–2060) are predicted to change depending on the increase of precipitation of the driest month (BIO14), while these during the long-term period (2019–2080 and 2019–2100) are predicted to change depending on the decrease of temperature seasonality (BIO4). Fungal communities at the southern study sites did not show a consistent trend for changes during mid- and long-term periods (Figure 8A–D).
RDA also showed significant (R2  =  0.65, p  <  0.001) predicted mid- and long-term changes in fungal communities associated with P. abies. The constrained proportion variance of RDA Axis 2 explained by RDA Axis 1 was 65.8% and the unconstrained proportion unexplained variance in RDA Axis 2 was 34.1%. Mid- and long-term (2019–2040, 2019–2060, 2019–2080 and 2019–2100) changes in fungal communities associated with P. abies are predicted to take place similarly as in P. sylvestris fungal communities, i.e., under the conditions of decreasing temperature seasonality (BIO4) and increasing precipitations of the driest month (BIO14) (Figure 9A–D). However, the vector of variable BIO14 changed its direction as compared with RDA of P. sylvestris (Figure 8A–D vs. Figure 9A–D). This can probably be explained by the scaling resolution of the WordClim database, which was used for RDA. During the period 2019–2040, fungal communities associated with P. abies at the study sites 5 (LT), 8–9, and 12 (FI) are predicted to follow the increasing vector of BIO14, while these at other sites, i.e., 1 (SK), 2–3 (PL), 4 (LT), 6 (LV), 7 (EE), and 10–11 (FI), are predicted to be distributed under conditions of decreasing temperature seasonality (Figure 9B).
During both periods 2019–2060 and 2019–2080, fungal communities at the study sites, such as seven (EE), eight, and 11 (FI), are predicted to be strongly affected by increasing precipitation of the driest month (BIO14), while these at other study sites, i.e., 1 (SK), 2–3 (PL), 4–5 (LT), 6 (LV), 9–10, and 12 (FI), are predicted to be dependent on the decrease in temperature seasonality (BIO4) (Figure 9 B–C). During the period 2019–2100, fungal communities at sites, such as one (SK), three (PL), four (LT), six (LV), and seven (EE), are predicted to be strongly affected by increasing precipitation of the driest month (BIO14), while these at other study sites, i.e., 2 (PL), 5 (LT), and 8–12 (FI), are predicted to be dependent on the decrease in temperature seasonality (BIO4) (Figure 9D). These results show a more stable situation in fungal communities associated with P. abies during the periods of 2019–2060 and 2019–2080 (Figure 9B–C). Therefore, the key factor in the mid- and long-term changes in fungal communities along the south–north gradient of P. abies is predicted to be the decrease in temperature seasonality (BIO4) (Figure 9A–D).
Results also showed that as compared to the present climatic conditions, the habitat area of fungal communities associated with both P. sylvestris and P. abies is predicted to narrow down in the future (Figure 8A–D and Figure 9A–D).

4. Discussion

Fungal communities associated with functional tissues and the rhizosphere soil of host trees are increasingly recognized as important factors determining forest health and sustainability in the process of climate change [36,63,64]. Furthermore, geographical gradients can serve as a useful tool providing valuable insights not only into the assembly of these fungal communities, their relationship with vegetation, climate, and soil over certain areas, but also into overall ecosystem functioning [65]. By incorporating the data on fungal communities associated with P. sylvestris and P. abies from a large geographical area and a number of bioclimatic variables, the present study provided new insights into qualitative and quantitative aspects of these fungal communities and their possible changes in the mid- and long-term perspective.
The results showed that the latitude did not have a significant effect on the diversity of fungal communities, thus, in this respect rejecting the hypothesis. In support, several studies showed that fungal diversity did not follow a general pattern of spatial distribution. For example, Wang et al. [64] showed that the Chao1 richness index and the Shannon diversity index of fungal communities in soil samples did not follow geographical coordinates; instead, these were more dependent on local site conditions. Furthermore, Tedersoo et al. [66] and Liu et al. [67] showed that fungal diversity decreased with the increase of latitude, whereas Shi et al. [68] found that fungal diversity peaked at mid-latitudes and descended towards high and low latitudes.
In the present study, a certain dependence on the latitude was revealed for several of the most-abundant fungal OTUs associated with a specific tree species (Figure 5). Consequently, hierarchical clustering showed that several OTUs of P. sylvestris or P. abies were more specifically associated with either southern, central, or northern parts of the latitudinal gradient of this study (Figure 5). Nevertheless, these results should be interpreted with caution as observed patterns may be dependent on several factors and not on the latitude alone. Several studies have also examined latitudinal clines on the diversity of fungal communities associated with a specific host species. However, the existing reports on the dependence of fungal diversity on the latitude are contradictory, including studies showing the increase [69], the decrease [28], or no change in, e.g., the foliar fungal community [70,71]. Similarly, the effect of the latitude on the fungal community composition are also variable. For example, foliar fungal communities in needles of P. sylvestris and Pinus albicaulis changed with the change of latitude [70,72], while Allen et al. [71] reported the lack of such change in the foliar fungal community of Phragamites australis.
A number of bioclimatic variables had a significant effect on the diversity of fungal communities, suggesting that alterations in these variables imposed by climate change is likely to have a strong impact on fungal communities associated with P. sylvestris and P. abies. Understanding the mechanisms underlying community assembly is essential for predicting compositional responses to changing environments [65]. At the same time, existing studies often emphasize the role of environmental variables as one of the main driving factors determining the abundance and composition of fungal communities [73,74]. Therefore, the integration of several bioclimatic variables representing temperature (BIO1-BIO11) and precipitation (BIO12-BIO19) (Table 2) in fungal community modeling revealed their relative importance determining fungal species richness (Figure 6A,B), diversity (Figure 6C), and fungal community composition associated with needles, shoots, roots, and the rhizosphere soil of each tree species (Figure 7A–D). Interestingly, the same bioclimatic variables often similarly explained variation in fungal communities associated with both P. sylvestris and P. abies, thereby showing a low host specificity. U’Ren et al. [37] emphasized that one of the principal components affecting the composition and functioning of fungal communities is the host plant. Nevertheless, the results of the present study showed that fungal communities associated with P. sylvestris and P. abies were similar, and only to a lower extent affected by the host plant. Therefore, the results demonstrated that the richness and diversity of fungal communities associated with both tree species responded similarly to changes in isothermality (BIO3), but a more specific response was in fungal communities of each tree species to mean temperature of the wettest quarter (BIO8) (Figure 6A,B). According to the interpretation of bioclimatic variables by O’Donnell and Ignizio [75], these results suggest that fungal richness increases when the diurnal temperature range approximates the annual temperature range, while fungal richness decreased with the excess of water during the nongrowing season and limited water supply during the growing season. Talley et al. [76] showed that there was a negative correlation between fungal richness and temperature.
The results also showed that bioclimatic variables, including temperature and precipitation, had a significant effect on the distribution variability of fungal communities associated with both P. sylvestris and P. abies (Figure 7A–D). However, there were different bioclimatic variables that explained fungal communities in different samples. For example, the mean annual temperature (BIO1) and mean annual precipitation (BIO12) had a strong effect on root fungal communities (Figure 7C), isothermality (BIO3) on needle fungal communities, mean temperature of the warmest quarter (BIO10) and precipitation of the driest month (BIO14) on shoot fungal communities and precipitation seasonality (BIO15) on soil fungal communities. Mean annual temperature and mean annual precipitation are referred to as being good predictors of plant and animal diversity at a continental scale [77]. Hawkins et al. [77] found that measures of energy, water, or water–energy balance explain spatial variation in richness better than other climatic and nonclimatic variables in 82 of 85 cases. Even when considered individually and in isolation, water/energy variables explain on average over 60% of the variation in the richness of a wide range of plant and animal groups [77]. Similar bioclimatic variables were tested by Větrovský et al. [78] showing that the mean temperature of the driest quarter, precipitation seasonality, mean temperature of the wettest quarter, precipitation of the coldest quarter, and diurnal temperature range were among the strongest predictors of individual species distributions. Fungi respond directly to rainfall levels, with more abundant, diverse, and consistent communities predominating under drought conditions, and less abundant, less diverse, and more variable communities emerging during wetter periods. The repeated recovery of fungal diversity and abundance during periodic drought events suggests that species with a wide range of environmental tolerances coexist in this community, consistent with a storage effect in soil fungi. Increased diversity during dry periods further suggests that drought stress moderates competition among fungal taxa [79]. Taken together and in agreement with the results of the present study, climate was shown to be one of the most important drivers of belowground [80,81] and aboveground microbial communities associated with the host tree [70].
In recent years, modeling the response of biodiversity to climate change has become an important research area [82,83,84]. For example, Alkhalifah et al. [84] have used the same bioclimatic variables as in the present study to predict changes in the distribution of Fusarium oxysporum causing vascular wilt disease for several crops for two time periods spanning until 2050 and 2070. The distribution of F. oxysporum and the suitability of its habitats was determined by bioclimatic variables such as annual mean temperature (BIO1), temperature annual range (BIO7), annual precipitation (BIO12), mean diurnal range (BIO2), and precipitation of the driest month (BIO14). The results of the present study suggest that temperature seasonality (BIO4) and precipitation of the driest month (BIO14) will be the key factors determining future changes in fungal communities associated P. sylvestris and P. abies (Figure 8 and Figure 9). The latter observations suggest that specific fungal species may require habitats with more specific climatic conditions than fungal communities overall. Our results also suggest that in a mid- and long-term perspective, fungal communities of both P. sylvestris and P. abies are likely to shift to habitats with a lower annual temperature amplitude, i.e., with temperatures becoming more similar between winter, spring, summer, and autumn seasons and with the increasing amounts of precipitation in the driest month (Figure 8 and Figure 9). These findings are consistent with general scenarios of climate change. For example, Lee et al. [85] predicted that during winter and summer periods, the change in temperature will have spatial gradients with the strongest warming in the northeast of the Baltic Sea region. The decrease in temperature seasonality is expected to be due to more pronounced winter warming than summer warming, which is likely to favor fungal communities of P. sylvestris in the northern study sites during the long-term period (2019–2080 and 2019–2100) (Figure 8C,D). By contrast, fungal communities associated with P. sylvestris at the southern study sites did not show a consistent trend for changes during mid- and long-term periods (Figure 8A–D), probably due to a relatively lower warming effect in the southern part of the latitudinal gradient. Fungal communities associated with P. sylvestris at northern study sites during the mid-term period (2019–2040 and 2019–2060) is predicted to change depending on increasing rainfall and especially during the drought periods, which deviates from climate change models predicting that the global hydrological cycle to become more intense [86], leading to increased precipitation in the northern Europe and decreased precipitation in the southern Europe, both in winter and in summer [85]. However, these changes in precipitation between northern and southern Europe are expected to be relatively small (e.g., Silén et al. [87]). Changes in fungal communities of P. abies are expected to follow a similar scenario as of P. sylvestris with the key predictor being temperature seasonality (Figure 9A–D). Previous studies demonstrated that fungi responded directly to rainfall levels, with a more abundant, diverse, and consistent communities predominating under drought conditions, and a less abundant, less diverse, and more variable communities emerging during wetter periods [88]. Although our results showed that changes in fungal communities will follow the trend of predicted changes in temperature and precipitation, in the predictions of global warming, the effect of high temperature can be alleviated by seasonal acclimatization, emphasizing the importance of physiological plasticity on both long- and short-term temporal scales in evaluating and forecasting vulnerability of organisms, including fungi, to climate change [89]. This may suggest that organisms, including fungi, should adapt to changing environmental conditions, which is demonstrated by our results, showing a notable reduction in the habitat area with suitable climatic conditions for fungal communities associated with both P. sylvestris and P. abies (Figure 8A–D and Figure 9A–D).
For both P. sylvestris and P. abies, in different study sites and substrates the most abundant fungal phyla were Ascomycota and Basidiomycota, which are known to dominate among fungi colonizing soils and terrestrial plant tissues [74]. In agreement with other studies, our results demonstrated high ecological importance and wide distribution of these phyla in soils (e.g., Wei et al. [35]; Zheng et al. [65]), roots (e.g., Zhao et al. [90]), needles (e.g., Agan et al. [91]) and shoots (e.g., Sanz-Ros et al. [92]). The results also showed the predominant occurrence of fungal classes such as Dothideomycetes, Agaricomycetes, Eurotiomycetes, and Leotiomycetes (Figure 3 and Table 3 and Table 4), which are commonly reported classes from environmental samples [92,93,94]. Dothideomycetes is known to be one of the largest classes within Ascomycota, containing over 19,000 species of saprotrophs, parasites, and occasional lichen-forming species [95,96,97]. Dothideomycetes were reported from different ecosystems, ranging from hot deserts [98] to low-temperature environments in Antarctica [99,100]. Agaricomycetes was the second most-abundant fungal class, representatives of which possess several important ecological functions such as the formation of ectomycorrhizal symbiosis and wood decay in shrubs, perennial plants, and trees [101,102]. Their activity is essential for ecosystem functioning in different environments including forest soil [97,103,104] or grassland soils [105]), but also in different tissues of P. sylvestris and P. abies as was shown in the present study. Eurotiomycetes and Leotiomycetes include saprotrophic, biotrophic, lichen-forming fungi, ectomycorrhizal fungi, and endophytes [106,107], demonstrating their importance in different environments of managed and natural ecosystems.
In both P. sylvestris and P. abies samples, S. polyspora, a widespread saprotrophic and/or pathogenic [108] species living on conifers [109], was identified as the most common fungal species. This fungus, as one of the most common in pine and spruce tissues, was also identified during previous studies [74,110]. Although S. polyspora often occurs as an epiphyte or endophyte of conifers [111], some authors suggest that the fungus can become pathogenic in a colonized host under the influence of certain abiotic and biotic factors [112]. This fungus was also associated with current season needle necrosis (CSNN) on fir (Abies spp.) and Pinus sp. in the USA and Europe, developing brown bands or spots on needles, turning them reddish brown (necrotic) and even causing their shedding [113]. S. polyspora was also isolated from damaged needles of Pinus yunnanensis Franch. in Southwestern China [109], and Pinus halepensis Mill. in Italy [114]. Recently, it was found that S. polyspora can cause a rapid decline of A. concolor trees under abiotic stress [108]. Pan et al., [109] also indicate that S. polyspora has an association with bark beetles but this association appears to be not specific. The authors also suggest that the frequency of occurrence of S. polyspora may be related to the local environment and host species. This should be noted, especially because the fungus can change its lifestyle from endophytic to pathogenic when the climate changes.
A. luzulae was identified as one of the most common fungi in spruce samples, which is known as a cosmopolitan saprotrophic species of fungicolous fungi or plant decomposers [115]. The fungus was isolated from dead Luzula sylvatica leaves in England, rust on Carex sp. in Netherlands, and from Annulohypoxylon sp. and Hypoxylon sp. in Japan [115,116]. The fungus was also recorded on M. hypericorum rust in Iran. This was not only the first record in Iran, but also in Asia [117]. However, there is not much information about the role and significance of this species in forests or other ecosystems, therefore its role in P. sylvestris stands is difficult to predict. Another fungus found at a high frequency was Penicillium camemberti, which is a well-known fungus in the food industry, most often used in the production of Camembert and Brie cheeses, on which colonies of the fungus form a white crust [118]. Although P. camemberti is described as a strictly aerobic fungus that only grows on the surface of the cheese [119], it appears that it can also be found in P. abies soils. In a study by de Melo et al. [120] in Brazil, P. camemberti was isolated from soil samples collected in Cerrado State Park. The fungus was previously also isolated from soil samples collected in Söğütlük Forests of Edirne City, in Turkey [121], as well as in different P. sylvestris stands in Lithuania [74,122]. Although P. camemberti was found in soils in various forests and other natural ecosystems, its role remains largely unknown and requires further attention.
Among the other most commonly identified fungal species, there were some species that are well-known in forests, such as Suillus luteus which is a widespread species in coniferous forests that forms ectomycorrhizal associations with pines including P. sylvestris [123,124,125] and could increase the uptake of nutrients and water and subsequently promote the growth of symbiotic plants [126]. Mucor moelleri was another commonly detected species, which is a common fast-growing fungus usually found in soil but can also be detected on plant surfaces. Currently, the fungus is widely studied for its antagonistic potential and as a plant growth-promoting agent [127,128,129].

5. Conclusions

The expected changes in the biodiversity indicators and the structure of fungal communities were not clearly traced in this study with increasing latitude. Fungal communities associated with both P. sylvestris and P. abies showed quantitative and qualitative differences based on the substrate (needles, shoots, roots, or the soil) and sampling site rather than based on the host tree species. Fungal communities in different substrates were affected by different bioclimatic variables. Under the pressure of climate change, fungal communities are predicted to shift in the future, but vectors of this shift are likely to be site-specific.

Supplementary Materials

The following supporting information can be downloaded at: https://www.mdpi.com/article/10.3390/jof9080829/s1, Table S1: Relative abundance of fungal OTUs sequenced from needle, shoot, root and soil samples of Pinus sylvestris.; Table S2: Relative abundance of fungal OTUs sequenced from needle, shoot, root and soil samples of Picea abies.

Author Contributions

Conceptualization, V.M., A.M. (Audrius Menkis), J.L., A.M. (Adas Marčiulynas) and D.M.; methodology, D.M., A.M. (Adas Marčiulynas) and A.M. (Audrius Menkis); validation, A.M. (Audrius Menkis) and D.M.; formal analysis, V.M., A.M. (Adas Marčiulynas), J.L., O.P. and D.M.; investigation, D.M., A.M. (Adas Marčiulynas), A.G., J.L. and V.M.; data curation, A.M. (Adas Marčiulynas), D.M. and A.M. (Audrius Menkis); writing—original draft preparation, V.M., D.M. and A.M. (Audrius Menkis); writing—review and editing, V.M., D.M., A.M. (Audrius Menkis), A.M. (Adas Marčiulynas), J.L., O.P. and A.G.; supervision, A.M. (Audrius Menkis) and D.M.; project administration, D.M.; funding acquisition, A.M. (Audrius Menkis). All authors have read and agreed to the published version of the manuscript.

Funding

This research was funded by European Social Fund (project No. 09.3.3-LMT-K-712-01-0039) under grant agreement with the Research Council of Lithuania (LMTLT).

Institutional Review Board Statement

Not applicable.

Informed Consent Statement

Not applicable.

Data Availability Statement

The data is available upon request from the corresponding author.

Conflicts of Interest

The authors declare no conflict of interest.

References

  1. Mauri, A.; Girardello, M.; Strona, G.; Beck, P.S.A.; Forzieri, G.; Caudullo, G.; Manca, F.; Cescatti, A. EU-Trees4F, a Dataset on the Future Distribution of European Tree Species. Sci. Data 2022, 9, 37. [Google Scholar] [CrossRef] [PubMed]
  2. De Rigo, D.; San-Miguel-Ayanz, J.; Caudullo, G.; Durrant, T.H.; Mauri, A. (Eds.) European Atlas of Forest Tree Species; Publications Office of the European Union: Luxembourg, 2016; ISBN 978-92-79-36740-3. [Google Scholar]
  3. Bottero, A.; Forrester, D.I.; Cailleret, M.; Kohnle, U.; Gessler, A.; Michel, D.; Bose, A.K.; Bauhus, J.; Bugmann, H.; Cuntz, M.; et al. Growth Resistance and Resilience of Mixed Silver Fir and Norway Spruce Forests in Central Europe: Contrasting Responses to Mild and Severe Droughts. Glob. Chang. Biol. 2021, 27, 4403–4419. [Google Scholar] [CrossRef]
  4. Durrant, T.H.; De Rigo, D.; Caudullo, G. Pinus sylvestris in Europe: Distribution, habitat, usage and threats. Eur. Atlas For. Tree Species 2016, 14, 845–846. [Google Scholar]
  5. Dering, M.; Baranowska, M.; Beridze, B.; Chybicki, I.J.; Danelia, I.; Iszkuło, G.; Kvartskhava, G.; Kosiński, P.; Rączka, G.; Thomas, P.A.; et al. The evolutionary heritage and ecological uniqueness of Scots pine in the Caucasus ecoregion is at risk of climate changes. Sci. Rep. 2011, 11, 22845. [Google Scholar] [CrossRef] [PubMed]
  6. Kalbarczyk, R.; Ziemiańska, M.; Nieróbca, A.; Dobrzańska, J. The Impact of Climate Change and Strong Anthropopressure on the Annual Growth of Scots Pine (Pinus sylvestris L.) Wood Growing in Eastern Poland. Forests 2018, 9, 661. [Google Scholar] [CrossRef] [Green Version]
  7. Tabakova, M.A.; Arzac, A.; Martínez, E.; Kirdyanov, A.V. Climatic Factors Controlling Pinus Sylvestris Radial Growth along a Transect of Increasing Continentality in Southern Siberia. Dendrochronologia 2020, 62, 125709. [Google Scholar] [CrossRef]
  8. Illés, G.; Móricz, N. Climate envelope analyses suggests significant rearrangements in the distribution ranges of Central European tree species. Ann. For. Sci. 2022, 79, 35. [Google Scholar] [CrossRef]
  9. Sladonja, B.; Poljuha, D.; Uzelac, M. Non-Native Invasive Species as Ecosystem Service Providers. In Ecosystem Services and Global Ecology; Hufnagel, L., Ed.; IntechOpen: London, UK, 2018; pp. 39–59. [Google Scholar] [CrossRef] [Green Version]
  10. Tyrmi, J.S.; Vuosku, J.; Acosta, J.J.; Li, Z.; Sterck, L.; Cervera, M.T.; Savolainen, O.; Pyhäjärvi, T. Genomics of Clinal Local Adaptation in Pinus Sylvestris under Continuous Environmental and Spatial Genetic Setting. Genomics 2019, 10, 2683–2696. [Google Scholar] [CrossRef]
  11. Jamnická, G.; Fleischer, P.; Konôpková, A.; Pšidová, E.; Kučerová, J.; Kurjak, D.; Živčák, M.; Ditmarová, Ľ. Norway Spruce (Picea abies L.) Provenances Use Different Physiological Strategies to Cope with Water Deficit. Forests 2019, 10, 651. [Google Scholar] [CrossRef] [Green Version]
  12. Spiecker, H. Silvicultural Management in Maintaining Biodiversity and Resistance of Forests in Europe—Temperate Zone. J. Environ. Manag. 2003, 67, 55–65. [Google Scholar] [CrossRef]
  13. Netherer, S.; Kandasamy, D.; Jirosová, A.; Kalinová, B.; Schebeck, M.; Schlyter, F. Interactions among Norway Spruce, the Bark Beetle Ips Typographus and Its Fungal Symbionts in Times of Drought. J. Pest. Sci. 2021, 94, 591–614. [Google Scholar] [CrossRef]
  14. Lindner, M.; Maroschek, M.; Netherer, S.; Kremer, A.; Barbati, A.; Garcia-Gonzalo, J.; Seidl, R.; Delzon, S.; Corona, P.; Kolström, M.; et al. Climate Change Impacts, Adaptive Capacity, and Vulnerability of European Forest Ecosystems. For. Ecol. Manag. 2010, 259, 698–709. [Google Scholar] [CrossRef]
  15. Vimal, S.R.; Singh, J.S.; Arora, N.K.; Singh, S. Soil-Plant-Microbe Interactions in Stressed Agriculture Management: A Review. Pedosphere 2017, 27, 177–192. [Google Scholar] [CrossRef]
  16. Andreote, F.D.; e Silva, M.D.C.P. Microbial Communities Associated with Plants: Learning from Nature to Apply It in Agriculture. Curr. Opin. Microbiol. 2017, 37, 29–34. [Google Scholar] [CrossRef] [PubMed]
  17. Tiwari, S.; Lata, C. Heavy Metal Stress, Signaling, and Tolerance Due to Plant-Associated Microbes: An Overview. Front. Plant Sci. 2018, 9, 452. [Google Scholar] [CrossRef] [PubMed] [Green Version]
  18. Compant, S.; Samad, A.; Faist, H.; Sessitsch, A. A Review on the Plant Microbiome: Ecology, Functions, and Emerging Trends in Microbial Application. J. Adv. Res. 2019, 19, 29–37. [Google Scholar] [CrossRef] [PubMed]
  19. Wu, Y.; Qu, M.; Pu, X.; Lin, J.; Shu, B. Distinct microbial communities among different tissues of citrus tree Citrus reticulata cv. Chachiensis. Sci. Rep. 2020, 10, 6068. [Google Scholar] [CrossRef] [PubMed] [Green Version]
  20. Turner, T.R.; James, E.K.; Poole, P.S. The plant microbiome. Genome Biol. 2013, 14, 209. [Google Scholar] [CrossRef] [Green Version]
  21. Vandenkoornhuyse, P.; Quaiser, A.; Duhamel, M.; Le Van, A.; Dufresne, A. The Importance of the Microbiome of the Plant Holobiont. New Phytol. 2015, 206, 1196–1206. [Google Scholar] [CrossRef]
  22. Gehring, C.; Sthultz, C.; Flores-Rentería, L.; Whipple, A.; Whitham, T. Tree genetics defines fungal partner communities that may confer drought tolerance. Proc. Natl. Acad. Sci. USA 2017, 114, 11169–11174. [Google Scholar] [CrossRef]
  23. Allsup, C.M.; George, I.; Lankau, R.A. Shifting microbial communities can enhance tree tolerance to changing climates. Science 2023, 380, 835–840. [Google Scholar] [CrossRef] [PubMed]
  24. Adair, K.L.; Lindgreen, S.; Poole, A.M.; Young, L.M.; Bernard-Verdier, M.; Wardle, D.A.; Tylianakis, J.M. Above and belowground community strategies respond to different global change drivers. Sci. Rep. 2019, 9, 2540. [Google Scholar] [CrossRef] [PubMed] [Green Version]
  25. Liu, L.; Zhu, K.; Wurzburger, N.; Zhang, J. Relationships between plant diversity and soil microbial diversity vary across taxonomic groups and spatial scales. Ecosphere 2020, 11, e02999. [Google Scholar] [CrossRef] [Green Version]
  26. Kaul, S.; Sharma, T.K.; Dhar, M. “Omics” Tools for Better Understanding the Plant–Endophyte Interactions. Front. Plant Sci. 2016, 7, 955. [Google Scholar] [CrossRef] [Green Version]
  27. Busby, P.E.; Soman, C.; Wagner, M.R.; Friesen, M.L.; Kremer, J.; Bennett, A.; Morsy, M.; Eisen, J.A.; Leach, J.E.; Dangl, J.L. Research Priorities for Harnessing Plant Microbiomes in Sustainable Agriculture. PLoS Biol. 2017, 15, e2001793. [Google Scholar] [CrossRef] [PubMed]
  28. Terhonen, E.; Blumenstein, K.; Kovalchuk, A.; Asiegbu, F.O. Forest Tree Microbiomes and Associated Fungal Endophytes: Functional Roles and Impact on Forest Health. Forests 2019, 10, 42. [Google Scholar] [CrossRef] [Green Version]
  29. Contreras-Cornejo, H.A.; Macías-Rodríguez, L.; del-Val, E.; Larsen, J. The Root Endophytic Fungus Trichoderma Atroviride Induces Foliar Herbivory Resistance in Maize Plants. Appl. Soil Ecol. 2018, 124, 45–53. [Google Scholar] [CrossRef]
  30. Bano, A.; Hussain, J.; Akbar, A.; Mehmood, K.; Anwar, M.; Hasni, M.S.; Ullah, S.; Sajid, S.; Ali, I. Biosorption of Heavy Metals by Obligate Halophilic Fungi. Chemosphere 2018, 199, 218–222. [Google Scholar] [CrossRef]
  31. Rajamani, T.; Suryanarayanan, T.S.; Murali, T.S.; Thirunavukkarasu, N. Distribution and Diversity of Foliar Endophytic Fungi in the Mangroves of Andaman Islands, India. Fungal Ecol. 2018, 36, 109–116. [Google Scholar] [CrossRef]
  32. Carroll, G. Fungal Endophytes in Stems and Leaves: From Latent Pathogen to Mutualistic Symbiont. Ecology 1988, 69, 2–9. [Google Scholar] [CrossRef]
  33. Migliorini, D.; Ghelardini, L.; Tondini, E.; Luchi, N.; Santini, A. The Potential of Symptomless Potted Plants for Carrying Invasive Soilborne Plant Pathogens. Divers. Distrib. 2015, 21, 1218–1229. [Google Scholar] [CrossRef] [Green Version]
  34. Fang, K.; Miao, Y.-F.; Chen, L.; Zhou, J.; Yang, Z.-P.; Dong, X.-F.; Zhang, H.-B. Tissue-Specific and Geographical Variation in Endophytic Fungi of Ageratina Adenophora and Fungal Associations with the Environment. Front. Microbiol. 2019, 10, 2919. [Google Scholar] [CrossRef] [PubMed] [Green Version]
  35. Wei, X.; Wang, X.; Cao, P.; Gao, Z.; Chen, A.J.; Han, J. Microbial Community Changes in the Rhizosphere Soil of Healthy and Rusty Panax Ginseng and Discovery of Pivotal Fungal Genera Associated with Rusty Roots. BioMed Res. Int. 2020, 2020, 8018525. [Google Scholar] [CrossRef] [PubMed] [Green Version]
  36. Nguyen, N.H.; Song, Z.; Bates, S.T.; Branco, S.; Tedersoo, L.; Menke, J.; Schilling, J.S.; Kennedy, P.G. FUNGuild: An Open Annotation Tool for Parsing Fungal Community Datasets by Ecological Guild. Fungal Ecol. 2016, 20, 241–248. [Google Scholar] [CrossRef]
  37. U’Ren, J.M.; Lutzoni, F.; Miadlikowska, J.; Zimmerman, N.B.; Carbone, I.; May, G.; Arnold, A.E. Host Availability Drives Distributions of Fungal Endophytes in the Imperilled Boreal Realm. Nat. Ecol. Evol. 2019, 3, 1430–1437. [Google Scholar] [CrossRef] [Green Version]
  38. Oita, S.; Ibáñez, A.; Lutzoni, F.; Miadlikowska, J.; Geml, J.; Lewis, L.A.; Hom, E.F.Y.; Carbone, I.; U’Ren, J.M.; Arnold, A.E. Climate and Seasonality Drive the Richness and Composition of Tropical Fungal Endophytes at a Landscape Scale. Commun. Biol. 2021, 4, 313. [Google Scholar] [CrossRef]
  39. Suryanarayanan, T.S.; Shaanker, R.U. Can Fungal Endophytes Fast-Track Plant Adaptations to Climate Change? Fungal Ecol. 2021, 50, 101039. [Google Scholar] [CrossRef]
  40. Naylor, D.; Sadler, N.; Bhattacharjee, A.; Graham, E.B.; Anderton, C.R.; McClure, R.; Lipton, M.; Hofmockel, K.S.; Jansson, J.K. Soil Microbiomes Under Climate Change and Implications for Carbon Cycling. Annu. Rev. Environ. Resour. 2020, 45, 29–59. [Google Scholar] [CrossRef]
  41. Chanda, A.; Maghrawy, H.; Sayour, H.; Gummadidala, P.M.; Gomaa, O.M. Impact of Climate Change on Plant-Associated Fungi. In Climate Change Impacts on Agriculture and Food Security in Egypt; Ewis Omran, E.-S., Negm, A.M., Eds.; Springer Water; Springer International Publishing: Cham, Switzerland, 2020; pp. 83–96. ISBN 978-3-030-41628-7. [Google Scholar]
  42. von Tiedemann, A.; Weigel, H.J.; Jäger, H.J. Effects of Open-Top Chamber Fumigations with Ozone on Three Fungal Leaf Diseases of Wheat and the Mycoflora of the Phyllosphere. Environ. Pollut. 1991, 72, 205–224. [Google Scholar] [CrossRef]
  43. Manning, W.J.; V Tiedemann, A. Climate Change: Potential Effects of Increased Atmospheric Carbon Dioxide (CO2), Ozone (O3), and Ultraviolet-B (UV-B) Radiation on Plant Diseases. Environ. Pollut. 1995, 88, 219–245. [Google Scholar] [CrossRef]
  44. Sandermann, H. Ozone/Biotic Disease Interactions: Molecular Biomarkers as a New Experimental Tool. Environ. Pollut. 2000, 108, 327–332. [Google Scholar] [CrossRef] [PubMed]
  45. Nickstadt, A.; Thomma, B.P.H.J.; Feussner, I.; Kangasjarvi, J.; Zeier, J.; Loeffler, C.; Scheel, D.; Berger, S. The Jasmonate-Insensitive Mutant Jin1 Shows Increased Resistance to Biotrophic as Well as Necrotrophic Pathogens. Mol. Plant. Pathol. 2004, 5, 425–434. [Google Scholar] [CrossRef] [PubMed]
  46. Andrade-Linares, D.R.; Veresoglou, S.D.; Rillig, M.C. Temperature Priming and Memory in Soil Filamentous Fungi. Fungal Ecol. 2016, 21, 10–15. [Google Scholar] [CrossRef]
  47. Kinlock, N.L.; Prowant, L.; Herstoff, E.M.; Foley, C.M.; Akin-Fajiye, M.; Bender, N.; Umarani, M.; Ryu, H.Y.; Şen, B.; Gurevitch, J. Explaining Global Variation in the Latitudinal Diversity Gradient: Meta-Analysis Confirms Known Patterns and Uncovers New Ones. Glob. Ecol. Biogeogr. 2018, 27, 125–141. [Google Scholar] [CrossRef]
  48. Duffy, K.J.; Waud, M.; Schatz, B.; Petanidou, T.; Jacquemyn, H. Latitudinal Variation in Mycorrhizal Diversity Associated with a European Orchid. J. Biogeogr. 2019, 46, 968–980. [Google Scholar] [CrossRef]
  49. Gaytán, Á.; Abdelfattah, A.; Faticov, M.; Moreira, X.; Castagneyrol, B.; Van Halder, I.; De Frenne, P.; Meeussen, C.; Timmermans, B.G.H.; Ten Hoopen, J.P.J.G.; et al. Changes in the Foliar Fungal Community between Oak Leaf Flushes along a Latitudinal Gradient in Europe. J. Biogeogr. 2022, 49, 2269–2280. [Google Scholar] [CrossRef]
  50. Fick, S.E.; Hijmans, R.J. WorldClim 2: New 1-km Spatial Resolution Climate Surfaces for Global Land Areas. Int. J. Climatol. 2017, 37, 4302–4315. [Google Scholar] [CrossRef]
  51. Buivydaitė, V.; Vaičys, M. Kn. 32: Lietuvos dirvožemiai. In Naujoji Lietuvos Dirvožemių Klasifikacija; Lietuvos mokslas: Tęstinis, serijinis mokslo darbų leidinys Lietuvai ir pasauliui lietuvių ir anglų kalbomis; Lietuvos mokslas: Vilnius, Lithuania, 2001. (In Lithuanian) [Google Scholar]
  52. Karazija, S. Eglės Pomiškio Atsiradimo Dėsningumai. Miškininkystė 1998, 41, 26–33. [Google Scholar]
  53. Rosling, A.; Landeweert, R.; Lindahl, B.D.; Larsson, K.-H.; Kuyper, T.W.; Taylor, A.F.S.; Finlay, R.D. Vertical Distribution of Ectomycorrhizal Fungal Taxa in a Podzol Soil Profile. New Phytol. 2003, 159, 775–783. [Google Scholar] [CrossRef]
  54. Ihrmark, K.; Bödeker, I.T.M.; Cruz-Martinez, K.; Friberg, H.; Kubartova, A.; Schenck, J.; Strid, Y.; Stenlid, J.; Brandström-Durling, M.; Clemmensen, K.E.; et al. New Primers to Amplify the Fungal ITS2 Region—Evaluation by 454-Sequencing of Artificial and Natural Communities. FEMS Microbiol. Ecol. 2012, 82, 666–677. [Google Scholar] [CrossRef]
  55. White, T.J.; Bruns, T.; Lee, S.; Taylor, J. Amplification and direct sequencing of fungal ribosomal RNA genes for phylogenetics. In PCR Protocols; Elsevier: Amsterdam, The Netherlands, 1990; pp. 315–322. ISBN 978-0-12-372180-8. [Google Scholar]
  56. Kõljalg, U.; Nilsson, H.R.; Schigel, D.; Tedersoo, L.; Larsson, K.-H.; May, T.W.; Taylor, A.F.S.; Jeppesen, T.S.; Frøslev, T.G.; Lindahl, B.D.; et al. The Taxon Hypothesis Paradigm—On the Unambiguous Detection and Communication of Taxa. Microorganisms 2020, 8, 1910. [Google Scholar] [CrossRef]
  57. R: A Language and Environment for Statistical Computing. In R Foundation for Statistical Computing; R Core Team: Vienna, Austria, 2020.
  58. Hsieh, T.C.; Ma, K.H.; Chao, A. INEXT: An R Package for Rarefaction and Extrapolation of Species Diversity (Hill Numbers). Methods Ecol. Evol. 2016, 7, 1451–1456. [Google Scholar] [CrossRef]
  59. Cortez, P.; Cerdeira, A.; Almeida, F.; Matos, T.; Reis, J. Modeling Wine Preferences by Data Mining from Physicochemical Properties. Decis. Support Syst. 2009, 47, 547–553. [Google Scholar] [CrossRef] [Green Version]
  60. Oksanen, J.; Blanchet, F.G.; Kindt, R.; Legendre, P.; Minchin, P.; O’Hara, B.; Simpson, G.; Solymos, P.; Stevens, H.; Wagner, H. Vegan: Community Ecology Package, R Package Version 2.5–3. 2018. Available online: https://cran.r-project.org (accessed on 28 November 2021).
  61. Wickham, H. Ggplot2: Elegant Graphics for Data Analysis, 2nd ed.; Springer International Publishing: New York, NY, USA, 2016; ISBN 978-3-319-24275-0. [Google Scholar]
  62. Kindt, R. AlleleShift: An R Package to Predict and Visualize Population-Level Changes in Allele Frequencies in Response to Climate Change. PeerJ 2021, 9, e11534. [Google Scholar] [CrossRef]
  63. Martin-Benito, D.; Pederson, N.; Köse, N.; Doğan, M.; Bugmann, H.; Mosulishvili, M.; Bigler, C. Pervasive Effects of Drought on Tree Growth across a Wide Climatic Gradient in the Temperate Forests of the Caucasus. Glob. Ecol. Biogeogr. 2018, 27, 1314–1325. [Google Scholar] [CrossRef]
  64. Wang, S.; Bao, X.; Feng, K.; Deng, Y.; Zhou, W.; Shao, P.; Zheng, T.; Yao, F.; Yang, S.; Liu, S.; et al. Warming-Driven Migration of Core Microbiota Indicates Soil Property Changes at Continental Scale. Sci. Bull. 2021, 66, 2025–2035. [Google Scholar] [CrossRef] [PubMed]
  65. Zheng, Y.; Chen, L.; Ji, N.; Wang, Y.; Gao, C.; Jin, S.; Hu, H.; Huang, Z.; He, J.; Guo, L.; et al. Assembly Processes Lead to Divergent Soil Fungal Communities within and among 12 Forest Ecosystems along a Latitudinal Gradient. New Phytol. 2021, 231, 1183–1194. [Google Scholar] [CrossRef] [PubMed]
  66. Tedersoo, L.; Bahram, M.; Cajthaml, T.; Põlme, S.; Hiiesalu, I.; Anslan, S.; Harend, H.; Buegger, F.; Pritsch, K.; Koricheva, J.; et al. Tree Diversity and Species Identity Effects on Soil Fungi, Protists and Animals Are Context Dependent. ISME J. 2016, 10, 346–362. [Google Scholar] [CrossRef] [Green Version]
  67. Liu, J.; Sui, Y.; Yu, Z.; Shi, Y.; Chu, H.; Jin, J.; Liu, X.; Wang, G. Soil Carbon Content Drives the Biogeographical Distribution of Fungal Communities in the Black Soil Zone of Northeast China. Soil Biol. Biochem. 2015, 83, 29–39. [Google Scholar] [CrossRef]
  68. Shi, L.-L.; Mortimer, P.E.; Ferry Slik, J.W.; Zou, X.-M.; Xu, J.; Feng, W.-T.; Qiao, L. Variation in Forest Soil Fungal Diversity along a Latitudinal Gradient. Fungal Divers. 2014, 64, 305–315. [Google Scholar] [CrossRef]
  69. Sokolski, M.; Zymliński, R.; Biegus, J.; Siwołowski, P.; Nawrocka-Millward, S.; Todd, J.; Yerramilli, M.R.; Estis, J.; Jankowska, E.A.; Banasiak, W.; et al. Urinary Levels of Novel Kidney Biomarkers and Risk of True Worsening Renal Function and Mortality in Patients with Acute Heart Failure. Eur. J. Heart Fail. 2017, 19, 760–767. [Google Scholar] [CrossRef] [PubMed] [Green Version]
  70. Millberg, H.; Boberg, J.; Stenlid, J. Changes in Fungal Community of Scots Pine (Pinus sylvestris) Needles along a Latitudinal Gradient in Sweden. Fungal Ecol. 2015, 17, 126–139. [Google Scholar] [CrossRef]
  71. Allen, W.J.; DeVries, A.E.; Bologna, N.J.; Bickford, W.A.; Kowalski, K.P.; Meyerson, L.A.; Cronin, J.T. Intraspecific and Biogeographical Variation in Foliar Fungal Communities and Pathogen Damage of Native and Invasive Phragmites Australis. Glob. Ecol. Biogeogr. 2020, 29, 1199–1211. [Google Scholar] [CrossRef]
  72. Moler, E.R.V.; Aho, K. Whitebark Pine Foliar Fungal Endophyte Communities in the Southern Cascade Range, USA: Host Mycobiomes and White Pine Blister Rust. Fungal Ecol. 2018, 33, 104–114. [Google Scholar] [CrossRef]
  73. Bailes, G.; Thomas, D.; Bridgham, S.D.; Roy, B.A. Drivers of Grass Endophyte Communities in Prairies of the Pacific Northwest, USA. bioRxiv 2020. [Google Scholar] [CrossRef]
  74. Marčiulynienė, D.; Marčiulynas, A.; Mishcherikova, V.; Lynikienė, J.; Gedminas, A.; Franic, I.; Menkis, A. Principal Drivers of Fungal Communities Associated with Needles, Shoots, Roots and Adjacent Soil of Pinus Sylvestris. JoF 2022, 8, 1112. [Google Scholar] [CrossRef]
  75. O’Donnell, M.; Ignizio, D. Bioclimatic Predictors for Supporting Ecological Applications in the Conterminous United States. US Geol. Surv. Data Ser. 2012, 691, 4–9. [Google Scholar] [CrossRef] [Green Version]
  76. Talley, S.M.; Coley, P.D.; Kursar, T.A. Antifungal Leaf-Surface Metabolites Correlate with Fungal Abundance in Sagebrush Populations. J. Chem. Ecol. 2002, 28, 2141–2168. [Google Scholar] [CrossRef]
  77. Hawkins, B.A.; Field, R.; Cornell, H.V.; Currie, D.J.; Guégan, J.F.; Kaufman, D.M.; Kerr, J.T.; Mittelbach, G.G.; Oberdorff, T.; O’Brien, E.M.; et al. Turner Energy, water, and broad-scale geographic patterns of species richness. Ecology 2003, 84, 3105–3117. [Google Scholar] [CrossRef] [Green Version]
  78. Větrovský, T.; Kohout, P.; Kopecký, M.; Machac, A.; Man, M.; Bahnmann, B.D.; Brabcová, V.; Choi, J.; Meszárošová, L.; Human, Z.R.; et al. A Meta-Analysis of Global Fungal Distribution Reveals Climate-Driven Patterns. Nat. Commun. 2019, 10, 5142. [Google Scholar] [CrossRef] [Green Version]
  79. Hawkes, C.V.; Kivlin, S.N.; Rocca, J.D.; Huguet, V.; Thomsen, M.A.; Suttle, K.B. Fungal community responses to precipitation. Glob. Chang. Biol. 2010, 17, 1637–1645. [Google Scholar] [CrossRef]
  80. Chen, K.; Horton, R.M.; Bader, D.A.; Lesk, C.; Jiang, L.; Jones, B.; Zhou, L.; Chen, X.; Bi, J.; Kinney, P.L. Impact of Climate Change on Heat-Related Mortality in Jiangsu Province, China. Environ. Pollut. 2017, 224, 317–325. [Google Scholar] [CrossRef] [PubMed] [Green Version]
  81. Praeg, N.; Schwinghammer, L.; Illmer, P. Larix decidua and Additional Light Affect the Methane Balance of Forest Soil and the Abundance of Methanogenic and Methanotrophic Microorganisms. FEMS Microbiol. Lett. 2019, 366, fnz259. [Google Scholar] [CrossRef] [PubMed]
  82. McMahon, S.M.; Harrison, S.P.; Armbruster, W.S.; Bartlein, P.J.; Beale, C.M.; Edwards, M.E.; Kattge, J.; Midgley, G.; Morin, X.; Prentice, I.C. Improving Assessment and Modelling of Climate Change Impacts on Global Terrestrial Biodiversity. Trends Ecol. Evol. 2011, 26, 249–259. [Google Scholar] [CrossRef] [PubMed]
  83. Burrows, M.T.; Schoeman, D.S.; Buckley, L.B.; Moore, P.; Poloczanska, E.S.; Brander, K.M.; Brown, C.; Bruno, J.F.; Duarte, C.M.; Halpern, B.S.; et al. The Pace of Shifting Climate in Marine and Terrestrial Ecosystems. Science 2011, 334, 652–655. [Google Scholar] [CrossRef] [Green Version]
  84. Alkhalifah, D.H.M.; Damra, E.; Melhem, M.B.; Hozzein, W.N. Fungus under a Changing Climate: Modeling the Current and Future Global Distribution of Fusarium Oxysporum Using Geographical Information System Data. Microorganisms 2023, 11, 468. [Google Scholar] [CrossRef]
  85. Lee, J.-Y.; Marotzke, J.; Bala, G.; Cao, L.; Corti, S.; Dunne, J.P.; Engelbrecht, F.; Fischer, E.; Fyfe, J.C.; Jones, C.; et al. Future Global Climate: Scenario-Based Projections and Near-Term Information; Masson-Delmotte, V., Zhai, P., Pirani, A., Connors, S.L., Pean, C., Berger, S., Caud, N., Chen, Y., Goldfarb, L., Gomis, M.I., et al., Eds.; IPCC: Genf, Switzerland, 2021; pp. 1–195. [Google Scholar] [CrossRef]
  86. Held, I.M.; Soden, B.J. Robust Responses of the Hydrological Cycle to Global Warming. J. Clim. 2006, 19, 5686–5699. [Google Scholar] [CrossRef]
  87. Silén, M.; Svantesson, M.; Kjellström, S.; Sidenvall, B.; Christensson, L. Moral Distress and Ethical Climate in a Swedish Nursing Context: Perceptions and Instrument Usability. J. Clin. Nurs. 2011, 20, 3483–3493. [Google Scholar] [CrossRef]
  88. Witt, M.J.; Hawkes, L.A.; Godfrey, M.H.; Godley, B.J.; Broderick, A.C. Predicting the Impacts of Climate Change on a Globally Distributed Species: The Case of the Loggerhead Turtle. J. Exp. Biol. 2010, 213, 901–911. [Google Scholar] [CrossRef] [Green Version]
  89. Abram, N.J.; Henley, B.J.; Sen Gupta, A.; Lippmann, T.J.R.; Clarke, H.; Dowdy, A.J.; Sharples, J.J.; Nolan, R.H.; Zhang, T.; Wooster, M.J.; et al. Connections of Climate Change and Variability to Large and Extreme Forest Fires in Southeast Australia. Commun. Earth Environ. 2021, 2, 8. [Google Scholar] [CrossRef]
  90. Du, Y.; Zhao, Q.; Chen, L.; Yao, X.; Zhang, W.; Zhang, B.; Xie, F. Effect of Drought Stress on Sugar Metabolism in Leaves and Roots of Soybean Seedlings. Plant Physiol. Biochem. 2020, 146, 1–12. [Google Scholar] [CrossRef]
  91. Agan, A.; Solheim, H.; Adamson, K.; Hietala, A.M.; Tedersoo, L.; Drenkhan, R. Seasonal Dynamics of Fungi Associated with Healthy and Diseased Pinus Sylvestris Needles in Northern Europe. Microorganisms 2021, 9, 1757. [Google Scholar] [CrossRef] [PubMed]
  92. Sanz-Ros, A.V.; Müller, M.M.; San Martín, R.; Diez, J.J. Fungal Endophytic Communities on Twigs of Fast and Slow Growing Scots Pine (Pinus sylvestris L.) in Northern Spain. Fungal Biol. 2015, 119, 870–883. [Google Scholar] [CrossRef] [PubMed]
  93. Zamora, P.; Martínez-Ruiz, C.; Diez, J. Fungi in Needles and Twigs of Pine Plantations from Northern Spain. Fungal Divers. 2008, 30, 171–184. [Google Scholar]
  94. Botella, L.; Santamaría, O.; Diez, J.J. Fungi Associated with the Decline of Pinus Halepensis in Spain. Fungal Divers. 2010, 40, 1–11. [Google Scholar] [CrossRef]
  95. Hyde, K.D.; Jones, E.B.G.; Liu, J.-K.; Ariyawansa, H.; Boehm, E.; Boonmee, S.; Braun, U.; Chomnunti, P.; Crous, P.W.; Dai, D.-Q.; et al. Families of Dothideomycetes: In Loving Memory of Majorie Phyllis Hyde (Affectionately Known as Mum or Marj), 29 August 1921–18 January 2013—Without Mum’s Determination, a Character Passed on to Children, This Treatise Would Never Have Been Completed—K.D. Hyde. Fungal Divers. 2013, 63, 1–313. [Google Scholar] [CrossRef]
  96. Taylor, J.W.; Hann-Soden, C.; Branco, S.; Sylvain, I.; Ellison, C.E. Clonal Reproduction in Fungi. Proc. Natl. Acad. Sci. USA 2015, 112, 8901–8908. [Google Scholar] [CrossRef] [PubMed]
  97. Wang, X.; Zhao, F.; Wu, Y. Increased Response of Vegetation to Soil Moisture in the Northern Hemisphere Drylands. Front. Earth Sci. 2023, 11, 1144410. [Google Scholar] [CrossRef]
  98. Murgia, M.; Fiamma, M.; Barac, A.; Deligios, M.; Mazzarello, V.; Paglietti, B.; Cappuccinelli, P.; Al-Qahtani, A.; Squartini, A.; Rubino, S.; et al. Biodiversity of Fungi in Hot Desert Sands. MicrobiologyOpen 2019, 8, e00595. [Google Scholar] [CrossRef]
  99. Ruibal, C.; Gueidan, C.; Selbmann, L.; Gorbushina, A.A.; Crous, P.W.; Groenewald, J.Z.; Muggia, L.; Grube, M.; Isola, D.; Schoch, C.L.; et al. Phylogeny of Rock-Inhabiting Fungi Related to Dothideomycetes. Stud. Mycol. 2009, 64, 123–133. [Google Scholar] [CrossRef]
  100. Selbmann, L.; Egidi, E.; Isola, D.; Onofri, S.; Zucconi, L.; de Hoog, G.S.; Chinaglia, S.; Testa, L.; Tosi, S.; Balestrazzi, A.; et al. Biodiversity, Evolution and Adaptation of Fungi in Extreme Environments. Plant Biosyst.-An. Int. J. Deal. All Asp. Plant Biol. 2013, 147, 237–246. [Google Scholar] [CrossRef] [Green Version]
  101. Blaschke, H. Multiple Mycorrhizal Associations of Individual Calcicole Host Plants in the Alpine Grass-Heath Zone. Mycorrhiza 1991, 1, 31–34. [Google Scholar] [CrossRef]
  102. Hibbett, D.S.; Bauer, R.; Binder, M.; Giachini, A.J.; Hosaka, K.; Justo, A.; Larsson, E.; Larsson, K.H.; Lawrey, J.D.; Miettinen, O.; et al. 14 Agaricomycetes. In Systematics and Evolution: Part. A.; McLaughlin, D.J., Spatafora, J.W., Eds.; The Mycota; Springer: Berlin/Heidelberg, Germany, 2014; pp. 373–429. ISBN 978-3-642-55318-9. [Google Scholar]
  103. Clemmensen, K.E.; Bahr, A.; Ovaskainen, O.; Dahlberg, A.; Ekblad, A.; Wallander, H.; Stenlid, J.; Finlay, R.D.; Wardle, D.A.; Lindahl, B.D. Roots and Associated Fungi Drive Long-Term Carbon Sequestration in Boreal Forest. Science 2013, 339, 1615–1618. [Google Scholar] [CrossRef]
  104. Peay, K.G.; Baraloto, C.; Fine, P.V. Strong Coupling of Plant and Fungal Community Structure across Western Amazonian Rainforests. ISME J. 2013, 7, 1852–1861. [Google Scholar] [CrossRef]
  105. Rasmann, S.; Pellissier, L.; Defossez, E.; Jactel, H.; Kunstler, G. Climate-Driven Change in Plant–Insect Interactions along Elevation Gradients. Funct. Ecol. 2014, 28, 46–54. [Google Scholar] [CrossRef]
  106. Chen, C.; Wang, J.; Qiu, F.; Zhao, D. Resilient Distribution System by Microgrids Formation After Natural Disasters. IEEE Trans. Smart Grid 2016, 7, 958–966. [Google Scholar] [CrossRef]
  107. Johnston, S.R.; Hiscox, J.; Savoury, M.; Boddy, L.; Weightman, A.J. Highly Competitive Fungi Manipulate Bacterial Communities in Decomposing Beech Wood (Fagus sylvatica). FEMS Microbiol. Ecol. 2019, 95, fiy225. [Google Scholar] [CrossRef] [Green Version]
  108. Lazarević, J.; Menkis, A. Cytospora friesii and Sydowia polyspora are associated with the sudden dieback of Abies concolor in Southern Europe. Plant Prot. Sci. 2022, 58, 258–263. [Google Scholar] [CrossRef]
  109. Pan, Y.; Ye, H.; Lu, J.; Chen, P.; Zhou, X.D.; Qiao, M.; Yu, Z.F. Isolation and identification of Sydowia polyspora and its pathogenicity on Pinus yunnanensis in Southwestern China. J. Phytopathol. 2018, 166, 386–395. [Google Scholar] [CrossRef]
  110. Lynikienė, J.; Marčiulynienė, D.; Marčiulynas, A.; Gedminas, A.; Vaičiukynė, M.; Menkis, A. Managed and Unmanaged Pinus sylvestris Forest Stands Harbour Similar Diversity and Composition of the Phyllosphere and Soil Fungi. Microorganisms 2020, 8, 259. [Google Scholar] [CrossRef] [Green Version]
  111. Cleary, M.; Oskay, F.; Doğmuş, H.T.; Lehtijärvi, A.; Woodward, S.; Vettraino, A.M. Cryptic risks to forest biosecurity associated with the global movement of commercial seed. Forests 2019, 10, 459. [Google Scholar] [CrossRef] [Green Version]
  112. Ridout, M.; Newcombe, G. Sydowia polyspora is both a Foliar endophyte and a preemergent seed pathogen in Pinus ponderosa. Plant Dis. 2018, 102, 640–644. [Google Scholar] [CrossRef] [Green Version]
  113. Talgø, V.; Chastagner, G.; Thomsen, I.M.; Cech, T.; Riley, K.; Lange, K.; Klemsdal, S.S.; Stensvand, A. Sydowia polyspora associated with current season needle necrosis (CSNN) on true fir (Abies spp.). Fungal Biol. 2010, 114, 545–554. [Google Scholar] [CrossRef] [PubMed]
  114. Tinivella, F.; Dani, E.; Minuto, G.; Minuto, A. First report of Sydowia polyspora on Aleppo Pine (Pinus halepensis) in Italy. Plant Dis. 2014, 98, 281. [Google Scholar] [CrossRef]
  115. Sa’diyah, W.; Hashimoto, A.; Okada, G.; Ohkuma, M. Notes on Some Interesting Sporocarp-Inhabiting Fungi Isolated from Xylarialean Fungi in Japan. Diversity 2021, 13, 574. [Google Scholar] [CrossRef]
  116. Videira, S.I.R.; Groenewald, J.Z.; Braun, U.; Shin, H.D.; Crous, P.W. All that glitters is not Ramularia. Stud. Mycol. 2016, 83, 49–163. [Google Scholar] [CrossRef] [Green Version]
  117. Bakhshi, M.; Zare, R.; Jafary, H. Identification of Acrodontium luzulae and Ramularia coleosporii, two fungicolous fungi on Melampsora hypericorum, the causal agent of Hypericum androsaemum rust. Nova Hedwig. 2021, 113, 323–337. [Google Scholar] [CrossRef]
  118. Abbas, A.; Dobson, A.D.W. Yeasts and Molds|Penicillium camemberti. In Encyclopedia of Dairy Sciences, 2nd ed.; Fuquay, J.W., Ed.; Academic Press: San Diego, CA, USA, 2011; pp. 776–779. [Google Scholar] [CrossRef]
  119. Leclercq-Perlat, M.-N. Cheese|Camembert, Brie, and Related Varieties. In Encyclopedia of Dairy Sciences, 2nd ed.; Fuquay, J.W., Ed.; Academic Press: San Diego, CA, USA, 2011; pp. 773–782. [Google Scholar] [CrossRef] [Green Version]
  120. de Melo, M.; V Araujo, A.C.; N Chogi, M.A.; Duarte, I.C. Cellulolytic and lipolytic fungi isolated from soil and leaf litter samples from the Cerrado (Brazilian Savanna). Rev. Biol. Trop 2018, 66, 237–245. [Google Scholar] [CrossRef] [Green Version]
  121. Kolanlarli, T.K.; Ahmet, A.S.A.N.; Burhan, Ş.E.N.; ÖKTEN, S. Biodiversity of Penicillium species isolated from Edirne Söğütlük Forest soil (Turkey). J. Fungus Nisan 2019, 10, 26–39. [Google Scholar] [CrossRef]
  122. Povilaitienė, A.; Gedminas, A.; Varnagirytė-Kabašinskienė, I.; Marčiulynienė, D.; Marčiulynas, A.; Lynikienė, J.; Mishcherikova, V.; Menkis, A. Changes in Chemical Properties and Fungal Communities of Mineral Soil after Clear-Cutting and Reforestation of Scots Pine (Pinus sylvestris L.) Sites. Forests 2022, 13, 1780. [Google Scholar] [CrossRef]
  123. Szymańska, K.; Strumińska-Parulska, D. Atmospheric fallout impact on 210Po and 210Pb content in wild growing mushrooms. Environ. Sci. Pollut. Res. 2020, 27, 20800–20806. [Google Scholar] [CrossRef] [PubMed] [Green Version]
  124. Sun, Y.J.; Yu, P.Y.; Chen, J.Z.; Li, S.M.; Jiang, L.J. Effects of slippery jack (Suillus luteus) on the heavy metal accumulation and soil properties of masson’s pine (pinus massoniana lamb) in a mining area of china. Ecol. Environ. Res. 2020, 18, 3741–3755. [Google Scholar] [CrossRef]
  125. Krznaric, E.; Verbruggen, N.; Wevers, J.H.L.; Carleer, R.; Vangronsveld, J.; Colpaert, J.V. Cd-tolerant Suillus luteus: A fungal insurance for pines exposed to Cd. Environ. Pollut. 2009, 157, 1581–1588. [Google Scholar] [CrossRef]
  126. Luo, Z.; Wu, C.; Zhang, C.; Li, H.; Lipka, U.; Polle, A. The role of ectomycorrhizas in heavy metal stress tolerance of host plants. Environ. Exp. Bot. 2014, 108, 47–62. [Google Scholar] [CrossRef]
  127. Nartey, L.K.; Pu, Q.; Zhu, W.; Zhang, S.; Li, J.; Yao, Y.; Hu, X. Antagonistic and plant growth promotion effects of Mucor moelleri, a potential biocontrol agent. Microbiol. Res. 2022, 255, 126922. [Google Scholar] [CrossRef] [PubMed]
  128. Ruano-Rosa, D.; Mercado-Blanco, J. Combining Biocontrol Agents and Organics Amendments to Manage Soil-Borne Phytopathogens. In Organic Amendments and Soil Suppressiveness in Plant Disease Management; Meghvansi, M., Varma, A., Eds.; Soil Biology; Springer: Cham, Switzerland, 2015; Volume 46, pp. 457–478. [Google Scholar] [CrossRef]
  129. Walther, G.; Pawłowska, J.; Alastruey-Izquierdo, A.; Wrzosek, M.; Rodriguez-Tudela, J.L.; Dolatabadi, A.; Chakrabarti, S.; de Hoog, G.S. DNA barcoding in Mucorales: An inventory of biodiversity Persoonia. Pers.-Mol. Phylogeny Evol. Fungi 2013, 30, 11–47. [Google Scholar] [CrossRef] [PubMed] [Green Version]
Figure 1. The map of central and northern Europe showing the distribution of Pinus sylvestris and Picea abies sampling sites situated along ca. 2200 km-long latitudinal gradient. Capital letters indicate the country code as follows: SK—Slovakia, PL—Poland, LT—Lithuania, LV—Latvia, EE—Estonia, and FI—Finland. Study sites are numbered as in Table 1.
Jof 09 00829 g001
Figure 2. Rarefaction curves showing the relationship between the cumulative number of fungal OTUs and the number of fungal sequences from different substrates (needles, roots, shoots, and the soil) of Pinus sylvestris (A) and Picea abies (B).
Jof 09 00829 g002
Figure 3. Relative abundance of fungal classes (% of fungal sequences) associated with Pinus sylvestris and Picea abies. Sampling sites: 1 (Slovakia), 2–3 (Poland), 4–5 (Lithuania), 6 (Latvia), 7 (Estonia), and 8–12 (Finland) as presented in Figure 1. Fungal classes with a relative abundance of less than 2% are marked as other.
Jof 09 00829 g003
Figure 4. Diversity estimates: Chao1 richness index of fungal communities in different samples (needles, roots, shoots, and the soil) of P. sylvestris (A) and P. abies (B). The Shannon diversity index of fungal communities associated with P. sylvestris and P. abies (C). Sampling sites are as in Figure 1. Only corresponding samples (shown in the same color) were compared with each other. The same letter shows that values did not differ significantly from each other at p > 0.05.
Jof 09 00829 g004
Figure 5. A heatmap with dendrograms showing hierarchical clustering of the 30 most abundant fungal OTUs by site (rows) and the level of species co-occurrence (columns). (A) Pinus sylvestris; (B) Picea abies.
Jof 09 00829 g005
Figure 6. The linear regression model showing the effect of bioclimatic variables on the Chao1 richness index (A) and the Shannon diversity index (B) of fungal communities associated with P. sylvestris and P. abies (p < 0.05). The description of BIO variables is in Table 2.
Jof 09 00829 g006
Figure 7. Nonmetric multidimensional scaling (NMDS) plot of fungal communities, based on the Bray–Curtis dissimilarity matrix, derived from Pinus sylvestris and Picea abies samples: (A) needles, (B) shoots, (C) roots, (D) the rhizosphere soil. Vectors show bioclimatic variables, which had a significant effect on fungal community composition (p < 0.05). Bioclimatic variables, which are highly correlated (R > 0.8) among each other, are not shown in the diagram. The description of bioclimatic variables is in Table 2.
Jof 09 00829 g007
Figure 8. Redundancy analysis (RDA) showing the predicted changes in fungal communities associated with Pinus sylvestris under the CMIP6 [63] in different time periods: (A) 2019 vs. 2040; (B) 2019 vs. 2060; (C) 2019 vs. 2080; and (D) 2019 vs. 2100. Present (2019) (pink area): coordinates of sampling sites are shown by circles. The number near each circle indicates the study site: 1 (Slovakia—SK), 2–3 (Poland—PL), 4–5 (Lithuania—LT), 6 (Latvia—LV), 7 (Estonia—EE), 8–12 (Finland—FI), as presented in Figure 1. Future (blue area): expected coordinates of study sites are shown by triangles. The description of BIO parameters is in Table 2.
Jof 09 00829 g008
Figure 9. Redundancy analysis (RDA) showing the predicted changes in fungal communities associated with Picea abies under the CMIP6 [63] in different time periods: (A) 2019 vs. 2040; (B) 2019 vs. 2060; (C) 2019 vs. 2080; and (D) 2019 vs. 2100. Present (2019) (pink area): coordinates of study sites are shown by circles. The number near each circle indicates the study site: 1 (Slovakia—SK), 2–3 (Poland—PL), 4–5 (Lithuania—LT), 6 (Latvia—LV), 7 (Estonia—EE), 8–12 (Finland—FI), as presented in Figure 1. Future (blue area): expected coordinates of study sites are shown by triangles. The description of BIO parameters is in Table 2.
Jof 09 00829 g009
Table 1. Pinus sylvestris and Picea abies sampling sites and samples collected.
Site no.CountryLatitudeLongitudeHabitat/
Vegetation Type *
Tree Age, ySample Size, Units
NeedlesShootsRootsSoil
Pinus sylvestris
1Slovakia49.1282821.52911Nb/vm801010510
2Poland51.1467822.51703Nc/ox701010510
3Poland52.7749223.08233Nc/ox501010510
4Lithuania54.4218324.95956Lbl/m651010510
5Lithuania56.0558925.70758Nbl/vm701010510
6Latvia57.5745324.43836Nb/vm901010510
7Estonia59.1283124.42283Nb/vm701010510
8Finland60.8699425.53239Nb/vm601010510
9Finland62.8859425.82100Nc/hox701010510
10Finland64.7136425.57986Nb/vm601010510
11Finland66.3757225.21342Na/v801010510
12Finland67.8026926.78244Lb/m601010510
Total P. sylvestris12012060120
Picea abies
1Slovakia49.2210321.57144Nc/ox301010510
2Poland50.9391722.30369Nc/hox601010510
3Poland52.7681123.07808Lc/mox501010510
4Lithuania54.4210624.95953Lcp/mox601010510
5Lithuania56.0534223.67956Ncl/ox681010510
6Latvia57.6017224.40689Lc/mox701010510
7Estonia59.1283124.42283Nc/hox601010510
8Finland60.8696125.53197Nc/ox501010510
9Finland62.9041125.80914Lc/mox601010510
10Finland64.7139425.57769Nb/vm501010510
11Finland66.3771925.27164Lc/mox601010510
12Finland67.7623126.76128Pc/fils701010510
Total P. abies12012060120
* Soil topology: N—normal water availability; L—temporary water-logged soils; P—wetlands. b: poor fertility; c: moderate fertility; d: high fertility. l: light soil texture; s: heavy soils; p: binary soils [51]. Vegetation type: ox—oxalidosum, oxn—oxalido-nemoroso-piceetum, m—myrtillosum, mox—myrtillo-oxalidosum, v—vacciniosum, hox—hepatico-oxalidosum, fils—filipendulo-mixtoherbosum [52].
Table 2. Codes of bioclimatic variables according to WordClim database (version 2.0, http://worldclim.org/version2, accessed 10 November 2021) [50].
CodeBioclimatic Variable
BIO1Annual mean temperature
BIO2Mean diurnal range (mean of monthly, maximum temperature—minimum temperature)
BIO3Isothermality (BIO2/NIO7) (×100)
BIO4Temperature seasonality (standard deviation ×100)
BIO5Maximum temperature of warmest month
BIO6Minimum temperature of coldest month
BIO7Temperature annual range (BIO5-BIO6)
BIO8Mean temperature of wettest quarter
BIO9Mean temperature of driest quarter
BIO10Mean temperature of warmest quarter
BIO11Mean temperature of coldest quarter
BIO12Annual precipitation
BIO13Precipitation of wettest month
BIO14Precipitation of driest month
BIO15Precipitation seasonality (coefficient of variation)
BIO16Precipitation of wettest quarter
BIO17Precipitation of driest quarter
BIO18Precipitation of warmest quarter
BIO19Precipitation of coldest quarter
Table 3. Relative abundance of the 20 most common fungal OTUs sequenced from needle, shoot, root, and soil samples of Pinus sylvestris. The data from different sites are combined.
PhylumReference SequenceSpecies NameSimilarity, %Needles, %Shoots, %Roots, %Soil, %All, %
AscomycotaMK762617Sydowia polyspora1003.8615.580.622.355.84
AscomycotaKX287273Acrodontium luzulae1000.310.227.0011.875.04
AscomycotaMT236531Unidentified sp. 5210_499-0.0037.070.042.65
AscomycotaMG828280Unidentified sp. 5210_5830.080.096.410.152.46
AscomycotaKP891398Unidentified sp. 5208_11000.586.17-0.111.93
BasidiomycotaMG597398Mycena septentrionalis1000.030.005.050.041.90
AscomycotaKP897305Unidentified sp. 5210_121007.002.990.080.121.88
AscomycotaJX536159Gymnopus dryophilus100-0.014.720.011.77
ZygomycotaMT242128Unidentified sp. 5210_21000.230.014.380.021.67
AscomycotaMG827987Unidentified sp. 5210_999--3.390.411.35
AscomycotaKY660851Phyllactinia fraxini1000.513.930.010.051.25
AscomycotaUDB0754226Unidentified sp. 5208_171000.663.13-0.091.04
AscomycotaLR876918Unidentified sp. 5210_71003.060.950.430.751.00
AscomycotaMN902367Unidentified sp. 5208_21001.462.560.0030.201.00
AscomycotaUDB0754118Unidentified sp. 5210_3091--2.56-0.95
AscomycotaMH248043Archaeorhizomyces sp. 5208_01000.300.440.353.160.92
BasidiomycotaKT275603Tomentella sp. 5210_8991.400.750.471.470.87
AscomycotaUDB028437Coniothyrium olivaceum1000.800.571.340.070.79
BasidiomycotaUDB018458Tomentella sp. 5210_21100-0.0032.080.010.78
ZygomycotaMN395040Kwoniella sp. 5210_1899--0.023.870.77
All20.2637.3945.9724.8235.84
Table 4. Relative abundance of the 20 most common fungal OTUs sequenced from needle, shoot, root, and soil samples of Picea abies. The data from different sites are combined.
PhylumReference NumberSpecies NameSimilarity, %Needles, %Shoots, %Roots, %Soil, %All, %
AscomycotaMK762617Sydowia polyspora10049.6612.260.220.3811.48
AscomycotaMT355566Penicillium camemberti1000.060.031.9312.864.56
ZygomycotaMT242128Unidentified sp. 5210_2100-0.0815.860.243.18
AscomycotaKU059580Suillus luteus990.886.710.030.052.42
BasidiomycotaMN902821Unidentified sp. 5208_24100---6.282.03
AscomycotaLR876918Unidentified sp. 5210_71001.793.520.570.381.68
BasidiomycotaMG597398Mycena septentrionalis1000.030.017.060.601.57
AscomycotaMK390491Mucor moelleri1000.013.930.020.011.34
AscomycotaUDB035461 Mycosylva clarkii990.030.001.882.621.22
AscomycotaMG828280Unidentified sp. 5210_5830.110.065.030.341.12
AscomycotaMN902647Unidentified sp. 5210_17960.010.003.091.461.07
AscomycotaMH248043Archaeorhizomyces sp. 5208_01000.260.050.312.600.96
AscomycotaMT595563Cladophialophora sp. 5210_29990.302.630.020.010.94
AscomycotaMG679813Russula badia1000.492.380.020.070.90
AscomycotaMT236513Unidentified sp. 5210_3998---2.650.86
AscomycotaLS450480Unidentified sp. 5210_19980.010.011.491.710.85
AscomycotaON963481Leptodontidium sp. 5210_31991.261.800.010.140.84
AscomycotaMG827987Unidentified sp. 5210_999--4.290.010.83
BasidiomycotaLR874260Piloderma lanatum100---2.520.81
BasidiomycotaKT275603Tomentella sp. 5210_8991.320.450.421.100.78
All56.2133.9242.2436.0439.43
Table 5. Biodiversity metrics in the study sites.
Site
No.
Tree
Species
NeedlesRootsShootsSoil
No. of
Fungal OTUs
No. of
Fungal Sequences
Shannon Diversity
Index
No. of Fungal OTUsNo. of
Fungal Sequences
Shannon Diversity
Index
No. of
Fungal OTUs
No. of
Fungal Sequences
Shannon Diversity
Index
No. of
Fungal OTUs
No. of
Fungal Sequences
Shannon
Diversity Index
1P. abies1779564.30631733.7623520394.5230440793.73
2 2188190.0911515292.9617820533.8320322063.36
3 14987241518552712.7116711444.0111443361.27
4 1004233.875512052.5617820434.1221368162.98
5 15516604.1517882.0021743554.1534911,5194.31
6 16915423.697710322.9024534684.35--0.69
7 853783.8113224163.2318615863.7719217433.66
8 19712313.6012019132.4023635314.0715717523.22
9 918733.0516025252.6726444463.3029158643.80
10 16610892.3310220193.4426755263.901046854.47
11 782571.8916226574.0314068103.7924514603.86
12 12163.6718535283.4415755484.65621933.69
Total P. abies75218,1163.3875324,356 4.42109442,5494.97140840,653 5.07
1P. sylvestris16118123.8014942113.201196513.7320814263.61
2 928333.5617550872.7036633.3027924433.85
3 1138003.6012257642.4018418334.0718122763.21
4 927753.564510502.5717654623.512884534461
5 13121873.08252582.0819648293.7221527344.42
6 20826953.6413714723.5725016894.60 - - -
7 1456734.1213939712.8418316643.8418111913.54
8 705544.3112126543.7410343364.5217116103.98
9 13613294.1519128772.691078504.02841984.05
10 885450.0915325382.9120127763.811207383.36
11 955202.3519453311.0111024513.01211203.71
12 1179442.2116030124.1311738634.279828064.49
Total P. sylvestris73113,6674.9486338,225 4.5285530,467 4.63114220,0785.29
Disclaimer/Publisher’s Note: The statements, opinions and data contained in all publications are solely those of the individual author(s) and contributor(s) and not of MDPI and/or the editor(s). MDPI and/or the editor(s) disclaim responsibility for any injury to people or property resulting from any ideas, methods, instructions or products referred to in the content.

