Abstract
Botrytis cinerea is a ubiquitous necrotrophic pathogen causing grey mould in economically important crops. Light effect in horticulture is undeniable and fungi also react to light. Selected specific light-emitting diodes (LEDs) and photoperiods can be used for fungal pathogen inhibition. This study aimed to evaluate how LED light wavelengths and photoperiods affect the growth parameters of B. cinerea. The morphological (mycelium appearance, sclerotia distribution) and phenotypic (conidia presence and size, mycelium growth rate, recovery) characteristics of the fungal pathogen B. cinerea were evaluated under royal blue 455 nm, blue 470 nm, cyan 505 nm, yellow 590 nm, and red 627 nm LED lights at various photoperiods (4, 8, 12, 16, 20, 24 h). The results revealed that the light conditions and photoperiods influenced the B. cinerea morphological and phenotypic characteristics. Overall, the highest B. cinerea inhibition was under yellow (590 nm) LED light at 4 and 8 h photoperiods. Conidia did not form under blue 455 nm at 8, 16, 20, and 24 h photoperiods. Therefore, it can be assumed that the phenotypic and morphological features of B. cinerea depend on the specific photoperiod and LED light wavelength. The results allowed an exploration of original research approaches, raised new scientific questions for further investigation, and suggested new green plant protection solutions.
1. Introduction
Botrytis cinerea Pers.: Fr., which causes grey mould, is an important plant pathogen with a significant impact on a broad range of plants and yield rots as well as decreasing postharvest qualities [1,2,3,4]. B. cinerea is a necrotrophic fungal pathogen that infects more than 596 various plant genera. It infects plants, causing grey mould, and infects various plant parts such as the flowers, petioles, fruit, leaves, and stems and often starts early as blossom blight. Frequently, the pathogen is invisible until fruit softness during ripening. B. cinerea, as a broad host range pathogen, causes pre- and postharvest losses [1,5,6]. Botrytis spp. causes losses, depending on the pathogen development after harvest, through the entire postharvest chain [2]. The annual economic losses of vegetables and fresh fruit caused by B. cinerea range from USD 10 billion to USD 100 billion worldwide. B. cinerea is considered to be the second most important plant pathogen [3].
Food production contamination is a serious problem and essential to humans. Due to unsafe food, many people become sick. This problem originates from various sources such as phytotoxins, chemical pesticides, food processing chemicals, and others [7]. Chemical pesticide residues as contaminants are present in food production in higher than safe concentrations [8,9,10]. However, in agriculture, conventional chemical fungicides are used for disease control. Plant diseases are controlled by routine applications with intervals of 7–21 days (depending on the pesticide) from the leaf emergence until harvest [1,11]. In addition, chemical pesticides negatively affect the environment and beneficial organisms as well as polluting water, soil, and food and affect animal and human health. Furthermore, the overuse of chemicals induces pathogen resistance, which emerges due to frequent pesticide use [6,8,9,12,13].
The EU directive 2009/128/EC and Green Deal has led to the sustainable use of pesticides. Researchers all over the world are looking for more sustainable, innovative ways to control plant pathogens. Therefore, future plant protection should be based on the integrated control of harmful organisms whilst prioritising the least harmful methods to humans and the environment [14,15,16,17,18]. It has been reported that various physical, chemical, and biological (bio-fungicides, plant extracts, etc.) strategies have been applied to prolong and maintain the shelf-life of horticultural crops [14,15,16,18,19].
The role of visible light in agriculture and horticulture is undeniable, as light is a source of energy and induces photosynthesis, which is crucial for plant growth and development. Supplemental lighting may prolong the cropping season and leads to nutritional quality improvement, nitrate concentration decrease, yield quality increase, and other parameters of plants grown in a closed environment agriculture [20,21,22,23]. Light also influences fungi and it controls the physiological and morphological responses. Fungi can sense light using up to 11 photoreceptors. Additionally, light signalling could be linked with the metabolic pathway, sporulation, or secondary metabolites production [24]. B. cinerea also has photoreceptors and reacts to light. The asexual and sexual development of B. cinerea depend on light illumination [25]. Light affects mycelial growth, conidiation, and sclerotia formation [3,25]. Over traditional light-emitting diode (LED) use, the specific wavelengths are targeted to plant pathogen control [14,16,19]. A literature review shows that blue LED light could suppress the germination and sporulation of Botrytis spp., Phomopsis spp., Aspergillus spp., and Penicillium spp. and far-red, blue, and red inhibit Aspergillus spp. and other pathogens [12,13,26,27]. Red LED enhanced a resistance to S. fuliginea in cucumbers [28]. Red, blue, and green LED lights can induce a systemic resistance to fungal pathogens [14]. It has been reported that blue LED suppresses B. cinerea, and 50–150 μ mol m−2 s−1 blue LED induced B. cinerea resistance in tomatoes [12]. However, it raises the question about the intensity and duration (photoperiod) of the light. It has been reported that 12 h and 24 h blue LED exposure reduced P. digitatum [27]. A cycle of 12 h of blue LED followed by a 12 h dark period per day effectively reduced P. digitatum mycelium [29]. Blue (450–460 nm) and purple (400–410 nm) lights inhibited B. cinerea mycelium at a 12 h photoperiod [30].
Previous studies reported that LED light influences plants and pathogens. There are many reports on the effects of blue light but there is a lack of other light spectra. Additionally, there is a lack of a direct impact on B. cinerea. Therefore, we assumed that a specific LED light spectrum could suppress or stimulate plant pathogens. Not all studies evaluated the morphological and phenotypical characteristics of B. cinerea, which could be related to the ability of the pathogen to spread and infect plant tissues. Therefore, this study aims to evaluate how monochromatic LED light wavelengths and photoperiods affect the growth parameters of B. cinerea in vitro.
2. Materials and Methods
The research was conducted at the Lithuanian Research Centre for Agriculture and Forestry Institute of Horticulture (LAMMC IH) Laboratory of Plant Physiology under controlled environment conditions in 2018 and 2019.
2.1. Fungal Isolate
The B. cinerea LT13B_FRA_76 isolate used in this study was from the LAMMC IH Laboratory of Plant Protection isolate collection. B. cinerea from rotten strawberry fruit was morphologically identified and verified by a species-specific PCR, according to [4]. The single-spore isolates were cultivated on potato dextrose agar (PDA) (Liofilchem, Roseto degli Abruzzi, Italy).
2.2. Light Treatments
The light sources were five monochromatic LED light arrays: royal blue 455 nm (LXHL-LR3C), blue 470 nm (LXHL-LB3C), cyan 505 nm (LXHL-LE3C), yellow 590 nm (LXHL-LL3C), and red 627 nm (LXHL-LD3C) (Philips Lumileds Lighting Company, San Jose, CA, USA). The distance between the fungal samples and light sources was adjusted to the photosynthetic photon flux density (PPFD) of 20 ± 2 μ/mol m−2 s−1. The light intensity was measured by a photometer-radiometer RF-100 (Sonopan, Bialystok, Poland).
2.3. B. cinerea Cultivation Parameters
The isolates were cultivated on PDA to investigate the morphological and phenotypic characteristics of B. cinerea under different LED lights and photoperiods. Isolate plugs of 7 mm diameter, mycelium side-down, were inoculated in the centre of Petri dishes. The inoculated Petri were assigned to different LED light wavelengths and 4, 8, 12, 16, 20, and 24 h photoperiods in closed, controlled environment growth chambers at 22 ± 2 °C for 7 days. The relative air humidity was 60–70%. The control plates with the pathogens were in complete darkness. There were four replicates per treatment. The experiment was repeated twice.
2.4. Evaluation of the Morphological and Phenotypic Characteristics
B. cinerea was investigated for morphological (mycelium appearance, sclerotia distribution) and phenotypic (conidia presence and size, mycelium growth rate) characteristics.
The mycelium growth rates were determined by measuring the colony diameter (mm) of the isolates daily for seven days after inoculation (1–7 DAI), as described [31]. Four Petri plates were used per treatment (wavelength × photoperiod). The mycelium growth rates (mm day−1) were calculated as an average length and width increase per day. The mycelium growth rate was used to calculate the mycelial growth inhibition (MGI) [32], as follows:
where C is the diameter of the pathogen mycelium growth rate in the control, mm, and T is the diameter of the pathogen mycelium growth rate in treatment, mm.
The mycelial growth curve (AUMGC) was calculated [33]:
where yi = mean mycelium diameter in the four observations, mm, dti = the interval between the evaluations, and n = the evaluation period.
The mycelium appearance, sclerotia distribution, conidia presence, and size (width and length) were evaluated after 7 DAI. Conidia were evaluated at the edge of the Petri. The evaluation of conidia was carried out on microscope slides with a Nikon Eclipse 80i microscope of 40 × magnification. Conidia were evaluated for presence, length (μm), and width (μm). A six-point scale was used to assess the mycelium appearance and sclerotia distribution: M1—mycelium without conidia; M2—mycelium with conidia; M3—mycelium masses; M4—thick mycelium; S0—no sclerotia; S1—sclerotia at the edge of the Petri; S2—arranged in circles; S3—large and irregular; and S4—small [34].
To evaluate the recovery after different LED light illuminations and photoperiods, the re-isolation was conducted after 7 DAI. The growth (mm) rate of the re-isolated fungi mycelium was measured after 48 h.
2.5. Statistical Analysis
SAS Enterprise Guide version 7.1 (SAS Inc., Cary, NC, USA) was used for the statistical analysis. An ANOVA and Duncan’s multiple range test (p < 0.05) were used to compare the obtained means. Conidia size and re-isolation data were expressed as mean ± standard deviation.
3. Results
The B. cinerea isolates exposed to different LED light wavelengths and photoperiods showed differences in the morphological and phenotypic characteristics (Figure 1, Figure S1, Table 1, Table 2 and Table 3). The plugs on the plates were exposed to different LED light wavelengths at a 20 ± 2 μ/mol m−2 s−1 PPFD intensity.
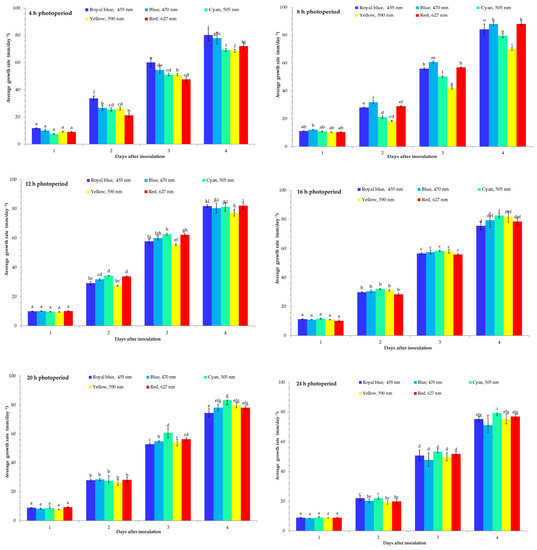
Figure 1.
The average mycelium growth rate of illuminated Botrytis cinerea under 4, 8, 12, 16, 20, and 24 h photoperiods and different wavelengths. All values in the figure are expressed as mean ± standard error (n = 4). Means with different letters are significantly different at the p < 0.05 level according to Duncan’s multiple range test.

Table 1.
The mycelial growth curve (AUMGC) of Botrytis cinerea under different wavelengths and photoperiods.
Table 2.
Comparison of the average conidia size of Botrytis cinerea after illumination by various LED light wavelengths and photoperiods.
Table 3.
The phenotypic classification of Botrytis cinerea after illumination by various LED light wavelengths and photoperiods.
The light conditions influenced the B. cinerea mycelium growth rate and it was different for each wavelength (Figure 1, Figure S1). The results demonstrated that at a 4 h photoperiod, B. cinerea acted differently under different wavelengths. The lowest mycelium growth after 1 DAI was under a cyan (505 nm) LED light and after 2–3 DAI under a red (627 nm) LED light; however, at 4 DAI it was lowest under a yellow (590 nm) LED light compared with the other treatments. In addition, the highest B. cinerea mycelium growth rate was observed under a royal blue (455 nm) LED light after 1–4 DAI of incubation (Figure 1). The highest inhibition against the B. cinerea mycelium growth had a yellow (590 nm) LED light after 4 DAI. The MGI of the B. cinerea mycelium growth under illumination at different wavelengths reached only 6.3% with a yellow LED light after 4 DAI. The MGI inhibition of B. cinerea mycelium growth of the cyan (505 nm) LED light treatment was 5.5%.
The results showed that at an 8 h photoperiod, a blue (470 nm) LED light increased B. cinerea mycelium growth after 1–4 DAI. However, at an 8 h photoperiod, the B. cinerea mycelium diameter was the lowest under a yellow (590 nm) LED light after 1–4 DAI. The MGI of B. cinerea for the yellow (590 nm) LED light was 0%. The B. cinerea mycelium acted similarly at a 12 h photoperiod. The highest inhibition at a 12 h photoperiod against the B. cinerea mycelium growth was a yellow (590 nm) LED light at 1–4 DAI (Figure 1). However, the red (627 nm) LED light treatments increased the mycelium growth at 4 DAI. The lowest mycelium growth rate was under the red (627 nm) LED light after 1–3 DAI (Figure 1). However, at 4 DAI, the highest inhibition of B. cinerea mycelium growth had a royal blue (455 nm) LED light. Cyan (505 nm) increased the B. cinerea mycelium growth after 1–4 DAI. The MGI inhibition rate under royal blue reached only 5.3% and red 1.6%. Under a 20 h photoperiod, the radial growth of B. cinerea was similar to that under 16 h. The mycelium growth rate was lowest under yellow at 1–2 DAI. However, the highest inhibition of mycelium growth was observed under royal blue (455 nm) at a 20 h photoperiod at 3–4 DAI. The highest mycelium growth was observed under cyan (505 nm) at 4 DAI. The MGI inhibition rate due to the royal blue (455 nm) LED light treatment was low at 5.5%. However, the fungus acted differently at a 24 h photoperiod (Figure 1). The highest inhibition of the B. cinerea mycelium growth rate was observed in the blue (470 nm) LED light at 1–4 DAI. The highest mycelium growth was observed in the cyan (505 nm) LED light at 1–4 DAI. However, the MGI inhibition rate due to the blue (470 nm) LED light treatment was low.
Various wavelengths slightly reduced the mycelial growth curve (AUMGC) of the B. cinerea at different photoperiods (Table 1). For example, B. cinerea at the 4 h photoperiod under the red (627 nm) LED light reduced the AUMGC by 18.9%; at an 8 h photoperiod under the yellow (590 nm) LED light, the AUMGC was 17.8%. Additionally, at a 12 h photoperiod, B. cinerea reduced the AUMGC by 21.3% under the yellow (590 nm) LED light. However, under the 16 h photoperiod, B. cinerea reduced the AUMGC under the red (627 nm) LED light by 21.7%. B. cinerea was reduced by the royal blue (455 nm) LED light by 20.6% of the AUMGC compared with the other wavelengths. B. cinerea under the blue (470 nm) LED light was reduced by 18.6% of the AUMGC.
B. cinerea demonstrated a conidia size variation under the various LED light wavelengths and photoperiods (Table 2). The conidial dimensions differed among the isolates under the different photoperiods, ranging from 6.4 to 7.9 μm in width and 8.3 to 12.2 μm in length. The results revealed that the B. cinerea conidia width at the 4 h photoperiod was the smallest under the cyan (505 nm) LED light and the largest under the red (627 nm) LED light. However, the length of the conidia was smallest under the royal blue (455 nm) LED light and the largest under the red (627 nm) LED light at a 4 h photoperiod. Additionally, under the 8 h photoperiod, conidia were absent under the royal blue (455 nm). However, the largest width was under the blue (470 nm) and length was under the cyan (505 nm) LED light. At a 12 h photoperiod, conidia were absent under the blue (470 nm) LED light. The diameter of the royal blue (455 nm) conidia was the largest at 7.9 μm in width and under the red (627 nm) at 12.2 μm in length. However, at a 16 h photoperiod, the width of the conidia was absent under the royal blue (455 nm) and blue (470 nm) LED lights. The highest conidia width and length at a 16 h photoperiod was with the yellow (590 nm) LED light at 6.4 × 10.2 μm. Conidia were absent at the 20 h photoperiod under the royal blue (455 nm) and cyan (505 nm) LED lights. The highest width and length were at the red (627 nm) LED light of 7.3 × 11.2 μm. Conidia at the 24 h photoperiod was absent under the royal blue (455 nm), blue (470 nm) and cyan (505 nm) LED lights. The conidia dimension was the largest in width under the yellow (590 nm) (7.3 μm) and red (627 nm) LED lights in length (9.4 μm) at a 24 h photoperiod.
The morphological distribution among the different wavelengths and photoperiods was evaluated after 7 DAI. B. cinerea was categorised into groups by the mycelium appearance and sclerotia distribution under the different photoperiods and LED light wavelengths (Table 3). The B. cinerea isolates were grouped according to the mycelium appearance and sclerotia distribution under the light treatments and photoperiods.
Two groups of mycelia were defined based on their mycelium appearance and five groups of sclerotia distribution. The mycelium appearance varied under all photoperiods. The mycelium varied from mycelium without conidia (M1) to mycelium with conidia (M2). The mycelium appearance at the 4 h photoperiod under all monochromatic LED lights was identified with conidia (M2).
The sclerotia distribution also varied among the different photoperiods and LED light wavelengths. The sclerotia varied from no sclerotia, sclerotia in the edge of the Petri, arranged in circles, or large irregular and small sclerotia. The results demonstrated that a 4 h photoperiod influenced the sclerotia differences. The sclerotia under royal blue (455 nm) were in the edge of the Petri (S1), blue (470 nm) and yellow (590 nm) were large and irregular (S3), red (627 nm) was arranged in circles (S2), and there were no sclerotia (S0) under cyan (505 nm). The 8 h photoperiod gave a lower variation under the different wavelengths. The sclerotia under royal blue (455 nm) were arranged in circles (S2); however, blue (470 nm) and red (627 nm) were at the edge of the Petri (S1). Under cyan (505 nm) and yellow (590 nm), the sclerotia were large and irregular (S3) at the 8 h photoperiod.
Additionally, the sclerotia distribution under the 12 h photoperiod varied between the wavelengths. The obtained results of the sclerotia distribution showed that royal blue (455 nm) and cyan (505 nm) were large and irregular (S3) and yellow (590 nm) and red (627 nm) LED lights were small (S4); however, under the blue (470 nm) LED light, there were no sclerotia (S0). The 16 h photoperiod also influenced the sclerotia differences. The sclerotia under the royal blue (455 nm) LED light was at the edge of the Petri (S1). Under cyan (505 nm), yellow (590 nm), and red (627 nm) LED light, the sclerotia were large and irregular (S3). Under the blue (470 nm) LED light there were no sclerotia (S0). The results showed that there were no sclerotia (S0) under all wavelengths at the 20 h photoperiod. The sclerotia under the royal blue (455 nm) LED light were arranged in circles (S2) at the 24 h photoperiod. However, under the blue (470 nm) and red (627 nm) LED lights, there were no sclerotia (S0); cyan (505 nm) and yellow (590 nm) were at the edge of the Petri (S1).
The re-isolation was performed after 7 DAI to determine the recovery of B. cinerea after illumination under different wavelengths (Table 4). The obtained data indicated that at the 4 h photoperiod under blue, the recovery was slower compared with the other wavelengths. B. cinerea under royal blue recovered faster than other LED lights. However, at the 8 h photoperiod, the slowest recovery was observed under the red (627 nm) and faster under the royal blue (455 nm) LED light. At a 12 h photoperiod under a blue (470 nm) and a red (627 nm) LED light, the recovery was slower compared with others.
Table 4.
The average recovery of the Botrytis cinerea growth rate after illumination by various LED light wavelengths and photoperiods.
Moreover, under a royal blue (455 nm) LED light, B. cinerea recovered faster at a 12 h photoperiod. At a 16 h photoperiod under a royal blue (455 nm) LED light, the fungus recovered and under a yellow (590 nm) LED light, recovery was slower than under other wavelengths. However, at a 20 h photoperiod under a yellow (590 nm) LED light, B. cinerea recovered faster; under the blue (470 nm) LED light, it was slower. The results showed that at a 24 h photoperiod, the recovery was opposite to the 20 h photoperiod. The slowest recovery was under the yellow (590 nm) LED light and fastest under the blue (470 nm) LED light.
4. Discussion
An LED light could serve as an environmentally friendly tool in controlled environment conditions. LED light technology allows the selection of a specific light spectrum and photoperiod to prevent food crop damage by pathogens. The inhibitory effect of different LED light wavelengths and photoperiods on the morphological and phenotypic characteristics of the fungus could be related to the ability of the pathogen to spread and infect plant tissues. Therefore, it was substantial to evaluate the LED light and photoperiod effects on B. cinerea. We evaluated how different LED light wavelengths and photoperiods affected the phenotypic and morphological features of B. cinerea.
Literature research has shown only an effect on only one specific photoperiod or wavelength but not more complex than our research [27,30,35,36]. There is a theory that fungi may use light combined with the circadian clock to adapt to stress and produce reproductive structures at the right time and place [24]. In this study, we observed that B. cinerea acted differently under different photoperiods and LED light wavelengths.
Recently, light effects on fungi growth, development, inhibition, and reduction have been reported. For example, the impact of light quality rose Podosphaera pannosa growth and development [36]. On the other hand, a light–dark regime or a continuous blue light (40 μmol·m−2·s−1) reduced the mycelium growth of P. italicum and P. citri [27]. Our results showed that B. cinerea mycelium grew under different photoperiods and wavelengths; however, there were differences in the morphological and phenotypic characteristics. Certain wavelengths and photoperiods can inhibit or increase mycelium growth.
Overall, our data showed that the highest B. cinerea inhibition was under a yellow (590 nm) LED light at a 4 h photoperiod. The 8 and 12 h photoperiods also showed a high inhibition under a yellow (590 nm) LED light at 4 DAI. The 24 h photoperiod inhibited B. cinerea mycelium growth under a blue (470 nm) LED light at 3–4 DAI. However, the mycelium growth was increased under a royal blue (455 nm) LED light at a 4 h photoperiod and a blue (470 nm) light at an 8 h photoperiod after 4 DAI. Additionally, the mycelium growth increased under the blue (470 nm) and red (627 nm) LED lights at a 12 h photoperiod. The mycelium growth increased under cyan (505 nm) at 16, 20, and 24 h photoperiods. It has been reported that a 12 h photoperiod illumination of purple light (400–410 nm) and blue (450–460 nm) significantly inhibited B. cinerea mycelium growth [30]. In our research under a royal blue (455 nm) LED light at 4, 8, 12, and 16 h photoperiods, B. cinerea recovered faster. Our results showed that LED light also influenced conidia formation. The results showed that under royal blue (455 nm) at 8, 16, 20, and 24 h photoperiods, the sporulation was suppressed, and conidia did not form. Additionally, conidia did not form under blue (470 nm) at 12, 16, and 24 h photoperiods. Blue (405 nm) light under a 12 h photoperiod inhibited B. cinerea spores on detached tomato leaves [37]. Additionally, blue (420–520 nm, peak 465 nm) light reduced Podosphaera pannosa conidia germination [35]. It was reported that blue (410–540 nm) light inhibited conidia production of P. digitatum [27]. A blue (458 nm) LED light after 6 h influenced Colletotrichum acutatum conidial germination and germ tube growth [38]. A 12 h (followed by 12 h of a dark period) treatment per day effectively reduced P. digitatum mycelium [29]. It is known that light influences B. cinerea asexual reproduction. Blue light negatively affects conidia production as it inhibits the formation of conidiophores [39]. The absence or reduction of conidia production indicates that it is possible to prevent the fungal spread and postharvest contamination. In our research, the mycelium morphological type varied at all photoperiods. The mycelium appearance was without conidia (M1) to mycelium with conidia (M2). B. cinerea pathosystems developed a less fluffy mould than in dark-treated samples although red, white, and dark conditions caused similar soft decay [40]. Our data indicated that B. cinerea sclerotia distribution and mycelium appearance differed under different photoperiods and LED light wavelengths. The sclerotia varied from no sclerotia, sclerotia at the edge of the Petri, arranged in circles, or large irregular and small sclerotia. Our results also suggested that the phenotypic and morphological features of B. cinerea depended on the specific photoperiod and LED light wavelength. Therefore, we could hypothesise that the illumination effect could be short-term and adapting the illumination of a fungus with different wavelengths should be in cycles to suspend the pathogen recovery.
5. Conclusions
The research of this paper reflects global trends, relevant pathogen controls, and management methods based on food safety and sustainable agriculture principles. The results allowed the exploration of original research approaches and suggested new green plant protection solutions to meet world food contamination problems as well as raised new scientific questions for further investigations to develop innovative plant protection methods of B. cinerea management. Developing an optimal illumination regime before implementing an LED light treatment to control against B. cinerea is essential. However, illumination by LED lights for fungal pathogens should be combined with other disease control methods. This research is at an initial stage and further research is required to develop alternative plant protection methods of strawberry B. cinerea management.
Supplementary Materials
The following are available online at https://www.mdpi.com/article/10.3390/jof7110970/s1. Figure S1. The average Botrytis cinerea mycelium growth rate under different wavelengths and 4, 8, 12, 16, 20, and 24 h photoperiods. All values in the figure are expressed as mean ± standard error (n = 4). Means with different letters are significantly different at the p < 0.05 level according to Duncan’s multiple range test.
Author Contributions
Conceptualisation, N.R., A.B., V.V.-K. and A.V.; methodology, N.R. and A.V.; software and validation, N.R., investigation, N.R. and A.K.; formal analysis, N.R. and V.V.-K.; resources, N.R.; data curation, A.B., A.V., G.S. and P.D.; writing—original draft preparation, N.R.; writing—review and editing, N.R.; visualisation, N.R.; supervision, A.B. and A.V. All authors have read and agreed to the published version of the manuscript.
Funding
This project received funding from the European Social Fund (project No. 09.3.3-LMT-K-712-02-0052) under a grant agreement with the Research Council of Lithuania (LMTLT).
Institutional Review Board Statement
Not applicable.
Informed Consent Statement
Not applicable.
Data Availability Statement
Please refer to suggested Data Availability Statements in section “MDPI Research Data Policies” at https://www.mdpi.com/ethics, accessed on 14 November 2021.
Conflicts of Interest
The authors declare no conflict of interest.
References
- Elad, Y.; Vivier, M.; Fillinger, S. Botrytis, the good, the bad and the ugly. In Botrytis–the Fungus, the Pathogen and Its Management in Agricultural Systems; Fillinger, S., Elad, Y., Eds.; Springer: New York, NY, USA; Dordrecht, The Netherlands; London, UK, 2016; pp. 1–15. [Google Scholar]
- Carisse, O. Epidemiology and Aerobiology of Botrytis spp. In Botrytis–the Fungus, the Pathogen and its Management in Agricultural Systems; Fillinger, S., Elad, Y., Eds.; Springer: New York, NY, USA; Dordrecht, The Netherlands; London, UK, 2016; pp. 127–148. [Google Scholar]
- Hua, L.; Yong, C.; Zhanquan, Z.; Boqiang, L.; Guozheng, Q.; Shipping, T. Pathogenic mechanisms and control strategies of Botrytis cinerea causing post-harvest decay in fruits and vegetables. Food Qual. Safe 2018, 2, 111–119. [Google Scholar] [CrossRef] [Green Version]
- Rasiukevičiūtė, N.; Rugienius, R.; Šikšnianienė, J.B. Genetic diversity of Botrytis cinerea from strawberry in Lithuania. Zemdirb.-Agric. 2018, 105, 265–270. [Google Scholar] [CrossRef] [Green Version]
- Shtienberg, D. Rational management of Botrytis-incited diseases: Integration of control measures and use of warning systems. In Botrytis: Biology, Pathology and Control; Elad, Y., Williamson, B., Tudzynski, P., Delen, N., Eds.; Springer: Dordrecht, The Netherlands, 2007; pp. 335–347. [Google Scholar]
- Elad, Y. Cultural and integrated control of Botrytis. In Botrytis–the Fungus, the Pathogen and Its Management in Agricultural Systems; Fillinger, S., Elad, Y., Eds.; Springer: New York, NY, USA; Dordrecht, The Netherlands; London, UK, 2016; pp. 149–164. [Google Scholar]
- Fung, F.; Wang, H.S.; Menon, S. Food safety in the 21st century. Biomed. J. 2018, 41, 88–95. [Google Scholar] [CrossRef] [PubMed]
- Rather, I.A.; Koh, W.Y.; Paek, W.K.; Lim, J. The Sources of chemical contaminants in food and their health implications. Front. Pharm. 2017, 8, 830. [Google Scholar] [CrossRef] [Green Version]
- Tiilikkala, K.; Lindqvist, I.; Hagner, M.; Setälä, H.; Perdikis, D. Use of botanical pesticides in modern plant protection. In Pesticides in the Modern World-Pesticides Use and Management; Stoytcheva, M., Ed.; IntechOpen Limited: UK, London, 2011; pp. 259–272. [Google Scholar]
- Stentiford, G.D.; Becnel, J.; Weiss, L.M.; Keeling, P.J.; Didier, E.S.; Williams, B.P.; Bjornson, S.; Kent, M.L.; Freeman, M.A.; Brown, M.J.F.; et al. Microsporidia-Emergent Pathogens in the Global Food Chain. Trends Parasitol 2016, 32, 336–348. [Google Scholar] [CrossRef] [PubMed] [Green Version]
- Carisse, O.; Morissette-Thomas, V.; Van der Heyden, H. Lagged association between powdery mildew leaf severity, airborne inoculum, weather, and crop losses in strawberry. Phytopathology 2013, 103, 811–821. [Google Scholar] [CrossRef] [Green Version]
- Kim, K.; Kook, H.-S.; Jang, Y.-J.; Lee, W.-H.; Kamala-Kannan, S.; Chae, J.-C.; Lee, K.-J. The effect of blue-light emitting diodes on antioxidant properties and resistance to Botrytis cinerea in tomato. J. Plant Pathol. Microbiol. 2013, 4, 203. [Google Scholar] [CrossRef] [Green Version]
- Kook, H.S.; Park, S.H.; Jang, Y.J.; Lee, G.W.; Kim, J.S.; Kim, H.M.; Oh, B.T.; Chae, J.C.; Lee, K.J. Blue LED (light-emitting diodes)-mediated growth promotion and control of Botrytis disease in lettuce. Acta Agric. Scand. B Soil Plant Sci. 2013, 63, 271–277. [Google Scholar] [CrossRef]
- Hasan, M.M.; Bashir, T.; Ghosh, R.; Lee, S.K.; Bae, H. An Overview of LEDs’ effects on the production of bioactive compounds and crop quality. Molecules 2017, 22, 1420. [Google Scholar] [CrossRef] [PubMed] [Green Version]
- Luksiene, Z.; Rasiukeviciute, N.; Zudyte, B.; Uselis, N. Innovative approach to sunlight activated biofungicides for strawberry crop protection: ZnO nanoparticles. J. Photoch. Photobio. B 2019, 203, 111656. [Google Scholar] [CrossRef]
- Neugart, S.; Schreiner, M. UVB and UVA as eustressors in horticultural and agricultural crops. Sci. Hort. 2018, 234, 370–381. [Google Scholar] [CrossRef]
- Morkeliūnė, A.; Rasiukevičiūtė, N.; Valiuškaitė, A. Pathogenicity of Colletotrichum acutatum to different strawberry cultivars and anthracnose control with essential oils. Zemdirb.-Agric. 2021, 108, 173–180. [Google Scholar] [CrossRef]
- Šernaitė, L.; Valiuškaitė, A.; Rasiukevičiūtė, N.; Dambrauskienė, E.; Viškelis, P. Effectiveness of mixtures and individual plant extracts and essential oils for biocontrol of Botrytis cinerea. Zemdirb.-Agric. 2020, 107, 147–152. [Google Scholar] [CrossRef]
- D’Souza, C.; Yuk, H.; Khoo, H.G.; Zhou, W. Application of light-emitting diodes in food production, postharvest preservation, and microbiological food safety. Compr. Rev. Food Sci. Food Saf. 2015, 14, 719–740. [Google Scholar] [CrossRef]
- Bian, Z.H.; Yang, Q.C.; Liu, W.K. Effects of light quality on the accumulation of phytochemicals in vegetables produced in controlled environments: A review. J. Sci. Food Agric. 2015, 95, 869–877. [Google Scholar] [CrossRef]
- Vaštakaitė, V.; Viršilė, A.; Brazaitytė, A.; Samuolienė, G.; Jankauskienė, J.; Novičkovas, A.; Duchovskis, P. Pulsed Light-Emitting diodes for a higher phytochemical level in microgreens. J. Agric. Food Chem. 2017, 65, 6529–6534. [Google Scholar] [CrossRef] [PubMed]
- Brazaitytė, A.; Viršilė, A.; Samuolienė, G.; Vaštakaitė-Kairienė, V.; Jankauskienė, J.; Miliauskienė, J.; Novičkovas, A.; Duchovskis, P. Response of mustard microgreens to different wavelengths and durations of UV-A LEDs. Front. Plant Sci. 2019, 10, 1153. [Google Scholar] [CrossRef] [Green Version]
- Bantis, F.; Smirnakou, S.; Ouzounis, T.; Koukounaras, A.; Ntagkas, N.; Radoglou, K. Current status and recent achievements in the field of horticulture with the use of light-emitting diodes (LEDs). Sci. Hortic. 2018, 235, 437–451. [Google Scholar] [CrossRef]
- Yu, Z.; Fischer, R. Light sensing and responses in fungi. Nat. Rev. Microbiol. 2019, 17, 25–36. [Google Scholar] [CrossRef]
- Schumacher, J. How light affects the life of Botrytis. Fungal Genet. Biol. 2017, 106, 26–41. [Google Scholar] [CrossRef]
- Ballaré, C.L. Light Regulation of Plant Defense. Annu. Rev. Plant Biol. 2014, 65, 335–363. [Google Scholar] [CrossRef]
- Liao, H.-L.; Alferez, F.; Burns, J.K. Assessment of blue light treatments on citrus postharvest diseases. Postharvest Biol. Technol. 2013, 81, 81–88. [Google Scholar] [CrossRef]
- Wang, H.; Jiang, Y.P.; Yu, H.J.; Xia, X.J.; Shi, K.; Zhou, Y.H.; Yu, J.Q. Light quality affects incidence of powdery mildew, expression of defence-related genes and associated metabolism in cucumber plants. Eur. J. Plant Pathol. 2010, 127, 125–135. [Google Scholar] [CrossRef]
- Alferez, F.; Liao, H.-L.; Burns, J.K. Blue light alters infection by Penicillium digitatum in tangerines. Postharvest Biol. Technol. 2012, 63, 11–15. [Google Scholar] [CrossRef]
- Xu, H.; Fu, Y.; Li, T.; Wang, R. Effects of different LED light wavelengths on the resistance of tomato against Botrytis cinerea and the corresponding physiological mechanisms. J. Integr. Agr. 2017, 16, 106–114. [Google Scholar] [CrossRef] [Green Version]
- Dėnė, L.; Valiuškaitė, A. Sensitivity of Botrytis cinerea isolates complex to plant extracts. Molecules 2021, 26, 4595. [Google Scholar] [CrossRef]
- Cherkupally, R.; Kota, R.; Amballa, H.; Reddy, B.N. In vitro antifungal potential of plant extracts against Fusarium oxysporum, Rhizoctonia solani and Macrophomina phaseolina. Ann. Plant Sci. 2017, 6, 1676–1680. [Google Scholar] [CrossRef] [Green Version]
- Campbell, C.L.; Madden, L.V. Introduction to Plant Disease Epidemiology; John Wiley & Sons: New York, NY, USA, 1990; p. 532. [Google Scholar]
- Tanović, B.; Hrustić, J.; Mihajlović, M.; Grahovac, M.; Delibašić, G. Botrytis cinerea in raspberry in Serbia I: Morphological and molecular characterization. Pestic. Phytomed. (Belgrade) 2014, 29, 237–247. [Google Scholar] [CrossRef]
- Suthaparan, A.; Torre, S.; Stensvand, A.; Herrero, M.L.; Pettersen, R.I.; Gadoury, D.M.; Gislerød, H.R. Specific light-emitting diodes can suppress sporulation of Podosphaera pannosa on greenhouse roses. Plant Dis. 2010, 94, 1105–1110. [Google Scholar] [CrossRef] [PubMed] [Green Version]
- Alsanius, B.W.; Karlsson, M.; Rosberg, A.K.; Dorais, M.; Naznin, M.T.; Khalil, S.; Bergstrand, K.-J. Light and microbial lifestyle: The impact of light quality on plant–microbe interactions in horticultural production systems—A review. Horticulturae 2019, 5, 41. [Google Scholar] [CrossRef] [Green Version]
- Imada, K.; Tanaka, S.; Ibaraki, Y.; Yoshimura, K.; Ito, S. Antifungal effect of 405-nm light on Botrytis cinerea. Lett. Appl. Microbiol. 2014, 59, 670–676. [Google Scholar] [CrossRef]
- Yu, S.-M.; Ramkumar, G.; Lee, Y.H. Light quality influences the virulence and physiological responses of Colletotrichum acutatum causing anthracnose in pepper plants. J. Appl. Microbiol. 2014, 115, 509–516. [Google Scholar] [CrossRef]
- Canessa, P.; Schumacher, J.; Hevia, M.A.; Tudzynski, P.; Larrondo, L.F. Assessing the effects of light on differentiation and virulence of the plant pathogen Botrytis cinerea: Characterization of the white collar complex. PLoS ONE 2013, 8, e84223. [Google Scholar] [CrossRef] [PubMed] [Green Version]
- Zhu, P.; Zhang, C.; Xiao, H.; Wang, Y.; Toyoda, H.; Xu, L. Exploitable regulatory effects of light on growth and development of Botrytis cinerea. J. Plant. Pathol. 2013, 95, 509–517. [Google Scholar]
Publisher’s Note: MDPI stays neutral with regard to jurisdictional claims in published maps and institutional affiliations. |
© 2021 by the authors. Licensee MDPI, Basel, Switzerland. This article is an open access article distributed under the terms and conditions of the Creative Commons Attribution (CC BY) license (https://creativecommons.org/licenses/by/4.0/).