
Biochemical and Morphological Characteristics of Some Macrofungi Grown Naturally

 , ,
, ,  ,
,  and
and 
Abstract
:1. Introduction
2. Materials and Methods
2.1. Determination of Morphological Properties
2.1.1. Width and Length of Macro-Fungi
2.1.2. Color Indices (L*, a*, b*, C°, and h°)
2.2. Determination of Biochemical Contents
2.2.1. Total Phenolic Content and Total Antioxidant Capacity
2.2.2. pH
2.2.3. Soluble Solids Contents (SSC)
2.3. Statistical Analysis
3. Results and Discussion
3.1. Determination of Morphological Properties
3.2. Determination of Color Indices
3.3. Determination of Biochemical Contents
4. Conclusions
Author Contributions
Funding
Institutional Review Board Statement
Informed Consent Statement
Data Availability Statement
Acknowledgments
Conflicts of Interest
References
- Yilmaz, H.Ç.; Bengü, A.Ş. The investigation of fatty acids and mineral profiles of some edible Lactarius species (L. deliciosus, L. deterrimus, L. salmonicolor, L. sanguifluus, L. semisanguifluus) in the Uşak/Turkey province of Aegean Region. Biol. Divers. Conversat. 2018, 11, 95–104. [Google Scholar]
- Yıldız, A.; Karakaplan, M.; Aydın, F. Studies on Pleurotus ostreatus (Jacq. Ex Fr.) Kum var. salignus (Pers. Ex Fr.) Konr. Et Matubl.: Cultivation, proximate composition, organic and mineral composition of carpophores. Food Chem. 1998, 61, 127–130. [Google Scholar] [CrossRef]
- Manzi, P.; Gambelli, L.; Marconi, S.; Vivanti, V.; Pizzoferrato, L. Nutrients in edible mushrooms: An interspecies comparitive study. Food Chem. 2001, 65, 477–482. [Google Scholar] [CrossRef]
- Demirbaş, A. Concentrations of 21 metals in 18 species of mushrooms growing in the East Black Sea Region. Food Chem. 2001, 75, 453–457. [Google Scholar] [CrossRef]
- Diez, V.A.; Alvarez, A. Compositional and nutritional studies on two wild edible mushrooms from northwest Spain. Food Chem. 2001, 75, 417–422. [Google Scholar] [CrossRef]
- Sanmee, R.; Dell, B.; Lumyong, P.; Izumori, K.; Lumyong, S. Nutritive value of popular wild edible mushrooms from northern Thailand. Food Chem. 2003, 82, 527–532. [Google Scholar] [CrossRef]
- Mendil, D.; Uluözlü, Ö.D.; Hasdemir, E.; Çağlar, A. Determination of trace elements on some wild edible mushroom Samples from Kastamonu Turkey. Food Chem. 2004, 88, 281–285. [Google Scholar] [CrossRef]
- Nnorom, I.C.; Jarzynska, G.; Falandysz, J.; Drewnowska, M.; Okoye, I.; Oji-Nnorom, C.G. Occurrence and accumulation of mercury in two species of wild grown Pleurotus mushrooms from Southeastern Nigeria. Ecotoxicol. Environ. Saf. 2012, 84, 78–83. [Google Scholar] [CrossRef]
- Pereira, E.; Barros, L.; Martins, A.; Ferreira, I.C.F.R. Towards chemical and nutritional inventory of Portuguese wild edible mushrooms in different habitats. Food Chem. 2012, 130, 394–403. [Google Scholar] [CrossRef] [Green Version]
- Falandysz, J.; Widzicka, E.; Kojta, A.K.; Jarzyn’ska, G.; Drewnowska, M.; Dryzałowska, A. Mercury in Common Chanterelles mushrooms: Cantharellus spp. update. Food Chem. 2012, 133, 842–850. [Google Scholar] [CrossRef]
- Barros, L.; Ferreira, I.C.F.R.; Queiros, B.; Ferreira, I.; Paula, B. Total phenols, ascorbic acid, b-carotene and lycopene in Portuguese wild edible mushrooms and their antioxidant activities. Food Chem. 2007, 103, 413–419. [Google Scholar] [CrossRef]
- Vaz, J.A.; Heleno, S.A.; Martins, A.; Almeida, G.M.; Vasconcelos, M.H.; Ferreira, I.C.F.R. Wild mushrooms Clitocybe alexandri and Lepista inversa: In vitro antioxidant activity and growth inhibition of human tumour cell lines. Food Chem. Toxicol. 2010, 48, 2881–2884. [Google Scholar] [CrossRef] [PubMed]
- Stojkovic, D.S.; Kovacevic-Grujicic, N.; Reis, F.S.; Davidovic, S.; Barros, L.; Popovic, J.; Petrovic, I.; Pavi, A.; Glamoclija, J.; Ciric, A.; et al. Chemical composition of the mushroom Meripilus giganteus Karst. and bioactive properties of its methanolic extract. LWT Food Sci. Technol. 2017, 79, 454–462. [Google Scholar] [CrossRef] [Green Version]
- Fogarasi, M.; Socaci, S.A.; Dulf, F.V.; Diaconeasa, Z.M.; Fărcaș, A.C.; Tofană, M.; Semeniuc, C.A. Bioactive compounds and volatile profiles of five Transylvanian wild edible mushrooms. Molecules 2018, 23, 3272. [Google Scholar] [CrossRef] [PubMed] [Green Version]
- Reis, F.S.; Pereira, E.; Barros, L.; Sousa, M.J.; Martins, A.; Ferreira, I.C. Biomolecule profiles in inedible wild mushrooms with antioxidant value. Molecules 2011, 16, 4328–4338. [Google Scholar] [CrossRef]
- Vamanu, E.; Nita, S. Antioxidant capacity and the correlation with major phenolic compounds, anthocyanin, and tocopherol content in various extracts from the wild edible Boletus edulis mushroom. Bio. Med. Res. Int. 2013, 2013, 313905. [Google Scholar]
- Üstün, O. Nutritional value and biological effects of macrfungi. Turk. Bull. Hyg. Exp. Biol. 2011, 68, 223–240. [Google Scholar] [CrossRef]
- Fogarasi, M.; Diaconeasa, Z.M.; Pop, C.R.; Fogarasi, S.; Semeniuc, C.A.; Fărcaş, A.C.; Țibulcă, D.; Sălăgean, C.-D.; Tofană, M.; Socaci, S.A. Elemental composition, antioxidant and antibacterial properties of some wild edible mushrooms from Romania. Agronomy 2020, 10, 1972. [Google Scholar] [CrossRef]
- Erdoğan, S.; Soylu, M.K.; Başer, K.H.C. Bazı yabani mantarların antioksidan özellikleri. Nevşehir Bilim Ve Teknol. Derg. 2017, 6, 254–260. [Google Scholar] [CrossRef]
- Saldır, Y. Bazı Mantarların Antioksidan ve Antimikrobiyal Özelliklerinin Araştırılması. Master’s Thesis, Pamukkale Üniversitesi Fen Bilimleri Enstitüsü Biyoloji Anabilim Dalı, Edirne, Turkey, 2015. [Google Scholar]
- Bayuk, B.G.; Gezer, K.; Kaygusuz, O. Mushrooms exported from Denizli province and nutrient content. Int. J. Sec. Met. 2016, 3, 27–28. [Google Scholar]
- Lu, T.; Bau, T.; Ohga, S. Physiological study of the wild edible mushroom Leucocalocybe mongolica. J. Fac. Agric. Kyushu Univ. 2017, 62, 1–8. [Google Scholar] [CrossRef]
- Singh, S.; Gaikwad, K.K.; Lee, M.; Lee, Y.S. Thermally buffered corrugated packaging for preserving the postharvest freshness of mushrooms (Agaricus bispours). J. Food Eng. 2018, 216, 11–19. [Google Scholar] [CrossRef]
- Ekin, S.; Uzun, Y.; Demirel, K.; Bayramoglu, M.; Kiziltas, H. Chemical composition and antioxidant activity of two wild edible mushrooms from Turkey. Int. J. Med. Mushrooms 2015, 17, 1179–1188. [Google Scholar] [CrossRef]
- Ersoy, N.; Kupe, M.; Gundogdu, M.; Ilhan, G.; Ercisli, S. Phytochemical and antioxidant diversity in fruits of currant (Ribes spp.) cultivars. Not. Bot. Horti Agrobot. 2018, 46, 381–387. [Google Scholar] [CrossRef] [Green Version]
- Ersoy, N.; Kupe, M.; Sagbas, H.I.; Ercisli, S. Phytochemical diversity among barberry (Berberis vulgaris L.). Not. Bot. Horti Agrobot. 2018, 46, 336–342. [Google Scholar] [CrossRef] [Green Version]
- Ozkan, G. Phenolic compounds, organic acids, vitamin C and antioxidant capacity in Prunus spinosa. C. R. Acad. Bulg. Sci. 2019, 72, 267–273. [Google Scholar]
- Bozhuyuk, M.R.; Ercisli, S.; Orhan, E.; Koc, A. Determination of the genetic diversity of walnut (Juglans regia L.) cultivar candidates from Northeastern Turkey using SSR markers. Mitt. Klost. 2020, 70, 269–277. [Google Scholar]
- Ozkan, G.; Ercisli, S.; Sagbas, H.I.; Ilhan, G. Diversity on fruits of wild grown European cranberrybush from Coruh valley in Turkey. Erwerbs-Obstbau 2020, 62, 275–279. [Google Scholar] [CrossRef]
- Breitenbach, J.; Kränzlin, F. Fungi of Switzerland; Verlag Mykologia: Lucerne, Switzerland, 1984; Volume 1. [Google Scholar]
- Breitenbach, J.; Kränzlin, F. Fungi of Switzerland, Volume 4 Agarics 2nd Part. Entolomataceae, Pluteaceae, Amanitaceae, Agaricaceae, Coprinaceae, Bolbitiaceae, Strophariaceae; Verlag Mykologia: Lucerne, Switzerland, 1995; Volume 4. [Google Scholar]
- Buczacki, S. Fungi of Britain and Euro; William Collins Sons & Co Ltd.: Glasgow, UK, 1989. [Google Scholar]
- Jordan, M. The Encyclopedia of Fungi of Britain and Europe; David and Charles: London, UK, 2004; p. 51. [Google Scholar]
- Index Fungorum. Available online: http://www.indexfungorum.org/names/Names.asp/ (accessed on 1 April 2018).
- Kirk, P.M.; Cannon, P.F.; Minter, D.W.; Stalpers, J.A. Dictionary of the Fungi, 10th ed.; CAB International: Wallingford, UK, 2008. [Google Scholar]
- Swain, T.; Hillis, W.E. The phenolic constituents of Prunus domestica. I. The quantitative analysis of phenolic constituents. J. Sci. Food Agric. 1959, 10, 63–68. [Google Scholar] [CrossRef]
- Benzie, I.F.; Strain, J.J. The ferric reducing ability of plasma (FRAP) as a measure of “antioxidant power”: The FRAP assay. Anal. Biochem. 1996, 239, 70–76. [Google Scholar] [CrossRef] [PubMed] [Green Version]
- Eissa, H.A. Effect of chitosan coating on shelf life and quality of fresh-cut mushroom. J. Food Qual. 2007, 30, 623–645. [Google Scholar] [CrossRef]
- Jafri, M.; Jha, A.; Bunkar, D.S.; Ram, R.C. Quality retention of oyster mushrooms (Pleurotus florida) by a combination of chemical treatments and modified atmosphere packaging. Postharvest Biol. Technol. 2013, 76, 112–118. [Google Scholar] [CrossRef]
- Çavuşoğlu, Ş.; Gökçenay, G. Farklı dozlarda uygulanan sitokininin beyaz şapkalı mantarın (Agaricus bisporus) muhafazası üzerine etkisi. Mantar Dergisi. 2018, 9, 80–91. [Google Scholar]
- Palacios, I.; Lozano, M.; Moro, C.; D’arrigo, M.; Rostagno, M.A.; Martínez, J.A.; Villares, A. Antioxidant properties of phenolic compounds occurring in edible mushrooms. Food Chem. 2011, 128, 674–678. [Google Scholar] [CrossRef]
- Nhi, N.N.Y.; Hung, P.V. Nutritional composition and antioxidant capacity of several edible mushrooms grown in the Southern Vietnam. Int. Food Res. J. 2012, 19, 611–615. [Google Scholar]
- Guo, Y.J.; Deng, G.F.; Xu, X.R.; Wu, S.; Li, S.; Xia, E.Q.; Li, H.B. Antioxidant capacities, phenolic compounds and polysaccharide contents of 49 edible macro-fungi. Food Funct. 2012, 3, 1195–1205. [Google Scholar] [CrossRef]
- Ota, A.; Višnjevec, A.M.; Vidrih, R.; Prgomet, Ž.; Nečemer, M.; Hribar, J.; Cimerman, N.G.; Možina, S.S.; Bučar-Miklavčič, M.; Ulrih, N.P. Nutritional, antioxidative, and antimicrobial analysis of the Mediterranean hackberry (Celtis australis L.). Food Sci. Nutr. 2017, 5, 160–170. [Google Scholar] [CrossRef] [Green Version]
- İkinci, A.; Şimşek, M.; Gülsoy, E. Çitlembik Bitkisinin Kimyasal Bileşimi ve İnsan Sağlığı Üzerine Etkileri. Iğdır Üniversitesi Fen Bilimleri Enstitüsü Derg. 2018, 8, 21–30. [Google Scholar]
- Cheung, L.M.; Cheung, P.C.; Ooi, V.E. Antioxidant activity and total phenolics of edible mushroom extracts. Food Chem. 2003, 81, 249–255. [Google Scholar] [CrossRef]
- Barros, L.; Falcão, S.; Baptista, P.; Freire, C.; Vilas-Boas, M.; Ferreira, I.C. Antioxidant activity of Agaricus sp. mushrooms by chemical, biochemical and electrochemical assays. Food Chem. 2008, 111, 61–66. [Google Scholar] [CrossRef]
- Serce, S.; Ozgen, M.; Torun, A.A.; Ercisli, S. Chemical composition, antioxidant activities and total phenolic content of Arbutus andrachne L. (Fam. Ericaceae) (the Greek strawberry tree) fruits from Turkey. J. Food Compost. Anal. 2010, 23, 619–623. [Google Scholar] [CrossRef]
- Zia-Ul-Haq, M.; Ahmad, S.; Qayum, M.; Ercisli, S. Compositional studies and antioxidant potential of Albizia lebbeck (L.) Benth. Pods and seeds. Turk. J. Biol. 2013, 37, 25–32. [Google Scholar]
- Dogan, H.; Ercisli, S.; Jurikova, T.; Temim, E.; Leto, A.; Hadziabulic, A.; Tosun, M.; Narmanlioglu, H.K.; Zia-Ul-Haq, M. Physicochemical and antioxidant characteristics of fruits of cape gooseberry (Physalis peruviana L.) from Turkey. Oxid. Commun. 2014, 37, 1005–1014. [Google Scholar]
- Dogan, H.; Ercisli, S.; Temim, E.; Hadziabulic, A.; Tosun, M.; Yilmaz, S.O.; Zia-Ul-Haq, M. Diversity of chemical content and biological activity in flower buds of a wide number of wild grown caper (Capparis ovate Desf.) genotypes from Turkey. C. R. Acad. Bulg. Sci. 2014, 67, 1593–1600. [Google Scholar]
- Candir, E.; Ozdemir, A.E.; Aksoy, M.C. Effects of modified atmosphere packaging on the storage and shelf life of Hicaznar pomegranate fruits. Turk. J. Agric. For. 2019, 43, 241–253. [Google Scholar] [CrossRef]
- Kupe, M. Some ampelographic and biochemical characteristics of local grape accessions from Turkey. Genetika 2020, 52, 513–525. [Google Scholar] [CrossRef]


| Division | Species | Collected Area and Habitat | Moisture Content (%) | Coordinates | Altitude | Collected Date | Sample No |
|---|---|---|---|---|---|---|---|
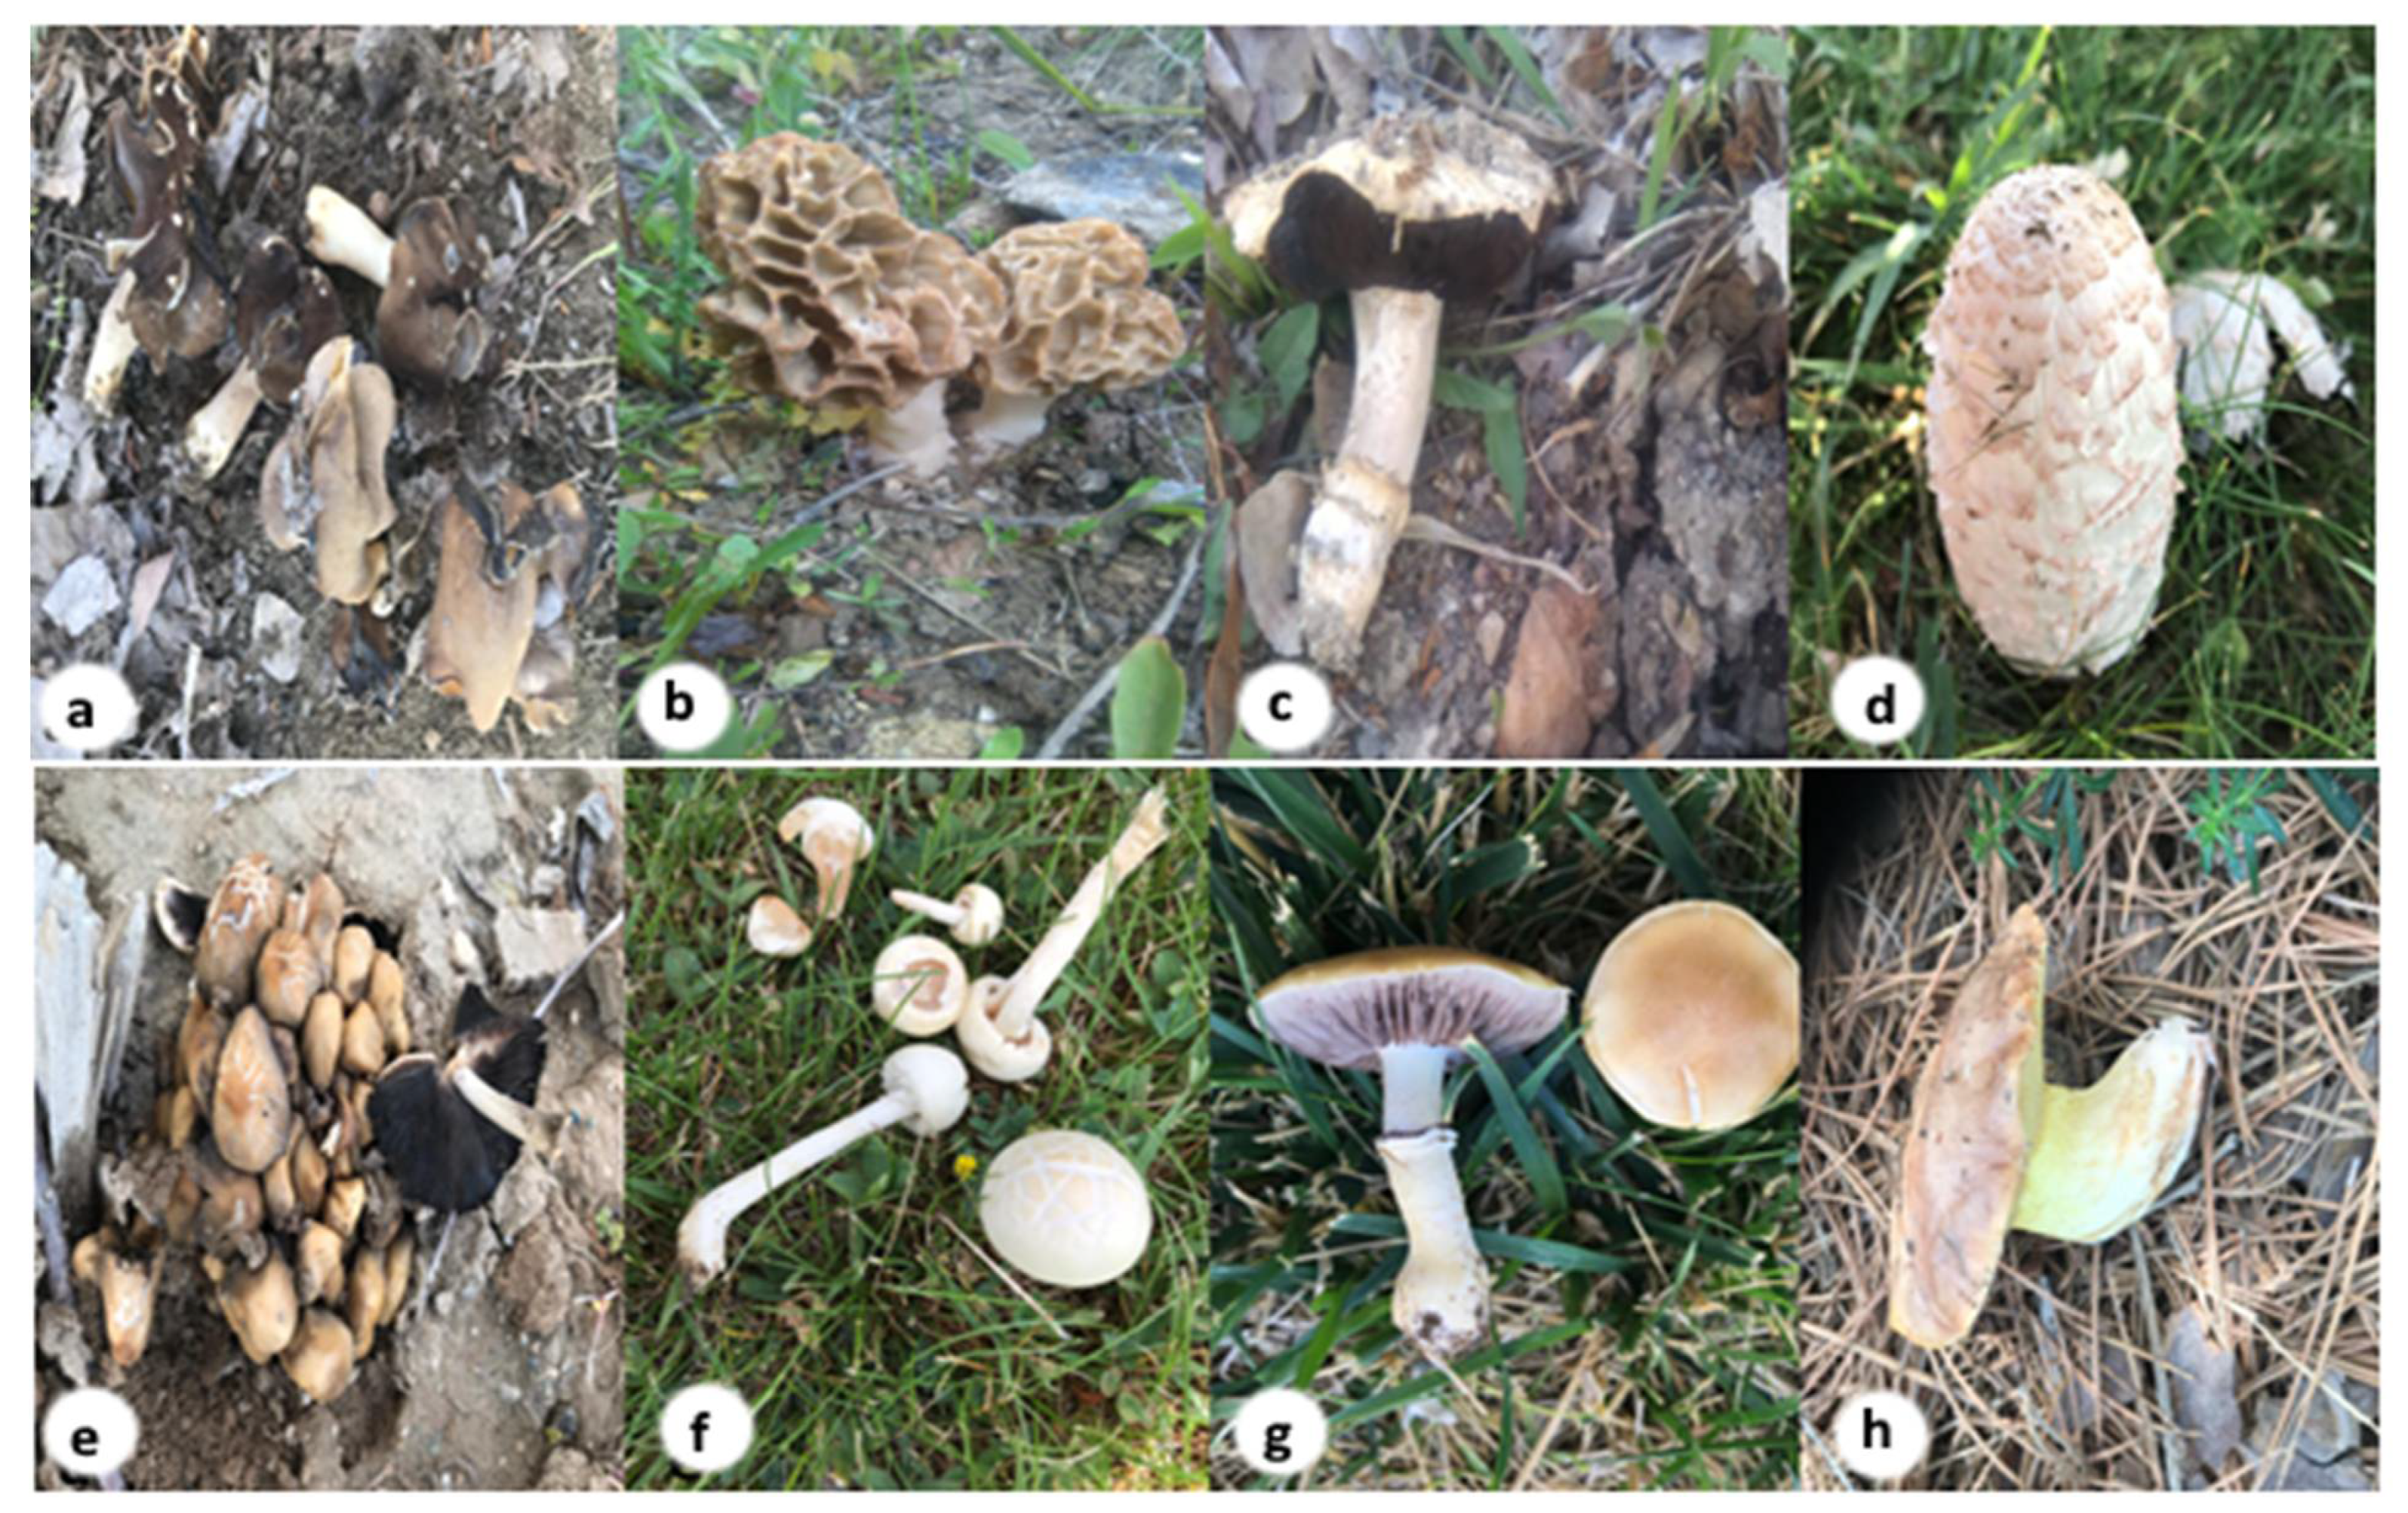
| Ascomycota | Helvella leucopus Pers. | Campus area, entrance of Horticulture department experimental area, under Populus sp. | 85.50 | 38°34′10″ K; 43°17′65″ D | 1672 m | 17 May 2018 | ALP.7 |
| Morchella esculenta (L.) Pers | Campus area, near the Faculty of Veterinary Medicine, Transformer adjacent, on meadow | 78.00 | 38°34′26″ K; 43°16′58″ D | 1660 m | 4 May 2018 | ALP.5 | |
| Basidiomycota | Agaricus bitorquis (Quél.) Sacc. | Campus area over hospital road, meadow area | 92.00 | 38°34′14″ K; 43°17′57″ D | 1673 m | 2 May 2018 | ALP.8 |
| Coprinus comatus (O.F. Müll.) Pers | Campus area, garden of Agricultural Faculty, meadow area | 90.50 | 38°34′02″ K; 43°16′36″ D | 1660 m | 24 May 2018 | ALP.1 | |
| Psilocybe coronilla (Bull.) Noordel. | Campus area mosque backyard, meadow area | 80.00 | 38°34′78″ K; 43°16′05″ D | 1666 m | 19 May 2018 | ALP.2 | |
| Coprinellus micaceus (Bull.) Vilgalys, Hopple & Jacq. Johnson | Campus area Agricultural Faculty garden, Salix sp. adjacent | 88.50 | 38°34′38″ K; 43°16′73″ D | 1661 m | 15 May 2018 | ALP.3 | |
| Agrocybe dura (Bolton) Singer | Campus area mosque backyard, meadow area | 86.00 | 38°34′44″ D; 43°16′21″ D | 1667 m | 15 May 2018 | ALP.4 | |
| Suillus collinitus (Fr.) Kuntze | Campus area near the mosque, under Pinus sp. | 95.30 | 38°34′15″ K; 43°17′14″ D | 1672 m | 17 May 2018 | ALP.6 |
| Species | Stem Length (cm) | Cap Length (cm) | Stem Width (cm) | Cap Width (cm) |
|---|---|---|---|---|
| Helvellaa leucopus | 4.50 | 5.05 | 1.55 | 5.15 |
| Morchella esculenta | 4.90 | 4.05 | 1.60 | 5.10 |
| Agaricus bitorquis | 7.85 | 3.10 | 2.45 | 9.25 |
| Coprinus comatus | 16.00 | 9.25 | 4.75 | 9.00 |
| Coprinellus micaceus | 5.80 | 2.20 | 0.35 | 2.85 |
| Agrocybe dura | 5.20 | 1.50 | 0.45 | 1.90 |
| Psilocybe coronilla | 3.00 | 1.40 | 1.00 | 5.60 |
| Suillus collinitus | 5.85 | 3.05 | 2.10 | 7.05 |
| Species | Investigated Parts | L * | a * | b * | C° | h° |
|---|---|---|---|---|---|---|
| Helvella leucopus | Cap surface | 30.46 C ** (d **) | 6.15 A ** (ab) | 9.42 B ** (e **) | 11.30 B * (e **) | 55.54 B ** (d **) |
| Cap basement | 52.98 B ** (bc **) | 1.26 C ** (c **) | 10.11 B ** (cd **) | 10.19 B * (bcd **) | 82.95 A ** (a **) | |
| Stem | 64.29 A ** (ab **) | 3.11 B ** (cd **) | 23.41 A ** (bc **) | 23.64 A * (c **) | 82.52 A ** (bc **) | |
| Morchella esculenta | Cap surface | 37.42 B * (d **) | 6.43 A * (ab) | 19.22 A (d **) | 20.28 A (d **) | 71.58 A (bc **) |
| Cap basement | 51.31 A * (c **) | 4.34 B * (b **) | 17.86 A (bc **) | 18.39 A (bc **) | 76.28 A (a **) | |
| Stem | 57.68 A * (bc **) | 4.20 B * (bc **) | 19.25 A (cd **) | 19.72 A (cd **) | 74.73 A (d **) | |
| Agaricus bitorquis | Cap surface | 56.17 A ** (c **) | 8.69 A ** (a) | 27.21 A ** (bc **) | 28.57 A ** (bc **) | 72.25 A ** (bc **) |
| Cap basement | 21.28 B ** (e **) | 1.23 B ** (c **) | 2.07 B ** (d **) | 2.41 B ** (d **) | 58.45 B ** (b **) | |
| Stem | 44.69 A ** (d **) | 7.84 A ** (a **) | 20.45 A ** (bc **) | 22.00 A ** (c **) | 68.66 A ** (d **) | |
| Coprinus comatus | Cap surface | 58.18 A (c **) | 6.05 A ** (ab) | 19.67 A * (d **) | 20.59 A * (d **) | 72.96 B * (abc **) |
| Cap basement | 69.30 A (a **) | 0.73 B ** (c **) | 9.49 B * (cd **) | 9.54 B * (bcd **) | 85.11 A * (a **) | |
| Stem | 74.98 A (a **) | −0.07 B ** (e **) | 11.30 B * (de **) | 11.32 B * (e **) | 91.16 A * (a **) | |
| Coprinellus micaceus | Cap surface | 53.20 A ** (c **) | 10.51 A ** (a) | 29.89 A * (b **) | 31.70 A ** (b **) | 70.61 AB (bc **) |
| Cap basement | 28.47 B ** (de **) | 3.67 B ** (b **) | 6.09 B * (cd **) | 7.16 C ** (cd **) | 55.00 B (b **) | |
| Stem | 48.31 A ** (cd **) | 4.32 B ** (bc **) | 7.35 B * (e **) | 15.96 B ** (d **) | 74.24 A (d **) | |
| Agrocybe dura | Cap surface | 78.09 A * (a **) | 2.60 A (b) | 23.40 A (cd **) | 23.60 A (cd **) | 84.21 A (a **) |
| Cap basement | 63.19 B * (ab **) | 4.10 A (b **) | 24.21 A (b **) | 24.57 A (b **) | 80.27 A (a **) | |
| Stem | 65.38 B * (ab **) | 0.97 A (de **) | 16.16 A (cd **) | 16.19 A (d **) | 86.60 A (ab **) | |
| Psilocybe coronilla | Cap surface | 68.03 A * (b **) | 6.00 A (ab) | 39.81 A ** (a **) | 38.83 A ** (a **) | 81.39 A * (ab **) |
| Cap basement | 36.24 B * (d **) | 5.41 A (a **) | 8.31 C ** (cd **) | 10.10 B ** (bcd **) | 54.25 B * (b **) | |
| Stem | 70.04 A* (a **) | 2.95 A (cd **) | 33.94 B ** (a **) | 34.15 A ** (a **) | 85.04 A * (ab **) | |
| Suillus collinitus | Cap surface | 39.60 A (d **) | 8.87 A (a) | 19.17 B (d **) | 21.32 A (d **) | 65.80 A (cd **) |
| Cap basement | 51.08 A (c **) | 6.01 A (a **) | 43.58 A (a **) | 41.30 A (a **) | 83.69 A (a **) | |
| Stem | 55.17 A (bcd **) | 6.62 A (ab **) | 28.38 AB (ab **) | 29.38 A (b **) | 75.96 A (cd **) |
| Species | Investigated Parts | pH | SSC | TAC | TPC |
|---|---|---|---|---|---|
| Helvella leucopus | Stem | 8.06 A (c **) | 4.55 B * (ab **) | 27.42 A (bc *) | 47.72 A (b **) |
| Cap | 7.97 A (bc **) | 5.80 A * (a *) | 34.17 A (ab) | 57.47 A (ab **) | |
| Morchella esculenta | Stem | 7.65 A (d **) | 4.35 A (ab **) | 34.42 B ** (abc *) | 60.16 A (a **) |
| Cap | 7.60 A (d **) | 4.95 A (ab *) | 57.67 A ** (a) | 46.79 A (bc **) | |
| Agaricus bitorquis | Stem | 7.82 A (d **) | 4.40 A (ab **) | 54.81 A * (a *) | 19.22 B ** (c **) |
| Cap | 7.80 A (cd **) | 4.95 A (ab *) | 22.92 B * (b) | 33.29 A ** (de **) | |
| Coprinus comatus | Stem | 8.39 A (b **) | 5.05 A (a **) | 15.72 B * (c *) | 13.85 B ** (c **) |
| Cap | 8.43 A (a **) | 4.35 A (b *) | 27.77 A * (b) | 44.16 A ** (cd **) | |
| Coprinellus micaceus | Stem | 8.75 A (a **) | 2.25 B ** (c **) | 20.39 A (c *) | 22.10 A (c **) |
| Cap | 8.52 A (a **) | 3.95 A ** (b *) | 19.35 A (b) | 26.22 A (ef **) | |
| Agrocybe dura | Stem | 8.15 A (c **) | 4.50 A (ab **) | 25.35 A (bc *) | 21.66 A (c **) |
| Cap | 8.08 A (b **) | 3.95 A (b *) | 21.06 A (b) | 21.54 A (ef **) | |
| Psilocybe coronilla | Stem | 7.58 A (d **) | 3.70 A (b **) | 27.06 B ** (bc *) | 17.91 A (c **) |
| Cap | 7.69 A (d **) | 3.90 A (b *) | 35.02 A ** (ab) | 18.60 A (f **) | |
| Suillus collinitus | Stem | 6.62 A (e **) | 4.90 A (ab **) | 46.17 A (ab *) | 51.35 A (ab **) |
| Cap | 6.84 A (e **) | 4.65 A (ab *) | 45.30 A (ab) | 59.91 A (a **) |
Publisher’s Note: MDPI stays neutral with regard to jurisdictional claims in published maps and institutional affiliations. |
© 2021 by the authors. Licensee MDPI, Basel, Switzerland. This article is an open access article distributed under the terms and conditions of the Creative Commons Attribution (CC BY) license (https://creativecommons.org/licenses/by/4.0/).
Share and Cite
Selem, E.; Alp, Y.; Sensoy, S.; Uzun, Y.; Cavusoglu, S.; Karatas, N.; Ercisli, S.; Yilmaz, N.; Ekiert, H.; Elansary, H.O.; et al. Biochemical and Morphological Characteristics of Some Macrofungi Grown Naturally. J. Fungi 2021, 7, 851. https://doi.org/10.3390/jof7100851
Selem E, Alp Y, Sensoy S, Uzun Y, Cavusoglu S, Karatas N, Ercisli S, Yilmaz N, Ekiert H, Elansary HO, et al. Biochemical and Morphological Characteristics of Some Macrofungi Grown Naturally. Journal of Fungi. 2021; 7(10):851. https://doi.org/10.3390/jof7100851
Chicago/Turabian StyleSelem, Ezelhan, Yekbun Alp, Suat Sensoy, Yusuf Uzun, Seyda Cavusoglu, Neva Karatas, Sezai Ercisli, Nurettin Yilmaz, Halina Ekiert, Hosam O. Elansary, and et al. 2021. "Biochemical and Morphological Characteristics of Some Macrofungi Grown Naturally" Journal of Fungi 7, no. 10: 851. https://doi.org/10.3390/jof7100851
APA StyleSelem, E., Alp, Y., Sensoy, S., Uzun, Y., Cavusoglu, S., Karatas, N., Ercisli, S., Yilmaz, N., Ekiert, H., Elansary, H. O., & Szopa, A. (2021). Biochemical and Morphological Characteristics of Some Macrofungi Grown Naturally. Journal of Fungi, 7(10), 851. https://doi.org/10.3390/jof7100851