Article

Local-Level Genetic Diversity and Structure of Matsutake Mushroom (Tricholoma matsutake) Populations in Nagano Prefecture, Japan, Revealed by 15 Microsatellite Markers

1
Asian Natural Environmental Science Center, the University of Tokyo, 1-1-8 Midori-cho, Nishitokyo, Tokyo 188-0002, Japan
2
Nagano Prefectural College of Forestry, 4385-1 Shinkai, Kiso, Kiso-gun, Nagano 397-0002, Japan
3
Graduate School of Agricultural and Life Sciences, the University of Tokyo, 1-1-1 Yayoi, Bunkyo-Ku, Tokyo 113-8657, Japan
*
Author to whom correspondence should be addressed.
J. Fungi 2017, 3(2), 23; https://doi.org/10.3390/jof3020023
Submission received: 4 April 2017 / Revised: 27 April 2017 / Accepted: 8 May 2017 / Published: 11 May 2017

Abstract

:
The annual yield of matsutake mushrooms (Tricholoma matsutake) has consistently decreased in Japan over the past few decades. We used 15 polymorphic and codominant simple sequence repeat (SSR) markers, developed using next-generation sequencing, to carry out genetic analyses of 10 populations in Nagano, Japan. Using the SSRs, we identified 223 genotypes, none of which was observed in more than one population. The mean expected heterozygosity and standardized allelic richness values were 0.67 and 4.05, respectively. Many alleles appeared in only one of the 10 populations; 34 of these private alleles were detected with a mean number per population of 3.4. The fixation index (FST) and standardized genetic differentiation (GST) values were 0.019 and 0.028, respectively. Analysis of molecular variance (AMOVA) showed that the contribution of among population, among genets within a population, and within genets variation to the total variation was 2.91%, 11.62%, and 85.47%, respectively, with genetic differentiation being detected for all sources. Twenty-eight of 45 pairwise FST values were significantly larger than zero, and no pattern of isolation by distance was detected among the 10 populations. Bayesian-based clustering did not show clear differences among populations. These results suggest that reestablishment of a colony would be best accomplished by transplantation within a field; if this is not possible, then transplantation from within several dozen kilometers will cause little damage to the original population genetic structure.

Graphical Abstract

1. Introduction

In Japan, matsutake mushrooms (Tricholoma matsutake (S. Ito et S. Imai) Singer) are a very popular and expensive food item. This mushroom can only be harvested from the wild, since the artificial cultivation of matsutake mushrooms has not yet been successful. The annual yield of matsutake mushrooms has declined steadily in recent decades after peaking in the 1950s [1]. Thus, resource control of T. matsutake is an urgent matter.
Management strategies to increase matsutake mushroom yield have been suggested by previous studies and by empirical observation [2]. However, a different approach is required when reintroducing matsutake mushrooms into a field from which they have been lost, since this necessitates the transplantation of individuals from other locations. Optimally, this transplantation would be conducted without disturbing the underlying genetic structure, because indigenous species often contain a spatial genetic structure in their wild populations linked to the specific local ecosystems. Thus, information on genetic diversity, structure, and connectivity is essential to the effective maintenance of matsutake mushroom populations.
Geographic genetic similarity and differentiation of matsutake mushrooms in Asia has been reported at a nationwide scale [3,4,5]. Murata et al. [4] comprehensively assessed genetic differentiation in matsutake mushrooms from Japan and other Asian countries. At a fine scale, the expanding process of matsutake mushrooms has been researched by clarifying the distribution of genets within fairy rings, which are called shiro [6], and new shiro establishment [7]. However, there is almost no information on the genetic structure and connectivity of matsutake mushroom populations at a local level in Japan. Microsatellite (SSR: simple sequence repeat) markers for polymorphism analysis are known to be effective for analyzing the reproductive mechanisms of many organisms. Nuclear SSR markers with high polymorphism might also contribute to the analysis of parenthood, kinship, genetic structure, and population genetics [8,9,10,11,12,13]. Nagano prefecture is one of the most productive areas for matsutake mushroom growth and has recently had the highest annual yield of this product in Japan (Forestry Agency, Ministry of Agriculture, Forestry and Fisheries: Japan Annual report on trends in forest and forestry in Japan, Fiscal year 2009 (Summary)). This study was initiated to gain a better understanding of the genetic structure and genetic connectivity of matsutake mushroom populations at a local level. To this end, we investigated nuclear SSR polymorphisms in populations primarily in Nagano, Japan. Such genetic analyses will provide fundamental information for the development of a successful resource management strategy for matsutake mushrooms.

2. Materials and Methods

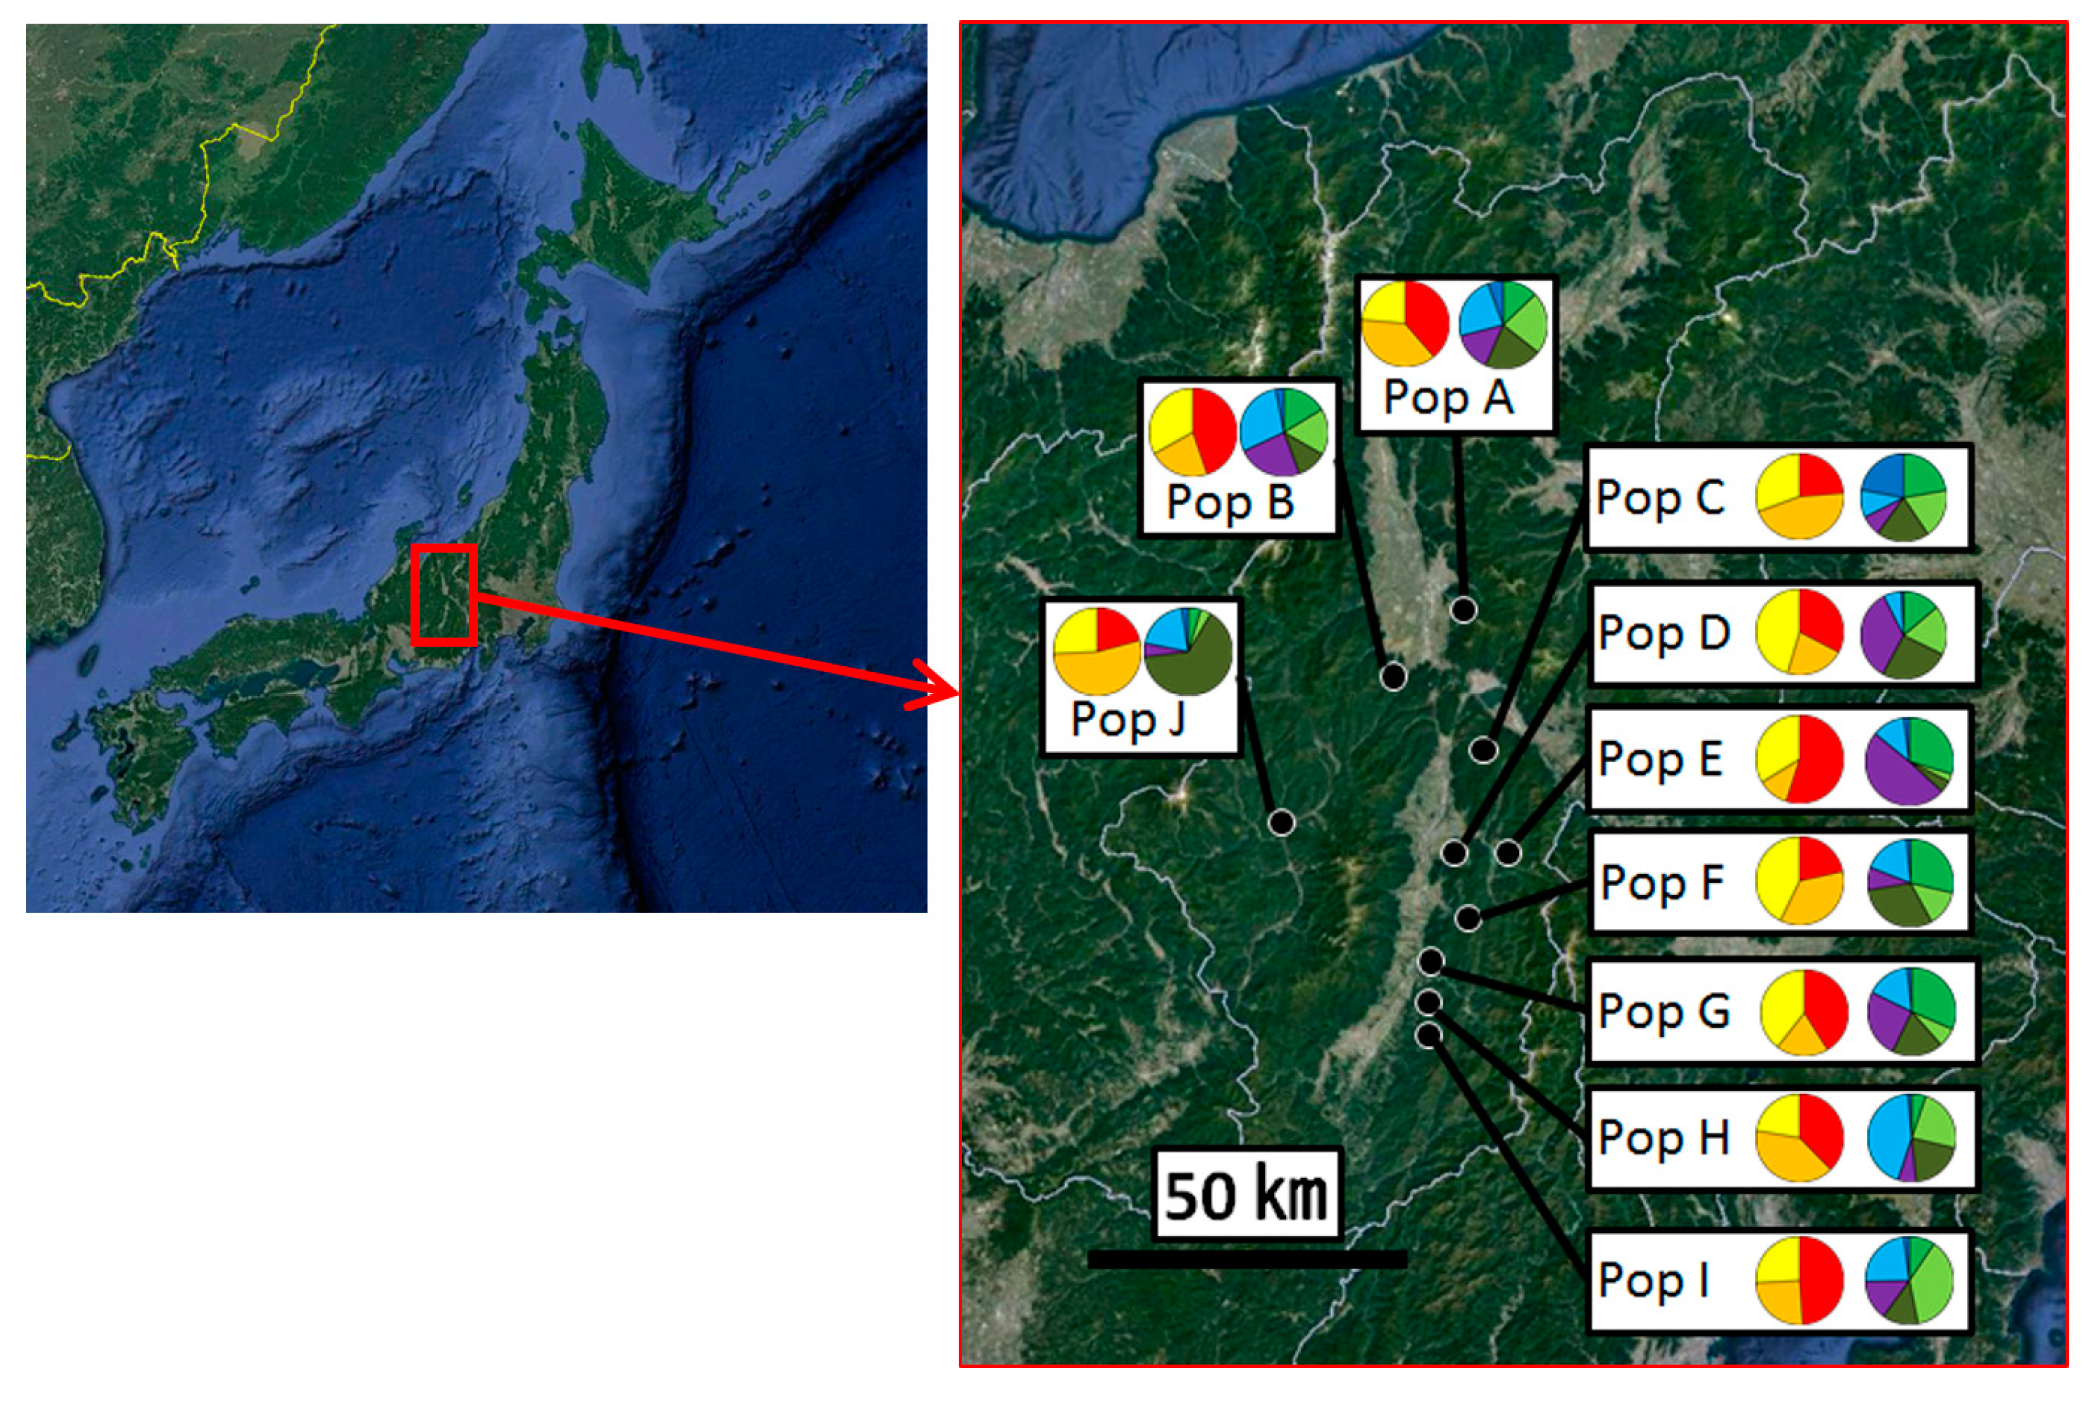
2.1. Sample Collection

Samples of matsutake mushrooms were collected from 10 different areas in Nagano prefecture, Japan. A population was defined as a sample set collected from the same area; thus, we used 10 populations in this study and the distances between populations were from 3.3 (Populations G–H and H–I) to 53.1 (Populations A–I) km (Figure 1). We asked colleagues, who are owners of each area and have been collecting matsutake mushrooms for more than a dozen years, to collect stipes without worm-eaten from different genets, which they estimated, and to store the stipes separately in bags and keep them frozen until analysis.

2.2. Marker Development

New microsatellite markers (simple sequence repeat (SSR) markers) for T. matsutake were developed using next-generation sequencing as described by Kurokochi et al. [14,15]. Mushroom stipes without worm-eaten were collected, and pieces of tissue of approximately 125 mm3 (5 mm × 5 mm × 5 mm) were obtained. In order to get enough DNA with high quality, genomic DNAs were extracted from these pieces of tissue using a NucleoSpin® Plant II kit (TaKaRa Bio, Kyoto, Japan). Fragmented DNA was produced from the extracted DNA [14,15]. DNA fragments, approximately 200 bp in length, were sequenced using an Ion ProtonTM Sequencer (Applied Biosystems, Waltham, MA, USA). The sequences were collected as described by Kurokochi et al. [16] and Sugiura et al. [17]. SSRs were derived using MISA software (http://pgrc.ipk-gate rsleben.de/misa/); 15 regions were selected and Primer3Plus software [18] was used to design primers for these SSRs (Supplementary 1).

2.3. Genotyping

In order to extract DNA cheaply from the frozen stipes collected from the different areas, the CTAB method [19] was used. To amplify DNA fragments using the designed markers, an economical variation of the method for amplifying fluorescently-labeled PCR fragments was used [20]; in this method, the fluorescently-labeled primers were replaced by non-labeled primers with a U19 (5′-GGTTTTCCCAGTCACGACG-3′) or M13 (5′-CAGGAAACAGCTATGAC-3′) sequence. PCR was performed in a final volume of 5 µL containing 2× Type-it multiplex PCR master mix (Qiagen, Tokyo, Japan), 0.4 µM reverse primer, 0.1 µM forward primer with a U19 or M13 tail, 0.4 µM fluorescently-labeled U19 or M13, and 5–100 ng genomic DNA. The PCR conditions were as follows: 95 °C for 5 min; 30 cycles of 95 °C for 30 s, 60 °C for 90 s, 72 °C for 30 s; and 60 °C for 30 min. The PCR products were electrophoresed using an ABI 3130 sequencer (Applied Biosystems) and their fragment sizes were detected automatically using GeneMapper software (Applied Biosystems). Genotypes for each sample were then determined from the 15 SSR marker dataset. If the combined exclusion probability of identity (pID) values calculated for two arbitrary samples by CERVUS ver. 3.0.3 [21] were less than 0.001, the two samples were considered to have the same genotype, indicating that they were produced from the same genet.

2.4. Statistical Analysis

After removing clonal replicates from each population, the following statistical analyses were conducted. For each population, Nei’s unbiased expected heterozygosity (HE; [22]), allelic richness (AR; [23]), and inbreeding coefficients (FIS) were calculated using FSTAT [24]; this program was also used to test the significance of FIS deviations from zero by 1000 random permutations. In addition, the number of private alleles, which were detected from only one population, over markers (PA) was calculated for each population using GenAlEx version 6 software [25]. Nei’s standard genetic distance with sample size correction (FST) and standardized genetic differentiation between populations (GST) were also calculated using FSTAT.
Assuming that the populations belonged to one group, the contributions of among population, among genets within population, and within genets variation to the total variation were calculated by analysis of molecular variation (AMOVA) using the software Arlequin 2.0 [26]. AMOVA was conducted on the dataset reduced to one copy of each genotype. The probabilities of variance for the components were estimated from 1000 random permutations. In addition, genetic differentiation among populations was evaluated using pairwise FST values calculated with Arlequin (1000 random permutations).
Patterns of isolation-by-distance (IBD) were evaluated using a Mantel test between FST/(1 − FST) (FST values were calculated by FSTAT) and the natural logarithm of geographic distance, using GenAlEx version 6 software [25]. The significance of the Mantel test was estimated using 999 permutations.
Bayesian-based clustering analysis was used for population partitioning with STRUCTURE ver. 2.3.2.1 [27]. After performing 50 independent runs of ln(K) for K = 1–11 using the admixture model with allelic frequencies correlated among populations and ignoring prior population information, with 50,000 MCMC (Markov chain Monte Carlo methods) repetitions and a burn-in period of 50,000 iterations, the optimal value of K was estimated by calculating ΔK [28] to identify the top level in the hierarchical structure.

3. Results

3.1. Genotypes and Genetic Diversity in Matsutake Mushroom Populations

In total, 328 matsutake mushroom samples were analyzed from the 10 populations; 223 genotypes were detected (Table 1) (Supplementary 2). All genotypes grouped within the population from which they were sampled. HE, AR, FIS, and PA values for each population are presented in Table 1. The AR values are standardized to a sample size of five genotypes per population. The FIS values of three populations (Populations F, G, and H) deviated significantly from zero (p < 0.05). Private alleles were detected in all populations; in total, 34 private alleles were identified (Table 1). The FST and GST values were 0.019 and 0.028, respectively.

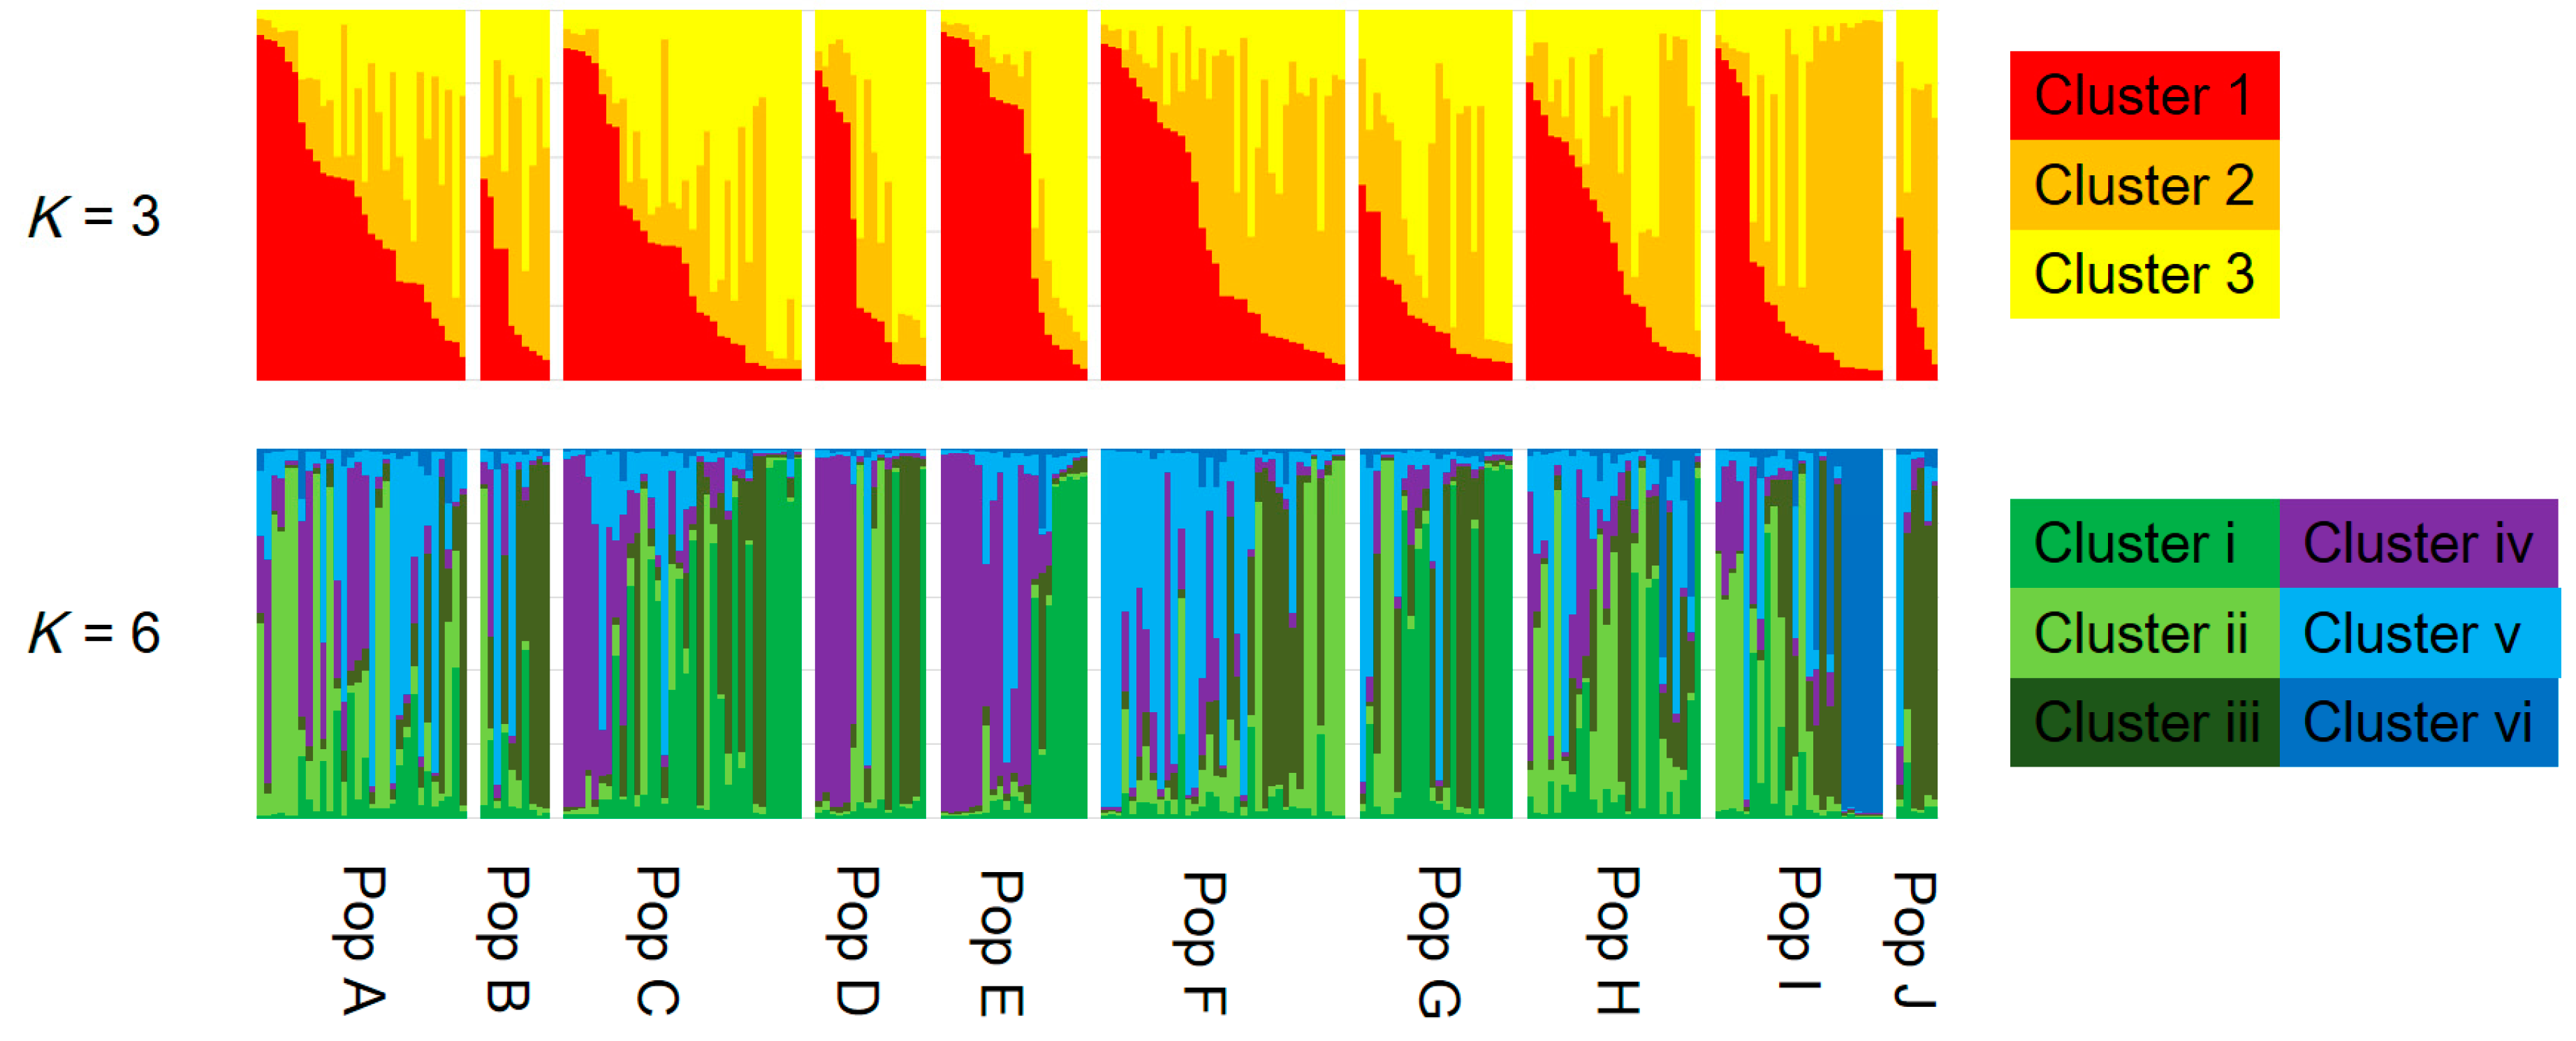
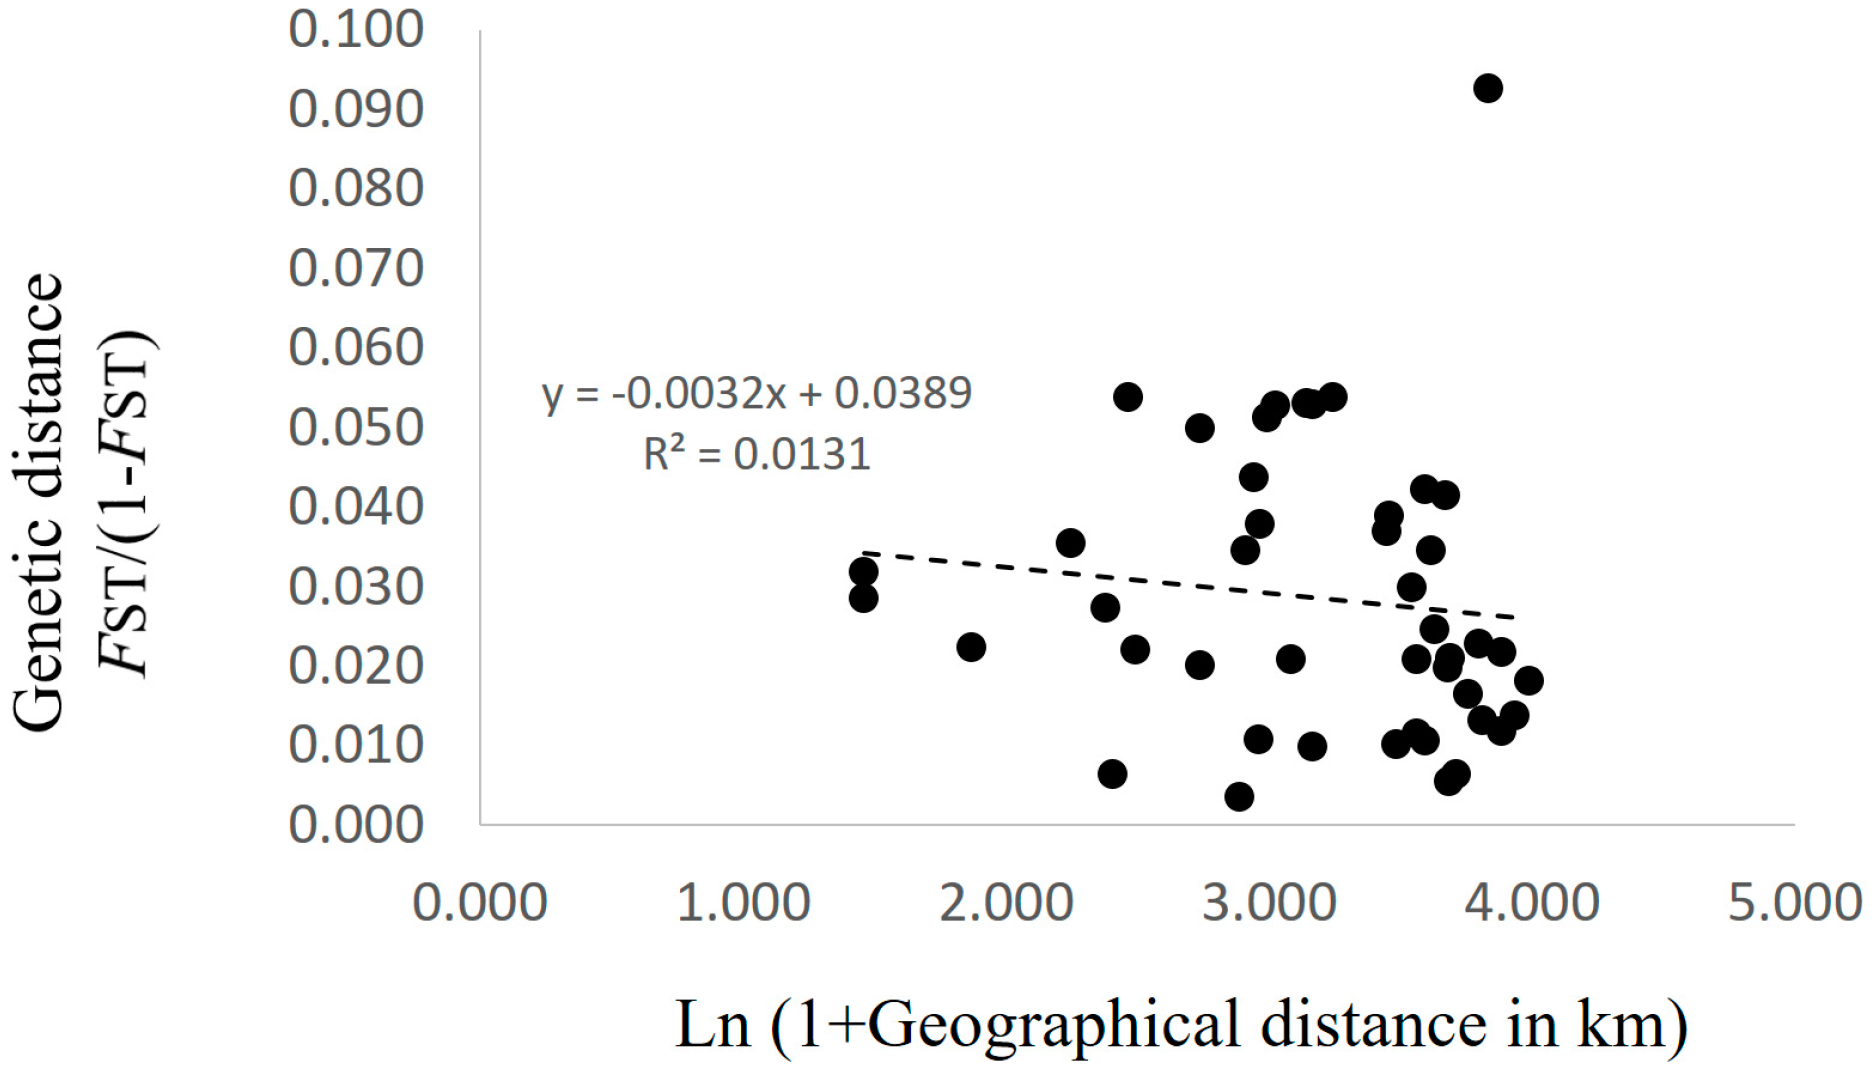
3.2. Genetic Structure and Connectivity

AMOVA showed that the contributions of among population, among genets within population, and within genets variation to the total variation were 2.91%, 11.62%, and 85.47%, respectively, with genetic differentiation being detected for all sources (p < 0.001; Table 2). Pairwise FST values between populations were calculated for the 223 genotypes. Twenty-eight of 45 values did not differ from zero at a significance level of 0.05 (Table 3). No pattern of IBD was detected among the 10 populations (Figure 2). In the structure analysis, the highest and second highest peaks of ΔK were three (ΔK = 3.0; clusters 1, 2, and 3) and six (ΔK = 2.0; clusters i, ii, iii, iv, v, and vi) (Supplementary 3 and 4).

4. Discussion

Matsutake mushrooms (T. matsutake) are harvested in several Asian countries, including Japan, China, Korea, and Bhutan [1]. Past studies have demonstrated genetic differentiation of matsutake mushroom populations in these countries; these studies principally compared rDNAs, and only slight genetic variations were reported [3,5,29]. Considering that basidiospore dispersal is geographically limited and geographical distance between a novel genet and a parent genet was at most a dozen meters [7], the existence of genetic differentiation in matsutake mushrooms on an Asian scale is to be expected. Murata et al. [4] demonstrated clear genetic differentiation among matsutake mushrooms harvested in different Asian countries as well as the similarity of those harvested in Japan using retroelement-based DNA markers.
Xu et al. [30] reported a significant positive correlation between genetic distance and geographical distance among matsutake populations in southwestern China. They used 17 populations with two to 19 samples per population, and the geographic distance between each pair of populations ranged from a dozen to more than 1000 km [30]. In contrast, Lian et al. [6] reported no genetic differentiation among six populations in Iwate, Japan that were within 500 m of each other. In this study, the geographic distances among the 10 populations in Nagano prefecture ranged from 3.3 to 53.1 km, and no significant IBD was detected (Figure 2). Moreover, the Bayesian-based clustering analysis did not identify clear differences among populations (Figure 3). In addition, the standardized genetic values were not large, with FST = 0.019 and GST = 0.028. These results suggested that genets of T. matsutake are established by the long-distance dispersal of basidiospores. Although Narimatsu et al. [7] reported that geographical distance between a novel genet and a parent genet was at most a dozen meters at a fine-scale study within 500 m, our results did not deny the possibility that basidiospores of T. matsutake could travel for a longer distance at the scale of this study. Thus, in the prefecture scale in Japan, i.e., at the local scale, genetic distance might not be dependent on geographic distance. To determine the existence of increased genetic difference beyond prefecture boundaries, it will be necessary to investigate populations from different prefectures in the future.
The indexes we used to describe genetic diversity (HE, AR, and FIS) were in the same range in all 10 populations (Table 1). As our colleagues in Nagano prefecture collected consistent numbers of matsutake mushrooms annually from the fields where our samples were obtained, it is possible that these levels of genetic diversity represent the range required to maintain matsutake mushroom yields in Nagano.
Although there was no significant IBD in this study (Figure 2), some pairwise FST values were significantly larger than zero (Table 3) and AMOVA showed significant genetic differentiation among the populations (Table 2). In addition, several clusters obtained by Bayesian-based clustering methods centered on only a few populations; for example, cluster iv was mainly from Populations C, D, and E, while cluster vi was mainly from Population I (Figure 3). Interestingly, cluster vi was clearly genetically distant (Supplementary 4), indicating that those matsutake mushrooms derived from cluster vi might have high local endemism. Our results demonstrated that genetic differentiation could be detected among populations of matsutake mushrooms even within 3.3 km (Populations H–I) of each other (Table 3). In addition, private alleles were detected from all populations in Nagano. These results indicate that each population might be derived from different colonizing events or have a long history of establishment in each location.
If the considerable efforts of related research organizations lead to the establishment of transplantation methods for matsutake mushrooms, it will be important to conserve their genetic resources at a local level. The present study, which presents an example of genetic diversity at the local level in Nagano prefecture, demonstrates the genetic similarities and differences that need to be taken into account. Since each matsutake population includes its own genetic resources and history (Table 2 and Table 3), as indicated by the prevalence of private alleles (Table 1), individuals should be transplanted, if possible, from within the same field. However, if necessitated by the loss of all specimens and spores of matsutake mushrooms from a field, our results from Nagano prefecture suggest that transplantation from up to several dozen kilometers away will cause little damage to the original genetic structure, since significant IBD was not detected (Figure 2) and the clustering with STRUCTURE ver. 2.3.2.1 did not show the clear differences among populations (Figure 3) with the low values of FST and G′ST. In addition, for the sustainable harvesting of matsutake mushrooms, genetic diversity as described by HE, AR, and FIS (Table 1) could be a possible indicator to assess transplanted fields.
Considering these results, the reestablishment of a colony would be best accomplished by transplantation within a field; if this is not possible, then transplantation from within several dozen kilometers will cause little damage to the original population genetic structure.

Supplementary Materials

Supplementary materials can be found at www.mdpi.com/2309-608X/3/2/23/s1.

Acknowledgments

We thank Hirashima, Koizumi, Kurokochi, Kusama, Miyagai, Ogura, and Yasuhara for collecting mushrooms. This study was supported in part by a Grant-in-Aid for Young Scientists from the JSPS to Hiroyuki Kurokochi (16K20964). There was no additional external funding received for this study.

Author Contributions

Hiroyuki Kurokochi: collecting mushrooms, conducting next-generation sequencing (NGS) and genetic analyses, and writing paper; Shijie Zhang: collecting mushrooms and supporting genetic analysis; Yoshie Takeuchi: collecting mushrooms and advising background of this study; Engkong Tan and Shuichi Asakawa: supporting NGS analysis; and Chunlan Lian: supporting genetic analysis.

Conflicts of Interest

The authors declare no conflict of interest.

References

  1. Yamanaka, K.; Aimi, T.; Wan, J.; Cao, H.; Chen, M. Species of host trees associated with Tricholoma matsutake and close allies in Asia. Mushroom Sci. Biotechnol. 2011, 19, 79–87. [Google Scholar]
  2. Kobayashi, F.; Ito, T.; Fujita, H. Cultivation of Matsutake in field in Kyoto prefecture: Standards of selection for suitable site and controlling of environments. Jpn. Soc. For. Environ. 1980, 22, 1–7. [Google Scholar]
  3. Matsushita, N.; Kikuchi, K.; Sasaki, Y.; Guerin-Laguette, A.; Lapeyrie, F.; Vaario, L.M.; Suzuki, K. Genetic relationship of Tricholoma matsutake and T. nauseosum from the Northern Hemisphere based on analyses of ribosomal DNA spacer regions. Mycoscience 2005, 46, 90–96. [Google Scholar] [CrossRef]
  4. Murata, H.; Babasaki, K.; Saegusa, T.; Takemoto, K.; Yamada, A.; Ohta, A. Traceability of Asian Matsutake, specialty mushrooms produced by the ectomycorrhizal basidiomycete Tricholoma matsutake, on the basis of retroelement-based DNA markers. Appl. Environ. Microbiol. 2008, 74, 2023–2031. [Google Scholar] [CrossRef] [PubMed]
  5. Wan, J.; Kiuke, A.; Yamanaka, K.; Saotome, K.; Morinaga, T.; Tanaka, C.; Terashima, Y.; Aimi, T. Genetic diversity of Tricholoma matsutake and close allies associated with broad-leaved trees in Asia. Mushroom Sci. Biotechnol. 2012, 19, 167–174. [Google Scholar]
  6. Lian, C.; Narimatsu, M.; Nara, K.; Hogetsu, T. Tricholoma matsutake in a natural Pinus densiflora forest: Correspondence between above-and below-ground genets, association with multiple host trees and alteration of existing ectomycorrhizal communities. New Phytol. 2006, 171, 825–836. [Google Scholar] [CrossRef] [PubMed]
  7. Narimatsu, M.; Koiwa, T.; Sakamoto, Y.; Natsume, S.; Kurokochi, H.; Lian, C.; Nakajima, Y.; Nakade, K.; Yoshida, K.; Tawaraya, K. Estimation of novel colony establishment and persistence of the ectomycorrhizal basidiomycete Tricholoma matsutake in a Pinus densiflora forest. Fungal Ecol. 2016, 24, 35–43. [Google Scholar] [CrossRef]
  8. Kurokochi, H.; Toyama, K.; Hogetsu, T. Regeneration of Robinia pseudoacacia riparian forests after clear-cutting along the Chikumagawa River in Japan. Plant Ecol. 2010, 210, 31–41. [Google Scholar] [CrossRef]
  9. Kurokochi, H.; Hogetsu, T. Fine-scale initiation of non-native Robinia pseudoacacia riparian forests along the Chikumagawa River in central Japan. J. Ecol. Environ. 2014, 37, 21–29. [Google Scholar] [CrossRef]
  10. Kurokochi, H.; Saito, Y.; Ide, Y. Genetic structure of the introduced heaven tree (Ailanthus altissima) in Japan: Evidence for two distinct origins with limited admixture. Botany 2014, 93, 133–139. [Google Scholar] [CrossRef]
  11. Chuman, M.; Kurokochi, H.; Saito, Y.; Ide, Y. Expansion of an invasive species, Ailanthus altissima, at a regional scale in Japan. J. Ecol. Environ. 2015, 38, 47–56. [Google Scholar] [CrossRef]
  12. Arriesgado, D.M.; Kurokochi, H.; Nakajima, Y.; Matsuki, Y.; Uy, W.H.; Fortes, M.D.; Lian, C. Population genetic diversity and structure of a dominant tropical seagrass, Cymodocea rotundata, in the Western Pacific region. Mar. Ecol. 2016, 37, 786–800. [Google Scholar] [CrossRef]
  13. Kurokochi, H.; Matsuki, Y.; Nakajima, Y.; Fortes, M.D.; Uy, W.H.; Campos, W.L.; Lian, C. A baseline for the genetic conservation of tropical seagrasses in the western North Pacific under the influence of the Kuroshio Current: The case of Syringodium isoetifolium. Conserv. Genet. 2016, 17, 103–110. [Google Scholar] [CrossRef]
  14. Kurokochi, H.; Tan, E.; Asakawa, S.; Sukartiningsih Saito, Y.; Ide, Y. Development of 16 microsatellite markers in Eusideroxylon zwageri by next-generation sequencing. Conserv. Genet. Resour. 2014, 6, 593–595. [Google Scholar] [CrossRef]
  15. Kurokochi, H.; Tan, E.; Asakawa, S.; Lian, C. Development of 18 microsatellite markers in Pieris japonica, a poisonous tree insulated from the browsing pressure of herbivores, using a next-generation sequencer. J. For. Res. 2015, 20, 244–247. [Google Scholar] [CrossRef]
  16. Kurokochi, H.; Nurtjahjaningsih, I.L.G.; Tan, E.; Asakawa, S.; Saito, Y.; Ide, Y. Development of polymorphic chloroplast DNA markers for the endangered tree Eusideroxylon zwageri through chloroplast isolation and next-generation sequencing. Conserv. Genet. Resour. 2015, 7, 845–850. [Google Scholar] [CrossRef]
  17. Sugiura, N.; Kurokochi, H.; Tan, E.; Asakawa, S.; Sato, N.; Saito, Y.; Ide, Y. Development of 13 polymorphic chloroplast DNA markers in Quercus gilva, a regionally endemic species in Japan. Conserv. Genet. Resour. 2014, 6, 961–965. [Google Scholar] [CrossRef]
  18. Untergasser, A.; Nijveen, H.; Rao, X.; Bisseling, T.; Geurts, R.; Leunissen, J.A. Primer3Plus, an enhanced web interface to Primer3. Nucleic Acids Res. 2007, 35, W71–W74. [Google Scholar] [CrossRef] [PubMed]
  19. Kurokochi, H.; Saito, Y.; Chuman, M.; Ide, Y. Low chloroplast diversity despite of phylogenetically divergent haplotypes in Japanese populations of Ailanthus altissima (Simaroubaceae). Botany 2013, 91, 148–154. [Google Scholar] [CrossRef]
  20. Schuelke, M. An economic method for the fluorescent labeling of PCR fragments. Nat. Biotechnol. 2000, 18, 233–234. [Google Scholar] [CrossRef] [PubMed]
  21. Marshall, T.C.; Slate, J.; Kruuk, L.E.B.; Pemberton, J.M. Statistical confidence for likelihood-based paternity inference in natural populations. Mol. Ecol. 1998, 7, 639–655. [Google Scholar] [CrossRef] [PubMed]
  22. Nei, M. Molecular Evolutionary Genetics; Columbia University Press: New York, NY, USA, 1987. [Google Scholar]
  23. El Mousadik, A.; Petit, R.J. High level of genetic differentiation for allelic richness among populations of the argan tree (Argania spinosa (L.) Skeels) endemic to Morocco. Theor. Appl. Genet. 1996, 92, 832–839. [Google Scholar] [CrossRef] [PubMed]
  24. Goudet, J. FSTAT, A Program to Estimate and Test Gene Diversities and fixation Indices Version 2.9.3. Available online: https://www2.unil.ch/popgen/softwares/fstat.htm (accessed on 1 January 2017).
  25. Peakall, R.; Smouse, P.E. GenAlEx 6: Genetic analysis in Excel. Population genetic software for teaching and research. Mol. Ecol. Notes 2006, 6, 288–295. [Google Scholar] [CrossRef]
  26. Excoffier, L.; Laval, G.; Schneider, S. Arlequin ver. 3.0: An integrated software package for population genetics data analysis. Evol. Bioinform. Online 2005, 1, 47–50. [Google Scholar]
  27. Pritchard, J.K.; Stephens, S.; Donnelly, P. Inference of population structure using multilocus genotype data. Genetics 2000, 155, 945–959. [Google Scholar] [PubMed]
  28. Evanno, G.; Regnaut, S.; Goudet, J. Detecting the number of clusters of individuals using the software Structure: A simulation study. Mol. Ecol. 2005, 14, 2611–2620. [Google Scholar] [CrossRef] [PubMed]
  29. Bao, D.; Koike, A.; Yao, F.; Yamanaka, K.; Aimi, T.; Kitamoto, Y. Analyses of the genetic diversity of matsutake isolates collected from different ecological environments in Asia. J. Wood Sci. 2007, 53, 344–350. [Google Scholar] [CrossRef]
  30. Xu, J.; Sha, T.A.O.; Li, Y.C.; Zhao, Z.W.; Yang, Z.L. Recombination and genetic differentiation among natural populations of the ectomycorrhizal mushroom Tricholoma matsutake from southwestern China. Mol. Ecol. 2008, 17, 1238–1247. [Google Scholar] [CrossRef] [PubMed]
Figure 1. Locations of populations where matsutake mushrooms were collected in Nagano prefecture, Japan (black-filled circles) and the results of Bayesian clustering analyses for K = 3 and K = 6 (pie charts). The population names correspond with Table 1. The colors of each cluster correspond with Figure 3. Original maps were obtained from Google Earth. Pop: population.
Jof 03 00023 g001
Figure 2. Relationship between the matrix of pairwise differentiation for FST/(1 − FST) and the matrix of the natural logarithm of geographic distance in the 10 populations in Nagano prefecture, Japan.
Jof 03 00023 g002
Figure 3. Assignment of each genotype (vertical bar) to genetic clusters 1, 2, and 3 in K =3, and clusters i, ii, iii, iv, v, and vi in K = 6 using a model-based Bayesian clustering method (STRUCTURE ver. 2.3.2.1). The population names correspond with those presented in Table 1.
Jof 03 00023 g003
Table 1. Baseline parameters of the 10 populations of matsutake mushrooms in Nagano prefecture, Japan, including sample sites, baseline data, and genetic diversity based on 15 nuclear microsatellite markers.
PopulationLongitudeLatitudeNGHEARPAFIS
Pop A138°02′36°11′42300.684.3040.090
Pop B137°54′36°05′21100.664.092−0.032
Pop C138°04′35°58′41340.704.1130.090
Pop D138°00′35°49′25160.603.6740.133
Pop E138°05′35°45′37210.663.7410.119
Pop F138°01′35°42′43350.684.2160.086 *
Pop G137°57′35°37′38220.674.0360.142 *
Pop H137°58′35°35′33250.674.0520.165 *
Pop I137°57′35°33′29240.694.1840.066
Pop J137°41′35°51′1960.654.142−0.006
(Total)(Average)
3282230.674.053.40.085
Note: N: number of samples analyzed, G: number of detected genotypes, HE: expected heterozygosity, AR: allelic richness (n = 5), PA: number of private alleles, FIS: inbreeding coefficient. Asterisks (*) indicate that the value of FIS is significantly higher than zero.
Table 2. Results of analysis of molecular variance (AMOVA) on the contribution of each source to total variation.
Source of VariationD.F.Sum of SquaresVariance ComponentsPercentage of Variation
Among populations944.50.06 *2.91
Among genets within populations213484.70.24 *11.62
Within genets233399.01.79 *85.47
Total445928.22.09100
D.F.: degree of freedom, Asterisks (*): p < 0.001.
Table 3. Pairwise FST values between 10 populations of matsutake mushrooms.
PopulationPop APop BPop CPop DPop EPop FPop GPop HPop IPop J
Pop A −0.0030.0120.0550.0450.0030.0010.0150.0200.037
Pop B 0.0400.0880.0320.0170.0080.0190.0270.074
Pop C 0.0580.0600.0150.0090.0360.0200.023
Pop D 0.0850.0480.0480.0700.0970.095
Pop E 0.0430.0530.0290.0610.127
Pop F 0.0000.0250.0330.036
Pop G 0.0190.0070.029
Pop H 0.0380.081
Pop I 0.040
Pop J
Bold: values significantly higher than 0 (α = 0.05).

