Article

Distinction Between Aspergillus oryzae and Aflatoxigenic Aspergillus flavus by Rapid PCR Method Based on the Comparative Sequence Analysis of the Aflatoxin Biosynthesis Gene Cluster


School of Systems Biomedical Science, Soongsil University, Seoul 06978, Republic of Korea
*
Author to whom correspondence should be addressed.
J. Fungi 2026, 12(1), 10; https://doi.org/10.3390/jof12010010

Submission received: 21 November 2025 / Revised: 12 December 2025 / Accepted: 20 December 2025 / Published: 23 December 2025
(This article belongs to the Section Fungal Genomics, Genetics and Molecular Biology)

Abstract

Aspergillus oryzae and Aspergillus flavus are closely related species within the Aspergillus section Flavi, sharing approximately 99.5% genomic similarity. Despite this similarity, they differ markedly in their ability to produce aflatoxin, a carcinogenic mycotoxin synthesized by the aflatoxin biosynthesis gene cluster (ABGC). Species and strains included within section Flavi display diverse deletion patterns in the ABGC at the sequence level. In this study, we performed an in-depth comparative analysis of the ABGC of 30 strains belonging to section Flavi, including isolates obtained from nuruk. The analysis revealed that A. oryzae exhibits distinct large-scale or locus-specific deletions in the ABGC compared to other related species. Based on these unique deletion patterns, we designed four primer sets to distinguish A. oryzae from A. flavus by comparing the sizes of PCR amplicons. Application of these primer sets to nuruk-derived isolates enabled successful species differentiation with 92% accuracy. To further validate this method, in silico PCR analysis was conducted using publicly available genomes of A. oryzae (116) and A. flavus (482), confirming that the developed biomarkers could consistently distinguish between the two close species. The primer sets are expected to serve as a rapid, accurate, and practical method for distinguishing A. oryzae from A. flavus.

1. Introduction

Aspergillus section Flavi comprises 34 species that are morphologically and phylogenetically related and are classically divided into two groups based on their effects on food and human health [1,2,3,4]. The first group includes non-aflatoxigenic species such as Aspergillus oryzae and Aspergillus sojae, which have been domesticated and traditionally used in East Asia for the production of fermented foods and beverages [5,6,7]. In particular, A. oryzae is industrially important for its production of catalytic enzymes such as amylase and has been designated as “generally recognized as safe (GRAS)” by the U.S. Food and Drug Administration (FDA) and the World Health Organization (WHO), underscoring its broad industrial utility [8,9,10]. In contrast, the second group consists of aflatoxigenic species such as Aspergillus flavus and Aspergillus parasiticus, which produce carcinogenic aflatoxins that contaminate agricultural products and food products, posing significant public health concerns [11,12,13,14]. In addition to aflatoxin-related toxicity, A. flavus is recognized as one of the world’s most problematic fungal pathogens, causing invasive aspergillosis in humans and opportunistic infections in major economic crops both pre- and post-harvest [15,16,17].
Precise identification of Aspergillus section Flavi at the species level is critical because it includes both non-aflatoxigenic GRAS-certified species used in the food industry and aflatoxin-producing species threatening food safety [3,18,19,20,21,22]. Molecular biological analyses, including marker sequence comparison and genomic polymorphism assessments, have been used for this purpose [3,23]. However, these approaches generally distinguish between A. flavus/A. oryzae group and A. parasiticus/A. sojae group, but are still inadequate for distinguishing A. oryzae from A. flavus [24,25,26]. A. oryzae and A. flavus, two representative species of Aspergillus section Flavi with opposite impacts on the food industry, share nearly identical morphological traits and differ by only 0.5% (approximately 200 kb) of their genomic sequences [27,28,29]. Distinguishing the two species is difficult using only mycological or traditional molecular approaches, and therefore requires an integrated analysis combining morphological comparison, molecular genetic identification, phylogenetic analysis, and aflatoxin production assessment [4,30,31].
Although A. oryzae and A. flavus share a high degree of genetic similarity, their aflatoxin-producing abilities differ fundamentally. For this reason, numerous studies have been conducted to elucidate the genetic basis for these differences in toxin production through genetic analysis of the aflatoxin biosynthesis gene cluster (ABGC) [27,32,33]. The ABGC comprises 34 afl genes involved in the aflatoxin biosynthetic pathway or in adjacent sugar utilization, organized within an approximately 75 kb of DNA region at the terminus of chromosome 3 in Aspergillus section Flavi [34,35]. Comparative genomic analyses of the ABGC in A. oryzae and A. flavus have revealed strain-specific deletions at both gene and nucleotide levels across strains [25,36,37]. In particular, A. flavus exhibits deletions within the aflU (cypA)-aflF (norB) genes that are 0.8 to 1.5 kb shorter than the corresponding region in G-type aflatoxin-producing A. parasiticus [38,39,40]. Likewise, A. oryzae exhibits unidirectional large deletions with various breakpoints across strains, resulting in partial retention of aflatoxin-related genes yet loss of toxin production capacity [41,42,43]. Phylogenetic analyses of ABGC sequences further suggest that A. oryzae is phylogenetically closer to non-aflatoxigenic A. flavus than to aflatoxigenic A. flavus, implying that the most recent ancestor of A. oryzae diverged from a non-aflatoxigenic A. flavus [44,45]. Nonetheless, although these studies have attempted to distinguish between A. oryzae and A. flavus by large-scale polymerase chain reaction (PCR) and sequencing of a few selected genes, a suitable set of genes to distinguish both species has not yet been found [30,41,46]. Therefore, the development of precise markers and concise methods is essential for differentiating these closely related species for reliable industrial application of beneficial strains and food quality assurance [47,48].
In our previous studies, we have performed comparative genomic analyses of 30 representative species belonging to Aspergillus section Flavi, including A. oryzae and A. flavus strains isolated from nuruk, a traditional Korean fermentation starter [49,50,51]. Through these analyses based on the sequence level, we found the strain-specific deletion patterns within the ABGC, providing the basis for the present study. Based on the results, we aimed to design the primer sets to distinguish A. oryzae from A. flavus by utilizing the differences in specific gene sequences within the ABGC. To evaluate the diagnostic potential of these primers, we performed PCR analysis on 108 A. oryzae strains isolated from nuruk. In addition, we downloaded 116 genomes of A. oryzae and 482 genomes of A. flavus registered in GenBank and AflaPan [52] and performed in silico PCR analysis using the designed primers, and confirmed that these primers could distinguish between the two highly similar species. This study was conducted to contribute to the development of a rapid and highly accurate identification method for distinguishing between A. flavus strains that produce aflatoxins and threaten food safety from A. oryzae, which is recognized as GRAS, by utilizing the results of more sophisticated and in-depth comparative genomic analysis.

2. Materials and Methods

2.1. Comparison of ABGC Genes of 30 Strains of Aspergillus Section Flavi

The whole genome sequences of 30 strains of Aspergillus section Flavi, previously analyzed in a comparative genome study [49], were retrieved from GenBank, and in this study, a comparative analysis of the ABGC sequences was performed. The ABGC sequences of 30 strains of Aspergillus section Flavi were obtained via BLASTn (NCBI, https://blast.ncbi.nlm.nih.gov/Blast.cgi, accessed on 1 November 2024) [53], using the annotation information of ABGC of A. flavus NRRL3357 as a reference (GCA_014117465.1). The 35 ABGC genes analyzed in this study consist of 5 sugar utilization-related genes (aflYa to aflYe) [54,55], 29 genes associated with aflatoxin biosynthesis (aflA to aflY, aflCa, aflLa, aflMa, and aflNa) [56], and AFLA_13945 gene (EDD51179.1), a hypothetical protein-coding gene located in the 3′ end of ABGC. The ABGC sequences of all strains were multiply aligned using the DIALIGN program v2.2.2 [57], and information on frameshifts was obtained using MACSE v1 [58]. The average nucleotide identity (ANI) values among the ABGC sequences of 30 strains of Aspergillus section Flavi were calculated using OrthoANI v0.6.0 [59]. A phylogenetic tree based on ANI values was constructed using the hclust function of the R program v4.3.2.

2.2. PCR Analysis of A. oryzae and A. flavus Strains Using Newly Designed Four Sets of Primers Targeting ABGC

Four primer sets were designed to target four regions within the ABGC, namely YE1–YE2, CT1–CT2, UF1–UF2, and E1–E2. Each primer targeted corresponding positions: positions 304–621 of aflYe gene (start region), positions 70,774–72,500 of the aflC and aflT genes (CT region), positions 74,498–76,669 of the aflU and aflT genes (UF region), and positions 77,621–77,942 of the AFLA_13945 (end region), the terminal ABGC gene (Table 1). The annealing temperatures for each primer set were 64.8, 65.2, 64.9, and 64.2 °C, respectively. Each primer was designed to target conserved regions of A. oryzae and A. flavus, but with 1–4 sequence variations per species (Table S1).
One hundred seventeen strains that formed green spores were isolated from nuruk, and identified by molecular methods using internal transcribed spacer (ITS) region, and confirmed with high-performance liquid chromatography (HPLC) analysis for aflatoxin production [51,60,61]. Aflatoxin production of nuruk strains was measured by culturing them on rice medium at 25 °C for 21 days. Aflatoxin was extracted from the rice medium using an immunoaffinity column (AflaTest®WB; VICAM, A Waters Business, San Marcos, CA, USA). The final concentration of aflatoxin was measured by HPLC analysis using a 1200 Infinity Series (Agilent Technologies, Santa Clara, CA, USA) on a ZORBAX Eclipse Plus C18 column (4.6 × 150 mm, 3.5 µm). HPLC analysis through a C18 column was performed at a flow rate of 1.0 mL/min using an isocratic mobile phase composed of water, methanol, and acetonitrile in the ratio of 50:40:10 (v/v/v). Aflatoxins were detected using a fluorescent detector with an excitation wavelength of 360 nm and emission wavelength of 440 nm.
We performed PCR analysis using four newly designed primer sets on 108 strains of A. oryzae and 9 strains of A. flavus isolated from nuruk and 8 standard strains of Aspergillus section Flavi. PCR reactions were carried out at a final volume of 20 µl, containing 20 to 50 ng of genomic DNA of each strain and 20 pmol of each primer. The reactions were conducted under the following conditions: 94 °C for 4 min, followed by 30 cycles of 94 °C for 1 min, 65 °C for 1 min, and 72 °C for 1 min, and a final extension at 72 °C for 10 min. The amplified PCR amplicons were confirmed by electrophoresis using a 1.0% agarose gel.

2.3. Comparison of laeA Gene and Translated LaeA Sequences

Draft annotation for laeA gene was conducted on 116 genomes of A. oryzae and 257 genomes of A. flavus obtained from the NCBI GenBank database and 225 genomes of A. flavus from AflaPan [52] using the Funannotate pipeline v1.8.15 [62]. The nucleotide sequence of laeA gene and the amino acid sequence of LaeA for each strain were subjected to BLAST to detect sequence variations. The laeA gene sequences showing sequence variations were subjected to multiple alignment using MAFFT v7.407 [63,64], and the positions of sequence variations and mutation cases were examined.

2.4. In Silico PCR Analysis Using ABGC-Targeting Primer Sets

To perform in silico PCR (iPCR) analysis using four primer sets, we acquired whole genome sequences of 116 strains of A. oryzae and 257 strains of A. flavus registered in GenBank. In addition, we independently acquired the newly sequenced genome sequences of 225 strains of A. flavus from the AflaPan [52]. And then, we performed iPCR analysis using Fasta v36.3 [65] to determine the target positions and expected PCR amplicon sizes for a total of 116 genomes of A. oryzae and 482 genomes of A. flavus. To confirm the sequence variations of the ABGC-targeting primer sets, we extracted the aligned sequences from 116 genome of A. oryzae and 482 genomes of A. flavus with newly designed primer sets, and conducted multiple alignment using MAFFT v7.407 [63,64]. Finally, the alignment of the four primer sets with the genomes of A. oryzae and A. flavus was conducted using BLAST [66] to validate the expected iPCR amplicon size and sequence variations within the primer sets.

3. Results

3.1. Comparison of ABGC Among 30 Strains of Aspergillus Section Flavi

We acquired the ABGC sequences from the genomic data of 30 strains of Aspergillus section Flavi and examined the gene deletions and pseudogenization across 35 ABGC genes through additional annotation (Table S2). The number of ABGC genes varied among A. oryzae and A. flavus strains, whereas A. sojae and A. parasiticus possessed the whole set of 35 genes. Nine strains of A. oryzae possessed all 35 ABGC genes, including 6 to 11 pseudogenes. In contrast, ten A. flavus strains and two A. oryzae strains each harbored 33 to 35 ABGC genes, with the aflT, aflU, and aflF genes exhibiting diverse statuses, such as intact, deleted, or pseudogene. The remaining four strains of A. oryzae and A. flavus exhibited unidirectional large deletions starting at the 3′ end of ABGC. Specifically, A. oryzae KBP3 and BCC7052 retained 21 genes due to deletions spanning aflE to AFLA_13945, A. oryzae RIB326 retained 10 genes due to deletions from aflQ to AFLA_13945, and A. flavus 26-3 contained only 4 genes resulting from deletions extending from aflYa to AFLA_13945.
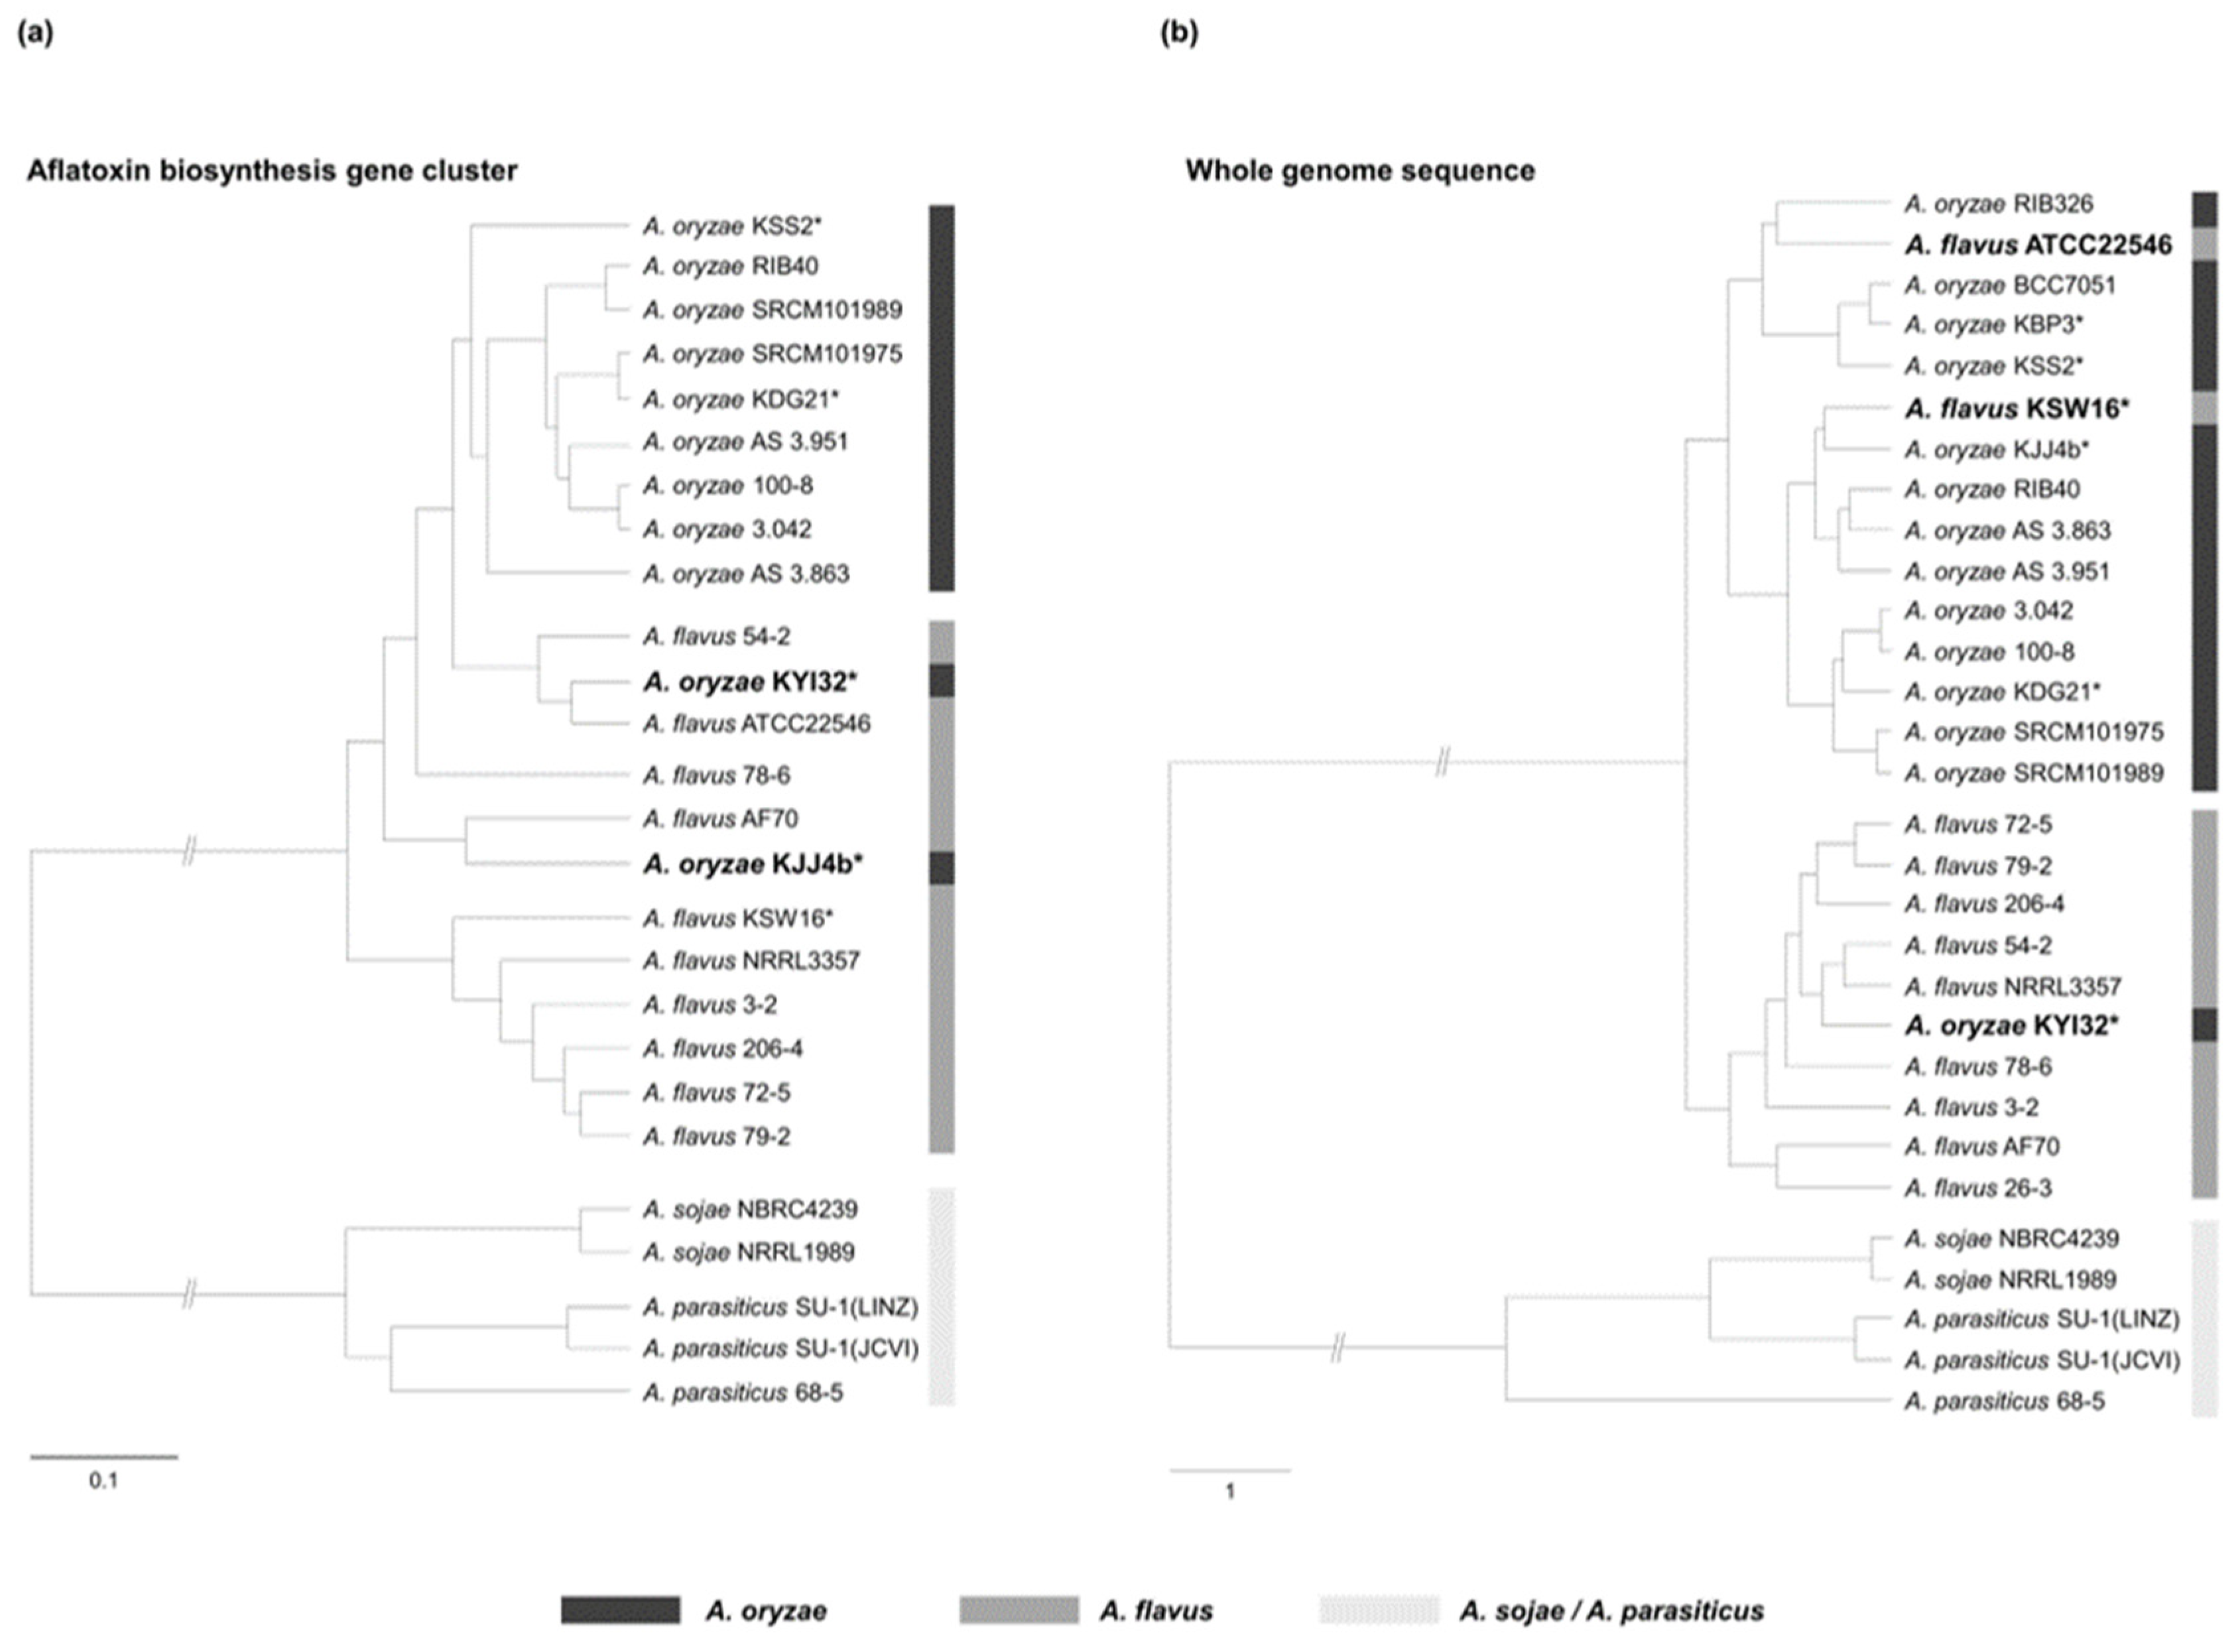
A phylogenetic analysis was conducted using the ABGC sequences of 26 strains of Aspergillus section Flavi, excluding four strains (A. oryzae KBP3, RIB326, BCC7051, and A. flavus 26-3) that had unidirectional deletions exceeding one-third of the ABGC (Figure 1a). The ABGC-based phylogenetic tree was divided into three primary clades corresponding to A. oryzae, A. flavus, and A. sojae/A. parasiticus. The A. oryzae clade contained nine A. oryzae strains, whereas the A. flavus clade comprised ten A. flavus strains and two A. oryzae strains (Figure 1a). As indicated in bold in Figure 1a, both A. oryzae KYI32 and KJJ4b, which originated from nuruk, clustered within the A. flavus clade. Interestingly, while A. oryzae KYI32 consistently belonged to the A. flavus clade in both the ABGC-based and whole-genome-based phylogenetic trees, A. oryzae KJJ4b belonged to the A. oryzae clade in whole-genome phylogeny (Figure 1b).

3.2. Five Deletion Types of the ABGC Across 30 Strains of Aspergillus Section Flavi

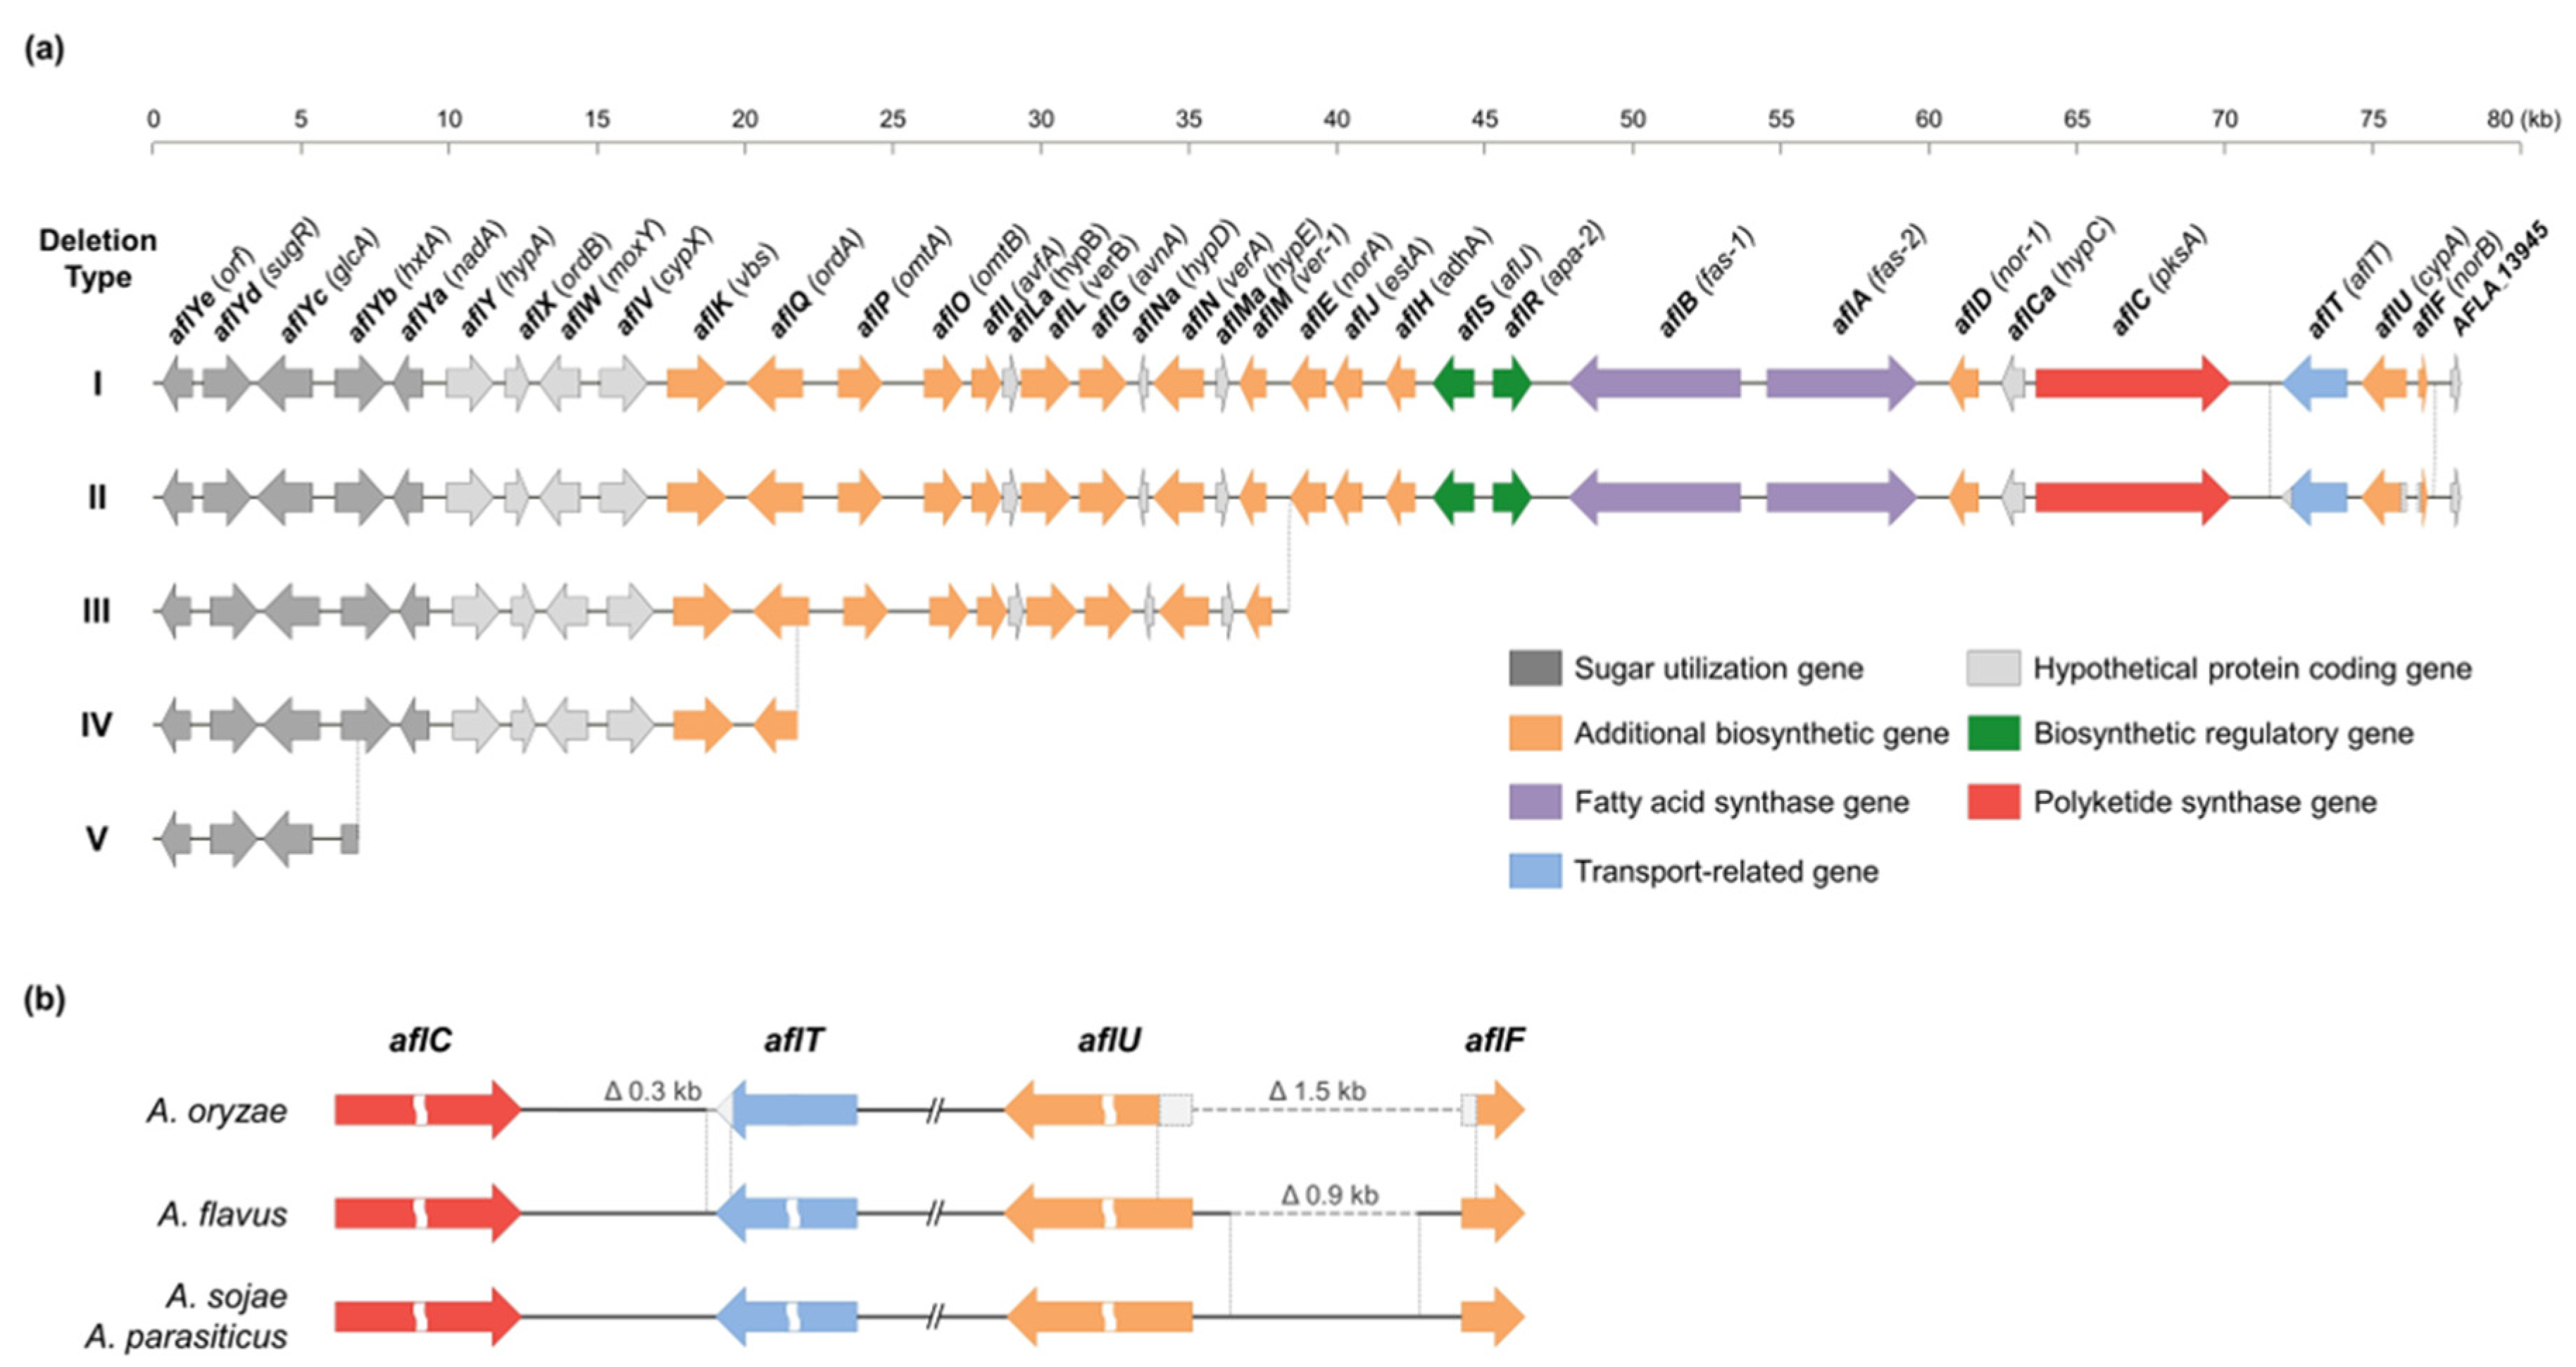
Based on the distribution of 35 ABGC genes in 30 strains of Aspergillus section Flavi (Table S2), ABGC deletion patterns were classified into five types (Figure 2a). Deletion type I contains 33 to 35 ABGC genes, and two strains of A. oryzae, 10 strains of A. flavus, 2 strains of A. sojae, and 3 strains of A. parasiticus belong to this type (Table S2). In the case of deletion type II, the aflT, aflU, and aflF genes located at the 3′ end of ABGC were pseudogenes, and 9 strains of A. oryzae belong to this type. Deletion types III, IV, and V are minor types in which more than half of the ABGC is deleted; deletion type III has 21 ABGC genes, type IV has 10 ABGC genes, and type V has 4 ABGC genes.
Aspergillus section Flavi strains classified as deletion type I and II exhibited two species-specific deletions involving three adjacent genes—aflT, aflU, and aflF—at the 3′ end of the ABGC (Figure 2b). The first species-specific deletion occurred within the aflT gene and the intergenic region between aflC (pksA) and aflT. This deletion spanned approximately 0.3 kb, encompassing about 250 bp from the 3′ end of aflT and roughly 60 bp from the aflC-aflT intergenic region, and was observed exclusively in A. oryzae. The second species-specific deletion was located in the aflU (cypA) gene, aflF (norB) gene, and their intergenic region. In A. sojae and A. parasiticus, this intergenic region measured approximately 1.4 kb, whereas A. flavus exhibited a 0.9 kb deletion, leaving only 0.5 kb. In A. oryzae, a more widespread deletion occurred, including the aflU-aflF intergenic region and the 5′ end of two genes, leading to a more significant deletion of approximately 1.5 kb compared to A. sojae and A. parasiticus and 0.6 kb relative to A. flavus (Figure 2b).

3.3. PCR-Based Differentiation of A. oryzae from A. flavus Using ABGC-Targeting Primer Set

Based on the species-specific deletion types identified within ABGC of Aspergillus section Flavi, we designed four primer sets to distinguish between A. oryzae and A. flavus through a simple PCR assay comparing amplicon sizes (Table 1). The newly designed primer sets—YE1–YE2, CT1–CT2, UF1–UF2, and E1–E2—targeted four distinct regions across the ABGC (Figure 3). The YE1-YE2 set targeted the aflYe gene (start region), the first gene of ABGC, allowing detection of the presence or absence of ABGC in the strain. The CT1–CT2 set targeted the aflC and aflT genes (CT region) and was designed to detect the 0.3 kb deletion unique to A. oryzae. The UF1–UF2 set targeted the aflU and aflF genes (UF region) to identify species-specific differences in deletion size of 0.6 kb between A. oryzae and A. flavus. The E1–E2 set targeted the AFLA_13945 gene (end region), the last gene of ABGC, to determine the presence or absence of large deletions within it.
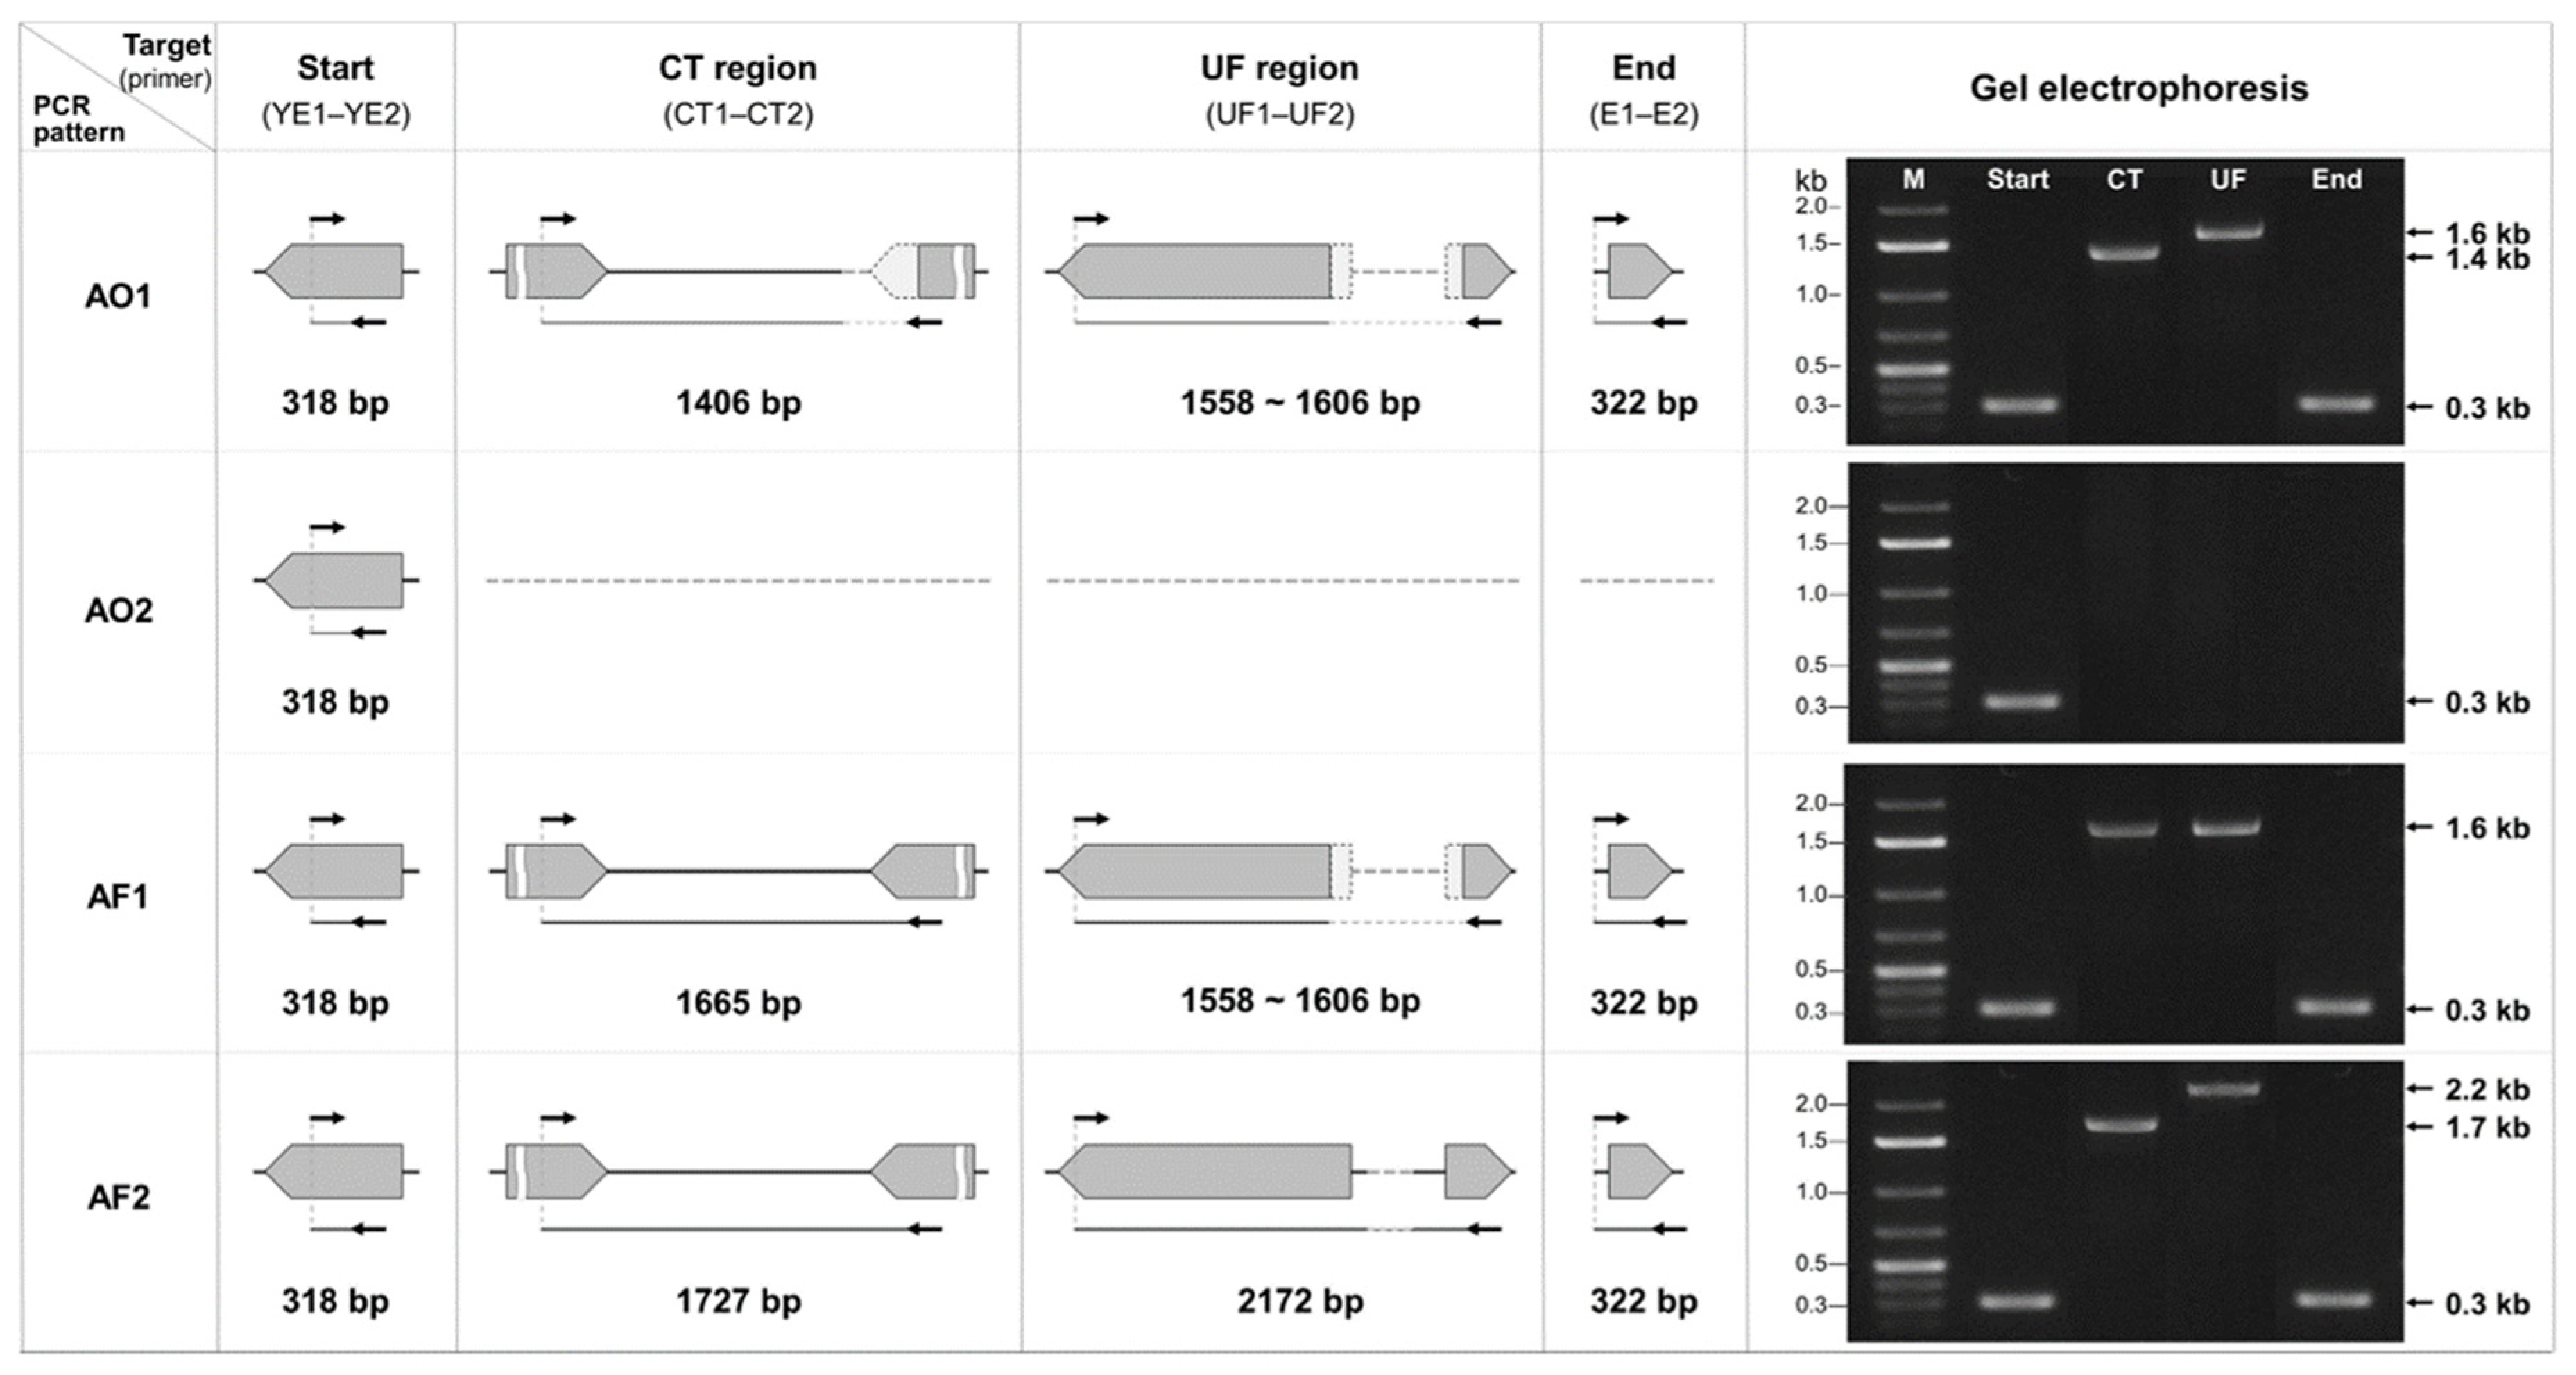
PCR assay using these four primer sets revealed two distinct amplification patterns for A. oryzae and A. flavus based on the CT and UF regions: AO1 and AO2 patterns for A. oryzae, and AF1 and AF2 patterns for A. flavus (Figure 4). Across all patterns, the amplicon sizes of the start and end regions were 318 bp and 322 bp, respectively, except for AO2, in which the end region was not amplified. In the AO1 pattern, the CT and UF regions produced amplicons of 1406 bp and ~1600 bp, respectively, corresponding to A. oryzae strains carrying a 0.3 kb deletion in CT region and a 0.6 kb deletion in the UF region. The AO2 pattern displayed amplification only in the start region, with the other three regions unamplified, consistent with A. oryzae strains exhibiting large deletion within ABGC (deletion type III to V in Figure 2a). In the case of A. flavus, the AF1 pattern produced CT and UF amplicons of 1665 bp and ~1600 bp, respectively, reflecting a 0.6 kb deletion in the UF region similar to that observed in A. oryzae. The AF2 pattern, on the other hand, generated CT and UF amplicons of 1727 bp and 2172 bp, respectively, corresponding to A. flavus strains classified as deletion type I in Figure 2a. PCR analysis using the four primer sets on representative strains—A. oryzae KSS2, KBP3, A. flavus KSW16, and ATCC22546—confirmed that these strains exhibited the AO1, AO2, AF1, and AF2 patterns, respectively (Figure 4).

3.4. PCR Analysis Using Four Newly Designed Primer Sets to Distinguish A. oryzae from A. flavus

We performed PCR analysis using the four primer sets on 125 strains, comprising 8 reference strains of Aspergillus section Flavi, 108 A. oryzae strains, and 9 A. flavus strains isolated from nuruk, alongside HPLC analysis to evaluate aflatoxin production for each strain (Table 2 and Table S3). PCR and HPLC analyses of the 8 reference strains revealed that A. oryzae RIB40 and RIB128, both non-aflatoxin-producers, exhibited the AO1 pattern, whereas A. flavus ATCC22546 and A. flavus NRRL3357, which produced about 300 ppb of aflatoxin, showed the AF2 pattern (Table S3 and Figure S1). Among the reference strains, PCR results of the two non-aflatoxin-producing A. sojae strains and the two aflatoxin-producing A. parasiticus strains both produced amplicons of the same size, 1.7 kb and 3.1 kb, in the CT and UF regions, respectively.
PCR analysis of 108 nuruk isolates of A. oryzae revealed 35 strains (32%) as AO1, 64 strains (59%) as AO2, 8 strains (7%) as AF1, and one strain (1%) as AF2 (Table 2). Eight strains isolated from nuruk (CN4-3, JJ4-7, JJ4-10, JJ4R-B, KJJ4b, SW1-8, SW1-11Y, and YI2-1) produced amplicons of approximately 1.7 kb and 1.6 kb in the CT and UF region, respectively, showing the AF1 pattern. A. oryzae KYI32 made amplicons of about 1.7 kb and 2.1 kb in the CT and UF regions, respectively, showing an AF2 pattern. All A. flavus strains isolated from nuruk were aflatoxigenic, ranging from 22.8 to 279.7 ppb, and all showed the AF2 pattern, except for A. flavus KSW16 (AF1 pattern) (Table S3).
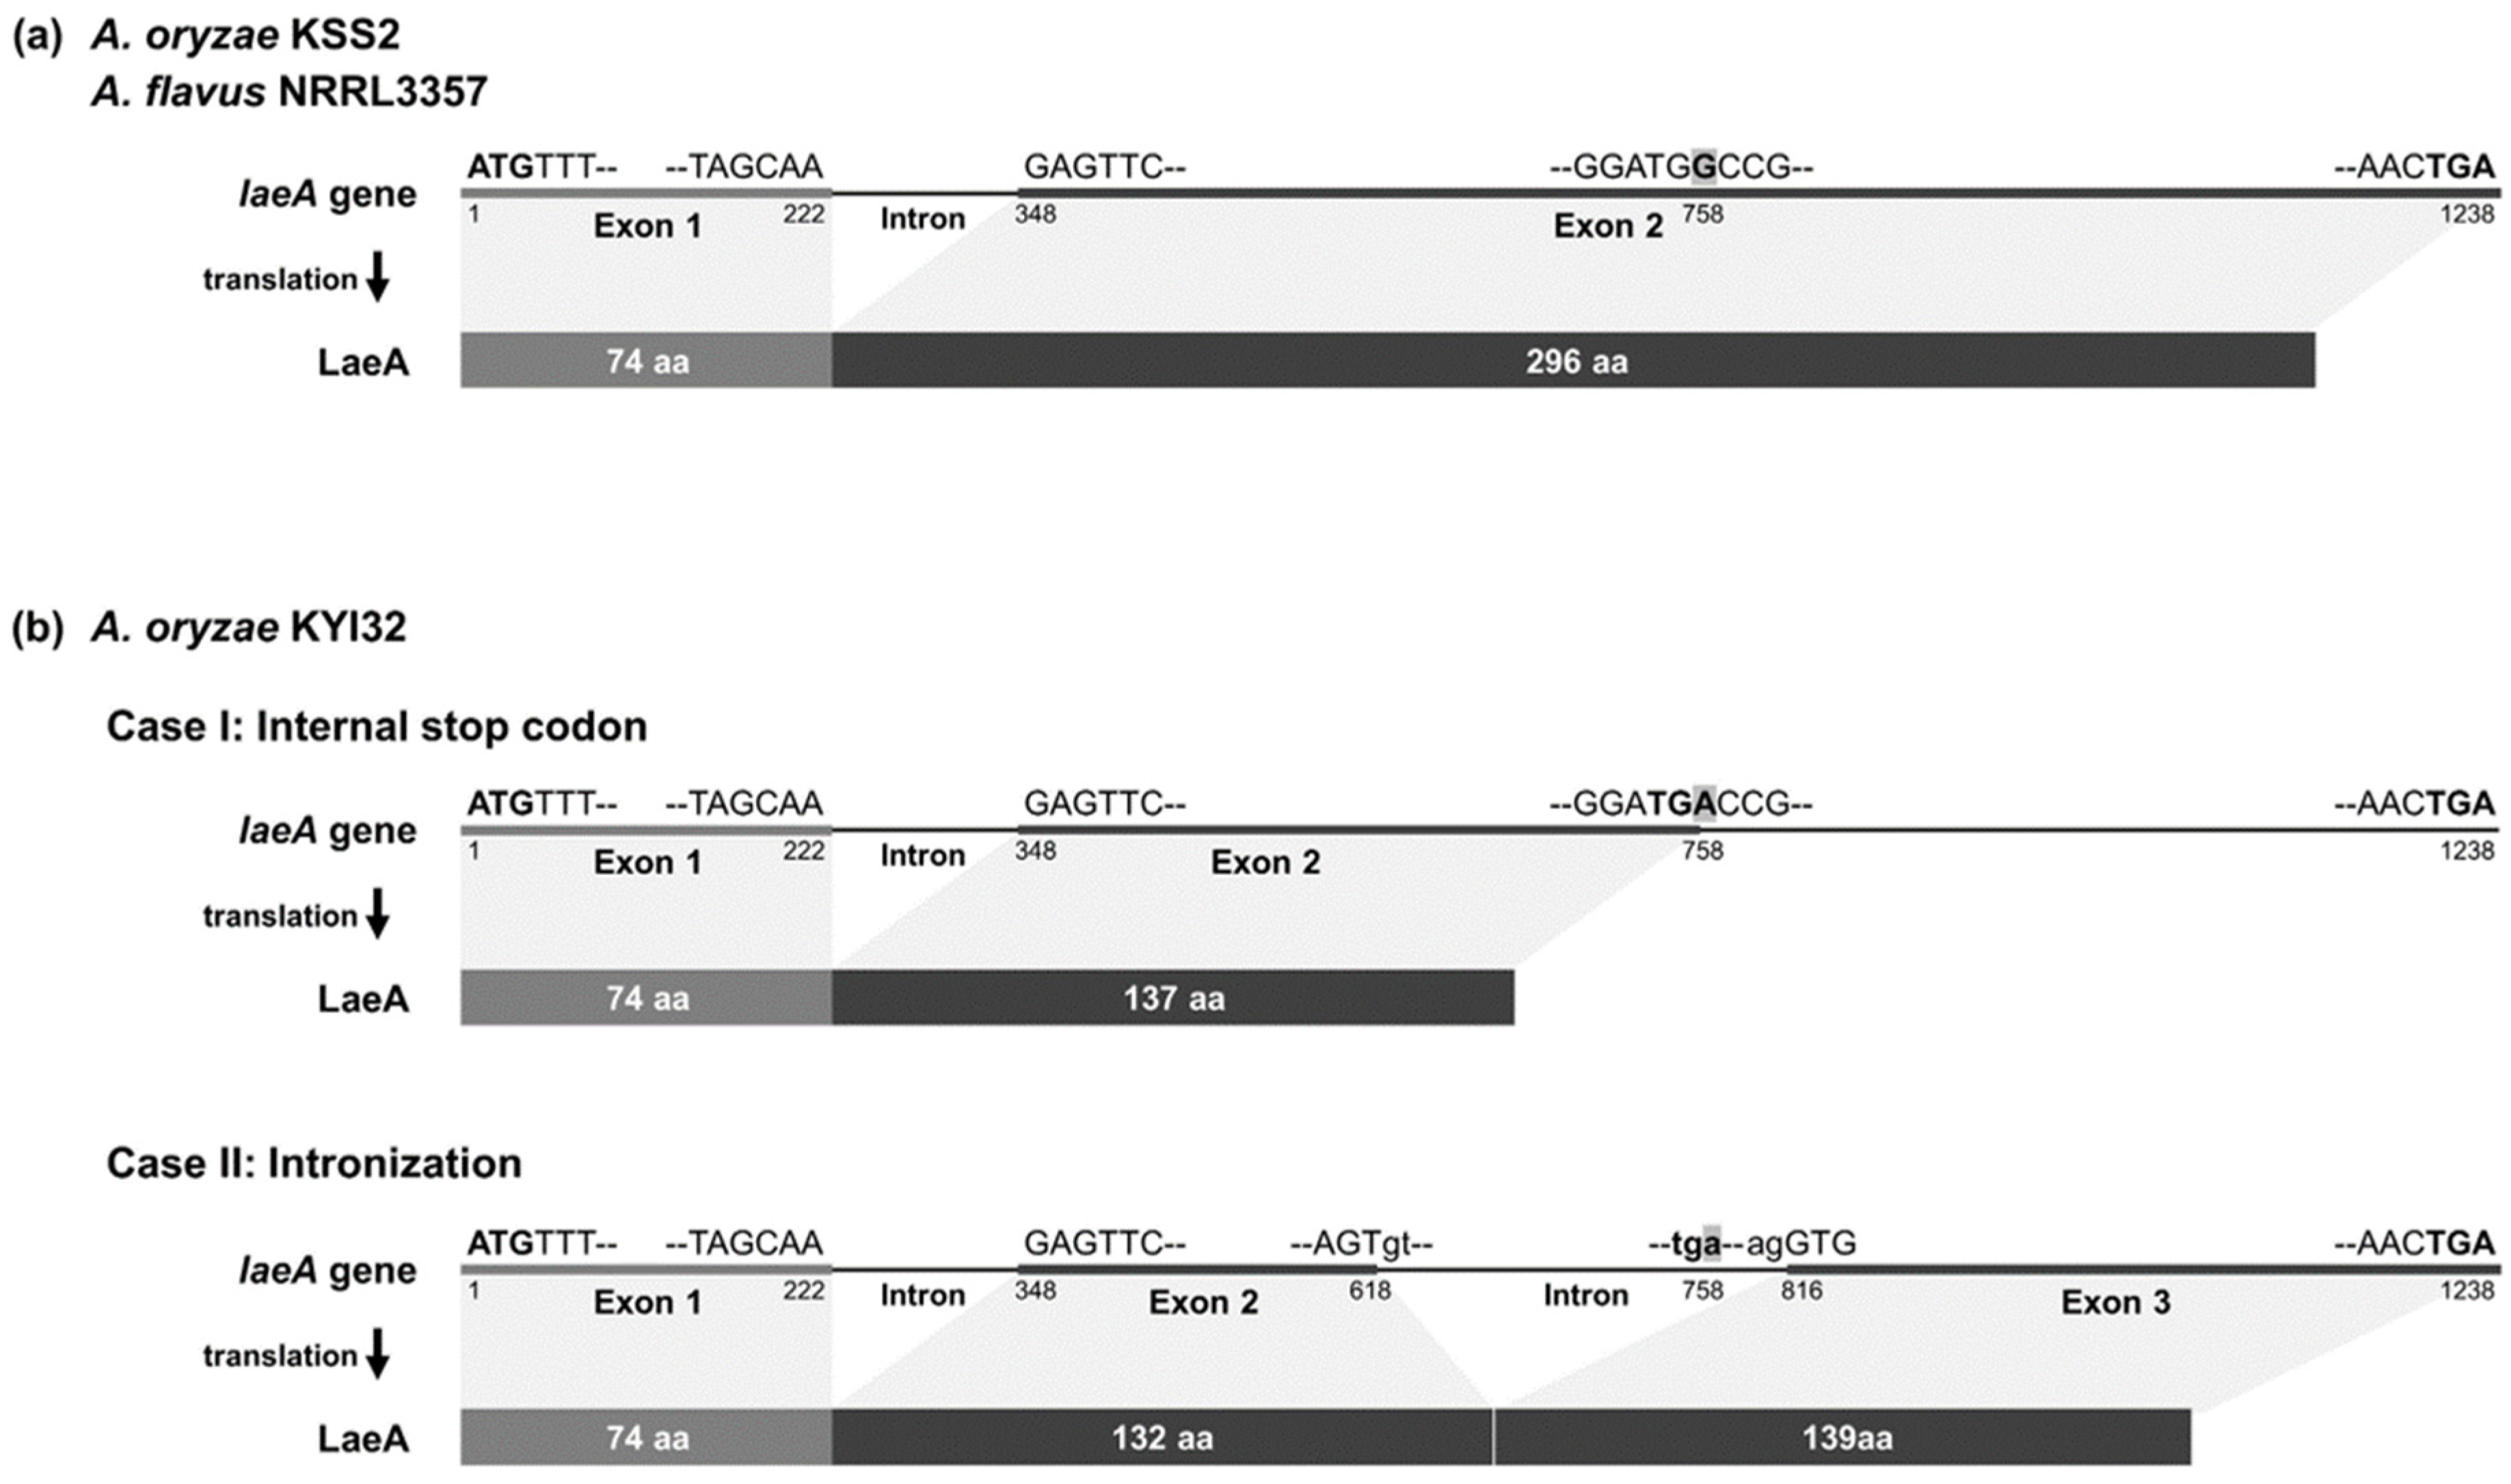
To further investigate atypical A. oryzae strains showing AF patterns, we compared the laeA gene sequences, a global regulator of secondary metabolism of Aspergillus spp. [68], in A. oryzae KJJ4b (AF1 pattern) and KYI32 (AF2 pattern) (Table 2). Compared with A. oryzae KSS2 and A. flavus NRRL3357, which possesses an intact laeA gene of 1238 bp, A. oryzae KYI32 has a single-nucleotide transition mutation at the 758th nucleotide position, where guanine (G) was substituted with adenine (A) (Figure 5). Based on laeA gene sequences of A. oryzae KSS2 and A. flavus NRRL3357, the predicted amino acid sequence of LaeA comprised 370 aa with no mutations (Figure 5a). In contrast, A. oryzae KYI32 exhibited two atypical translation cases of LaeA due to a G to A substitution (Figure 5b). Case I is a predicted truncated LaeA (210 aa) resulting from a premature stop codon at the 758th nucleotide, while case II is a predicted shortened LaeA (345 aa) caused by intronization between the 618th and 816th nucleotides of the laeA gene. However, the laeA gene of A. oryzae KJJ4b did not have any sequence mutations.

3.5. iPCR Analysis Using Four Newly Designed Primer Sets to Distinguish A. oryzae from A. flavus

To verify that the two species can be distinguished based on PCR, we performed iPCR analysis using 116 genomes of A. oryzae and 482 genomes of A. flavus available from GenBank and AflaPan [52] (Table 3, Tables S4 and S5). Most of the 116 A. oryzae genomes showed either the AO1 (43 strains, 37%) or the AO2 patterns (71 strains, 61%). The only exceptions were A. oryzae KJJ4b (AF1) and A. oryzae KYI32 (AF2) (Table 3). Subsequent iPCR analysis of 482 A. flavus genomes, including 257 from GenBank and 225 from AflaPan, revealed that 170 genomes (35%) showed the AF1 pattern and 146 genomes (30%) did the AF2 pattern. However, 24 genomes (5%) exhibited the AO1 pattern, and 121 genomes (25%) did the AO2 pattern.
All 225 genomes of A. flavus in AflaPan were tested for aflatoxin production status, but only 98 of the 257 genomes in GenBank were confirmed (Table S5). Consequently, we compared the iPCR results of 323 genomes (161 aflatoxigenic strains and 162 non-aflatoxigenic strains) with known aflatoxin production status (Table 3). The majority of aflatoxigenic A. flavus (95%) exhibited the AF1 or AF2 pattern, with only seven outliers. In the case of non-aflatoxigenic A. flavus, 76 genomes (47%) and 57 (35%) showed the AO2 and AF1 pattern, respectively.

4. Discussion

Aspergillus section Flavi includes both useful species, which are used in the food industry owing to their high enzyme productivity and fermentation efficiency, and harmful species, which synthesize carcinogenic mycotoxins that contaminate food products and pose serious health risks [70,71]. Owing to their industrial importance, species-level molecular identification within Aspergillus section Flavi remains one of the most extensively studied topics in fungal taxonomy [13,48,72,73]. However, A. oryzae and A. flavus, two closely related but functionally distinct species, are difficult to accurately distinguish based on morphology or common molecular markers such as ITS and β-tubulin sequences [4,27]. Since aflatoxin production represents the primary distinguishing trait between these two species, identification often relies on a comprehensive evaluation that incorporates aflatoxin production with morphological and molecular biological analyses [18,36,40]. However, such comprehensive analyses are time-consuming and complicated by the existence of non-aflatoxigenic A. flavus strains [30,48,74]. Therefore, a rapid and accurate molecular method is essential for detecting A. flavus, which continues to threaten global food safety and human health.
In our previous study [49], we found that Aspergillus section Flavi strains isolated from nuruk, a traditional Korean fermentation starter, possessed diverse ABGC deletion types, including truncated clusters, pseudogenes, and strain-specific deletions of ABGC genes. The genes involved in aflatoxin biosynthesis, which is the most prominent distinction between A. oryzae and A. flavus, are located as a cluster in the sub-telomeric region of chromosome 3, a region known for high frequencies of genetic recombination and structural rearrangements [38,75]. Several studies have reported that Aspergillus section Flavi, particularly A. oryzae and A. flavus, harbor species-specific structural variations in the ABGC, including large-scale gene deletions and small sequence-level deletions [33,43,72,76]. In this study, we analyzed ABGC deletion patterns at the sequence level in A. oryzae and related species within Aspergillus section Flavi, including nuruk-derived strains, to develop a reliable differentiation method to differentiate A. oryzae from A. flavus. Of the 14 A. oryzae strains analyzed, three exhibited unidirectional deletions starting from the 3′ end of the ABGC (Figure 2a and Table S2), consistent with the previously reported Group II deletion in A. oryzae [45,77]. A. oryzae KBP3 is a deletion type III, with the ABGC deleted up to the aflM gene, rendering it non-aflatoxigenic, similar to A. oryzae BCC7051 [45]. Most A. oryzae strains (9 out of 14) were deletion type II, characterized by a 0.3 kb deletion at the 3′ end of the aflT gene and a 1.5 kb deletion in the intergenic region encompassing the 5′ ends of the aflU and aflF genes (Figure 2b). These sequence-level deletions in the aflT, aflU, and aflF genes were confirmed as species-specific deletions of A. oryzae compared to the other three species, A. flavus, A. sojae, and A. parasiticus (Figure 1a) [38,41]. Unlike typical A. oryzae strains, A. oryzae KYI32 was phylogenetically grouped with A. flavus based on both ABGC sequences and the whole genome (Figure 1 and Table S2) [78,79]. Although A. oryzae KYI32 does not produce aflatoxins, as confirmed by HPLC analysis, its ABGC organization closely resembles that of aflatoxigenic A. flavus. Genome analysis further revealed a nonsense mutation in the laeA gene of A. oryzae KYI32, a key global regulatory gene of secondary metabolisms in Aspergillus [80,81], which is predicted to disrupt normal laeA gene expression (Figure 5). Taken together, these findings suggest that the absence of aflatoxin production in A. oryzae KYI32, despite its intact ABGC and phylogenetic proximity to A. flavus, is likely attributable to regulatory dysfunction rather than structural ABGC gene loss.
Based on the identified different deletions in the aflT, aflU, and aflT genes across species, we designed four primer sets targeting these species-specific variations to distinguish A. oryzae from A. flavus through differences in PCR amplicon sizes (Table 1 and Figure 3). Previous studies have proposed various PCR-based strategies to distinguish between A. oryzae and A. flavus, including sequence-level comparison of new genetic markers such as the cyp51A gene [48] and real-time detection of expression level of aflatoxin-related genes (aflS and aflR genes) [82,83]. Alternatively, multiplex PCR assays incorporating four to six primer sets have been employed to discriminate A. flavus from other genera or Aspergillus sections [84,85,86]. However, these approaches often only discriminate at the genus or section level or require time-consuming procedures such as sequencing or gene expression analysis. To further compare the marker-based discrimination, we additionally evaluated the species-level discrimination of the cyp51A gene-targeting primers through in silico primer-genome alignment using the deposited genomes of A. oryzae and A. flavus [48]. This analysis, however, is predicted to yield limited discriminatory accuracy—approximately 82% for A. flavus but only 34% for A. oryzae—indicating particularly poor accuracy for A. oryzae (Tables S4 and S5). In contrast, the ABGC-targeting primer sets designed in this study enable rapid and reliable species-level identification of A. oryzae from A. flavus, as well as the strains’ ABGC structure, through a simple PCR amplicon size comparison (Figure 4). PCR assay using ABGC-targeting primer sets for nuruk-derived strains confirmed that A. oryzae and A. flavus could be differentiated with 92% and 100% accuracy, respectively (Table 2 and Table S3). Among the A. oryzae strains, 59% showed the AO2 pattern, indicating truncated ABGC, and 32% the AO1 pattern, indicating relatively intact ABGC with species-specific small deletions in the aflT, aflU, and aflF genes. Eight A. flavus strains, excluding A. flavus KSW16 (AF2 pattern), showed the AF1 pattern characterized by small deletions in the aflU and aflF genes like A. oryzae. This approach enables simultaneous species-level discrimination of A. oryzae and A. flavus and verification of ABGC structure solely through PCR amplicon size profiling. Importantly, our method bypasses additional sequencing- or expression-based steps and therefore provides a rapid and cost-efficient approach for routine identification.
iPCR analysis enables evaluation of primer performance across expanded genomic datasets by simulating amplification outcomes [87,88]. Although iPCR outputs occasionally differ from experimental PCR due to genome assembly quality or in vivo amplification dynamics, this computational approach provides an efficient strategy for assessing primer specificity and predicting amplification [69,89]. Consistent concordance between large-scale iPCR prediction and experimental PCR results indicates that the designed primer sets exhibit high accuracy and strong applicability for discriminating A. oryzae from A. flavus (Table 3). Across A. oryzae genomes, the predominance of AO-type patterns reflects conserved truncated ABGC structure and species-specific deletions in aflT and aflU-aflF genes. Notably, two A. oryzae genomes derived from nuruk (KJJ4b and KYI32) showed AF-type patterns, underscoring the evolutionary proximity between A. oryzae and A. flavus. And this may imply the rare but biologically meaningful presence of regulatory alterations that decouple ABGC integrity from aflatoxin biosynthesis. Furthermore, we compared the iPCR patterns of A. flavus genomes with known aflatoxin production status and found that non-aflatoxigenic A. flavus may exhibit either AO2 or AF1 patterns (Table 3 and Table S5). This heterogeneity is biologically plausible, as loss of aflatoxin production in A. flavus can arise from truncation of the ABGC or from an intact ABGC coupled with defects in regulatory mechanisms, as found in KYI32 [90,91]. Thus, non-aflatoxigenic A. flavus may have A. oryzae-like or intermediate ABGC profiles, indicating diverse evolutionary pathways leading to aflatoxin non-production. Although this represents a limitation in distinguishing A. oryzae from non-aflatoxigenic A. flavus, the ABGC-targeted primer sets reliably differentiate A. oryzae from aflatoxigenic A. flavus, enabling rapid strain verification.
Through sequence-level comparison of the ABGC among Aspergillus section Flavi, we developed four primer sets targeting species-specific deletions that enable rapid and accurate differentiation between A. oryzae and A. flavus based on PCR amplicon size. The high accuracy and high concordance between the experimental PCR and iPCR results support the robustness of the primer design and indicate that structural variations in ABGC provide reliable molecular features for species differentiation. Collectively, this ABGC-targeting PCR approach provides an efficient and practical molecular method for distinguishing between two species that share roughly 99.5% genomic similarity but differ critically in food safety relevance.

5. Patents

Due to the novelty and applicability of the finding, one patent describing the PCR-based species differentiation of A. oryzae and A. flavus using four primer sets newly designed in this study is currently filed with the Korean Intellectual Property Office under Application No. 10-2099051 (filed on 2 April 2020) (Title: Composition for detection of strain producing aflatoxin and detection method using the same).

Supplementary Materials

The following supporting information can be downloaded at: https://www.mdpi.com/article/10.3390/jof12010010/s1, Figure S1: Gel electrophoresis of PCR products using the four primer sets from 8 reference strains of Aspergillus section Flavi. PCR analysis was performed on 8 reference strains of Aspergillus section Flavi: (a) A. oryzae RIB40, RIB128, (b) A. flavus ATCC22546, NRRL3357, (c) A. sojae NBRC4239, NRRL1989, (d) A. parasiticus ATCC22789, and SU-1. The size of amplified PCR products was confirmed using 1% agarose gel electrophoresis at 100 V for 25 min. The marker (M) for electrophoresis was GeneRuler 1 kb plus DNA ladder. Lane 1, start region amplified using YE1 and YE2 primer set; Lane 2, CT region amplified using CT1 and CT2 primer set; Lane 3, UF region amplified using UF1 and UF2 primer set; and Lane 4, end region amplified using E1 and E2 primer set; Table S1: Sequence variations of ABGC-targeting primser sets designed in this study; Table S2: Comparison of 35 genes of aflatoxin biosynthesis gene clusters of 30 strains of Aspergillus section Flavi; Table S3: PCR analysis using ABGC-targeting primer sets for 8 reference strains of Aspergillus section Flavi and 9 strains of A. flavus and 108 strains of A. oryzae isolated from nuruk; Table S4: In silico PCR analysis using ABGC-targeting primer sets for the 116 genomes of A. oryzae in the GenBank database, Table S5: In silico PCR analysis using ABGC-targeting primer sets for the 257 genomes of A. flavus in the GenBank and 225 from AflaPan. References [48,52,92] are cited in the Supplementary Materials.

Author Contributions

Conceptualization, J.-A.S.; methodology, E.J. and Y.J.K.; software, E.J. and Y.J.K.; validation, E.J., Y.J.K. and J.-A.S.; formal analysis, Y.J.K.; investigation, E.J. and Y.J.K.; resources, E.J. and Y.J.K.; data curation, J.-A.S.; writing—original draft preparation, E.J. and Y.J.K.; writing—review and editing, E.J. and J.-A.S.; visualization, E.J. and Y.J.K.; supervision, J.-A.S.; project administration, J.-A.S.; funding acquisition, J.-A.S. All authors have read and agreed to the published version of the manuscript.

Funding

This research was supported by the National Research Foundation of Korea (NRF) grant funded by the Korea government (MSIT), grant number [RS-2024-00346373].

Institutional Review Board Statement

Not applicable.

Informed Consent Statement

Not applicable.

Data Availability Statement

The original contributions presented in this study are included in the article/Supplementary Materials. Further inquiries can be directed to the corresponding author.

Conflicts of Interest

The authors declare no conflicts of interest.

References

  1. Arias, R.S.; Orner, V.A.; Martinez-Castillo, J.; Sobolev, V.S. Aspergillus section Flavi, need for a robust taxonomy. Microbiol. Resour. Announc. 2021, 10, e00784-21. [Google Scholar] [CrossRef] [PubMed]
  2. Chang, P.K. A Simple CRISPR/Cas9 System for Efficiently Targeting Genes of Aspergillus Section Flavi Species, Aspergillus nidulans, Aspergillus fumigatus, Aspergillus terreus, and Aspergillus niger. Microbiol. Spectr. 2023, 11, e04648-22. [Google Scholar] [CrossRef]
  3. Godet, M.; Munaut, F. Molecular strategy for identification in Aspergillus section Flavi. FEMS Microbiol. Lett. 2010, 304, 157–168. [Google Scholar] [CrossRef]
  4. Suleiman, W.B. A multi-aspect analysis of two analogous aspergillus spp. belonging to section Flavi: Aspergillus flavus and aspergillus oryzae. BMC Microbiol. 2023, 23, 71. [Google Scholar] [CrossRef]
  5. Kim, K.M.; Lim, J.; Lee, J.J.; Hurh, B.S.; Lee, I. Characterization of Aspergillus sojae Isolated from Meju, Korean Traditional Fermented Soybean Brick. J. Microbiol. Biotechnol. 2017, 27, 251–261. [Google Scholar] [CrossRef]
  6. Kim, M.; Seo, J.A. Fermentation profiling of rice wine produced by Aspergillus oryzae KSS2 and Rhizopus oryzae KJJ39 newly isolated from Korean fermentation starter. Appl. Biol. Chem. 2021, 64, 25. [Google Scholar] [CrossRef]
  7. Li, J.; Sun, C.; Shen, Z.; Tian, Y.; Mo, F.; Wang, B.; Liu, B.; Wang, C. Untargeted metabolomic profiling of Aspergillus sojae 3.495 and Aspergillus oryzae 3.042 fermented soy sauce koji and effect on moromi fermentation flavor. LWT 2023, 184, 115027. [Google Scholar] [CrossRef]
  8. He, B.; Tu, Y.; Jiang, C.; Zhang, Z.; Li, Y.; Zeng, B. Functional Genomics of Aspergillus oryzae: Strategies and Progress. Microorganisms 2019, 7, 103. [Google Scholar] [CrossRef] [PubMed]
  9. Ichishima, E. Development of enzyme technology for Aspergillus oryzae, A. sojae, and A. luchuensis, the national microorganisms of Japan. Biosci. Biotechnol. Biochem. 2016, 80, 1681–1692. [Google Scholar] [CrossRef]
  10. Li, Q.; Lu, J.; Liu, J.; Li, J.; Zhang, G.; Du, G.; Chen, J. High-throughput droplet microfluidics screening and genome sequencing analysis for improved amylase-producing Aspergillus oryzae. Biotechnol. Biofuels. Bioprod. 2023, 16, 185. [Google Scholar] [CrossRef]
  11. Fouad, A.M.; Ruan, D.; El-Senousey, H.K.; Chen, W.; Jiang, S.; Zheng, C. Harmful Effects and Control Strategies of Aflatoxin B1 Produced by Aspergillus flavus and Aspergillus parasiticus Strains on Poultry: Review. Toxins 2019, 11, 176. [Google Scholar] [CrossRef]
  12. Olarte, R.A.; Worthington, C.J.; Horn, B.W.; Moore, G.G.; Singh, R.; Monacell, J.T.; Dorner, J.W.; Stone, E.A.; Xie, D.Y.; Carbone, I. Enhanced diversity and aflatoxigenicity in interspecific hybrids of Aspergillus flavus and Aspergillus parasiticus. Mol. Ecol. 2015, 24, 1889–1909. [Google Scholar] [CrossRef]
  13. Ono, L.T.; Silva, J.J.; Doná, S.; Martins, L.M.; Iamanaka, B.T.; Fungaro, M.H.P.; Pitt, J.I.; Taniwaki, M.H. Aspergillus section Flavi and aflatoxins in Brazilian cassava (Manihot esculenta Crantz) and products. Mycotoxin Res. 2021, 3, 221–228. [Google Scholar] [CrossRef]
  14. Yin, H.B.; Chen, C.H.; Kollanoor-Johny, A.; Darre, M.J.; Venkitanarayanan, K. Controlling Aspergillus flavus and Aspergillus parasiticus growth and aflatoxin production in poutry feed using carvacrol and trans-cinnamaldehyde. Poult. Sci. 2015, 94, 2183–2190. [Google Scholar] [CrossRef] [PubMed]
  15. Amaike, S.; Keller, N.P. Aspergillus flavus. Annu. Rev. Phytopathol. 2011, 49, 107–133. [Google Scholar] [CrossRef] [PubMed]
  16. Hedayati, M.T.; Pasqualotto, A.C.; Warn, P.A.; Bowyer, P.; Denning, D.W. Aspergillus flavus: Human pathogen, allergen and mycotoxin producer. Microbiology 2007, 153, 1677–1692. [Google Scholar] [CrossRef] [PubMed]
  17. Rudramurthy, S.M.; Paul, R.A.; Chakrabarti, A.; Mouton, J.W.; Meis, J.F. Invasive Aspergillosis by Aspergillus flavus: Epidemiology, Diagnosis, Antifungal Resistance, and Management. J. Fungi 2019, 5, 55. [Google Scholar] [CrossRef]
  18. Frisvad, J.C.; Hubka, V.; Ezekiel, C.N.; Hong, S.B.; Nováková, A.; Chen, A.J.; Arzanlou, M.; Larsen, T.O.; Sklenář, F.; Mahakarnchanakul, W.; et al. Taxonomy of Aspergillus section Flavi and their production of aflatoxins, ochratoxins and other mycotoxins. Stud. Mycol. 2019, 93, 1–63. [Google Scholar] [CrossRef]
  19. Horn, B.W. Biodiversity of Aspergillus section Flavi in the United States: A review. Food Addit. Contam. 2007, 24, 1088–1101. [Google Scholar] [CrossRef]
  20. Kjærbølling, I.; Vesth, T.; Frisvad, J.C.; Nybo, J.L.; Theobald, S.; Kildgaard, S.; Petersen, T.I.; Kuo, A.; Sato, A.; Lyhne, E.K.; et al. A comparative genomics study of 23 Aspergillus species from section Flavi. Nat. Commun. 2020, 11, 1106. [Google Scholar] [CrossRef]
  21. Ashtiani, N.M.; Kachuei, R.; Yalfani, R.; Harchegani, A.B.; Nosratabadi, M. Identification of Aspergillus sections Flavi, Nigri, and Fumigati and their differentiation using specific primers. Infez. Med. 2017, 25, 127–132. [Google Scholar]
  22. Rodrigues, P.; Venâncio, A.; Kozakiewicz, Z.; Lima, N. A polyphasic approach to the identification of aflatoxigenic and non-aflatoxigenic strains of Aspergillus Section Flavi isolated from Portuguese almonds. Int. J. Food. Microbiol. 2009, 129, 187–193. [Google Scholar] [CrossRef]
  23. Norlia, M.; Jinap, S.; Nor-Khaizura, M.A.R.; Radu, S.; Samsudin, N.I.P.; Azri, F.A. Aspergillus section Flavi and Aflatoxins: Occurrence, Detection, and Identification in Raw Peanuts and Peanut-Based Products Along the Supply Chain. Front. Microbiol. 2019, 10, 2602. [Google Scholar] [CrossRef]
  24. Baquião, A.C.; de Oliveira, M.M.M.; Reis, T.A.; Zorzete, P.; Atayde, D.D.; Correa, B. Polyphasic approach to the identification of Aspergillus section Flavi isolated from Brazil nuts. Food Chem. 2013, 139, 1127–1132. [Google Scholar] [CrossRef]
  25. Chang, P.K.; Ehrlich, K.C. What does genetic diversity of Aspergillus flavus tell us about Aspergillus oryzae? Int. J. Food Microbiol. 2010, 138, 189–199. [Google Scholar] [CrossRef] [PubMed]
  26. Montiel, D.; Dickinson, M.J.; Lee, H.A.; Dyer, P.S.; Jeenes, D.J.; Roberts, I.N.; James, S.; Fuller, L.J.; Matsuchima, K.; Archer, D.B. Genetic differentiation of the Aspergillus section Flavi complex using AFLP fingerprints. Mycol. Res. 2004, 107, 1427–1434. [Google Scholar] [CrossRef]
  27. Han, D.M.; Baek, J.H.; Choi, D.G.; Jeon, M.S.; Eyun, S.; Jeon, C.O. Comparative pangenome analysis of Aspergillus flavus and Aspergillus oryzae reveals their phylogenetic, genomic, and metabolic homogeneity. Food Microbiol. 2024, 119, 104435. [Google Scholar] [CrossRef] [PubMed]
  28. Nakamura, H.; Narihiro, T.; Tsuruoka, N.; Mochimaru, H.; Matsumoto, R.; Tanabe, Y.; Hagiya, K.; Ikeba, K.; Maruyama, A.; Hanada, S. Evaluation of the Aflatoxin Biosynthetic Genes for Identification of the Aspergillus Section Flavi. Microbes Environ. 2011, 26, 367–369. [Google Scholar] [CrossRef] [PubMed][Green Version]
  29. Rank, C.; Klejnstrup, M.L.; Petersen, L.M.; Kildgaard, S.; Frisvad, J.C.; Gotfredsen, C.H.; Larsen, T.O. Comparative Chemistry of Aspergillus oryzae (RIB40) and A. flavus (NRRL 3357). Metabolites 2012, 2, 39–56. [Google Scholar] [CrossRef]
  30. Abastabar, M.; Shabanzadeh, S.; Valadan, R.; Mayahi, S.; Haghani, I.; Khojasteh, K.; Nargesi, S.; Seyedmousavi, S.; Hedayati, M.T. Development of RFLP method for rapid differentiation of Aspergillus flavus and Aspergillus oryzae, two species with high importance in clinical and food microbiology. J. Med. Mycol. 2022, 32, 101274. [Google Scholar] [CrossRef]
  31. Watarai, N.; Yamamoto, N.; Sawada, K.; Yamada, T. Evolution of Aspergillus oryzae before and after domestication inferred by large-scale comparative genomic analysis. DNA Res. 2019, 26, 465–472. [Google Scholar] [CrossRef] [PubMed]
  32. Ehrlich, K.C.; Mack, B.M. Comparison of Expression of Secondary Metabolite Biosynthesis Cluster Genes in Aspergillus flavus, A. parasiticus, and A. oryzae. Toxins 2014, 6, 1916–1928. [Google Scholar] [CrossRef]
  33. Moore, G.G.; Singh, R.; Horn, B.W.; Carbone, I. Recombination and lineage-specific gene loss in the aflatoxin gene cluster of Aspergillus flavus. Mol. Ecol. 2009, 18, 4870–4887. [Google Scholar] [CrossRef]
  34. Tumukunde, E.; Xie, R.; Wang, S. Updates on the Functions and Molecular Mechanisms of the Genes Involved in Aspergillus flavus Development and Biosynthesis of Aflatoxins. J. Fungi 2021, 7, 666. [Google Scholar] [CrossRef]
  35. Yin, G.; Hua, S.S.T.; Pennerman, K.K.; Yu, J.; Bu, L.; Sayre, R.T.; Bennett, J.W. Genome sequence and comparative analyses of atoxigenic Aspergillus flavus WRRL 1519. Mycologia 2018, 110, 482–493. [Google Scholar] [CrossRef]
  36. Furukawa, T.; Sakai, K.; Suzuki, T.; Tanaka, T.; Kushiro, M.; Kusumoto, K.I. Comparative Genome Analysis of Japanese Field-Isolated Aspergillus for Aflatoxin Productivity and Non-Productivity. J. Fungi 2024, 10, 459. [Google Scholar] [CrossRef] [PubMed]
  37. Tao, L.; Chung, S.H. Non-Aflatoxigenicity of Commercial Aspergillus oryzae Strains Due to Genetic Defects Compared to Aflatoxigenic Aspergillus flavus. J. Microbiol. Biotechnol. 2014, 24, 1081–1087. [Google Scholar] [CrossRef]
  38. Adhikari, B.N.; Bandyopadhyay, R.; Cotty, P.J. Degeneration of aflatoxin gene clusters in Aspergillus flavus from Africa and North America. AMB Expr. 2016, 6, 62. [Google Scholar] [CrossRef]
  39. Khan, R.; Ghazali, F.M.; Mahyudin, N.A.; Samsudin, N.I.P. Aflatoxin Biosynthesis, Genetic Regulation, Toxicity, and Control Strategies: A Review. J. Fungi 2021, 7, 606. [Google Scholar] [CrossRef] [PubMed]
  40. Toyotome, T.; Hamada, S.; Yamaguchi, S.; Takahashi, H.; Kondoh, D.; Takino, M.; Kanesaki, Y.; Kamsei, K. Comparative genome analysis of Aspergillus flavus clinically isolated in Japan. DNA Res. 2019, 26, 95–103. [Google Scholar] [CrossRef]
  41. Callicott, K.A.; Cotty, P.J. Method for monitoring deletions in the aflatoxin biosynthesis gene cluster of Aspergillus flavus with multiplex PCR. Lett. Appl. Microbiol. 2015, 60, 60–65. [Google Scholar] [CrossRef]
  42. Geiser, D.M.; Dorner, J.W.; Horn, B.W.; Taylor, J.W. The Phylogenetics of Mycotoxin and Sclerotium Production in Aspergillus flavus and Aspergillus oryzae. Fungal Genet. Biol. 2000, 31, 169–179. [Google Scholar] [CrossRef]
  43. Lee, Y.H.; Tominaga, M.; Hayashi, R.; Sakamoto, K.; Yamada, O.; Akita, O. Aspergillus oryzae strains with a large deletion of the aflatoxin biosynthetic homologous gene cluster differentiated by chromosomal breakage. Appl. Microbiol. Biotechnol. 2006, 72, 339–345. [Google Scholar] [CrossRef]
  44. Chang, P.K.; Ehrlich, K.C.; Hua, S.S. Cladal relatedness among Aspergillus oryzae isolates and Aspergillus flavus S and L morphotype isolates. Int. J. Food Microbiol. 2006, 108, 172–177. [Google Scholar] [CrossRef] [PubMed]
  45. Tominaga, M.; Lee, Y.H.; Hayashi, R.; Suzuki, Y.; Yamada, O.; Sakamoto, K.; Gotoh, K.; Akita, O. Molecular Analysis of an Inactive Aflatoxin Biosynthesis Gene Cluster in Aspergillus oryzae RIB Strains. Appl. Environ. Microbiol. 2006, 72, 484–490. [Google Scholar] [CrossRef]
  46. Al-Shuhaib, M.B.S.; Albakri, A.H.; Alwan, S.H.; Almandil, N.B.; AbdulAzeez, S.; Borgio, J.F. Optimal pcr primers for rapid and accurate detection of Aspergillus flavus isolates. Microb. Pathog. 2018, 116, 351–355. [Google Scholar] [CrossRef] [PubMed]
  47. Gil-Serna, J.; Vazquez, C.; Patiño, B. The relevance of genomics in food mycology with a focus on food safety. Curr. Opin. Food Sci. 2024, 59, 101213. [Google Scholar] [CrossRef]
  48. Nargesi, S.; Abastabar, M.; Valadan, R.; Mayahi, S.; Youn, J.H.; Hedayati, M.T.; Seyedmousavi, S. Differentiation of Aspergillus flavus from Aspergillus oryzae Targeting the cyp51A Gene. Pathogens 2021, 10, 1279. [Google Scholar] [CrossRef] [PubMed]
  49. Jeong, E.; Seo, J.A. Comparative genome analyses of Aspergillus oryzae and Aspergillus flavus originated from a Korean fermentatio nstarter, nuruk. Food Microbiol. 2025, 131, 104807. [Google Scholar] [CrossRef]
  50. Bal, J.; Yun, S.H.; Song, H.Y.; Yeo, S.H.; Kim, J.H.; Kim, J.M.; Kim, D.H. Mycoflora dynamics analysis of Korean traditional wheat-based nuruk. J. Microbiol. 2014, 52, 1025–1029. [Google Scholar] [CrossRef]
  51. Carroll, E.; Trinh, T.N.; Son, H.; Lee, Y.W.; Seo, J.A. Comprehensive analysis of fungal diversity and enzyme activity in nuruk, a Korean fermenting starter, for acquiring useful fungi. J. Microbiol. 2017, 55, 357–365. [Google Scholar] [CrossRef]
  52. Gangurde, S.S.; Korani, W.; Bajaj, P.; Wang, H.; Fountain, J.C.; Agarwal, G.; Pandey, M.K.; Abbas, H.K.; Chang, P.K.; Holbrook, C.C.; et al. Aspergillus flavus pangenome (AflaPan) uncovers novel aflatoxin and secondary metabolite associated gene clusters. BMC Plant Biol. 2024, 24, 354. [Google Scholar] [CrossRef]
  53. Madden, T. The BLAST sequence analysis tool. In The NCBI Handbook; NIH: Bethesda, MD, USA, 2013; Volume 2, pp. 425–436. [Google Scholar]
  54. Chang, P.K.; Horn, B.W.; Dorner, J.W. Sequence breakpoints in the aflatoxin biosynthesis gene cluster and flanking regions in nonaflatoxigenic Aspergillus flavus isolates. Fungal Genet. Biol. 2005, 42, 914–923. [Google Scholar] [CrossRef]
  55. Yu, J.; Chang, P.K.; Bhatnagar, D.; Cleveland, T.E. Cloning of a sugar utilization gene cluster in Aspergillus parasiticus. Biochim. Biophys. Acta 2000, 1493, 211–214. [Google Scholar] [CrossRef] [PubMed]
  56. Yu, J.; Chang, P.K.; Ehrlich, K.C.; Cary, J.W.; Bhatnagar, D.; Cleveland, T.E.; Payne, G.A.; Linz, J.E.; Woloshuk, C.P.; Bennett, J.W. Clustered Pathway Genes in Aflatoxin Biosynthesis. Appl. Environ. Microbiol. 2004, 70, 1253–1262. [Google Scholar] [CrossRef] [PubMed]
  57. Subramanian, A.R.; Weyer-Menkhoff, J.; Kaufmann, M.; Morgenstern, B. DIALIGN-T: An improved algorithm for segment-based multiple sequence alignment. BMC Bioinform. 2005, 6, 66. [Google Scholar] [CrossRef] [PubMed]
  58. Ranwez, V.; Harispe, S.; Delsuc, F.; Douzery, E.J.P. MACSE: Multiple Alignment of Coding SEquences accounting for frameshifts and stop codons. PLoS ONE 2011, 6, e22594. [Google Scholar] [CrossRef]
  59. Lee, I.; Kim, Y.O.; Park, S.C.; Chun, J. OrthoANI: An improved algorithm and software for calculating average nucleotide identity. Int. J. Syst. Evol. Microbiol. 2016, 66, 1100–1103. [Google Scholar] [CrossRef]
  60. Barbas, C.; Dams, A.; Majors, R.E. Separation of Aflatoxins by HPLC; Agilent Technologies: Santa Clara, CA, USA, 2005. [Google Scholar]
  61. Xiao, Y.; An, R.; Huber, U. Sensitive Fluorescence Analysis of Aflatoxins Using Post-Column UV Derivatization on the Agilent 1260 Infinity LC; Agilent Technologies: Santa Clara, CA, USA, 2013. [Google Scholar]
  62. Palmer, J.M.; Stajich, J. Funannotate v1.8.1: Eukaryotic geome annotation. Zenodo 2020, 4054262. [Google Scholar] [CrossRef]
  63. Katoh, K.; Rozewicki, J.; Yamada, D. MAFFT online service: Multiple sequence alignment, interactive sequence choice and visualization. Brief. Bioinform. 2019, 20, 1160–1166. [Google Scholar] [CrossRef]
  64. Kuraku, S.; Zmasek, C.M.; Nishimura, O.; Katoh, K. aLeaves facilitates on-demand exploration of metazoan gene family trees on MAFFT sequence alignment server with enhanced interactivity. Nucleic Acid Res. 2013, 41, W22–W28. [Google Scholar] [CrossRef]
  65. Pearson, W.R.; Lipman, D.J. Improved tools for biological sequence comparison. Proc. Natl. Acad. Sci. USA 1998, 85, 2444–2448. [Google Scholar] [CrossRef]
  66. Altschul, S.F.; Gish, W.; Miller, W.; Myers, E.W.; Lipman, D.J. Basic local alignment search tool. J. Mol. Biol. 1990, 215, 403–410. [Google Scholar] [CrossRef] [PubMed]
  67. Caceres, I.; Khoury, A.A.; Khoury, R.E.; Lorber, S.; Oswald, I.P.; Khoury, A.E.; Atoui, A.; Puel, O.; Bailly, J.D. Aflatoxin Biosynthesis and Genetic Regulation: A Review. Toxins 2020, 12, 150. [Google Scholar] [CrossRef]
  68. Bok, J.W.; Keller, N.P. LaeA, a Regulator of Secondary Metabolism in Aspergillus spp. Eukaryot. Cell 2004, 3, 527–535. [Google Scholar]
  69. Kalendar, R.; Shevtsov, A.; Otarbay, Z.; Ismailova, A. In silico PCR analysis: A comprehensive bioinformatics tool for enhancing nucleic acid amplification assays. Front. Bioinform. 2024, 4, 1464197. [Google Scholar] [CrossRef]
  70. Mintognissè, F.J.P.; Sissinto, A.Y.C.; Mawuton, A.H.U. Geographic Distribution of Aspergillus section Flavi Subspecies Isolated from Crops, Foods, and Feedstuffs in Benin. Adv. Microbiol. 2023, 13, 361–372. [Google Scholar]
  71. Mohammed, A.; Faustinelli, P.C.; Chala, A.; Dejene, M.; Fininsa, C.; Ayalew, A.; Ojiewo, C.O.; Hoisington, D.A.; Sobolev, V.S.; Martínez-Castillo, J.; et al. Genetic fingerprinting and aflatoxin production of Aspergillus section Flavi associated with groundnut in eastern Ethiopia. BMC Microbiol. 2021, 21, 239. [Google Scholar] [CrossRef]
  72. Ajmal, M.; Alshannaq, A.F.; Moon, H.; Choi, D.; Akram, A.; Nayyar, B.G.; Gibbons, J.G.; Yu, J.H. Characterization of 260 Isolates of Aspergillus section Flavi Obtained from Sesame Seeds in Punjab, Pakistan. Toxins 2022, 14, 117. [Google Scholar] [CrossRef]
  73. El-Dawy, E.G.A.M.; Gherbawy, Y.A.; Hussein, M.A. Characterization of Aspergillus section Flavi associated with stored grains. Mycotoxin Res. 2024, 40, 187–202. [Google Scholar] [CrossRef]
  74. Payne, G.A.; Nierman, W.C.; Wortman, J.R.; Pritchard, B.L.; Brown, D.; Dean, R.A.; Bhatnagar, D.; Cleveland, T.E.; Machida, M.; Yu, J. Whole genome comparison of Aspergillus flavus and A. oryzae. Med. Mycol. 2006, 44, 9–11. [Google Scholar] [CrossRef]
  75. Carbone, I.; Ramirez-Prado, J.H.; Jakobe, J.L.; Horn, B.W. Gene duplication, modularity and adaptation in the evolution of the aflatoxin gene cluster. BMC Evol. Biol. 2007, 7, 111. [Google Scholar] [CrossRef]
  76. Gilbert, M.K.; Mack, B.M.; Moore, G.G.; Downey, D.L.; Lebar, M.D.; Joardar, V.; Losada, L.; Yu, J.; Nierman, W.C.; Bhatnagar, D. Whole genome comparison of Aspergillus flavus L-morphotype strain NRRL 3357 (type) and S-morphotype strain AF70. PLoS ONE 2018, 13, e0199169. [Google Scholar] [CrossRef]
  77. Thammarongtham, C.; Nookaew, I.; Vorapreeda, T.; Srisuk, T.; Land, M.L.; Jeennor, S.; Laoteng, K. Genome Characterization of Oleaginous Aspergillus oryzae BCC7051: A Potential Fungal-Based Platform for Lipid Production. Curr. Microbiol. 2018, 75, 57–70. [Google Scholar] [CrossRef]
  78. Hong, S.B.; Lee, M.; Kim, D.H.; Chung, S.H.; Shin, H.D.; Samson, R.A. The proportion of non-aflatoxigenic strains of the Aspergillus flavus/oryzae complex from meju by analyses of the aflatoxin biosynthetic genes. J. Microbiol. 2013, 51, 766–772. [Google Scholar] [CrossRef]
  79. Probst, C.; Bandyopadhyay, R.; Cotty, P.J. Diversity of aflatoxin-producing fungi and their impact on food safety in sub-Saharan Africa. Int. J. Food Microbiol. 2014, 174, 113–122. [Google Scholar] [CrossRef] [PubMed]
  80. Jia, X.; Song, J.; Wu, Y.; Feng, S.; Sun, Z.; Hu, Y.; Yu, M.; Han, R.; Zeng, B. Strategies for the Enhancement of Secondary Metabolite Production via Biosynthesis Gene Cluster Regulation in Aspergillus oryzae. J. Fungi. 2024, 10, 312. [Google Scholar] [CrossRef]
  81. Kale, S.P.; Milde, L.; Trapp, M.K.; Frisvad, J.C.; Keller, N.P.; Bok, J.W. Requirement of LaeA for secondary metabolism and sclerotial production in Aspergillus flavus. Fungal Genet. Biol. 2008, 45, 1422–1429. [Google Scholar] [CrossRef] [PubMed]
  82. Mitema, A.; Feto, N.A.; Okoth, S.; Rafudeen, M.S. A Tool for Reliable Detection of Aflatoxin Biosynthetic Gene Clusters in Aflatoxigenic and Atoxigenic Aspergillus flavus Isolates. bioRxiv 2021. [Google Scholar] [CrossRef]
  83. Shweta, S.; Madhavan, S.; Paranidharan, V.; Velezhahan, R. Detection of Aspergillus flavus in maize kernels by conventional and real-time PCR assays. Int. Food Res. J. 2013, 20, 3329. [Google Scholar]
  84. Kim, W.B.; Park, C.; Cho, S.Y.; Chun, H.S.; Lee, D.G. Development of multiplex real-time PCR for rapid identification and quantitative analysis of Aspergillus species. PLoS ONE 2020, 15, e0229561. [Google Scholar] [CrossRef]
  85. Rahman, H.U.; Yue, X.; Ren, X.; Zhang, W.; Zhang, Q.; Li, P. Multiplex PCR assay to detect Aspergillus, Penicillium and Fusarium species simultaneously. Food Addit. Contam. 2020, 37, 1939–1950. [Google Scholar] [CrossRef]
  86. Tokamani, M.; Figgou, E.; Papamichail, L.; Sakka, E.; Toros, A.; Bouchorikou, A.; Giannakakis, A.; Matthaiou, E.I.; Sandaltzopoulos, R. A Multiplex PCR Melting-Curve-Analysis-Based Detection Method for the Discrimination of Five Aspergillus Species. J. Fungi 2023, 9, 842. [Google Scholar] [CrossRef] [PubMed]
  87. van Weezep, E.; Kooi, E.A.; van Rijn, P.A. PCR diagnostics: In silico validation by an automated tool using freely available software programs. J. Virol. Methods 2019, 270, 106–112. [Google Scholar] [CrossRef] [PubMed]
  88. Schuler, G.D. Sequence Mapping by Electronic PCR. Genome Res. 1997, 7, 541–550. [Google Scholar] [CrossRef] [PubMed]
  89. Kalendar, R.; Khassenov, B.; Ramankulov, Y.; Samuilova, O.; Ivanov, K.I. FastPCR: An in silico tool for fast primer and probe design and advanced sequence analysis. Genomics 2017, 109, 312–319. [Google Scholar] [CrossRef]
  90. Georgianna, D.R.; Payne, G.A. Genetic regulation of aflatoxin biosynthesis: From gene to genome. Fungal Genet. Biol. 2009, 46, 113–125. [Google Scholar] [CrossRef]
  91. Chang, P.K. Creating large chromosomal segment deletions in Aspergillus flavus by a dual CRISPR/Cas9 system: Deletion of gene clusters for production of aflatoxin, cyclopiazonic acid, and ustiloxin B. Fungal Genet. Biol. 2024, 170, 103863. [Google Scholar] [CrossRef]
  92. den Dunnen, J.T.; Dalgleish, R.; Maglott, D.R.; Hart, R.K.; Greenblatt, M.S.; McGowan-Jordan, J.; Roux, A.F.; Smith, T.; Antonarakis, S.E.; Taschner, P.E.M. HGVS Recommendations for the Description of Sequence Variants: 2016 Update. Hum. Mutat. 2016, 37, 564–569. [Google Scholar] [CrossRef]
Figure 1. Phylogenetic tree of 30 strains of Aspergillus section Flavi. Maximum likelihood phylogenetic analysis was conducted using (a) the full sequences of ABGC and (b) the whole genome sequences of 30 strains of Aspergillus section Flavi. The whole genome sequences of 22 strains were obtained from the GenBank, while the others were derived from our previous study [49]. Four strains (A. oryzae KBP3, RIB326, BCC7051, and A. flavus 26-3) possessing large deletions in the ABGC are excluded from the ABGC-based phylogenetic tree. An asterisk (*) indicates strains isolated from nuruk, and strains belonging to another clade are shown in bold.
Jof 12 00010 g001
Figure 2. Structural comparison of 35 genes in ABGCs of Aspergillus section Flavi. (a) The structural differences of 35 ABGC genes, spanning approximately 78 kb on 3′ end of chromosome 3, are schematically depicted. The 30 strains of Aspergillus section Flavi were categorized into five deletion types based on structural differences of 35 genes in ABGC. Deletion type I includes 2 strains of A. oryzae (KYI32 and KJJ4b) and 8 strains of A. flavus (54-2, ATCC22546, 78-6, NRRL3357, 3-2, 106-4, 72-5, and 79-2); type II includes 9 strains of A. oryzae (KSS2, RIB40, SRCM101975, SRCM101989, KDG21, AS3.951, 100-8, 3.042, and AS3.863) and 2 strains of A. flavus (AF70 and KSW16); type III includes 2 strains A. oryzae KBP3 and BCC7051; type IV includes A. oryzae RIB326; type V includes A. flavus 26-3. The arrows indicate the direction of gene transcription. The color of arrow indicates the category of enzyme or product associated with aflatoxin biosynthesis, as encoded by the corresponding gene. The new and old nomenclatures for each gene in ABGC are presented in bold and in parentheses above each gene, respectively [67]. (b) Species-specific small deletions in aflT, aflU (cypA), and aflF (norB) genes were depicted. Deletion type II A. oryzae, which possessed all 35 ABGC genes, exhibited approximately 0.3 kb deletions from the 3′-end of the aflT gene to the intergenic region to the aflC gene in comparison to A. flavus, A. sojae and A. parasiticus. And A. oryzae exhibited a deletion in the intergenic region including the 5′-end of the aflU and aflF genes, resulting in the aflU-aflF region being about 1.5 kb shorter than that of A. sojae and A. parasiticus, and 0.6 kb shorter than that of A. flavus. In the stance of A. flavus, a deletion was present in the intergenic region of aflU and aflF, resulting in the aflU-aflF region being 0.9 kb shorter than that of A. sojae and A. parasiticus.
Jof 12 00010 g002
Figure 3. Target location of the four newly designed primer sets on ABGC. The target location of the primer sets designed to differentiate A. oryzae and A. flavus based on the differences in gene sequences within ABGC of two species was depicted. The four primer sets comprise as follow; YE1 and YE2 pair and E1 and E2 pair which target the aflYe gene (start) and AFLA_13945 gene (end), respectively, and CT1 and CT2, UF1 and UF2, which target the aflCaflT (CT) region and the aflUaflF (UF) region, where differences in gene sequences between A. oryzae and A. flavus are present, respectively. The nucleotide positions of the target locations for the primer sets are shown in Table 1, and accordingly, the locations of these primer sets were illustrated. The red and blue arrows indicate forward and reverse primers, respectively. The gray arrows indicate the transcriptional direction of ABGC genes, and black lines represent intergenic regions.
Jof 12 00010 g003
Figure 4. PCR pattern of A. oryzae and A. flavus using the newly designed primer sets. The four PCR patterns and corresponding amplicon sizes for four regions in ABGC, as determined by PCR analysis using ABGC-targeting primer sets, are illustrated. The gray arrows and black lines each represent the gene and intergenic region, respectively. Light gray boxes and dashed lines represent deleted genes and deleted intergenic regions, respectively. In the AO1 pattern, all four regions are amplified, with the amplicon sizes for the CT and UF regions being around 1.4 and 1.6 kb, respectively. The AO2 pattern refers to the amplification of just the aflYe gene (start). For the AF1 pattern, all four regions are amplified, with the amplicon sizes for the CT and UF regions being around 1.7 and 1.6 kb, respectively. In the AF2 pattern, all four regions are amplified, with the amplicon sizes for the CT and UF regions being around 1.7 and 1.6 kb, respectively. The amplicon sizes for four PCR patterns were verified using electrophoresis on 1% agarose gel. The representative strains examined to verify the PCR amplicon sizes for each pattern were A. oryzae KSS2, KBP3, A. flavus KSW16, and ATCC22546. The marker (M) utilized for electrophoresis was GeneRuler 1 kb plus DNA ladder.
Jof 12 00010 g004
Figure 5. laeA gene and expected LaeA structure of A. oryzae KYI32. The substitution mutation in the laeA gene of A. oryzae KYI32 and the expected structure of LaeA, a global regulator of secondary metabolism of Aspergillus spp. [68], as predicted by BLAST, are schematically illustrated. In the laeA gene sequence, gray solid lines represent exons, whereas black lines represent introns. The location of mutation in sequence of laeA gene is highlighted in gray, and the start and stop codons are shown in bold. The expected sizes of LaeA are depicted in a gray box. (a) Compared to A. oryzae KSS2 and A. flavus NRRL3357, which have a normal laeA gene, (b) A. oryzae KYI32 had a substitution of guanine (G) with adenine (A) at 758th nucleotide position of laeA gene. BLAST analysis using laeA gene sequences of A. oryzae KYI32 indicated two anomalies in LaeA expression: an internal stop codon at 758th nucleotide position in the laeA gene, leading to the expression of truncated LaeA, or an internal intronization at 618th to 816th nucleotide position of laeA gene.
Jof 12 00010 g005
Table 1. List of four newly designed primer sets targeting ABGC for the differentiation of A. oryzae and A. flavus in this study.
Target Region on ABGCPrimer 2Sequence 3GC Content (%)Ta 4
(°C)
Nucleotide Position 5
(bp)
aflYeYE15′-CATGTGCATCACGGCATGAG-3′55.064.8304–621
YE25′-ATAACCAGCGGTTCTGCCAA-3′50.0
aflC–aflTCT15′-TGTGTCGGGGACCTCTATGT-3′55.065.270,774–72,500
CT25′-CCCTCCCTGTGTGATGTGTC-3′60.0
aflU–aflFUF15′-CAACTGCTCGACTGTCGTCT-3′55.064.974,498–76,669
UF25′-GAATTGGCTTCGCTCCCTCT-3′55.0
AFLA_13945 1E15′-AGGCTCTGGGATCAAAGCTC-3′55.064.277,621–77,942
E25′-TAGCGCTGGCATTGAAACAG-3′50.0
1 The AFLA_13945 (EED51179.1 for A. oryzae RIB40) is the last gene in ABGC of A. flavus NRRL3357. Since the sequences of AFLA_13945 gene of A. oryzae and A. flavus are slightly different, two primer sets targeting the AFLA_13945 gene were designed as shown in Table S1. 2 Forward primer sequences are written above. 3 The primer sequences that exhibit sequence variation between A. oryzae and A. flavus are highlighted in underline. 4 Annealing temperature. 5 The start and end positions of the primers within the ABGC were arranged according to A. flavus NRRL3357, ranging from aflYe to AFLA_13945.
Table 2. PCR patterns for A. oryzae and A. flavus strains isolated from nuruk, as determined by PCR analysis using the newly designed primer sets.
PCR Pattern 1No. of Strains 2
A. oryzaeA. flavus
AO1350
AO2640
AF181
AF218
Total1089
1 The PCR product size of each pattern is shown in Figure 4. 2 Genomic DNA was extracted from 108 strains of A. oryzae and 9 strains of A. flavus isolated from nuruk. PCR analysis was conducted using ABGC-targeting primer sets, and the PCR amplicon size for each strain was confirmed by electrophoresis on a 1% agarose gel. The PCR pattern of each strain was determined according to Figure 4.
Table 3. iPCR analysis on A. oryzae and A. flavus using the newly designed primer sets.
PCR Pattern 1No. of Strains 2
A. oryzaeA. flavus
AflatoxigenicNon-Aflatoxigenic
AO14317
AO271676
AF116657
AF21876
Exception0116
Total116161162
1 The PCR product size of each pattern is shown in Figure 4. The exception pattern is those that cannot be classified due to the anomalous sizes of some PCR products analyzed. 2 The genome sequences designated as A. oryzae (116 genomes) and A. flavus (257 genomes) were obtained from the GenBank for iPCR analysis [69]. Additionally, 225 genomes of A. flavus were obtained from the AflaPan [52]. iPCR analysis was performed using Fasta v36.3 [65] to determine whether the ABGC-targeting primer sets were aligned to the 116 genomes of A. oryzae and 482 genomes of A. flavus and to predict the PCR amplicon sizes. The PCR pattern of each strain was determined according to Figure 4. For A. flavus, the PCR patterns of 482 genomes tested for aflatoxin production are summarized in Table S5. iPCR analysis showed that among the 116 genomes of A. oryzae, only two strains (KJJ4b—AF1, KYI32—AF2) were not classified as AO1 or AO2 pattern.
Disclaimer/Publisher’s Note: The statements, opinions and data contained in all publications are solely those of the individual author(s) and contributor(s) and not of MDPI and/or the editor(s). MDPI and/or the editor(s) disclaim responsibility for any injury to people or property resulting from any ideas, methods, instructions or products referred to in the content.