Article

Comparative Mitogenome Analysis of Colletotrichum Species Causing Anthracnose of Rubber Trees Unveils Distinct Species Complex-Specific Evolution Trajectories Within the Genus

1
Sanya Institute of Breeding and Multiplication/School of Tropical Agriculture and Forestry, Hainan University, Haikou 570228, China
2
Danzhou Invasive Species Observation and Research Station of Hainan Province, Hainan University, Danzhou 571799, China
*
Authors to whom correspondence should be addressed.
J. Fungi 2025, 11(9), 679; https://doi.org/10.3390/jof11090679
Submission received: 15 July 2025 / Revised: 5 September 2025 / Accepted: 12 September 2025 / Published: 16 September 2025
(This article belongs to the Section Fungal Evolution, Biodiversity and Systematics)

Abstract

Colletotrichum spp. are the causative agents of anthracnose of rubber trees, one of the most destructive diseases, resulting in substantial economic losses. To investigate the evolutionary characteristics of these pathogenic species, we first assembled the complete mitogenomes of four dominant pathogens, i.e., C. siamense, C. fructicola, C. wanningense and C. bannaense. Comparative analyses revealed that variations in their mitogenome size were primarily driven by intron expansion and expansion/contraction within the cox1, cob and nad genes. Moreover, we observed the strong conservation of gene content, mitochondrial DNA copy number, gene order and intron features within species complexes, but a clear divergence between them. Notably, further studies indicated that patterns such as genomic organization, selective pressures and codon usage were consistent across the genus, suggesting that Colletotrichum species complexes had followed distinct evolutionary trajectories, particularly in the arrangement of protein-coding genes. Therefore, this study systematically characterized the mitogenomes of the four major Colletotrichum species associated with rubber tree anthracnose and provided novel insights into the broad evolutionary mechanisms shaping Colletotrichum species complexes.

1. Introduction

The rubber tree (Hevea brasiliensis) serves as the principal source of natural rubber in tropical regions and underpins a globally significant plantation industry [1]. Rubber production is increasingly threatened by foliar diseases that compromise tree health and latex yield, among which anthracnose is particularly damaging [2]. Anthracnose of rubber trees is caused by a complex assemblage of Colletotrichum species and leads to extensive necrosis, premature defoliation and substantial reductions in rubber yield [3]. Notably, surveys have identified more than ten distinct Colletotrichum taxa (in five species complexes) isolated from leaf disease lesions on H. brasiliensis in China, suggesting unexpectedly high species diversity [2,3]. However, the current research on these pathogenic species remains relatively limited. Up to now, only a few whole-genome sequences of Colletotrichum species that cause rubber tree anthracnose have been reported [4].
Among these Colletotrichum species, C. siamense, C. fructicola, C. wanningense (syn. C. australisinense) and C. bannaense have been investigated as the dominant pathogens that cause rubber tree anthracnose in China [3,4,5]. C. siamense and C. fructicola belong to the C. gloeosporioides species complex and C. wanningense and C. bannaense are members of the C. acutatum species complex. The four Colletotrichum species exhibit distinct lesion phenotypes, i.e., C. siamense and C. fructicola produce rapidly expanding brown to grayish lesions with unclear edges and C. wanningense forms large necrotic lesions with water-soaked edges, whereas C. bannaense causes small, shallow and weakly spreading lesions with a low pathogenicity. Additionally, these species exhibit a clear divergence in terms of their colony morphology, thermal adaptation and pathogenic potential [3,4,6,7].
In fungi, mitochondria serve as essential organelles that act as platforms for efficient energy metabolism and hubs for biosynthetic processes, and they play diverse roles in growth, environmental adaptation, aging, host–pathogen interactions and drug resistance [8,9,10,11,12]. Fungal mitogenomes evolve and organize autonomously, showing significant divergence from nuclear genomes. Fungal mitogenomes contain 15 typical protein-coding genes (PCGs) involved in the electron transport chain and oxidative phosphorylation, including those for Complex I (nad1–nad6 and nad4L), Complex III (cob), Complex IV (cox1–cox3) and Complex V (atp6, atp8, atp9), as well as the gene encoding the ribosomal small subunit protein (rps3). In addition, fungal mitogenomes likely include non-coding RNA genes related to translation (such as rnl, rns and various tRNAs), the RNaseP gene (rnpB) and various intronic open reading frames (ORFs) [13]. The structures of mitogenomes vary widely; for example, they differ in their overall genome size, the number of introns and the gene order. Hitherto, variations in fungal mitogenomes have proven useful as molecular markers for reflecting phylogenetic relationships and population genetics [14]. Furthermore, the mitogenomes of fungal pathogens may be associated with their adaptation to host organisms [15,16]. However, to date, there have been no reports on the mitogenomes of Colletotrichum species that cause rubber tree anthracnose.
Therefore, in this study, we de novo assembled and analyzed the complete mitogenomes of the four major Colletotrichum species responsible for rubber tree anthracnose, i.e., C. siamense and C. fructicola (the C. gloeosporioides species complex) and C. wanningense and C. bannaense (the C. acutatum species complex). The genome structure, gene arrangement, intron content, mitochondrial DNA (mtDNA) copy number, codon usage and gene selective pressure were comprehensively analyzed, suggesting highly conserved characteristics within Colletotrichum species complexes, but significant variations between species complexes. A subsequent integrative analysis with an additional 30 Colletotrichum mitogenomes (comprising 19 species across 6 species complexes) revealed distinct species-complex specific evolution trajectories in the Colletotrichum genus, especially the PCG arrangement and intron expansion/contraction. Our study elucidated the mitogenomic variation among the Colletotrichum species that cause anthracnose of rubber trees and offers an evolutionary perspective into the specific evolutionary adaptation of Colletotrichum species complexes.

2. Materials and Methods

2.1. Single-Spore Isolation, DNA Extraction and Sequencing

Colletotrichum strains were isolated from anthracnose lesions on rubber tree (Hevea brasiliensis) leaves collected in Hainan Province, P. R. China. The infected tissues were surface-sterilized using 75% ethanol and rinsed with sterile distilled water before being cultured on potato dextrose agar (PDA) medium. Fungal isolates were purified using single-spore isolation under a stereomicroscope. The cultures were incubated at 28 °C in the dark for 7–10 days, and mycelia were harvested for DNA extraction. Genomic DNA was extracted using the cetyltrimethylammonium bromide (CTAB) method and subsequently purified using a T3010 genomic DNA purification kit (Tiangen Biotech, Beijing, China) according to the manufacturer’s instructions. The DNA integrity was verified using standard 0.75% agarose gel electrophoresis. The DNA concentration was quantified using a Qubit 3.0 fluorometer (Thermo Fisher Scientific, Waltham, MA, USA). Qualified genomic DNA (7 μg) was sheared to an average fragment size of 15–20 kb using the Megaruptor 3 system (Diagenode, B06010003) and purified with 1× AMPure PB beads. The sheared DNA was eluted in 47 μL of Low TE buffer and subjected to qubit quantification. SMRTbell® libraries were constructed using the SMRTbell® prep kit 3.0 (PacBio, Menlo Park, CA, USA), following the manufacturer’s protocol, including DNA damage repair, end-repair, adapter ligation and exonuclease treatment. A size selection of DNA fragments (10–50 kb) was performed using the PippinHT system (Sage Science, Beverly, MA, USA) and the fragment distribution was assessed on a Femto Pulse system (Agilent, Santa Clara, CA, USA). Primer annealing and polymerase binding were carried out according to the PacBio Revio sequencing protocol. SMRT sequencing was performed on the PacBio Revio™ system using the Revio™ sequencing plate (PacBio, 102-587-400), polymerase kit (PacBio, 102-739-100) and SMRT Cell tray (PacBio, 102-202-200) with a 24-h run time [17].

2.2. Mitogenome Assembly

Mitogenome assembly was performed using a custom pipeline based on the modified Mitochondrial Long-read Iterative Assembly (MLIA) strategy [17,18]. The assembly process involved the following steps: (1) HiFi reads were initially mapped to a reference mitogenome using minimap2 v2.30 with the -x map-hifi parameter [19,20]; (2) mapped reads shorter than 1000 bp or with aligned lengths less than 800 bp were filtered using seqtk v1.3 (https://github.com/lh3/seqtk, accessed on 15 July 2025); and (3) filtered reads were assembled de novo using Canu v2.1.1 with the parameters optimized for HiFi input (-pacbio-hifi) [21,22]. The resulting contigs were then used as the reference for the next round of read recruitment and reassembly. This iterative process continued until the number of recruited mitochondrial reads reached a stable plateau and a complete circular contig representing the mitogenome was obtained.

2.3. mtDNA Copy Number Detection

The mycelia DNA was extracted from fungal mycelia using the E.Z.N.A.® Fungal DNA Kit (Omega Bio-Tek, D3390-10) according to the manufacturer’s instructions. Relative mtDNA copy number was determined by qPCR, with the nuclear single-copy gene RPB1 used as the reference and the mitochondrial gene NAD4 as the target [23,24]. Primers for RPB1 were 5′-ATGAAGCAGGCTCCCGT-3′ (forward) and 5′-GGCTCCTCCTTCTTCTTGAC-3′ (reverse) and primers for NAD4 were 5′-GCTCACGGATTTGTATCTAGTGG-3′ (forward) and 5′-GTTAAAGGAGCTCCACAATTACCT-3′ (reverse). The Ct difference between RPB1 and NAD4 was used to estimate the relative mtDNA copy number.

2.4. Genome Annotation

The assembled mitogenomes were annotated using MFannot with the genetic code 4 (Mold, Protozoan and Coelenterate Mitochondrial; Mycoplasma/Spiroplasma) [25]. The tRNA genes were predicted using both MFannot and MITOS2 for cross-validation [25,26]. Group I and Group II introns were identified and classified using RNAweasel [27,28]. Intronic ORFs were predicted using ORFfinder v0.4.3 [29] and the transeq tool (with genetic code 4) in the EMBOSS v6.6.0 package [30]. Functional domains within intronic ORFs, including the reverse transcriptases (RTs) and homing endonucleases (HEs) of the LAGLIDADG or GIY-YIG families, were identified using the NCBI Conserved Domain Database (E-value < 1 ×10³) [31]. Short repeats and tandem repeats were identified using REPuter [32] and Tandem Repeat Finder v4.09 [33], respectively, under default settings. Whole-genome repetitive sequences were additionally annotated through BLASTN self-alignment (E-value < 1 ×10⁻¹⁰). The circular mitogenome maps displaying the arrangement and orientation of annotated features were generated using Circos v0.69-6 [34].

2.5. Synteny Analysis

The nucleotide-level homology was identified using BLASTN (E-value < 1 ×10⁻⁵) [35]. The resulting BLAST outputs were processed and visualized using a genome collinearity mapping tool called RectChr v1.1 (https://github.com/BGI-shenzhen/RectChr, accessed on 15 July 2025). Gene annotations were integrated to anchor syntenic blocks and highlight conserved PCGs, intron positions and genome rearrangements (e.g., inversions and translocations).

2.6. Phylogenetic Analysis Based on PCGs

Multiple assembled mitogenome sequences were collected from the NCBI nucleotide database. Genome sequences exhibiting incomplete assemblies, anomalously large or small sizes, or structural inconsistencies (e.g., duplicated core genes or truncated annotations) were excluded from the dataset to ensure phylogenetic reliability.
A total of 15 conserved PCGs (i.e., nad1-nad6, nad4L, cox1-cox3, cob, atp6, atp8, atp9 and rps3) were extracted. Each gene was aligned independently using MUSCLE v5.1 [36] using the codon alignment mode. The resulting alignments were concatenated into a supermatrix for phylogenetic inference. A maximum likelihood (ML) phylogenetic tree was constructed using IQ-TREE v2.2.2 [37] with the best-fit substitution model selected automatically. The branch support was assessed using 1000 bootstrap replicates under the standard bootstrap approach. The final tree was visualized and annotated using the Interactive Tree of Life (iTOL) v6 [38].

2.7. Composition, Codon Usage and Substitution Rate Analyses

The base composition of each mitogenome was calculated using SeqKit v2.2.0 [39]. The GC-skew and AT-skew were computed manually with the following formulas: GC-skew = (G − C)/(G + C) and AT-skew = (A − T)/(A + T). The codon usage statistics, including the codon frequencies and relative synonymous codon usage (RSCU) values, were obtained using BCAWT [40] and the Python v3.12 Codon Adaptation Index (CAI) module (https://pypi.org/project/CAI/, accessed on 15 July 2025). A total of 60 codons (excluding stop codons and the unique codon TGG for tryptophan) were assessed. The clustering of codon usage patterns was achieved using CIMminer [41], applying Euclidean distance and average linkage methods. To evaluate the codon usage patterns in Colletotrichum mitogenomes, RSCU values of 15 core PCGs were calculated and compared across 34 representative taxa. The non-synonymous substitution rates (dN), synonymous substitution rates (dS) and their ratios (dN/dS) were calculated using the yn00 program in the PAML v4.10.3 package [42,43], based on the method by Yang & Nielsen (2000). PCG orthologs in Colletotrichum species complexes with >2 species were extracted for the dN/dS calculation [44]. Codon-based sequence alignments in the dN/dS calculation steps were performed using MAFFT v7.505 [45] under genetic code 4.

2.8. Program and Data Availability

The MLIA pipeline is available on GitHub (https://github.com/lirepo/MLIA, accessed on 15 July 2025). The de novo assembled mitogenomes in this study are available in the GenBank database, i.e., C. siamense (CP150621.1), C. fructicola (CP150825.1), C. wanningense (PV763180.1) and C. bannaense (PV763181.1).

3. Results

3.1. De Novo Assembly and Structural Annotation

The gapless circular mitogenomes of the four major Colletotrichum species (i.e., C. siamense, C. fructicola, C. wanningense and C. bannaense) that cause anthracnose of rubber trees in China were assembled in this study. Among them, the complete mitogenomes of C. wanningense and C. bannaense were assembled for the first time in this study.
The complete mitogenomes of C. siamense and C. fructicola, belonging to the C. gloeosporioides species complex, were 52,394 bp and 55,955 bp in size, respectively. The mitogenomes of the two species had overall GC contents of 34.52% and 33.98%, respectively. In contrast, the mitogenomes of C. wanningense and C. bannaense, which are C. acutatum species complex members, were 30,949 bp and 30,944 bp in size, respectively. Both mitogenomes exhibited the same GC content, 30.59% (Figure 1; Table 1).
The mitochondrial core PCGs were conserved among the four Colletotrichum species. The C. siamense and C. fructicola mitogenomes contained 27 tRNA genes, while C. wanningense and C. bannaense had 28 tRNA genes. Compared to the slight difference in tRNA genes, the homing endonuclease ORFs belonging to the LAGLIDADG and GIY-YIG families were observed in C. siamense and C. fructicola, but absent in C. bannaense and C. wanningense, indicating their specific acquisition and maintenance of genetic elements.
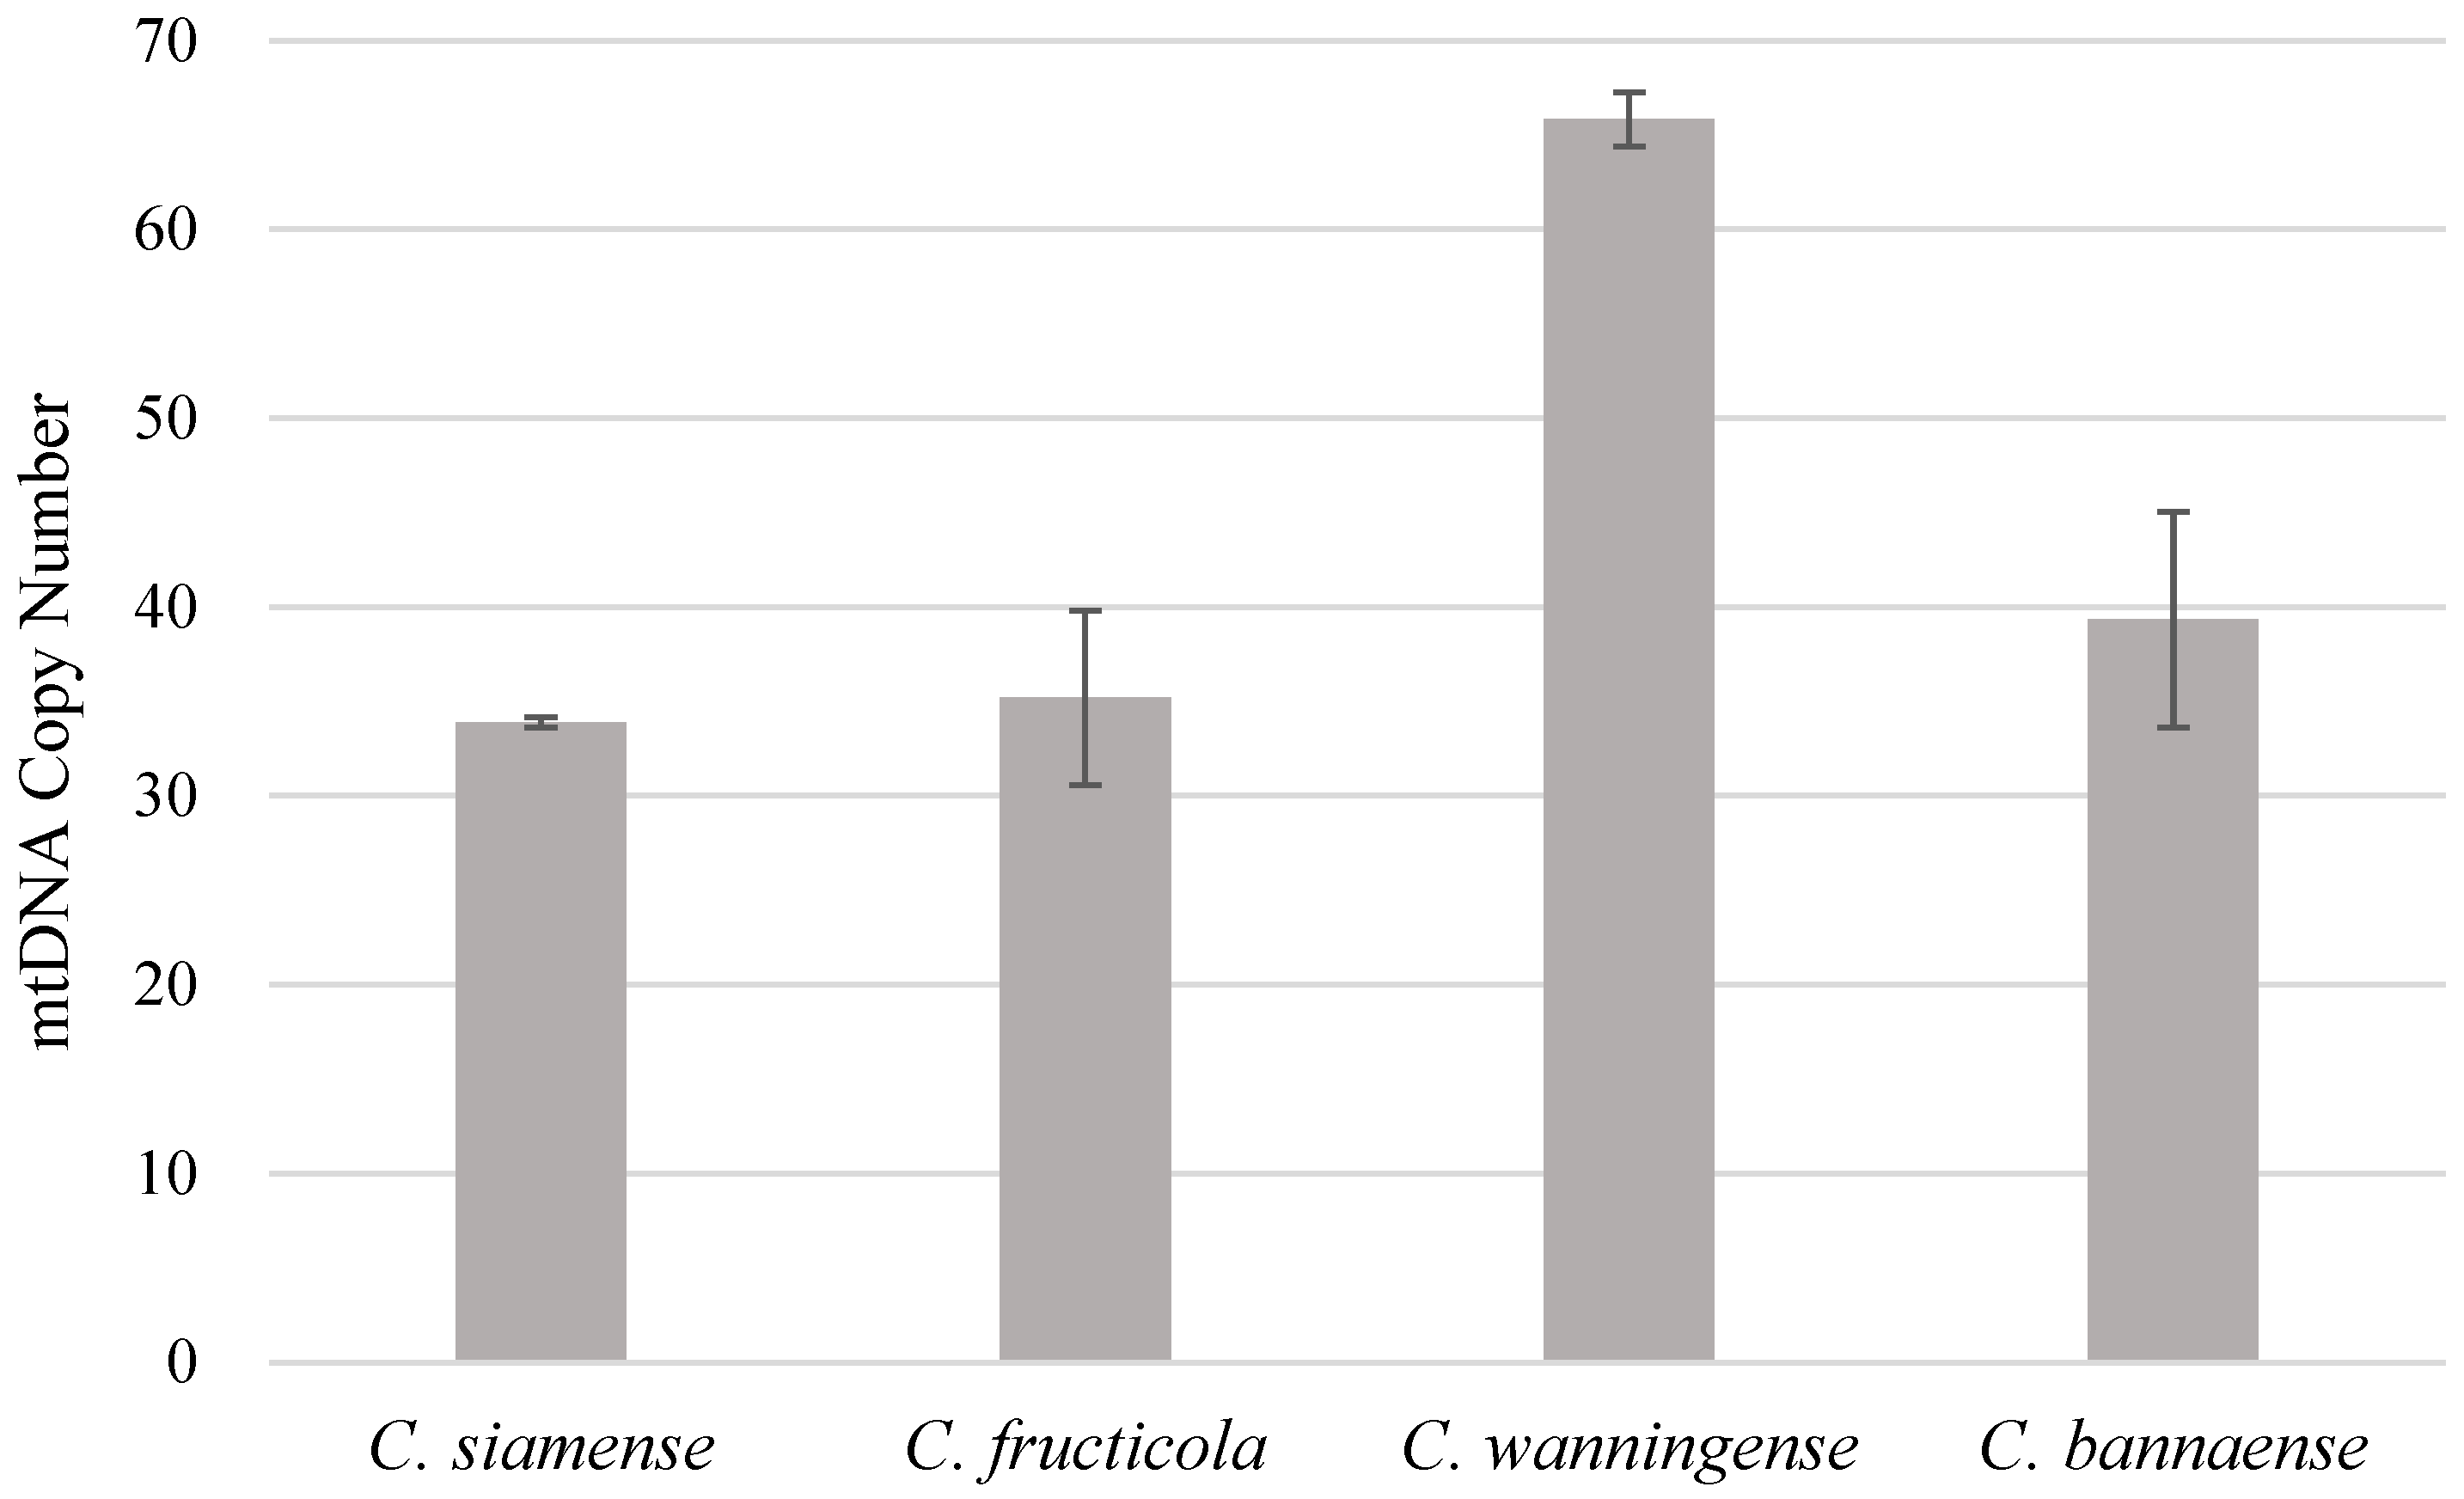
The mtDNA copy numbers of four Colletotrichum species were estimated by qPCR (Figure 2). Notable differences were observed among species: C. siamense and C. fructicola exhibited lower copy numbers (~35), whereas C. bannaense (~40) and C. wanningense (~65) showed higher values. Overall, the C. acutatum complex species had higher mtDNA copy numbers than the C. gloeosporioides complex species (t-test, p = 0.03).

3.2. Comparative Synteny Analysis Revealed Intron-Driven Genome Expansion

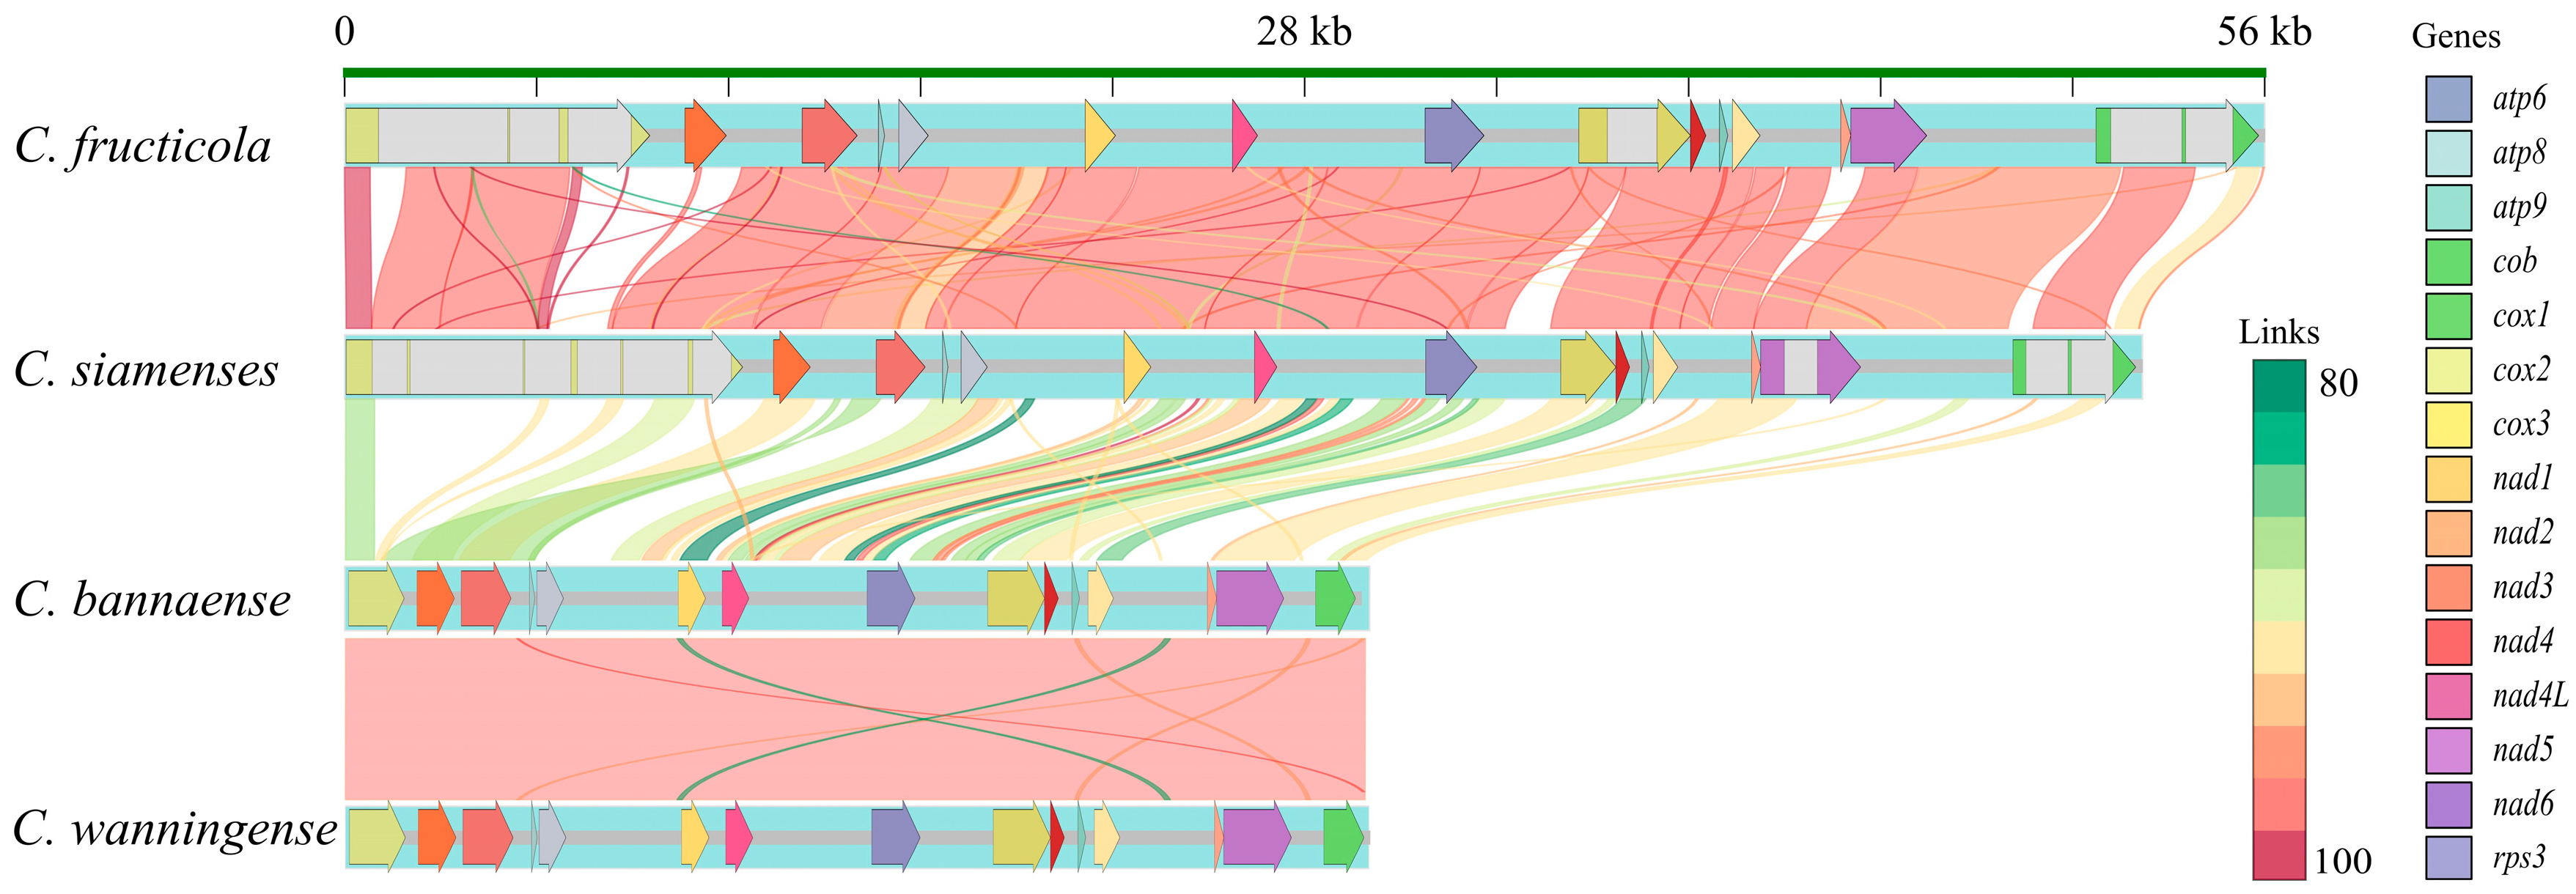
The four assembled mitogenomes displayed a conserved PCG content and order (Figure 3). The orientation of the PCGs remained consistent as well. However, the mitogenome sizes differed markedly. C. siamense and C. fructicola exhibited significantly larger mitogenomes (52,394 bp and 55,955 bp, respectively) than C. bannaense and C. wanningense (~30,944 bp). This size difference was primarily due to variations in the intronic regions, e.g., cox1, cob, nad2 and nad4 in C. fructicola and C. siamense. In contrast, C. bannaense and C. wanningense contained only one intron in their mitogenomes, resulting in a more compact genome structure. The mitogenomic regions were largely syntenic, as indicated by extensive BLASTN-derived sequence similarities.
A detailed analysis of the pairwise BLASTN alignment revealed relatively minor structural differences. C. siamense and C. fructicola exhibited extensive regions of a high sequence identity (≥95%) across nearly all coding regions, frequently spanning thousands of continuous base pairs without gaps. Several small insertions were detected in the C. fructicola mitogenome, notably within the 8.8 kb–16 kb and 24 kb–45 kb regions, corresponding to segments within or adjacent to the cox1, cob and nad genes.
The alignment of C. wanningense and C. bannaense showed a nearly perfect sequence identity across the entire mitogenome. Specifically, they exhibited a continuous 30,828 bp alignment with 99.93% identity and without gaps, highlighting an extremely high degree of structural conservation. No minor insertions or expansions were observed in the two species, suggesting a more conserved genomic structure in these two species compared to the two species that belong to the C. gloeosporioides species complex.

3.3. Structural Diversity of Colletotrichum Mitogenomics

To further systematically explore the evolutionary characteristics of the four Colletotrichum species, we collected 30 previously assembled mitogenomes of Colletotrichum species from the GenBank database (Table 2). The genome sizes of these mitogenomes were from ~29 kb (C. scovillei) to ~60 kb (C. gloeosporioides) and the GC contents were between 29.6% and 34.6%. Finally, a total of 34 mitogenomes, including the four newly assembled mitogenomes in our study, were subsequently analyzed.
A comparative analysis of conserved PCG arrangements revealed the distinct structural differentiation of mitogenomes across Colletotrichum species complexes. The gene order was highly conserved within species complexes, while significant variations were observed between species complexes (Figure 4). C. siamense, C. fructicola and C. gloeosporioides (C. gloeosporioides species complex) shared an identical arrangement of 15 PCGs. Analogously, the examined C. fioriniae, C. tamarilloi, C. acutatum, C. lupini and C. scovillei (C. acutatum species complex) exhibited a fully conserved gene order.
C. gigasporum (C. gigasporum species complex) displayed a rearranged gene order, with the cox1 gene relocated to the terminal region of the sequence, clearly differing from the conserved order observed in the C. acutatum species complex and the C. gloeosporioides species complex. Likewise, C. orbiculare and C. lindemuthianum (C. orbiculare species complex) exhibited a unique gene order pattern, with cob, nad1, nad4, atp8 and atp6 arranged differently from those in the other complexes. The gene order within the C. destructivum species complex and the C. graminicola species complex remained highly consistent, but they exhibited distinct gene arrangements for nad4 and cox1. These findings indicate that the Colletotrichum genus exhibits species complex-specific gene-arrangement patterns. Thus, the mitochondrial gene arrangement serves as an informative evolutionary trait and supports the delineation of species complexes as fundamental phylogenetic units within the genus.

3.4. Gene Selective Pressure Analysis

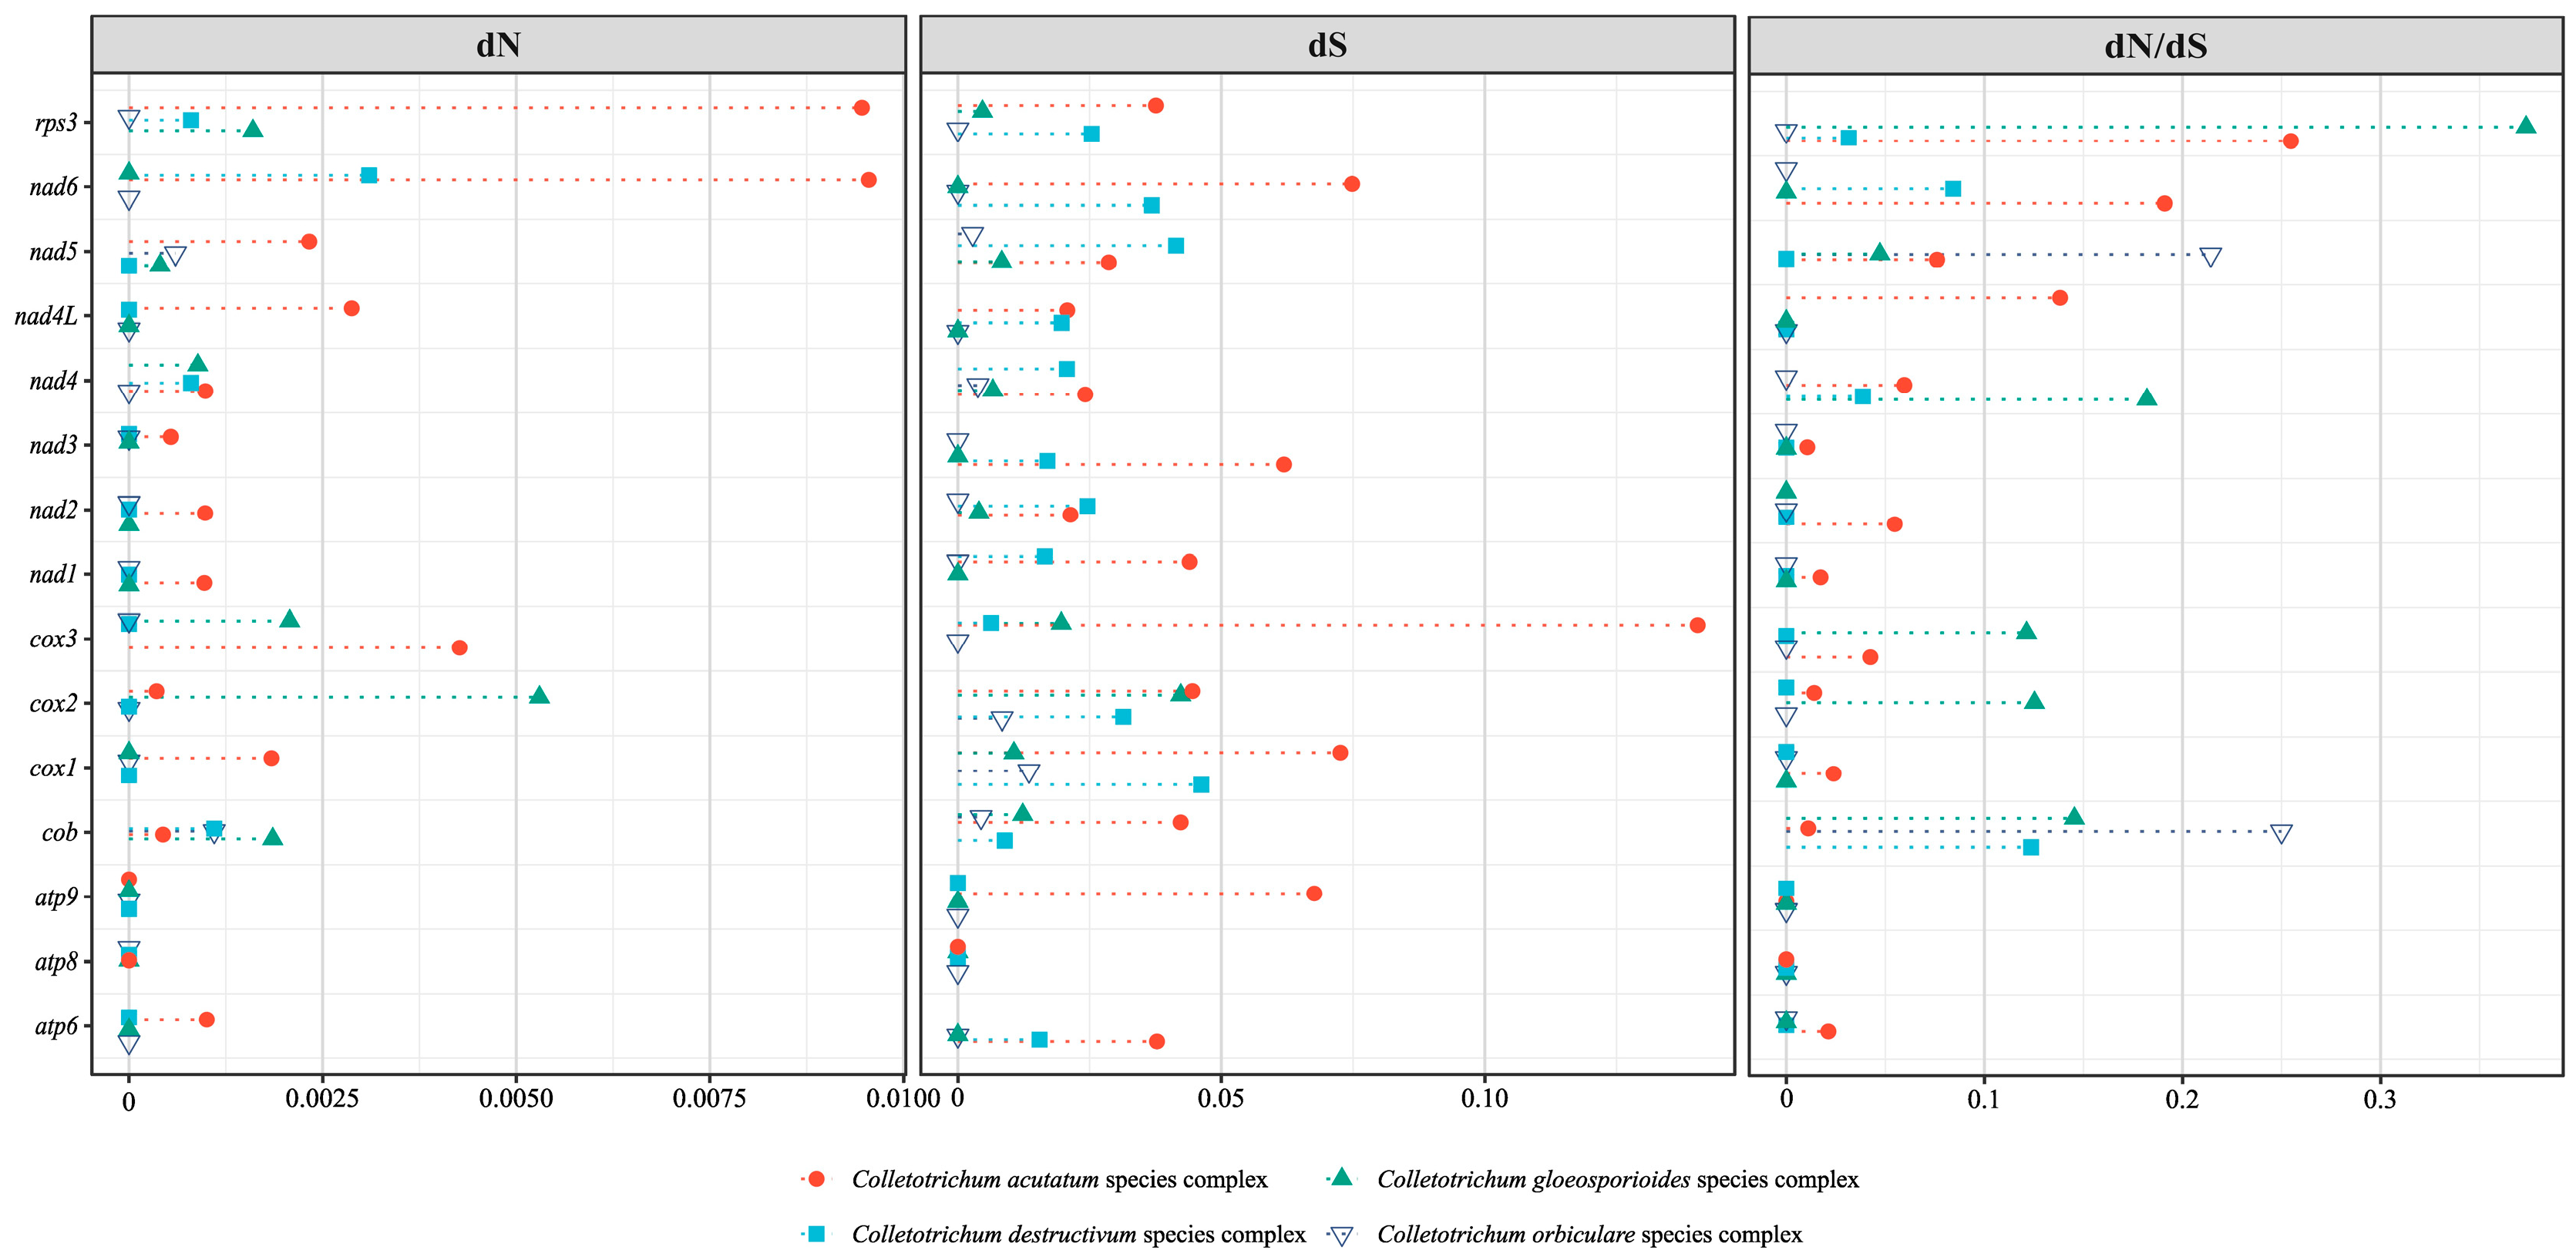
In general, the dN/dS values were predominantly below 0.1 (Figure 5). Most PCGs exhibited low dN and dS values across nearly all the species complexes. For example, atp6, cox1, cox2, cob and nad3 showed low dN values. Atp8 and atp9 had dN values of zero in most complexes. In some genes, the dS values were equal to zero, making dN/dS undefined, and thus, not reported.
In the C. acutatum species complex, the dN/dS ratios were 0.021 for atp6, 0.024 for cox1, 0.017 for nad1 and 0.014 for cox2. Higher values were observed for rps3 (0.255), nad6 (0.191) and nad4L (0.138). Other genes, such as nad5 (0.076), nad4 (0.060), nad2 (0.055) and cox3 (0.042), also showed non-zero values. In the C. destructivum species complex, most genes had dN values of zero. Cob had a dN of 0.0011 (dN/dS = 0.124), nad6 had a dN of 0.0031 (dN/dS = 0.084) and nad4 had a dN of 0.0008 (dN/dS = 0.039). Rps3 showed a dN/dS of 0.031. In the C. orbiculare species complex, most genes had dN values of zero. Cob and nad5 showed dN/dS values of 0.250 and 0.214, respectively. In the C. gloeosporioides species complex, the dN/dS ratios were observed across the genes as follows: 0.373 (rps3), 0.182 (nad4), 0.145 (cob), 0.125 (cox2) and 0.121 (cox3).

3.5. Codon Usage Patterns Reflect Translational Stability Within Species Complexes

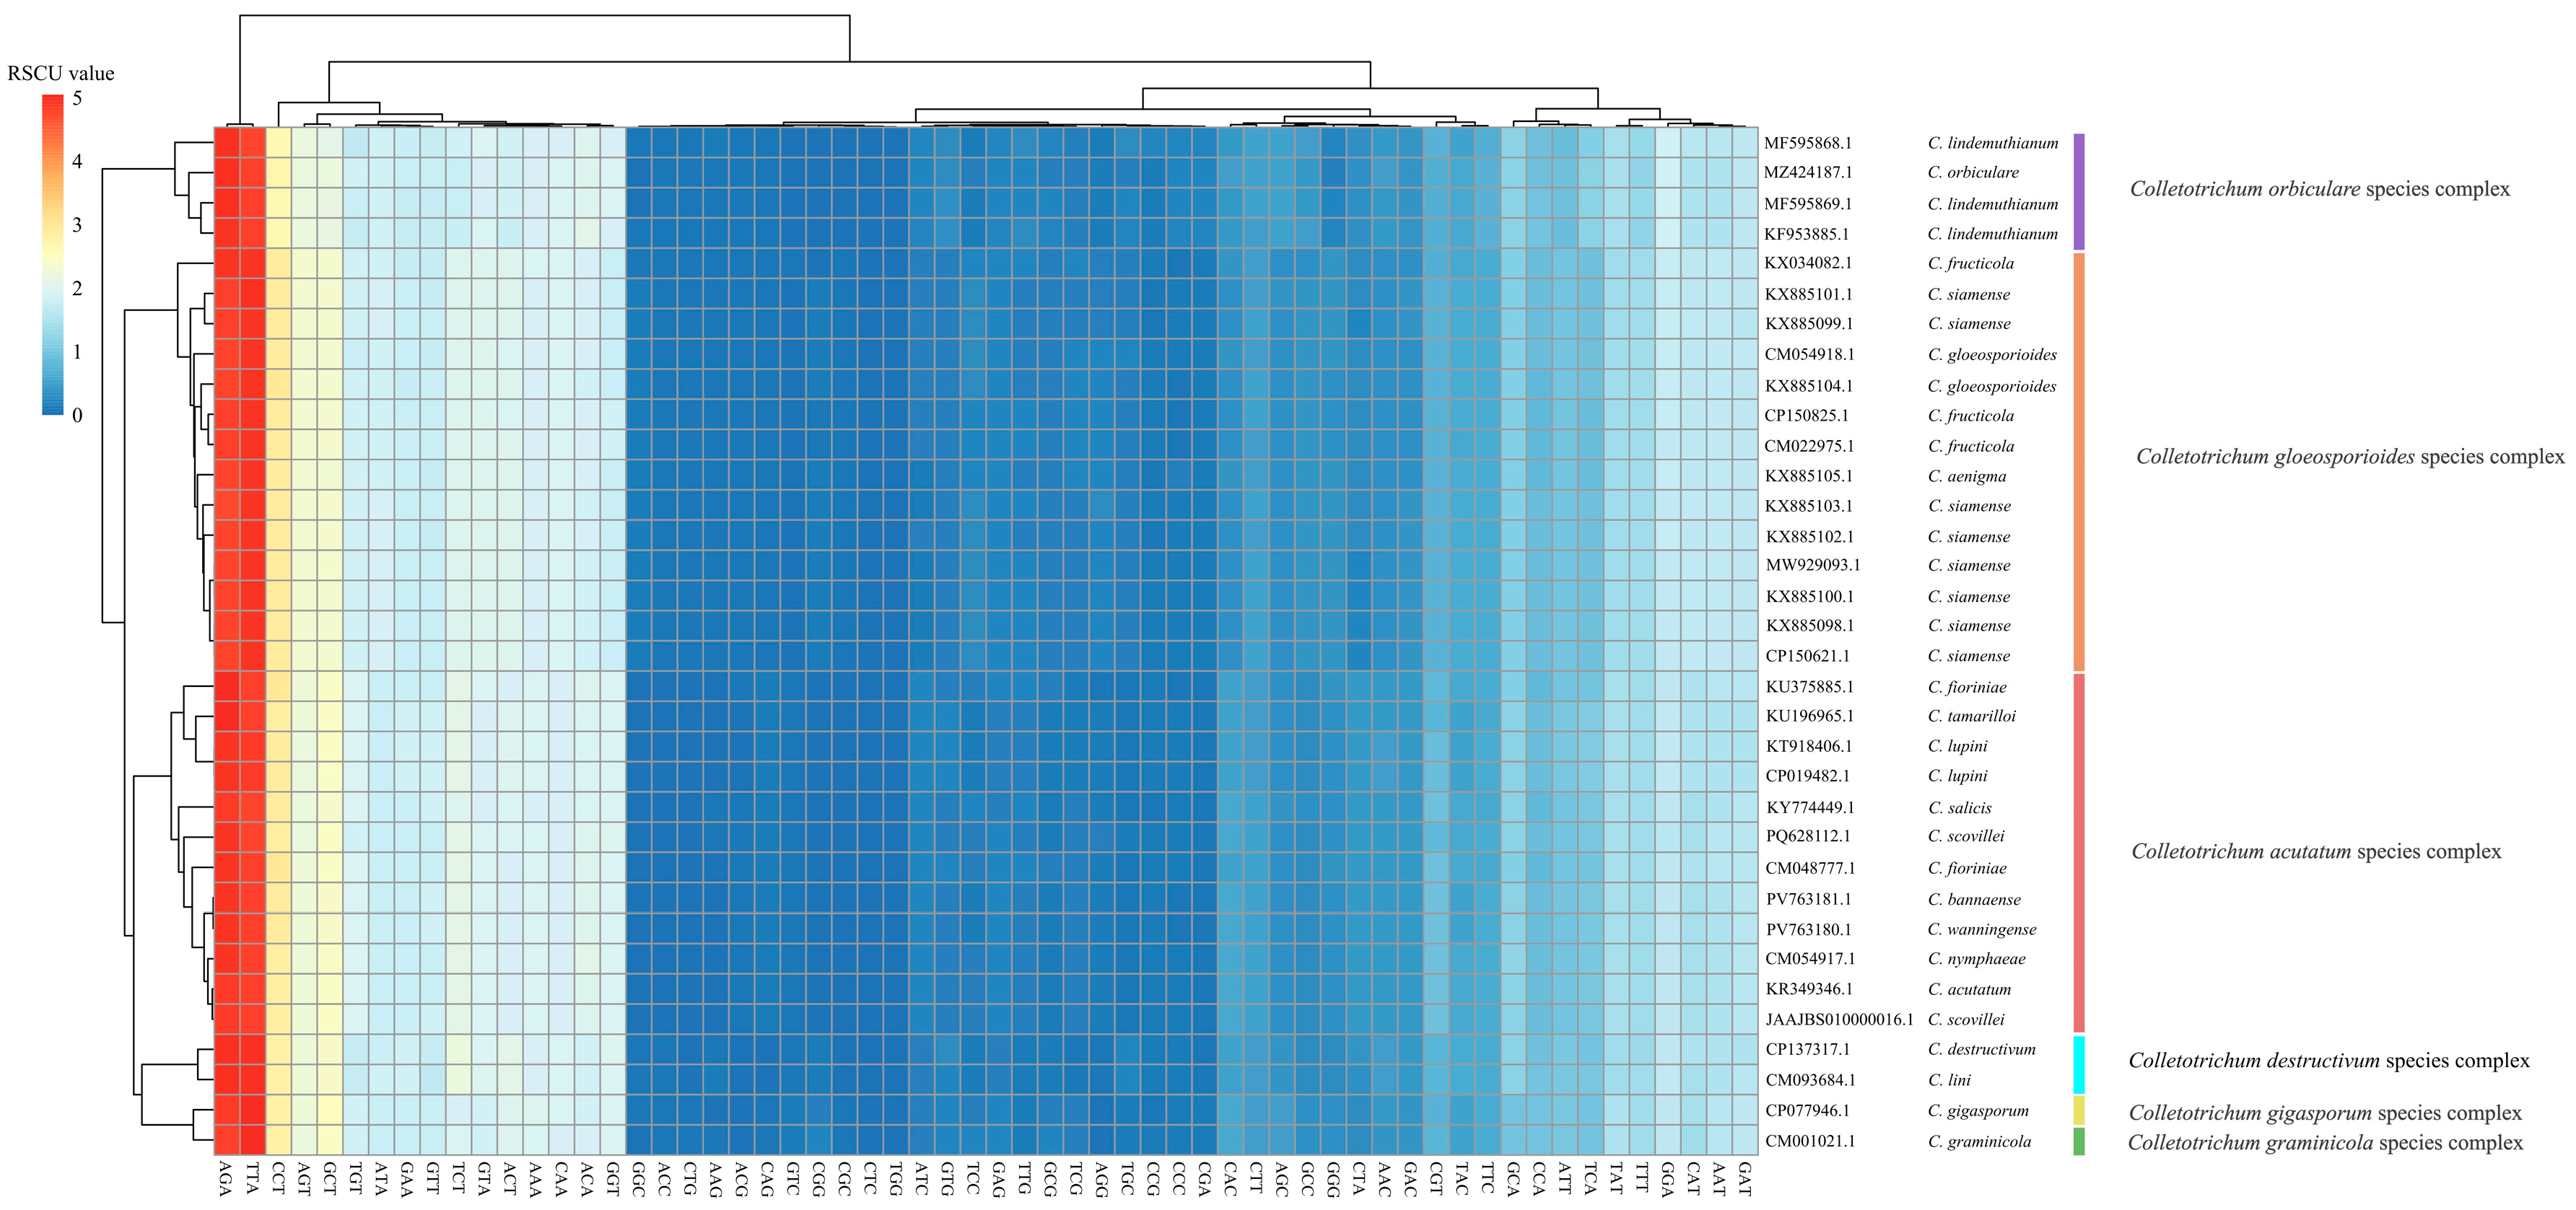
Overall, a strong bias toward A/T-ending codons was observed (Figure 6). For example, TTA (Leu) and AGA (Arg) exhibited the highest average RSCU values of 4.77 and 4.74, respectively, followed by CCT (Pro), GCT (Ala) and AGT (Ser). These codons showed the most pronounced usage preference in the Colletotrichum genus. In contrast, codons such as CGC (Arg), TGG (Trp) and CCG (Pro) had consistently low RSCU values, some of which were close to zero. These codons were rarely used or nearly completely avoided in Colletotrichum mitogenomes.
Hierarchical clustering based on the RSCU values revealed clear cluster patterns that corresponded closely with species complex boundaries (Figure 6). For instance, the C. gloeosporioides species complex, C. acutatum species complex and C. destructivum species complex formed distinct clusters, indicating that the codon usage patterns are highly similar within species complexes. Additionally, the C. gloeosporioides species complex, C. truncatum species complex and C. gigasporum species complex formed well-separated branches, further supporting intra-group codon usage coherence.

4. Discussion

This study de novo assembled the mitogenomes of four major Colletotrichum species that cause anthracnose of rubber trees in China, i.e., C. siamense, C. fructicola, C. wanningense and C. bannaense. The mitogenome sizes of C. siamense and C. fructicola (C. gloeosporioides species complex) were ~52–56 kb, significantly larger than the ~30 kb of C. wanningense and C. bannaense (C. acutatum species complex). Intron expansion was found to be the primary driver of genome size variation. Species in the C. gloeosporioides species complex, for example, contained ten introns, whereas members of the C. acutatum species complex carried only one intron. These intronic regions in genes such as cox1, cob and nad play a central role in shaping mitogenome sizes. A systematic analysis of the four mitogenomes revealed highly conserved features within species complexes, particularly in the structure and arrangement of core PCGs, whereas substantial structural differences were observed between species complexes. Our analysis revealed clear interspecific differences in relative mtDNA copy number among Colletotrichum. Species of the C. acutatum complex exhibited higher copy numbers than those of the C. gloeosporioides complex. This study provides the first evidence of mtDNA copy number variation between Colletotrichum species complexes, suggesting that such variation may contribute to phenotypic divergence. Further studies with broader sampling are needed to confirm these observations.
To establish corroboration for our hypothesis of distinct species-complex specific evolution trajectories within Colletotrichum, this study subsequently provided a more comprehensive analysis of mitochondrial diversity by including a broader range of taxonomic species across multiple Colletotrichum species complexes. A total of 34 complete mitogenomes of Colletotrichum species, with genome sizes ranging from ~29 kb (C. scovillei) to ~60 kb (C. gloeosporioides) and GC contents between 29.6% and 34.6%, were systematically analyzed.
Intron invasion was confirmed as being a major contributor to mitogenome expansion in Colletotrichum species, consistent with previous reports in some filamentous fungi [46]. Earlier studies have suggested that self-splicing introns, particularly types I and II, often spread through homing endonuclease genes (HEGs) [14]. Our genome-wide detection of LAGLIDADG and GIY-YIG ORFs in Colletotrichum species (e.g., our newly assembled C. siamense and C. fructicola mitogenomes) supports this mechanism. The species-complex specific intron patterns imply that HEG mobility may be influenced by the species ecology, host range and life cycle [47].
Notably, our study first uncovered that the mitochondrial gene order is conserved within Colletotrichum species complexes, but structurally rearranged between different complexes. The concept of a species complex was initially introduced to address cryptic species that are morphologically indistinguishable, but genetically divergent at the molecular level [48,49]. Interestingly, our results show that the mitochondrial gene order remains completely conserved among such species within the same complex. Conversely, species in different species complexes (e.g., C. gigasporum and C. orbiculare) exhibited distinct mitochondrial gene arrangements. In fungi, such structural rearrangements are associated with altered gene regulation, reduced mitochondrial compatibility and even reproductive barriers [50]. Structural stability within species complexes may thus reflect the conservation of bioenergetic functions, particularly among taxa that share similar ecological niches.
Given the essential role of mitochondria in cellular respiration, the integrity of the mitogenome architecture was likely under intense selective pressure [51]. A selection pressure analysis of Colletotrichum species complexes revealed that most genes were under strong purifying selection, indicating strict functional constraints. The C. gloeosporioides species complex is known for its wide host range and ecological plasticity [52]. Although most PCGs in the C. gloeosporioides species complex were also under strong purifying selection, the dN/dS ratios of several genes (e.g., rps3, cox3 and nad4) showed elevated dN/dS ratios, with rps3 reaching the highest value of 0.373, suggesting potential adaptive divergence. Rps3 had the highest dN/dS value in all species complexes for its location within the rnl intron and its evolution may have been influenced by non-adaptive forces such as intron mobility and splicing regulation [53,54]. Rps3 could emerge as a promising molecular marker due to its high sequence variability, although further validation is needed to confirm its robustness across taxa. While intron mobility could be an important contributor to the elevated dN/dS values in rps3 and other genes, alternative explanations should also be considered. For example, adaptive modifications in mitochondrial proteins may alter energy metabolism and facilitate infection across different hosts. Moreover, the relatively high dN/dS values detected might be partly attributable to the small sample sizes. These possibilities warrant further investigation with expanded datasets in future studies.
The codon usage patterns were highly consistent across Colletotrichum species. A clear codon preference was observed for A/T-ending codons, such as TTA (Leu) and AGA (Arg). The observed codon bias toward A/T-ending codons was putatively due to two major forces: the high A/T content in the mitogenome and a minimized tRNA repertoire favoring those codons [55]. These conserved codon usage patterns clustered strongly within species complexes, indicating that translational evolution may offer an auxiliary classification signal.
Our study revealed that a high level of conservation within Colletotrichum complexes, e.g., gene structure, gene arrangement, selection pressure and codon usage, indicates evolutionary stability. For instance, in the C. acutatum species complex, C. bannaense and C. wanningense had near-identical sequences and C. acutatum, C. fioriniae and C. tamarilloi exhibited minimal mitochondrial variation. This observation also suggests that Colletotrichum mitogenomes may offer a limited resolution for species delimitation in species complexes that rely on only a single or a few loci, e.g., rps3 [13].
In summary, we newly assembled the mitogenomes of four major Colletotrichum species that cause rubber tree anthracnose. Our comprehensive mitogenomic analysis revealed the remarkable conservation of the mitochondrial PCG arrangement within Colletotrichum species complexes, but these arrangements differed between distinct species complexes. Concurrently, substantial structural divergences were observed, driven primarily by intronic expansion/contraction and mobile genetic elements. Furthermore, selective pressures and codon usage patterns exhibit distinct evolutionary dynamics at the species complex level. Therefore, the findings of this study systematically present the characteristics of the four major Colletotrichum species responsible for anthracnose of rubber trees and offer novel insights into the broad evolutionary mechanisms underlying Colletotrichum species complexes.

Author Contributions

Z.L. planned and designed the research. Y.W., F.Z., Q.C., L.H., Y.Z. and Z.W. performed experiments and analyzed data. C.L. provided study materials. W.M. provided critical infrastructure or technical support. Y.W. and Z.L. wrote the manuscript. All authors have read and agreed to the published version of the manuscript.

Funding

This work was supported by the Hainan Provincial Natural Science Foundation of China (Grant No. 323RC420), National Natural Science Foundation of China (Grant No. 32460651), Hainan ProvinceScience and Technology SpecialFund (Grant No. ZDYF2025XDNY094), Hainan Province Science and Technology Talent Innovation Project (KRJC2023B14), Collaborative Innovation Cen-ter of Nanfan and High Efficiency Tropical Agriculture of Hainan University (XTCX2022NYA01).

Institutional Review Board Statement

Not applicable.

Informed Consent Statement

Not applicable.

Data Availability Statement

The de novo assembled mitogenomes in this study were available in the GenBank database, i.e., C. siamense (CP150621.1), C. fructicola (CP150825.1), C. wanningense (PV763180.1), and C. bannaense (PV763181.1).

Conflicts of Interest

The authors declare no conflicts of interest.

References

  1. Yin, H.; Zhang, X.; Zhang, B.; Luo, H.; He, C. Revealing the Dominant Long Noncoding RNAs Responding to the Infection with Colletotrichum Gloeosporioides in Hevea Brasiliensis. Biol. Direct 2019, 14, 7. [Google Scholar] [CrossRef] [PubMed]
  2. Liu, Y.; Shi, Y.; Zhuo, D.; Yang, T.; Dai, L.; Li, L.; Zhao, H.; Liu, X.; Cai, Z. Charactserization of Colletotrichum Causing Anthracnose on Rubber Trees in Yunnan: Two New Records and Two New Species from China. Plant Dis. 2023, 107, 3037–3050. [Google Scholar] [CrossRef]
  3. Liu, X.; Li, B.; Cai, J.; Zheng, X.; Feng, Y.; Huang, G. Colletotrichum Species Causing Anthracnose of Rubber Trees in China. Sci. Rep. 2018, 8, 10435. [Google Scholar] [CrossRef] [PubMed]
  4. Liu, X.; Li, B.; Cai, J.; Shi, T.; Yang, Y.; Feng, Y.; Huang, G. Whole Genome Resequencing Reveal Patterns of Genetic Variation within Colletotrichum acutatum Species Complex from Rubber Trees in China. Fungal Genet. Biol. 2023, 167, 103801. [Google Scholar] [CrossRef]
  5. Cao, X.; Xu, X.; Che, H.; West, J.S.; Luo, D. Three Colletotrichum Species, Including a New Species, Are Associated to Leaf Anthracnose of Rubber Tree in Hainan, China. Plant Dis. 2019, 103, 117–124. [Google Scholar] [CrossRef]
  6. Liu, X.; Li, B.; Yang, Y.; Cai, J.; Shi, T.; Zheng, X.; Huang, G. Pathogenic Adaptations Revealed by Comparative Genome Analyses of Two Colletotrichum Spp., the Causal Agent of Anthracnose in Rubber Tree. Front. Microbiol. 2020, 11, 1484. [Google Scholar] [CrossRef]
  7. da Silva, L.L.; Moreno, H.L.A.; Correia, H.L.N.; Santana, M.F.; de Queiroz, M.V. Colletotrichum: Species Complexes, Lifestyle, and Peculiarities of Some Sources of Genetic Variability. Appl. Microbiol. Biotechnol. 2020, 104, 1891–1904. [Google Scholar] [CrossRef] [PubMed]
  8. Patkar, R.N.; Ramos-Pamplona, M.; Gupta, A.P.; Fan, Y.; Naqvi, N.I. Mitochondrial Β-Oxidation Regulates Organellar Integrity and Is Necessary for Conidial Germination and Invasive Growth in Magnaporthe Oryzae. Mol. Microbiol. 2012, 86, 1345–1363. [Google Scholar] [CrossRef]
  9. Inoue, I.; Namiki, F.; Tsuge, T. Plant colonization by the vascular wilt fungus Fusarium oxysporum requires FOW1, a gene encoding a mitochondrial protein. Plant Cell 2002, 14, 1869–1883. [Google Scholar] [CrossRef]
  10. Kouvelis, V.N.; Hausner, G. Editorial: Mitochondrial Genomes and Mitochondrion Related Gene Insights to Fungal Evolution. Front. Microbiol. 2022, 13, 897981. [Google Scholar] [CrossRef]
  11. Medina, R.; Franco, M.E.E.; Bartel, L.C.; Martinez Alcántara, V.; Saparrat, M.C.N.; Balatti, P.A. Fungal Mitogenomes: Relevant Features to Planning Plant Disease Management. Front. Microbiol. 2020, 11, 978. [Google Scholar] [CrossRef] [PubMed]
  12. Zardoya, R. Recent Advances in Understanding Mitochondrial Genome Diversity. F1000Research 2020, 9, 270. [Google Scholar] [CrossRef] [PubMed]
  13. Pszczółkowska, A.; Androsiuk, P.; Jastrzębski, J.P.; Paukszto, Ł.; Okorski, A. Rps3 as a Candidate Mitochondrial Gene for the Molecular Identification of Species from the Colletotrichum acutatum Species Complex. Genes 2020, 11, 552. [Google Scholar] [CrossRef]
  14. Cinget, B.; Bélanger, R.R. Discovery of new group I-D introns leads to creation of subtypes and link to an adaptive response of the mitochondrial genome in fungi. RNA Biol. 2020, 17, 1252–1260. [Google Scholar] [CrossRef] [PubMed]
  15. Wai, A.; Hausner, G. The Mitochondrial Genome of Ophiostoma Himal-Ulmi and Comparison with Other Fungi Causing Dutch Elm Disease. Can. J. Microbiol. 2021, 67, 584–598. [Google Scholar] [CrossRef]
  16. Lin, R.; Xia, Y.; Liu, Y.; Zhang, D.; Xiang, X.; Niu, X.; Jiang, L.; Wang, X.; Zheng, A. Comparative Mitogenomic Analysis and the Evolution of Rhizoctonia solani Anastomosis Groups. Front. Microbiol. 2021, 12, 707281. [Google Scholar] [CrossRef]
  17. Wenger, A.M.; Peluso, P.; Rowell, W.J.; Chang, P.-C.; Hall, R.J.; Concepcion, G.T.; Ebler, J.; Fungtammasan, A.; Kolesnikov, A.; Olson, N.D.; et al. Accurate Circular Consensus Long-Read Sequencing Improves Variant Detection and Assembly of a Human Genome. Nat. Biotechnol. 2019, 37, 1155–1162. [Google Scholar] [CrossRef]
  18. Ji, X.; Tian, Y.; Liu, W.; Lin, C.; He, F.; Yang, J.; Miao, W.; Li, Z. Mitochondrial Characteristics of the Powdery Mildew Genus Erysiphe Revealed an Extraordinary Evolution in Protein-Coding Genes. Int. J. Biol. Macromol. 2023, 230, 123153. [Google Scholar] [CrossRef]
  19. Li, H. Minimap2: Pairwise alignment for nucleotide sequences. Bioinformatics 2018, 34, 3094–3100. [Google Scholar] [CrossRef]
  20. Li, H. New strategies to improve minimap2 alignment accuracy. Bioinformatics 2021, 37, 4572–4574. [Google Scholar] [CrossRef]
  21. Nurk, S.; Walenz, B.P.; Rhie, A.; Vollger, M.R.; Logsdon, G.A.; Grothe, R.; Miga, K.H.; Eichler, E.E.; Phillippy, A.M.; Koren, S. HiCanu: Accurate assembly of segmental duplications, satellites, and allelic variants from high-fidelity long reads. Genome Res. 2020, 30, 1291–1305. [Google Scholar] [CrossRef]
  22. Koren, S.; Walenz, B.P.; Berlin, K.; Miller, J.R.; Bergman, N.H.; Phillippy, A.M. Canu: Scalable and Accurate Long-Read Assembly via Adaptive k-Mer Weighting and Repeat Separation. Genome Res. 2017, 27, 722–736. [Google Scholar] [CrossRef]
  23. Leuthner, T.C.; Hartman, J.H.; Ryde, I.T.; Meyer, J.N. PCR-Based Determination of Mitochondrial DNA Copy Number in Multiple Species. Methods Mol. Biol. 2021, 2310, 91–111. [Google Scholar]
  24. Stockinger, H.; Peyret-Guzzon, M.; Koegel, S.; Bouffaud, M.L.; Redecker, D. The largest subunit of RNA polymerase II as a new marker gene to study assemblages of arbuscular mycorrhizal fungi in the field. PLoS ONE 2014, 9, e107783. [Google Scholar] [CrossRef] [PubMed]
  25. Valach, M.; Burger, G.; Gray, M.W.; Lang, B.F. Widespread occurrence of organelle genome-encoded 5S rRNAs including permuted molecules. Nucleic Acids Res. 2014, 42, 13764–13777. [Google Scholar] [CrossRef] [PubMed]
  26. Donath, A.; Jühling, F.; Al-Arab, M.; Bernhart, S.H.; Reinhardt, F.; Stadler, P.F.; Middendorf, M.; Bernt, M. Improved annotation of protein-coding genes boundaries in metazoan mitochondrial genomes. Nucleic Acids Res. 2019, 47, 10543–10552. [Google Scholar] [CrossRef] [PubMed]
  27. Burger, G.; Yan, Y.; Javadi, P.; Lang, B.F. Group I-Intron Trans-Splicing and mRNA Editing in the Mitochondria of Placozoan Animals. Trends Genet. 2009, 25, 381–386. [Google Scholar] [CrossRef]
  28. Lang, B.F.; Laforest, M.-J.; Burger, G. Mitochondrial Introns: A Critical View. Trends Genet. 2007, 23, 119–125. [Google Scholar] [CrossRef]
  29. Sayers, E.W.; Bolton, E.E.; Brister, J.R.; Canese, K.; Chan, J.; Comeau, D.C.; Connor, R.; Funk, K.; Kelly, C.; Kim, S.; et al. Database Resources of the National Center for Biotechnology Information. Nucleic Acids Res. 2022, 50, D20–D26. [Google Scholar] [CrossRef]
  30. Rice, P.; Longden, I.; Bleasby, A. EMBOSS: The European Molecular Biology Open Software Suite. Trends Genet. 2000, 16, 276–277. [Google Scholar] [CrossRef]
  31. Lu, S.; Wang, J.; Chitsaz, F.; Derbyshire, M.K.; Geer, R.C.; Gonzales, N.R.; Gwadz, M.; Hurwitz, D.I.; Marchler, G.H.; Song, J.S.; et al. CDD/SPARCLE: The Conserved Domain Database in 2020. Nucleic Acids Res. 2020, 48, D265–D268. [Google Scholar] [CrossRef]
  32. Kurtz, S.; Schleiermacher, C. REPuter: Fast Computation of Maximal Repeats in Complete Genomes. Bioinformatics 1999, 15, 426–427. [Google Scholar] [CrossRef]
  33. Benson, G. Tandem Repeats Finder: A Program to Analyze DNA Sequences. Nucleic Acids Res. 1999, 27, 573–580. [Google Scholar] [CrossRef] [PubMed]
  34. Krzywinski, M.; Schein, J.; Birol, I.; Connors, J.; Gascoyne, R.; Horsman, D.; Jones, S.J.; Marra, M.A. Circos: An Information Aesthetic for Comparative Genomics. Genome Res. 2009, 19, 1639–1645. [Google Scholar] [CrossRef]
  35. Altschul, S.F.; Gish, W.; Miller, W.; Myers, E.W.; Lipman, D.J. Basic Local Alignment Search Tool. J. Mol. Biol. 1990, 215, 403–410. [Google Scholar] [CrossRef]
  36. Edgar, R.C.; Taylor, J..; Lin, V.; Altman, T.; Barbera, P.; Meleshko, D.; Lohr, D.; Novakovsky, G.; Buchfink, B.; Al-Shayeb, B.; et al. Petabase-Scale Sequence Alignment Catalyses Viral Discovery. Nature 2022, 602, 142–147. [Google Scholar] [CrossRef]
  37. Minh, B.Q.; Schmidt, H.A.; Chernomor, O.; Schrempf, D.; Woodhams, M.D.; von Haeseler, A.; Lanfear, R. IQ-TREE 2: New Models and Efficient Methods for Phylogenetic Inference in the Genomic Era. Mol. Biol. Evol. 2020, 37, 1530–1534. [Google Scholar] [CrossRef] [PubMed]
  38. Letunic, I.; Bork, P. Interactive Tree of Life (iTOL) v5: An Online Tool for Phylogenetic Tree Display and Annotation. Nucleic Acids Res. 2021, 49, W293–W296. [Google Scholar] [CrossRef] [PubMed]
  39. Shen, W.; Le, S.; Li, Y.; Hu, F. SeqKit: A Cross-Platform and Ultrafast Toolkit for FASTA/Q File Manipulation. PLoS ONE 2016, 11, e0163962. [Google Scholar] [CrossRef]
  40. Anwar, A.M. BCAWT: Automated Tool for Codon Usage Bias Analysis for Molecular Evolution. J. Open Source Softw. 2019, 4, 1500. [Google Scholar] [CrossRef]
  41. Eisen, M.B.; Spellman, P.T.; Brown, P.O.; Botstein, D. Cluster Analysis and Display of Genome-Wide Expression Patterns. Proc. Natl. Acad. Sci. USA 1998, 95, 14863–14868. [Google Scholar] [CrossRef] [PubMed]
  42. Yang, Z. PAML 4: Phylogenetic Analysis by Maximum Likelihood. Mol. Biol. Evol. 2007, 24, 1586–1591. [Google Scholar] [CrossRef]
  43. Lyu, Z.; Li, Z.-G.; He, F.; Zhang, Z. An Important Role for Purifying Selection in Archaeal Genome Evolution. mSystems 2017, 2, e00112-17. [Google Scholar] [CrossRef] [PubMed]
  44. Yang, Z.; Nielsen, R. Estimating synonymous and nonsynonymous substitution rates under realistic evolutionary models. Mol. Biol. Evol. 2000, 17, 32–43. [Google Scholar] [CrossRef] [PubMed]
  45. Katoh, K.; Misawa, K.; Kuma, K.; Miyata, T. MAFFT: A Novel Method for Rapid Multiple Sequence Alignment Based on Fast Fourier Transform. Nucleic Acids Res. 2002, 30, 3059–3066. [Google Scholar] [CrossRef]
  46. Baker, E.P.; Peris, D.; Moriarty, R.V.; Li, X.C.; Fay, J.C.; Hittinger, C.T. Mitochondrial DNAand Temperature Tolerance in Lager Yeasts. Sci. Adv. 2019, 5, eaav1869. [Google Scholar] [CrossRef]
  47. Liang, X.; Tian, X.; Liu, W.; Wei, T.; Wang, W.; Dong, Q.; Wang, B.; Meng, Y.; Zhang, R.; Gleason, M.L.; et al. Comparative Analysis of the Mitochondrial Genomes of Colletotrichum Gloeosporioides Sensu Lato: Insights into the Evolution of a Fungal Species Complex Interacting with Diverse Plants. BMC Genom. 2017, 18, 171. [Google Scholar] [CrossRef] [PubMed]
  48. Cannon, P.F.; Damm, U.; Johnston, P.R.; Weir, B.S. Colletotrichum: Current Status and Future Directions. Stud. Mycol. 2012, 73, 181–213. [Google Scholar] [CrossRef]
  49. Ma, Z.; Liu, F.; Tsui, C.K.M.; Cai, L. Phylogenomics and Adaptive Evolution of the Colletotrichum gloeosporioides Species Complex. Commun. Biol. 2025, 8, 593. [Google Scholar] [CrossRef]
  50. Kulik, T.; Van Diepeningen, A.D.; Hausner, G. Editorial: The Significance of Mitogenomics in Mycology. Front. Microbiol. 2021, 11, 628579. [Google Scholar] [CrossRef]
  51. Malyarchuk, B.A.; Derenko, M.V. Evaluating the Role of Selection in the Evolution of Mitochondrial Genomes of Aboriginal Peoples of Siberia. Vavilovskii Zhurnal Genet. Sel. 2023, 27, 218–223. [Google Scholar] [CrossRef]
  52. Doyle, V.P.; Oudemans, P.V.; Rehner, S.A.; Litt, A. Habitat and Host Indicate Lineage Identity in Colletotrichum gloeosporioides s.l. from Wild and Agricultural Landscapes in North America. PLoS ONE 2013, 8, e62394. [Google Scholar] [CrossRef] [PubMed]
  53. Jelen, V.; De Jonge, R.; Van De Peer, Y.; Javornik, B.; Jakše, J. Complete Mitochondrial Genome of the Verticillium-Wilt Causing Plant Pathogen Verticillium nonalfalfae. PLoS ONE 2016, 11, e0148525. [Google Scholar] [CrossRef]
  54. Sethuraman, J.; Majer, A.; Iranpour, M.; Hausner, G. Molecular Evolution of the mtDNA Encoded Rps3 Gene Among Filamentous Ascomycetes Fungi with an Emphasis on the Ophiostomatoid Fungi. J. Mol. Evol. 2009, 69, 372–385. [Google Scholar] [CrossRef] [PubMed]
  55. Nieuwenhuis, M.; Groeneveld, J.; Aanen, D.K. Horizontal Transfer of tRNA Genes to Mitochondrial Plasmids Facilitates Gene Loss from Fungal Mitochondrial DNA. Curr. Genet. 2023, 69, 55–65. [Google Scholar] [CrossRef] [PubMed]
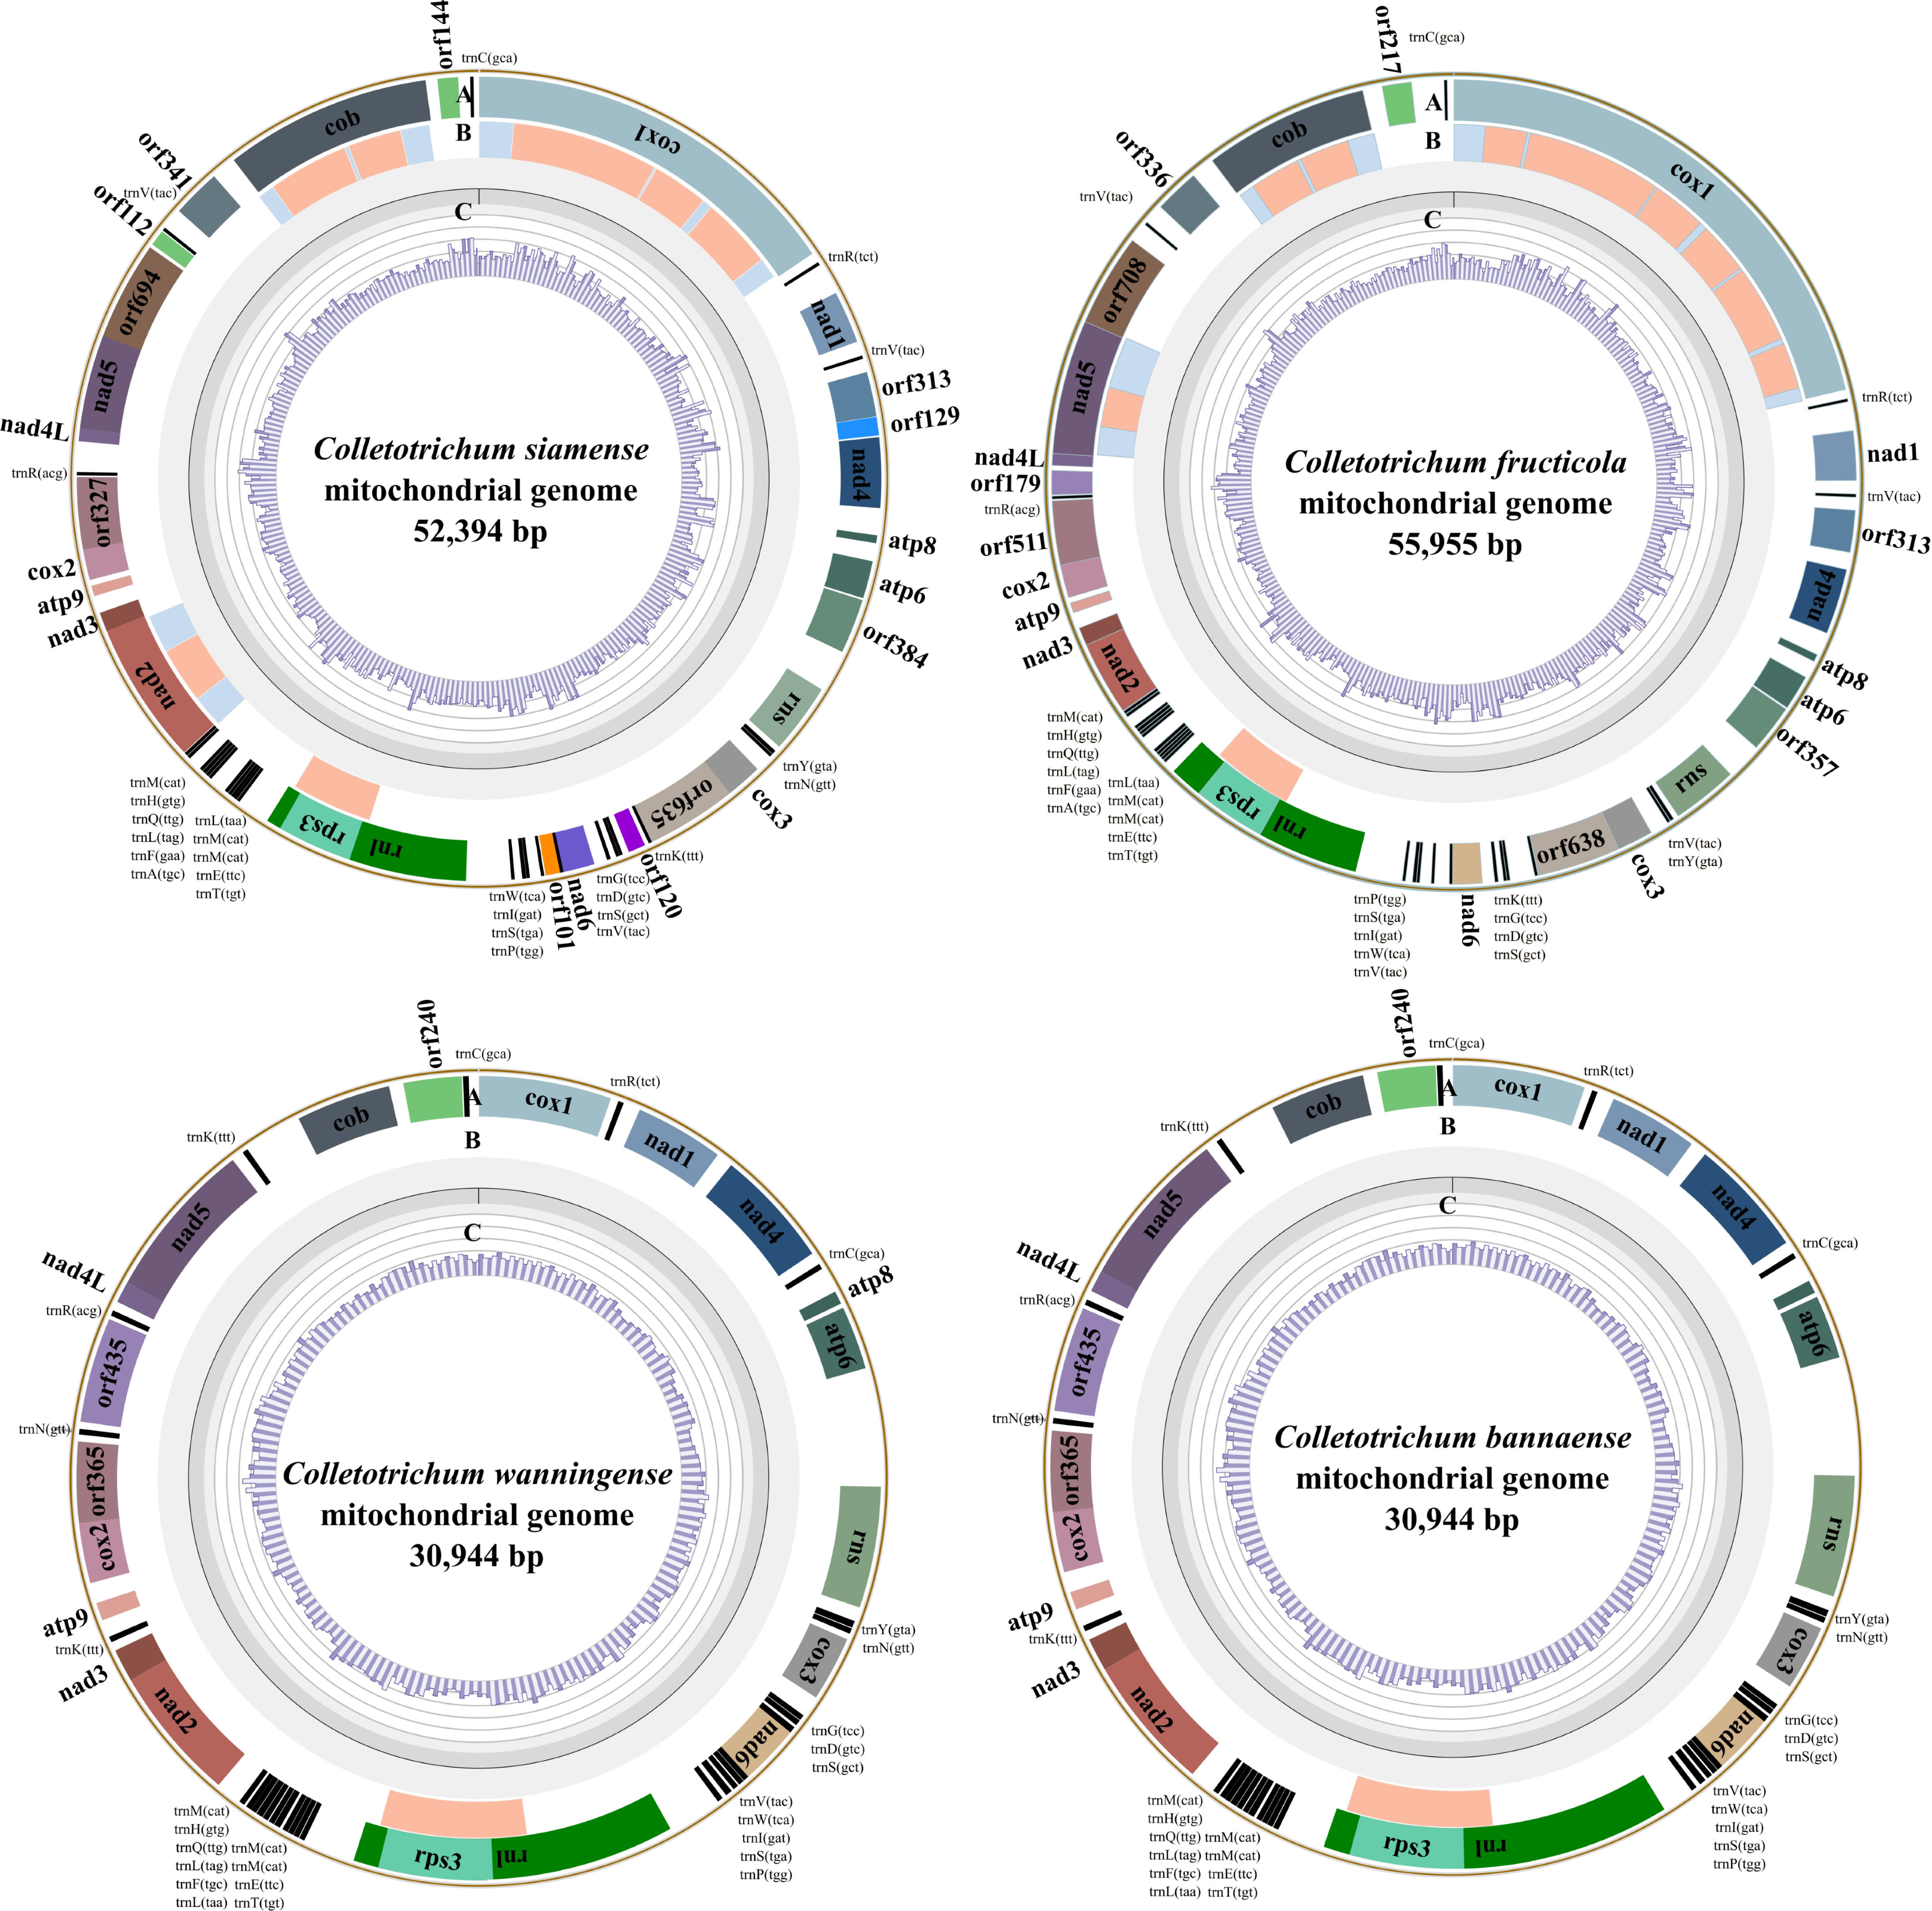
Figure 1. Genomic features of the four de novo assembled mitogenomes of Colletotrichum species. The circular maps represent the mitogenomics of C. siamense, C. fructicola, C. wanningense and C. bannaense. (A) Annotated genes such as protein-coding genes, rRNA genes and tRNA genes. (B) Labeled gene structures with introns. Blue and orange tracks represent the exon and intron regions, respectively. (C) GC content distribution along each mitogenome.
Jof 11 00679 g001
Figure 2. Estimated relative mtDNA copy numbers of the four Colletotrichum species. Relative mtDNA copy number of four Colletotrichum species estimated by qPCR, using nuclear single-copy gene RPB1 as the reference and mitochondrial gene NAD4 as the target.
Jof 11 00679 g002
Figure 3. Synteny comparison of mitogenomes among the four Colletotrichum species. Thick tracks denote protein-coding gene regions, with arrows indicating the transcriptional direction. The colors represent exon regions in different genes and the gray regions indicate intron regions. The ribbon connects homologous regions identified by BLASTN (E-value < 1 × 10⁻⁵), with the color intensity reflecting the sequence identity.
Jof 11 00679 g003
Figure 4. Maximum likelihood phylogeny based on 15 PCGs from 34 Colletotrichum species. The tree was constructed using 15 concatenated PCGs (i.e., cox1–3, cob, atp6, atp8, atp9, nad1–6, nad4L and rps3). Fusarium oxysporum (NC017930.1) was included as an outgroup. The bootstrap values are indicated by the branch color. The Colletotrichum mitogenomes that were newly assembled in this study are marked by red asterisks. Species from six Colletotrichum species complexes are colored and grouped by vertical bars.
Jof 11 00679 g004
Figure 5. Substitution rate analysis for 15 PCGs in Colletotrichum species complexes. Point diagram showing the dN, dS and dN/dS values of each gene in different Colletotrichum species complexes. The horizontal axis represents the dN, dS and dN/dS values.
Jof 11 00679 g005
Figure 6. Heatmap of RSCU across 34 Colletotrichum mitogenomes. RSCU values for 59 non-stop codons are shown, with colors ranging from blue (low usage) to red (high usage). Hierarchical clustering based on the Euclidean distance revealed the codon usage similarity within and across species complexes.
Jof 11 00679 g006
Table 1. Assembly statistics and genomic features of mitogenomes.
C. siamenseC. fructicolaC. wanningenseC. bannaense
GenBank Accession CP150621.1CP150825.1PV763180.1PV763181.1
Total size (bp)52,39455,95530,94930,944
Intergenic regions size (bp)12,55513,95296499644
Intronic regions size (bp)5609838317091709
Overall GC (%)34.5233.9830.5930.59
Core PCGs size (bp)27,26730,05016,23716,237
Intergenic regions
GC (%)
41.3541.9730.9530.59
GC-skew(G − C)/(G + C)0.070.070.110.11
AT-skew(A − T)/(A + T)−0.010−0.03−0.03
Repetitive DNA regions (bp)15791215208208
Repetitive DNA (%)3.012.170.670.67
tRNA27272828
Introns71011
Intronic ORFs1111
GIY-YIG ORFs1100
LAGLIDADG ORFs4500
Table 2. Mitogenomic characteristics of Colletotrichum species in the GenBank database.
GenBank AccessionSpeciesSpecies ComplexGenome Length (bp)GC Content (%)tRNA CountrRNA CountIntron Count
CM093684.1C. liniC. destructivum species complex39,08929.62 2823
CP137317.1C. destructivumC. destructivum species complex34,39129.72 2822
CM001021.1C. graminicolaC. graminicola species complex39,64929.89 2522
KY774449.1C. salicisC. acutatum species complex33,95030.44 2821
KU375885.1C. fioriniaeC. acutatum species complex30,02030.04 2821
CM048777.1C. fioriniaeC. acutatum species complex30,00930.10 2921
KU196965.1C. tamarilloiC. acutatum species complex30,82430.50 2821
KT918406.1C. lupiniC. acutatum species complex36,55429.91 2921
CP019482.1C. lupiniC. acutatum species complex36,55429.91 2921
PV763180 *C. wanningenseC. acutatum species complex30,94930.59 2821
PV763181 *C. bannaenseC. acutatum species complex30,94430.59 2821
CM054917.1C. nymphaeaeC. acutatum species complex30,92830.54 2821
KR349346.1C. acutatumC. acutatum species complex30,89230.51 2821
PQ628112.1C. scovilleiC. acutatum species complex29,51730.72 2121
JAAJBS010000016.1C. scovilleiC. acutatum species complex30,95230.51 2821
CP077946.1C. gigasporumC. gigasporum species complex58,87931.97 29211
MZ424187.1C. orbiculareC. orbiculare species complex36,31831.07 2823
MF595869.1C. lindemuthianumC. orbiculare species complex37,44630.86 2824
MF595868.1C. lindemuthianumC. orbiculare species complex37,44030.85 2824
KF953885.1C. lindemuthianumC. orbiculare species complex36,95730.88 2824
KX885098.1C. siamenseC. gloeosporioides species complex54,67934.25 2729
KX885099.1C. siamenseC. gloeosporioides species complex54,65834.10 2729
KX885102.1C. siamenseC. gloeosporioides species complex54,64534.29 2728
KX885103.1C. siamenseC. gloeosporioides species complex53,31734.39 2727
MW929093.1C. siamenseC. gloeosporioides species complex52,71034.45 2727
KX885100.1C. siamenseC. gloeosporioides species complex52,67134.40 2727
CP150621.1 *C. siamenseC. gloeosporioides species complex52,39434.52 2727
KX885101.1C. siamenseC. gloeosporioides species complex58,66633.84 27211
CM054918.1C. gloeosporioidesC. gloeosporioides species complex59,69534.13 27211
KX885105.1C. aenigmaC. gloeosporioides species complex57,25234.28 27210
KX034082.1C. fructicolaC. gloeosporioides species complex56,05134.04 27210
CP150825.1 *C. fructicolaC. gloeosporioides species complex55,95533.98 27210
CM022975.1C. fructicolaC. gloeosporioides species complex55,17734.00 27210
KX885104.1C. gloeosporioidesC. gloeosporioides species complex55,16934.55 2729
The mitogenomes that were newly assembled in this study are marked by *.
Disclaimer/Publisher’s Note: The statements, opinions and data contained in all publications are solely those of the individual author(s) and contributor(s) and not of MDPI and/or the editor(s). MDPI and/or the editor(s) disclaim responsibility for any injury to people or property resulting from any ideas, methods, instructions or products referred to in the content.