Article

Carbon and Nitrogen Sources Influence Parasitic Responsiveness in Trichoderma atroviride NI-1

by
Víctor Javier García-Sánchez
1,
Karina Lizbeth Sánchez-López
1,
Juana Jazmín Esquivel Méndez
1,
Daniel Sánchez-Hernández
1,
José Antonio Cervantes-Chávez
1,
Fidel Landeros-Jaime
1,
Artemio Mendoza-Mendoza
2,
Julio Cesar Vega-Arreguín
3 and
Edgardo Ulises Esquivel-Naranjo
1,2,*
1
Unit for Basic and Applied Microbiology, Faculty of Natural Sciences, Autonomous University of Queretaro, Queretaro 76140, Mexico
2
Faculty of Agriculture and Life Sciences, Lincoln University, Lincoln 7647, New Zealand
3
Laboratory of AgroGenomic Sciences, National School of Higher Studies, National Autonomous University of Mexico, Guanajuato 37684, Mexico
*
Author to whom correspondence should be addressed.
J. Fungi 2024, 10(10), 671; https://doi.org/10.3390/jof10100671
Submission received: 29 August 2024 / Revised: 21 September 2024 / Accepted: 24 September 2024 / Published: 26 September 2024
(This article belongs to the Special Issue Trichoderma in Action)

Abstract

:
Parasitic species of Trichoderma use hydrolytic enzymes to destroy the host cell wall. Preferent carbon and nitrogen sources suppress the expression of genes related to parasitism. Here, different nutrients were evaluated in the parasitic isolated NI-1, which was identified as Trichoderma atroviride. The genes cbh1 and chb2 (cellobiohydrolases), bgl3.1 (endoglucanase), and pra1 and prb1 (proteinases) were poorly expressed during the interaction between NI-1 and Phytophthora capsici on PDA. However, gene expression improved on minimal medium with preferent and alternative carbon sources. Dextrin and glucose stimulated higher transcript levels than cellulose, sucrose, and glycerol. Also, ammonium stimulated a stronger parasitic responsiveness than the alternative nitrogen sources. During interaction against different phytopathogens, NI-1 detects their host differentially from a distance due to the cbh1 and cbh2 genes being only induced by P. capsici. The pra1 and ech42 genes were induced before contact with Botrytis cinerea and Rhizoctonia solani, while when confronted with P. capsici they were stimulated until contact and overgrowth. The prb1 and bgl3.1 genes were induced before contact against the three-host assayed. Overall, T. atroviride prefers to parasitize and has the capacity to distinguish between an oomycete and a fungus, but nutrient quality regulates its parasitic responsiveness.

1. Introduction

Mycoparasitism is a process in which a fungus alters its hyphal growth and begins the biogenesis of specialized structures to attack, penetrate, and consume its fungal host [1]. Mycoparasitism of many species of the genus Trichoderma has been known for over 80 years [2,3], and is a trait exploited to protect and improve crops. However, it has largely remained unknown how Trichoderma recognizes its host and which players are key in regulating the genes that encode enzymes involved in destroying and consuming the host cell wall or are involved in the biogenesis of specialized structures [1].
Trichoderma species have been widely recognized as a successful biocontrol agent to antagonize many agriculturally important oomycetes and fungal plant pathogens by different mechanisms such as direct parasitism, antibiosis, and competition. Furthermore, they promote plant growth and induce plant-resistance [1,4]. During parasitism, Trichoderma produces hydrolytic enzymes that destroy the main structural components of the host cell wall such as proteases (pra1 and prb1 genes), chitinases (ech42 and chit genes), and glucanases (bgl3.1), with the main aim of obtaining nutrients from the host. However, competition for nutrients and space could be another reason. The parasitism process begins with chemotropic growth towards the host mycelia; once in-touch recognition proceeds, coiling around the host hypha and formation of hooks like appressorium to penetrate the hyphae and reach the cytoplasm, then the parasite breaks down host cellular components, lysing the host cell and causing subsequent death of the phytopathogen [5]. It has been proposed that Trichoderma cells constitutively secrete a low concentration of cell wall degrading enzymes, which are involved in delivering diffusible molecules from the host cell wall, and act as signals to detect the host and induce genes related to mycoparasitism (GRMs) [5,6,7], but the inducers have not yet been identified [1]. Furthermore, parasitic activity varies among Trichoderma species or different isolates and the potential host [3], suggesting that different strategies are used to parasitize a host. T. harzianum ThHP-3 triggers a host-specific response, regulating the differential expression of genes encoding hydrolytic enzymes and the production of secondary metabolites and transporters during interaction with Fusarium or Colletotrichum as hosts [8]. Also, the expression levels of some GRMs were different between T. virens and T. atroviride when confronted against Rhizoctonia solani AG5 and AG2, suggesting a different molecular mechanism among parasites to detect and respond to a host [9]. Furthermore, the lam1.3 gene encoding a β-1,3-glucanase was upregulated when T. harzianum confronted Sclerotinia sclerotium, but not in T. hamatum [10], suggesting some genetic variation to recognize or attack a host, although these differences could also be associated with different approaches or quantity/quality of nutrients.
Some genes’ GRMs encode hydrolytic enzymes that Trichoderma utilizes to consume alternative carbon or nitrogen sources. In vitro, these genes are derepressed by nutrient starvation, induced by the specific substrate and/or fungal cell wall, and repressed by preferent carbon and nitrogen sources [11,12,13,14,15,16,17], indicating that their expression is under carbon and nitrogen catabolic repression (CCR/NCR) [10]. These molecular mechanisms involve processes focused on economizing energy in fungi, prioritizing the assimilation of preferential carbon or nitrogen sources, and, consequently, repressing genes encoding proteins involved in the degradation and utilization of alternative sources [11,12]. In Trichoderma, the presence of glucose activates CCR via the AMPc pathway, which activates protein CRE1 [11] by dephosphorylation, being able to reach the nucleus and represses the expression of genes involved in metabolizing alternative carbon sources such as alcohols, organic acids, and polysaccharides [13]. Regarding nitrogen metabolism, ammonium and glutamine activate NCR to repress genes encoding enzymes that metabolize alternative nitrogen sources, but during starvation, the transcriptional factor AreA is activated to promote the metabolism of alternative nitrogen sources [14,15]. In this regard, prb1, ech42, bgl3.1, and pra1 are derepressed by starvation and induced with fungal cell walls [16,17,18]. Notably, these genes are not detected when preferent carbon and/or nitrogen sources are added in the presence of the host cell wall as inducers [17]. Furthermore, the genes encoding hydrolytic enzymes related to parasitism are triggered by diffusible factors before colonization of a fungal host [16,17,18], but the molecule acting as an inducer has not yet been identified.
Most information is focused on understanding how Trichoderma antagonizes the plant pathogens ascomycetes and basidiomycetes [5] using very limiting nutritional conditions. The aim of this work was to determine the effect of different nutrient sources to understand the molecular responsiveness during the parasitic interaction of a native Trichoderma strain NI-1 against P. capsici, R. solani, and B. cinerea. Our results highlight a predominant parasitic behavior under conditions where metabolic repression could work and a complex network of molecular mechanisms for sensing what kind of prey is available to parasitize, activating specific combat strategies.

2. Materials and Methods

2.1. Strains and Culture Conditions

The Trichoderma atroviride NI-1 is a native strain isolated from the rhizosphere of Eriobotrya japonica in Toliman municipality, Queretaro, Mexico. The oomycete Phytophthora capsici D3 strain was originally isolated from a chili cultivar at Dolores-Hidalgo, Guanajuato [19,20]. The fungal plant pathogens Botritys cinerea and Rhizoctonia solani AG2 were previously documented in confrontation against Trichoderma virens [21]. Fungal strains were propagated on PDA medium (DIFCO) and P. capsici on V8 juice agar (50 mL of V8 juice–CaCO3–agar) and incubated at 28 °C in darkness. P. capsici D3 was constantly kept on agar through the tests intercropping PDA-V8-PDA. Since we focused on T. atroviride parasitism against an oomycete and two true fungi, parasitism was used instead of mycoparasitism.

2.2. NI-1 Strain Identification

To ensure genetic uniformity, monosporic cultures were made from stock internal ceparium. Fresh mycelium from NI-1 growth on PDA medium and conidia was harvested with distilled water. Then, 100 µL of dilution 10−8 of spores were inoculated by extension on PDA medium supplemented with chloramphenicol at 50 µg/mL (USB Corporation, Cleveland, OH, USA) and Triton X-100 at 0.5% (Bio basic, Markham, ON, Canada). The isolate was grown for three days at 28 °C under constant light. The colonies obtained were inoculated on fresh PDA medium.
Genomic DNA was extracted from mycelium cultures in a potato dextrose broth (PDB) incubated at stirring at 160 rpm for 72 h at 28 °C. Mycelia were collected by filtration, treated with N2(l), and pulverized. The equivalent of 500 µL of powder mycelia was added to a 1.5 mL plastic tube with 600 µL of urea buffer (urea 8 M, NaCl 0.5 M, Tris 20 mM, EDTA 20 mM, SDS 2%, pH 8) and vortexed for 2 min and incubated at room temperature for 30 min. Phenol–chloroform extraction was performed two times as follows: 600 µL of phenol–chloroform–isoamyl alcohol (50:49:1) was added to the mixture, vortexed for 3 min, centrifugated at 11,000× g for 10 min, and the supernatant was transferred to a new 1.5 mL tube. After this, one volume of isopropanol was added, softly homogenized and centrifugated for 11,000× g for 10 min. The pellet was washed with 500 µL of 70% ethanol, mixed and centrifugated as previously mentioned, and dried at room temperature. The final pellet was resuspended on 100 µL of TE buffer (Tris 10 mM, EDTA 1 mM, pH 8) and treated with 0.1 UμL−1 RNAse I (ThermoFisher Scientific, Waltham, MA, USA) at 37 °C for 30 min. The pellet was stored at −20 °C.
The internal transcribed spacer region and translation elongation factor 1-alpha were amplified using primers for ITS and Tef-1α listed in Table S1. Amplicons were purified using a QIAquick PCR purification kit (QIAGEN, Hilde, Germany) and sequenced at the Laboratorio Nacional de Genómica para la Biodiversidad (LANGEBIO) facilities.
Concatenated sequences were aligned and manually adjusted when needed in relation to reference sequences using MEGA software (11.0.13). Alignment was analyzed using maximum parsimony (MP), maximum likelihood (ML) and Bayesian inference (BI) by PAUP 4.0a [22], RaxML 7.2.6 [23], and Mr. Bayes 3.2.5 [24] software, respectively. MP analysis was conducted using a heuristic search of 1000 replicates with TBR algorithm for the branches exchange and 1000 bootstrap replicates for branch support (BMP). ML analysis was carried out using the GTR+G substitution model and 1000 bootstrap replicates (BML). BI analysis was performed with the GTR+G+I model under the following parameters: ngen = 1,000,000, samplefreq = 100, and nruns = 4; posteriorly a burn-in of 25% to calculate the posterior probability (PP). We selected T. pubescens as the outgroup taxon. NCBI accession numbers used for phylogenetic analysis are listed in Table 1.

2.3. Antagonism Assays by Nonvolatile Compounds

To detect antibiosis mediated by diffusible metabolites, 5 mm mycelium plugs of NI-1 were inoculated on the center of PDA plates covered with a cellophane layer and incubated at 27 °C for 48 h. The cellophane layer with T. atroviride NI-1 mycelium was then removed, and a 5 mm plug of P. capsici, cut from the edge of the young colony, was inoculated at the center and incubated at 27 °C. At the same time, a control assay was carried out with inoculated P. capsici on fresh PDA plates, and the diameter of colonies was measured before the control reached the border of the plate, using ImageJ software (1.51j8v, NIH, Bethesda, MD, USA).

2.4. Antagonism Assays by Volatile Compounds

For antibiosis mediated by volatile organic compounds (VOCs), T. atroviride NI-1 and P. capsici mycelium plugs were placed on different PDA plates, placed together on the opposite side, and sealed with a plastic film to form a closed chamber. As a control, P. capsici was inoculated on both PDA plates, and both were sealed on opposite sides. Cultures were incubated at 27 °C, placing the VOC chamber with T. atroviride NI-1 growing at the bottom, and P. capsici growing at the top. When the control nearly reached the border of the PDA plates, the colony diameter was photographed and measured by ImageJ software (1.51j8v, NIH, Bethesda, MD, USA).

2.5. Parasitism Assays

The parasitic activity was assessed using a dual culture comprising mycelium plugs of T. atroviride NI-1 and P. capcisi, which were inoculated on opposite sides of Vogel’s minimal medium (VMM) plates (sucrose 1%, 100× concentrated mineral salts solution 2.5% consisting of KH2PO4 2.5%, NH4NO3 1%, MgSO4 0.1%, CaCl2 0.05%, and trace element solution 0.05% ZnSO4, 0.01% FeSO4, 0.005% CuSO4, 0.002% MnSO4, 0.002% H3BO3, and 0.002% Na2MoO4), at 1.5 cm from the border. The interaction zone was directly observed using an optical microscope (Leica ICC50 E, Leica Microsystems Ltd., Heerbrugg, Schweiz) equipped with a Leica camera to analyze parasitic structures, and images were processed using Leica LAS EZ software (V3.4.0, Leica Microsystems Ltd., Heerbrugg, Schweiz). Dual cultures were carried out on medium plates inoculated on opposite sides 1.0 cm from the border to analyze the overgrowth rate. Overgrowth rates were scored once Trichoderma mycelium and phytopathogen colonies came into contact with each other.

2.6. Effect of Different Carbon Sources on GRM Expression

To analyze the effect of carbon sources on parasitism, modifications on VMM were made by replacing sucrose with glucose (PQM Fermont, Monterrey, Mexico), dextrin from potato starch (Sigma-Aldrich, Saint Louis, MO, USA), glycerol (J.T. Baker, Phillipsburg, NJ, USA), sucrose, or cellulose (Sigma-Aldrich, Saint Louis, MO, USA) at 1%. Dual cultures were performed; inoculated T. atroviride NI-1 plugs and P. capsici were placed on opposite sites at 1.5 cm from the border of plates and then inoculated until both colonies contacted each other. Around 3 cm2 of mycelium was collected 1 cm after they came into contact, frozen in liquid nitrogen, and used for RNA extraction.

2.7. Effect of Different Nitrogen Sources on GRM Expression

To analyze the influence of nitrogen on parasitism, VMM was modified, replacing NH4NO3 (J.T. Baker, Phillipsburg, NJ, USA) with NaNO3 (Meyer, Ciudad de México, Mexico) and L-arginine (Golden-Bell, Ciudad de México, Mexico) at 1%. To prepare a mineral solution concentrate, salts were dissolved and sterilized by filtration using Whatman filters 0.45 µm (Little Chalfont, Buckinghamshire, UK). Interactions were performed with modified minimal medium inoculating T. atroviride NI-1 and P. capsici D3 mycelium plugs placed at 1.5 cm from the border of the plates. The interaction was compared on PDA media. Around 3 cm2 of mycelium was collected 1 cm after they came into contact, frozen in liquid nitrogen, and then used for RNA extraction.

2.8. Dual Cultures Assay to Analyze Gene Expression before-, during Contact, and Overgrowth

Dual cultures on VMM with 1% dextrin were performed to analyze T. atroviride NI-1’s interactions with plant pathogens, including an oomycete P. capsici, and two fungi B. cinerea, and R. solani. Mycelia was collected at 2, 1, and 0.5 cm before contact, during contact, and about 2 cm overgrowing (Figure S3). Mycelia was frozen in liquid nitrogen and kept at −70 °C for RNA extraction.
The control was carried out following the same approach, but two T. atroviride NI-1 mycelium plugs were placed at opposite sites on the plates to confront each other. All interactions were carried out in the dark, and cultures were visually monitored under a safe red light until the mycelia reached the abovementioned stages. Approximately 3 cm2 of T. atroviride NI-1 mycelia were collected, placed in a 1.5 mL tube, and frozen with liquid nitrogen. Samples were stored at −80 °C until processing.

2.9. RNA Extraction and Manipulation

Mycelia samples were homogenized using a tissue grinder and 1 mL of Trizol reagent (Invitrogen, Carlsbad, CA, USA) in 1.5 mL tubes. Mixtures were vortexed at maximum speed for 8 min at room temperature and centrifuged for 1 min at 13,000× g at 4 °C. The supernatant (SN) was recovered and mixed with 1 mL of chloroform (J.T. Baker, Phillipsburg, NJ, USA). The two phases were separated by centrifugation at 13,000× g at 4 °C for 10 min (© PrismR Labnet International). From the SN, total RNA was insolubilized with a volume of isopropanol at −20 °C for 12 h, and then it was recovered by centrifugation as indicated above. RNA pellet was washed with 1 mL of chilled 70% ethanol–DEPC to eliminate mineral salts. The pellets were then dried at room temperature, resuspended in 20 µL of nuclease-free water (Zymo-Research, Irvine, CA, USA), and 1 µg of RNA samples were treated with 1 U of DNAse I (Thermo Fisher Scientific, Waltham, MA, USA) at 37 °C for 30 min.

2.10. Complementary DNA Synthesis

Oligonucleotides were designed based on the T. asperellum CBS 433.97 strain genome [42] and T. atroviride IMI 206040 genome [26], except for the gpd gene [43]. The nucleotide sequences of the open reading frames of basic proteinase prb1 (XM024901871), chitinase ech42 (XM024910215), cellobiohydrolases cbh1 (XM024906693) and cbh2 (XM024910837), endo-β-glucanase bgn13.1 (XM024901914), and acid proteinase pra1 (XM024903604) were used to design the oligonucleotides by hand and properties were obtained using Oligo Calc calculator (http://biotools.nubic.northwestern.edu/OligoCalc.html, accessed on 20 June of 2021) [44] (Table S1).
cDNA was synthesized using 1 µg of total RNA previously treated with DNAse. RNA template and 10 pmoles reverse primers (Table S1) were incubated for 5 min to 65 °C before beginning the reaction by addition of 10 mM dNTPs (Thermo Fisher Scientific, Waltham, MA, USA), buffer, and 0.5 units of RevertAid Reverse Transcriptase (Thermo Fisher Scientific, Waltham, MA, USA) for each sample. Reactions were carried out at 42 °C for 60 min and terminated at 70 °C for 10 min. cDNA was stored at −20 °C until use for end-point PCR.

2.11. End-Point PCR to Detect Transcripts

The DreamTaq DNA Polymerase (Thermo Fisher Scientific, Waltham, MA, USA), 10 mM dNTPs (Thermo Fisher Scientific, Waltham, MA, USA), 0.1 mM forward and reverse oligonucleotides, respectively, and 1 µL of previously obtained cDNA was used as a template. Reactions were carried out according to the following conditions: first step at 95 °C/3 min, 25–45 cycles of 95 °C/30 s, 61 °C/45 s, 72 °C/45 s, and a final extension step of 72 °C/3 min.

2.12. Semiquantitative Expression Analysis

Gene expression was determined based on the selection of a cycle in which PCR products exponentially increased before reaching a maximum signal for each transcript according to the Calcáneo–Henández protocol [45] with few modifications. For this approach, end-point PCR was performed under the abovementioned conditions for the first set of five cycles for each reaction, from 25 to 45 (25, 30, 35, 40, and 45), and the amplicons were analyzed by electrophoresis.
End-point PCR was repeated, increasing cycle by cycle before the sutured signal, and a cycle was chosen before saturation (Table S1). In both cases, total RNA during the interaction with NI-1–P. capsici was used as a template to ensure the detection of GRM analyzed. This approach was used to analyze the gene expression of genes listed in Table S1 during three phases of Trichoderma parasitism: before contact, during physical contact, and overgrowing, as mentioned above. Amplicon area signals were quantified using ImageLab software (v 6.1.0, Standard Edition, Bio-Rad Laboratories, Inc., Hercules, CA, USA), and expression was normalized using the gpd transcript signal as a template-loaded control.

2.13. Statistical Analysis

Rstudio (version 2024.04.2, Posit Software, PBC, Boston, MA, USA) and GraphPad Prism 8 (8.0.1, GraphPad Software Inc., San Diego, CA, USA) were used for statistical analysis and graph generation. The experiments were performed in triplicate, and significant differences between treatments were determined using a value of p ≤ 0.05. Two-way ANOVA and all means were compared using Dunnett’s test to detect statistical differences between genetic expressions at different confrontations. A nonparametric test was applied when homoscedasticity was not observed.

3. Results

3.1. Trichoderma NI-1 Has a High Antagonistic Capacity against P. capsici D3

It has been reported that P. capsici D3 is an aggressive plant pathogen [19,20]; therefore, identifying and characterizing biocontrol agents able to antagonize this oomycete opens up major possibilities for establishing better control strategies. The NI-1 strain was isolated from the soil and chosen because of its capacity to antagonize several phytopathogenic fungi. Its antagonistic activity to control P. capsici by diffusible and volatile metabolites was analyzed (Figure 1 and Figure S1). Inhibition by diffusible compounds was highly efficient (100%), P. capsici was unable to growth and significantly more effective than by volatile organic compounds (VOCs), which was around 70% (Figure 1A). NI-1 was able to colonize the D3 mycelium, developing parasitic structures in the interaction zone in the dual culture test. NI-1 hyphae grew along the hyphae of D3 as a guide, and highly dense coiling structures were observed at some points (Figure 1B). Consistently, these dense coiling structures and overgrowth of the P. capsici colony are excellent indicators of parasitic aggressiveness. NI-1 inhibited P. capsici D3 growth through multiple mechanisms, suggesting that strain NI-1 could be a suitable biocontrol agent.

3.2. NI-1 Strain Is Phylogenetically Related to Trichoderma atroviride

Two colonies were obtained from monosporic cultures with the same colony characteristics: white and villous (Figure S2A). Both colonies appeared pale green, with a distinctive coconut odor due to 6-pentyl-α-pyrone emitted from the colonies on PDA medium (Figure S2B). In addition, both strains presented a regular concentric colonial morphology with abundant aerial mycelium and rapid radial growth, reaching the border Petri dish (90 mm diameter) after approximately three days. The back of the plate was not pigmented.
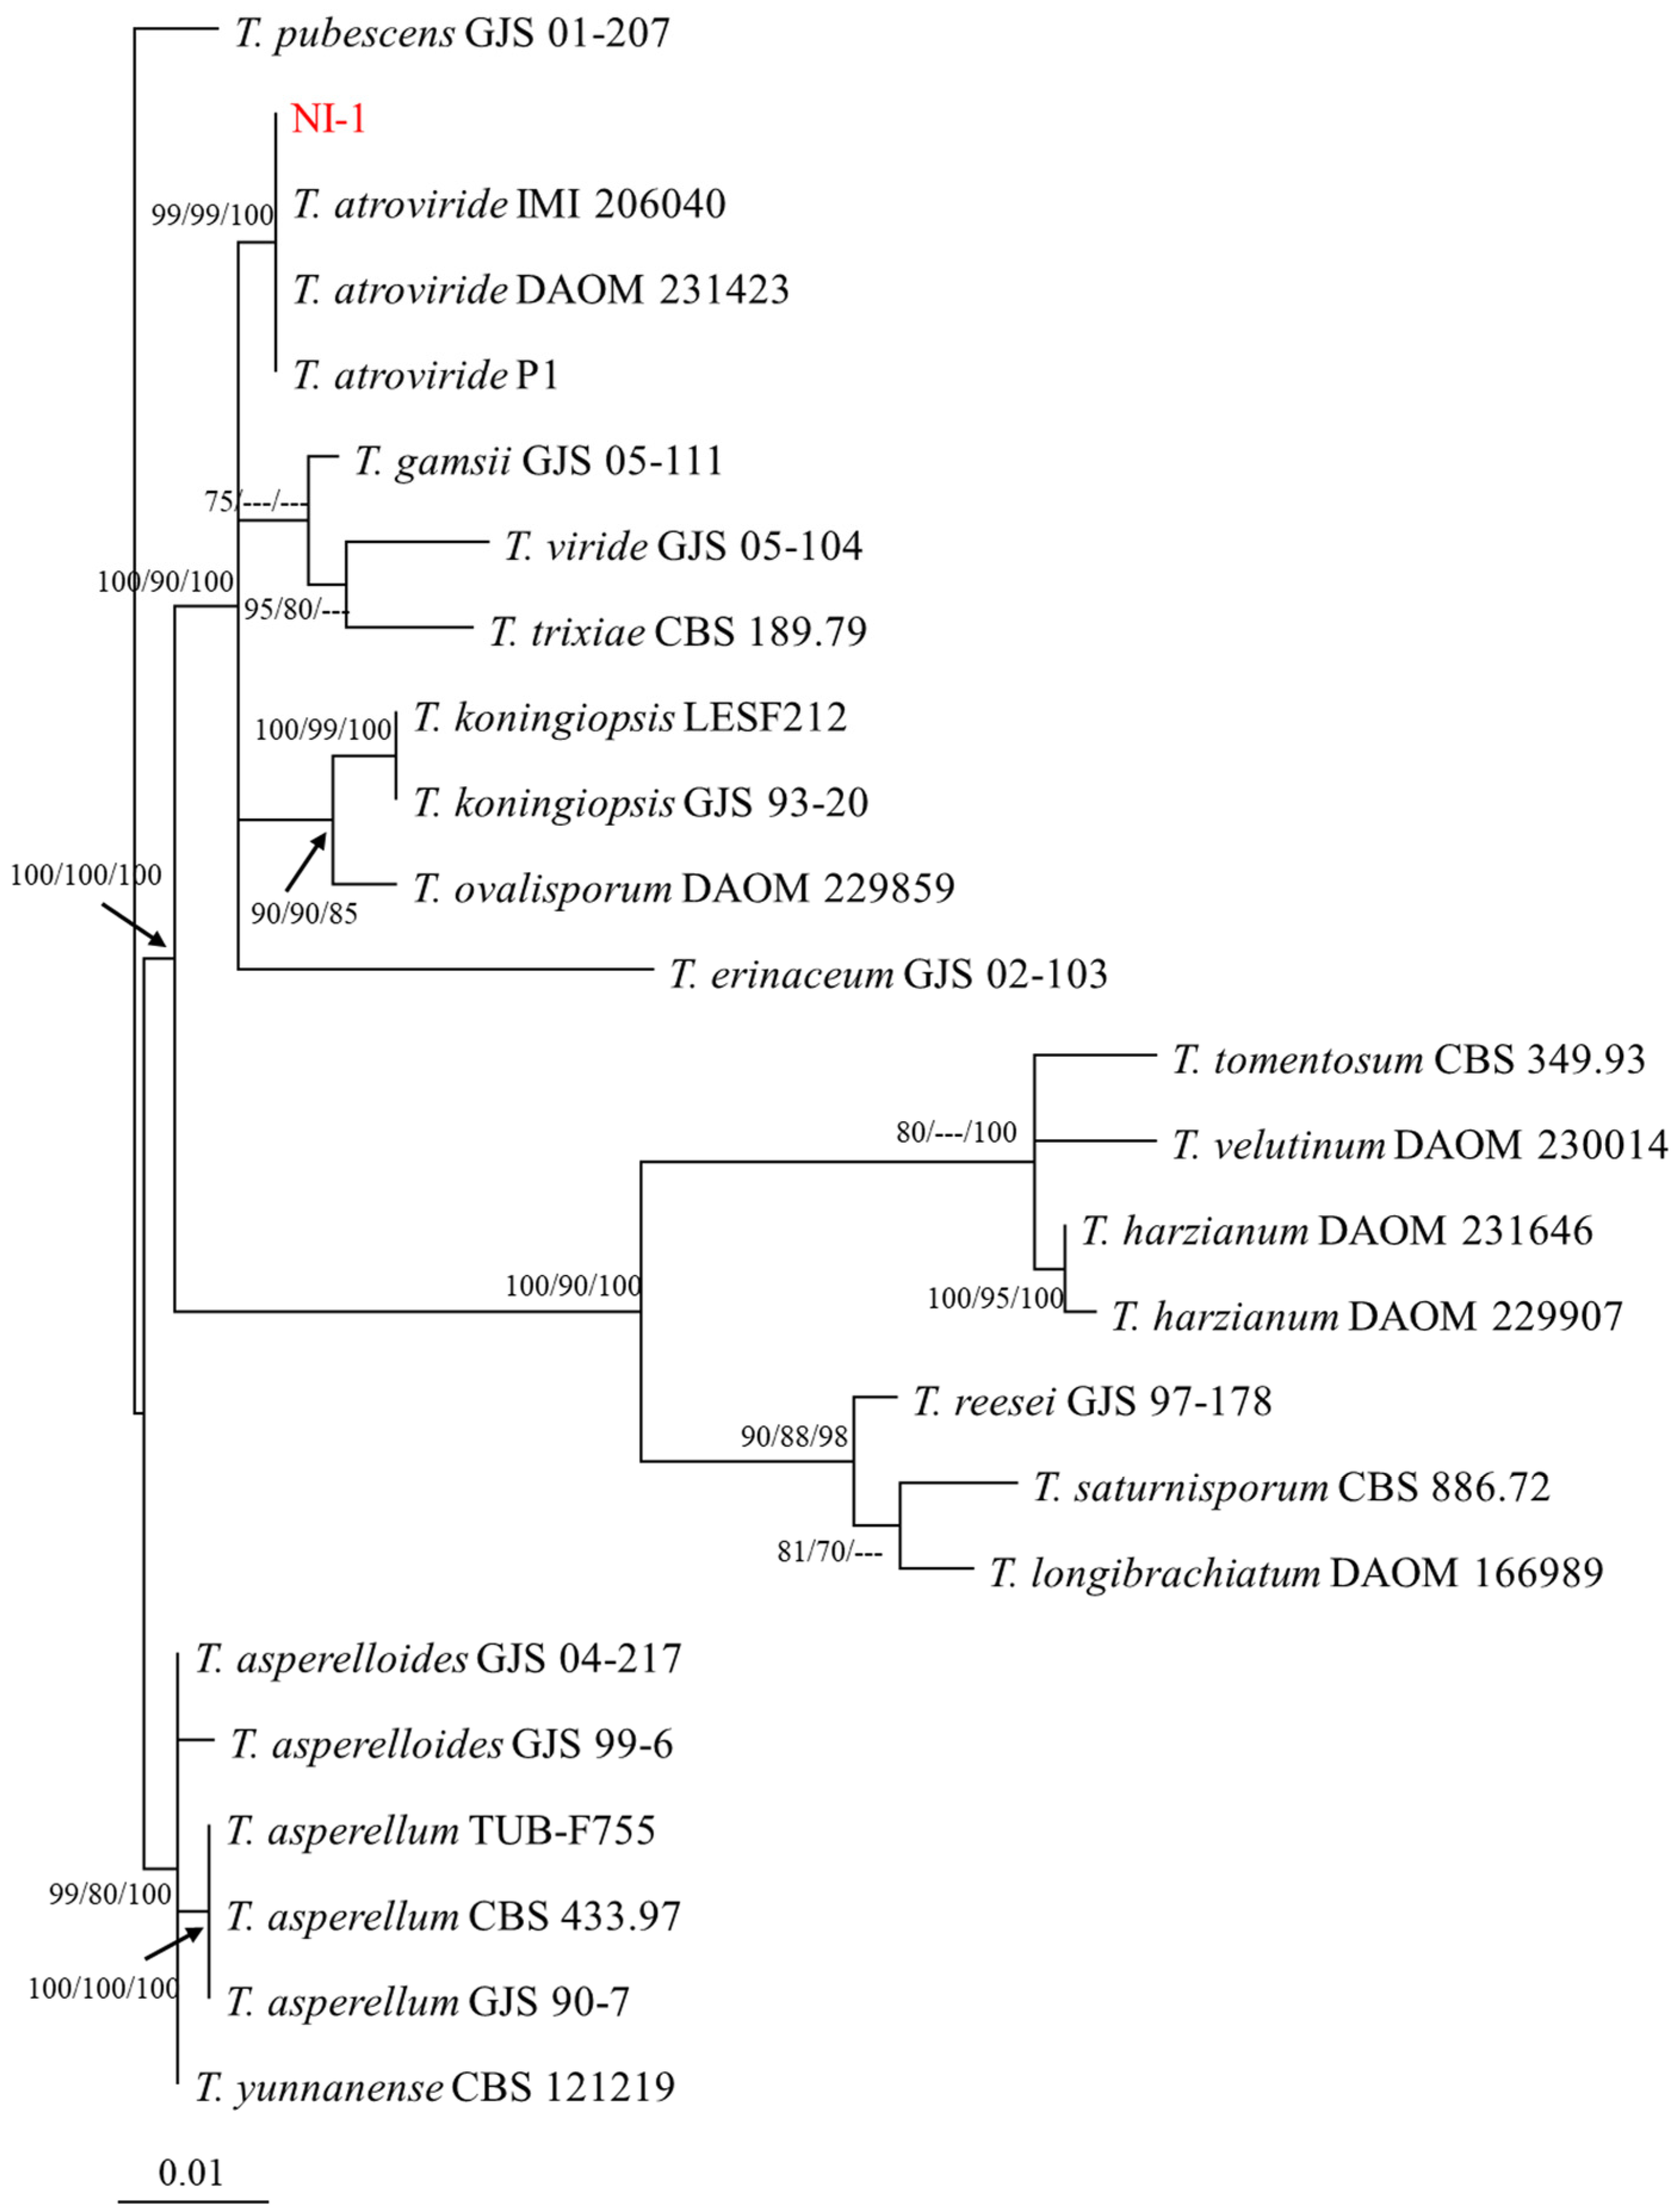
A phylogenetic tree was constructed with 25 ITS and TEF-1α sequences, including our isolate NI-1 and 24 reference sequences obtained from the GenBank repository (Table 1). ITS and Tef-1α alignment between the two isolates showed high similarity, indicating that they were the same strain. The phylogenetic tree and bootstrap values also showed that NI-1 clustered with Trichoderma atroviride (Figure 2). In addition to this, we ensured genetic uniformity on the stock spore solution that was subsequently used for the next assays.

3.3. Carbon Sources Influence GRM Expression

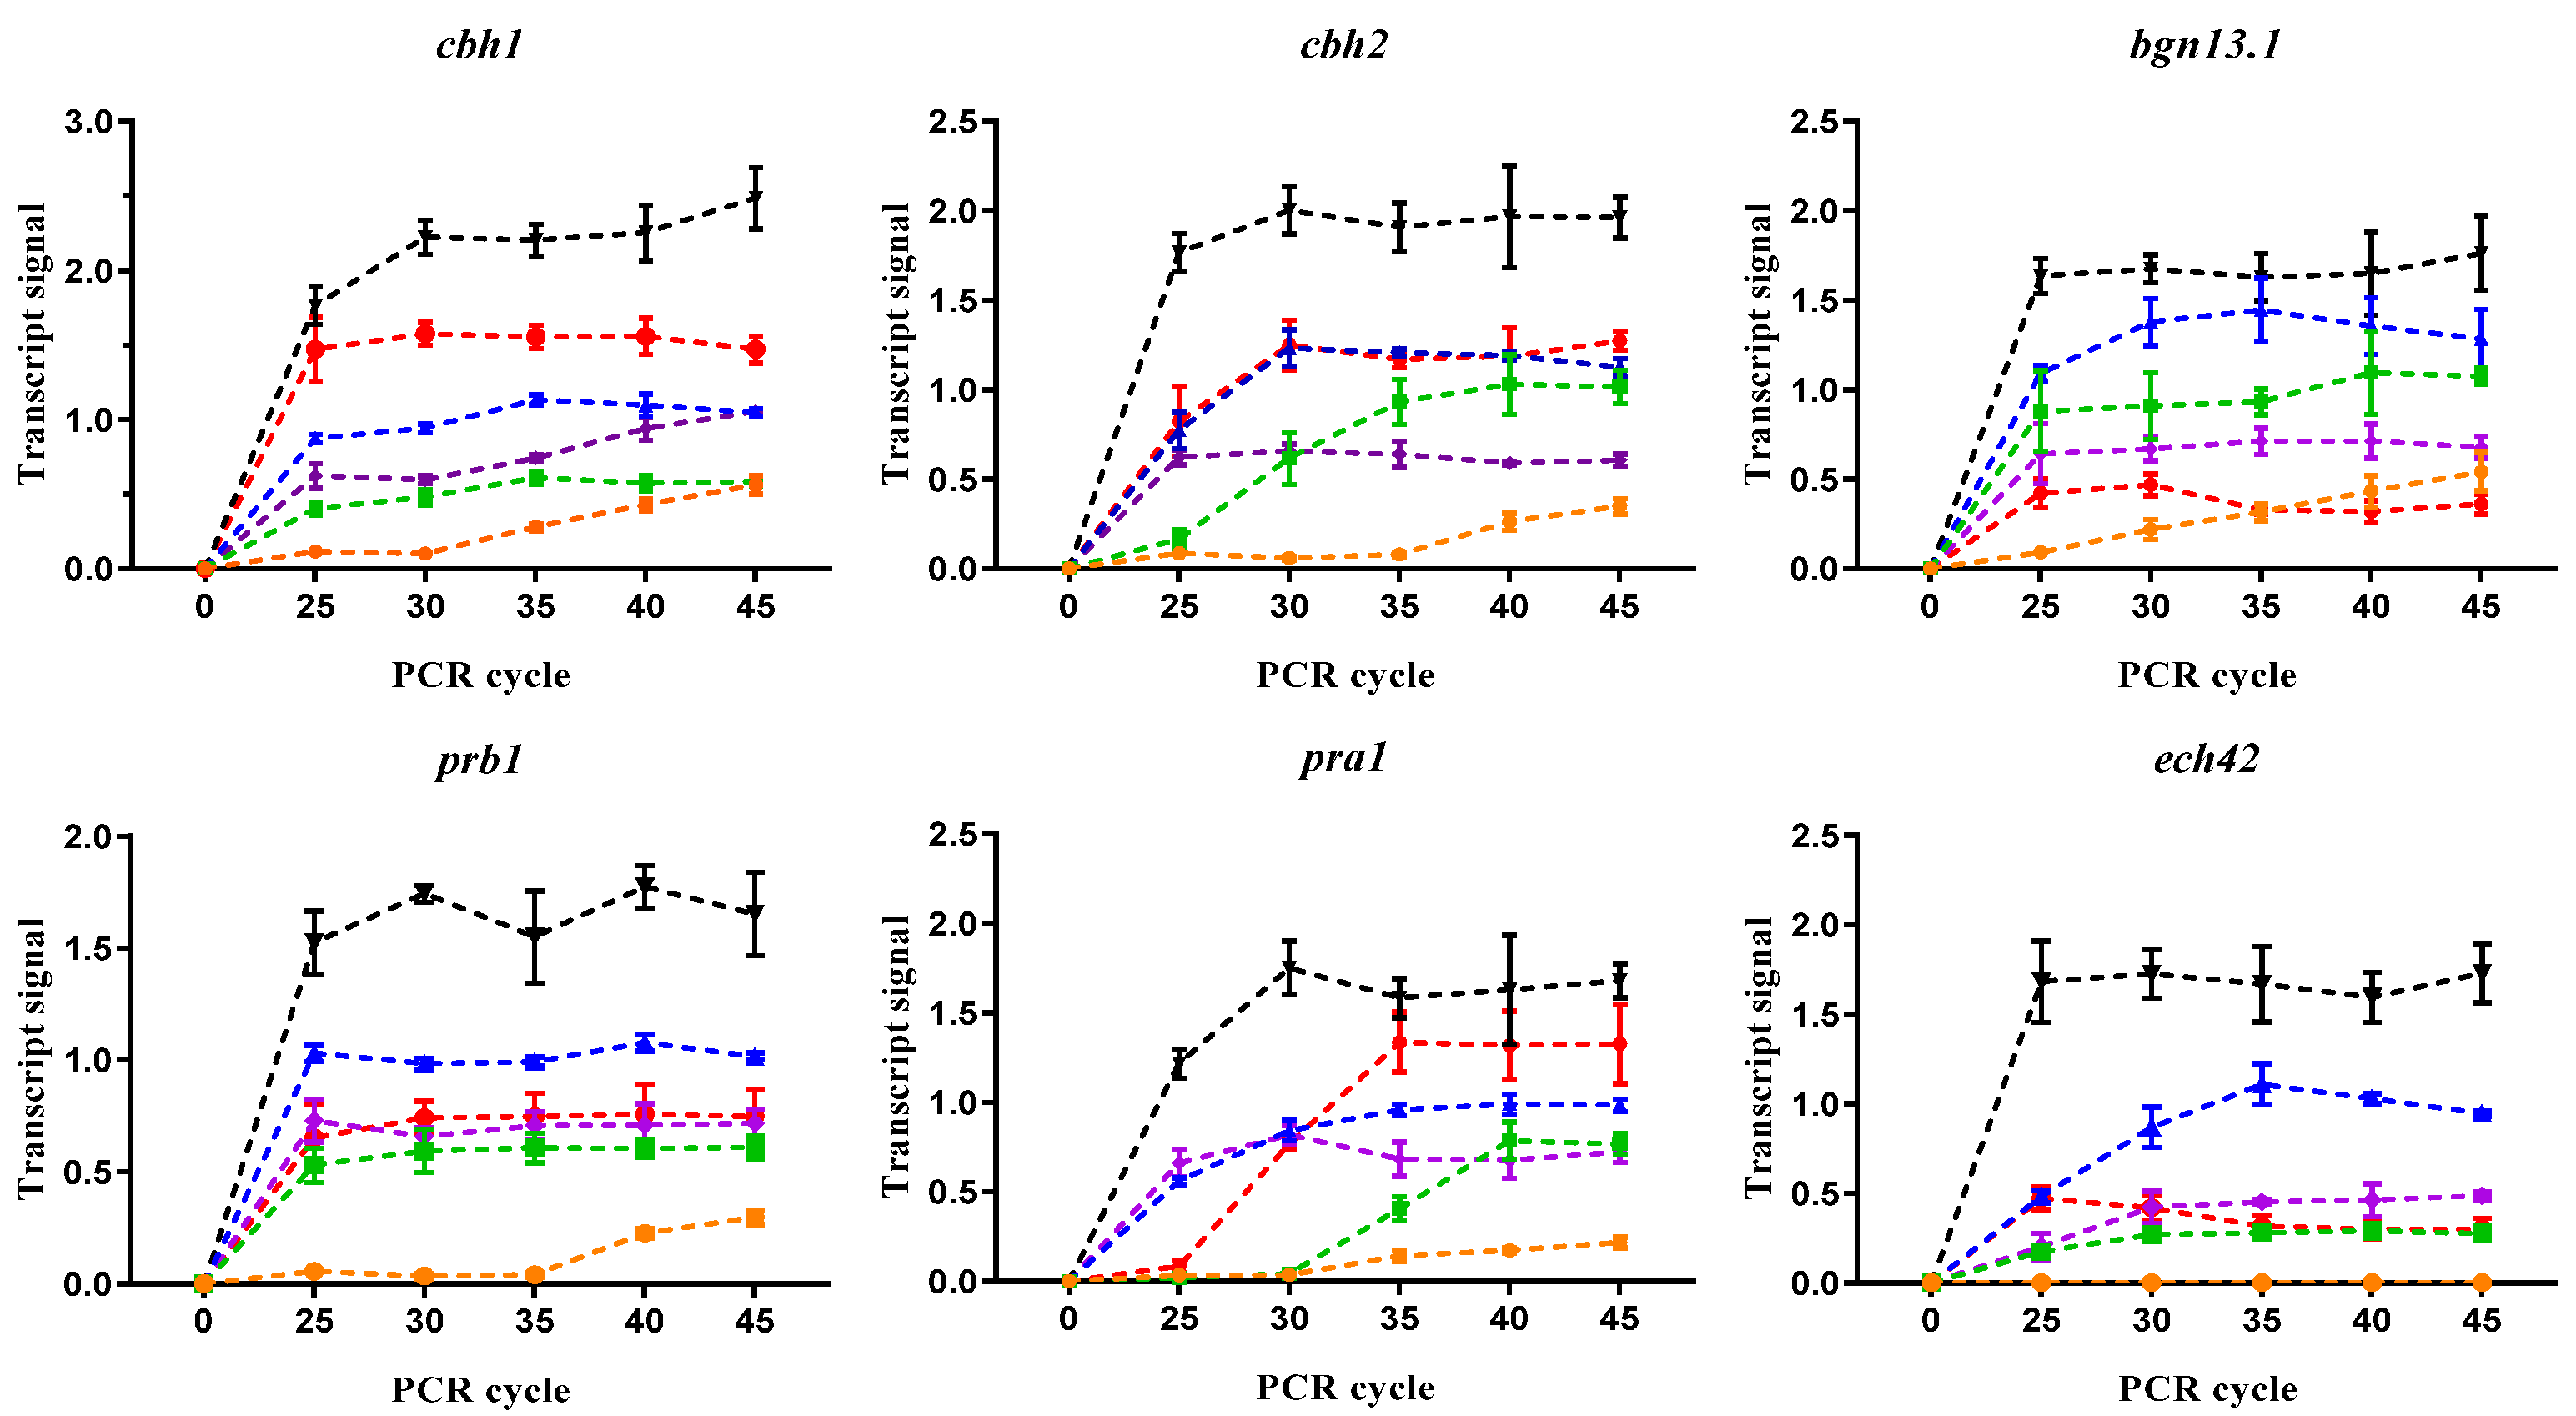
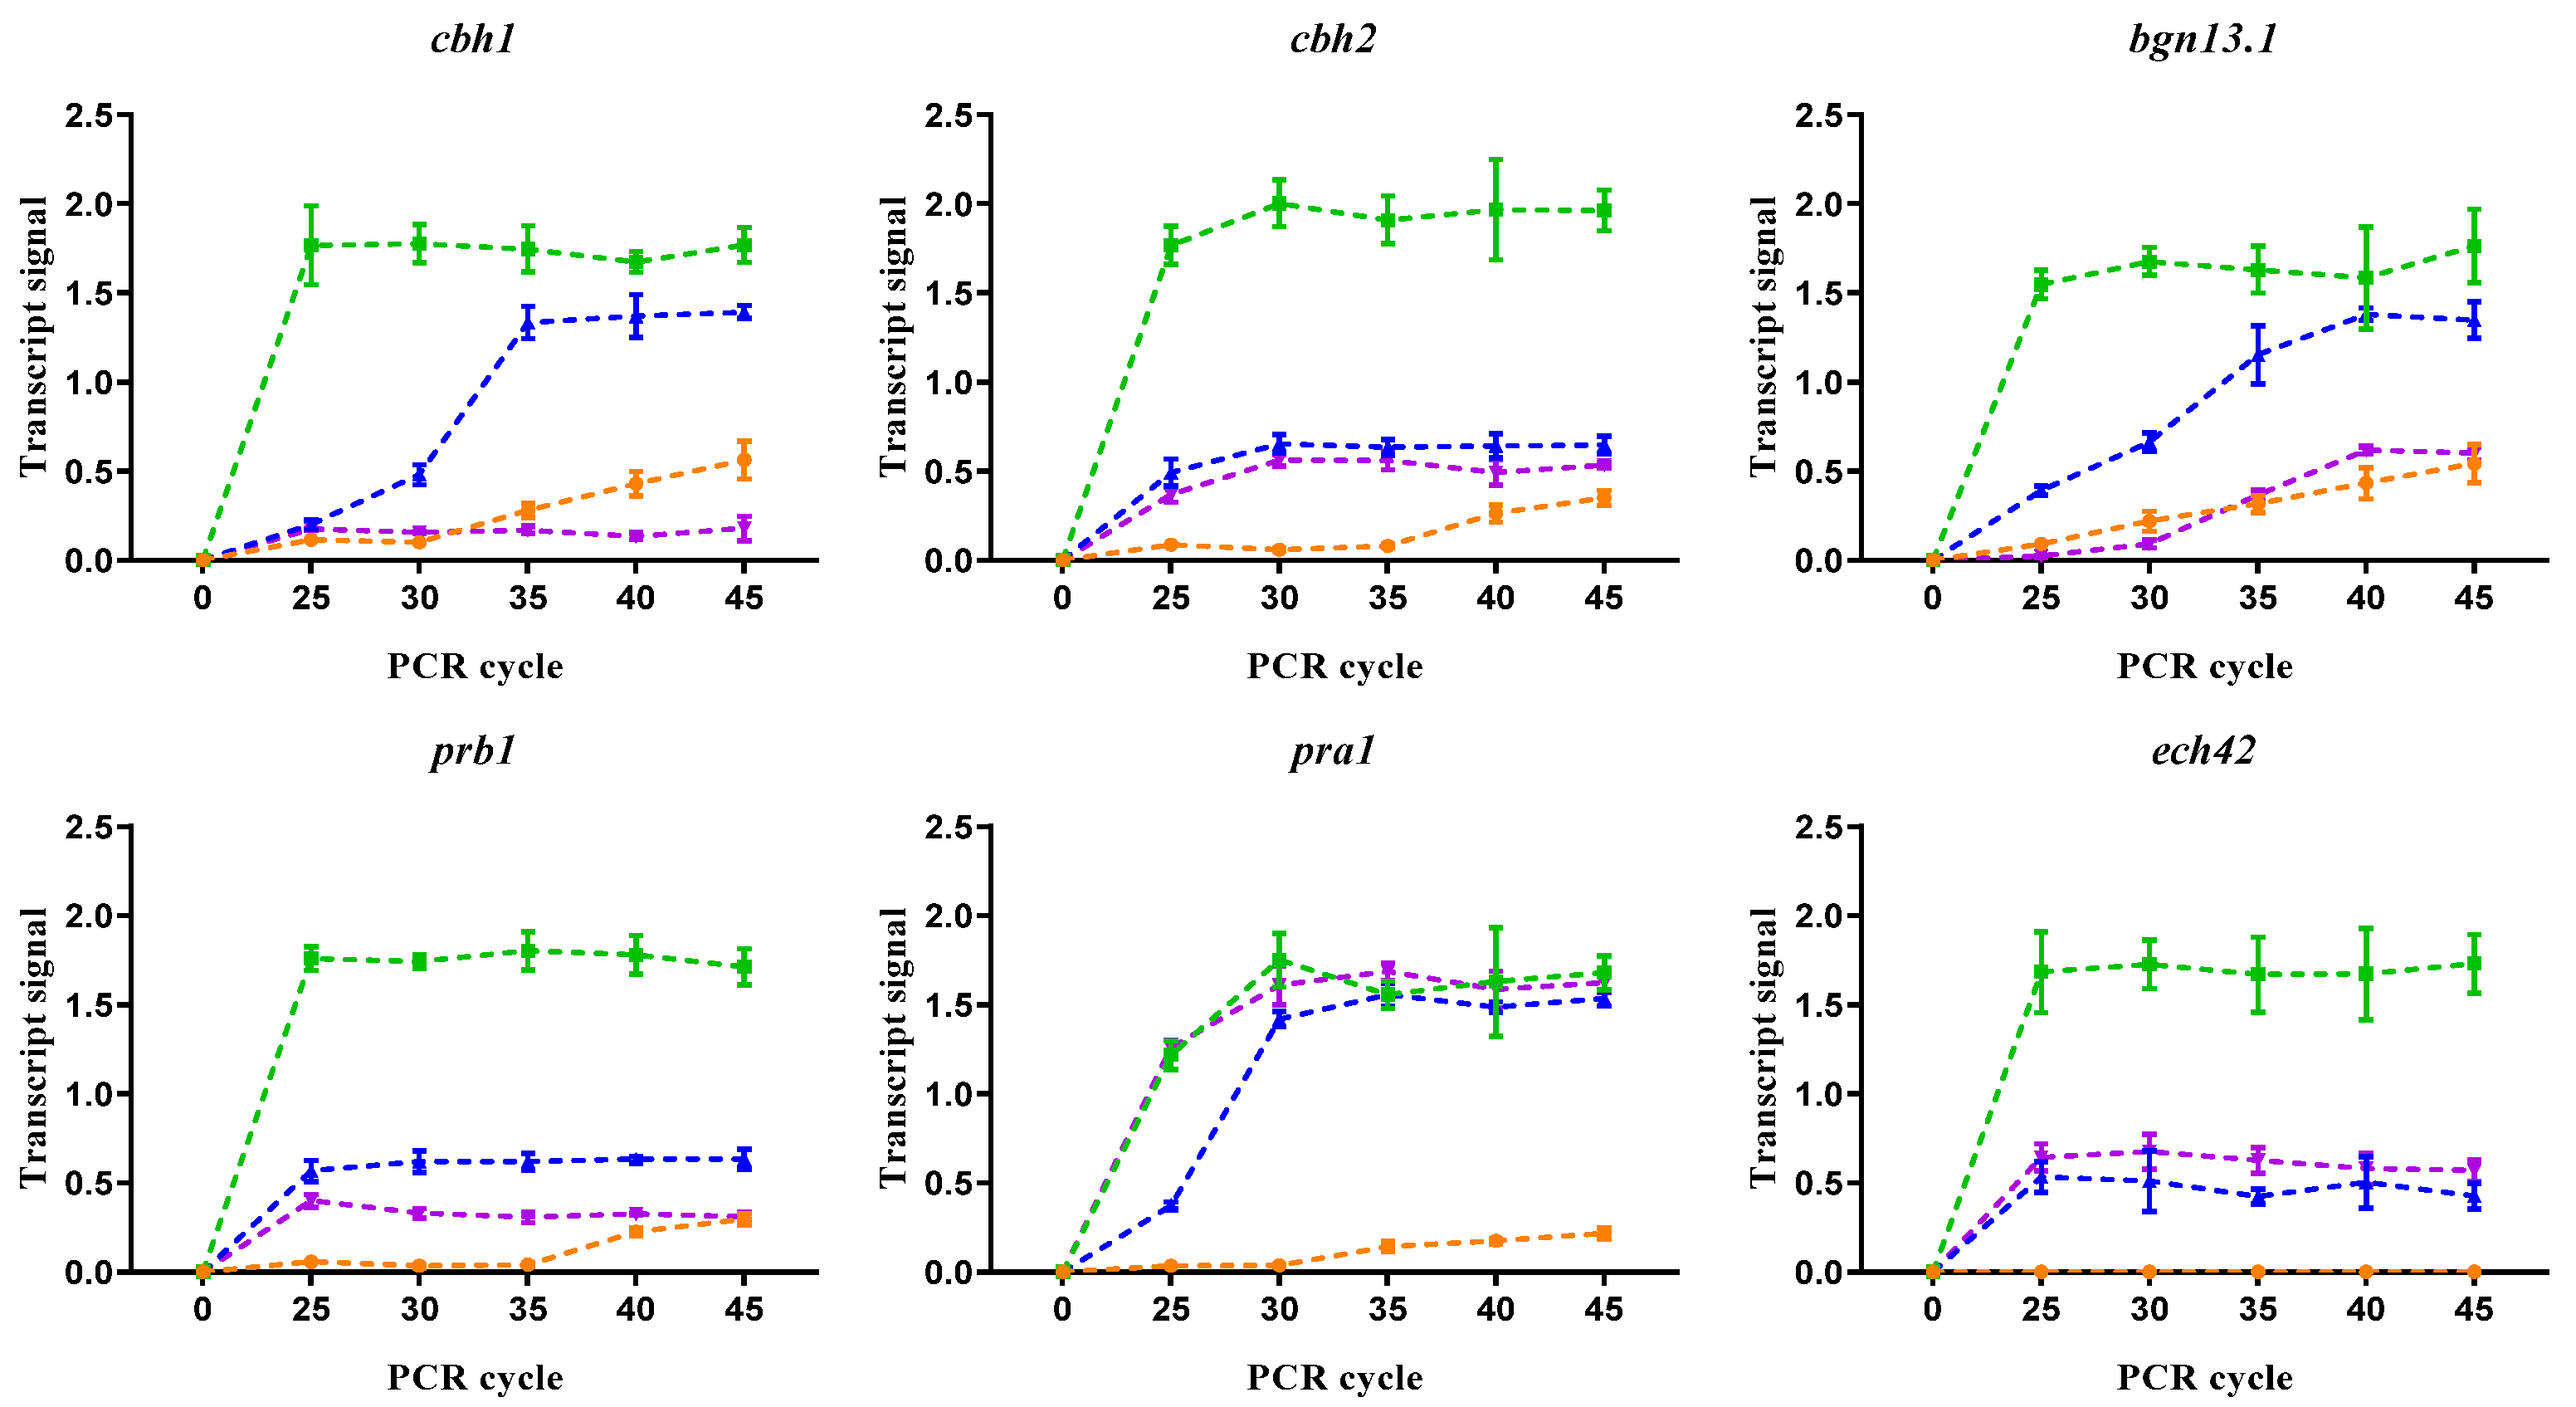
To evaluate the expression of genes encoding hydrolytic enzymes related to parasitism such as cellulases (cbh1 and cbh2), chitinases (ech42), endoglucanase (bgn13.1), and proteases (prb1 and pra1) during T. atrovirideP. capsici interaction, primers were designed using the sequences downloaded from the Trichoderma atroviride genome available in JGI (Table S1). During T. atrovirideP. capsici interaction on PDA, the transcripts of GRM analyzed here (cbh1, cbh2, ech42, bgn13.1, prb1, and pra1) were almost undetectable, requiring at least 35 cycles, but were induced during the interaction, except for ech42 transcript, which was not detected (Figure 3 and Figure 4). The cbh1, cbh2, and bgn13.1 encoding glucan hydrolases that degrade the primary cell wall constituents in P. capsici were detected at the cycle 40, whereas the prb1 and pra1 genes encoding a protease and a trypsin-like protein, respectively, were detected until cycle 45, indicating a very low expression during NI-1–P. capsici interaction on PDA plates. PDA is a rich medium containing amino acids and simple and complex sugars [46,47], a condition that could activate CCR and NCR, perhaps repressing the expression of GRM for degradation of P. capsici cellular components.
Considering that the very low transcript levels detected on PDA may be affected by a metabolic repression mechanism, Vogel’s minimal medium (VMM) was supplemented with 1% of primary (glucose) or secondary carbon sources such as dextrin, glycerol, sucrose, or cellulose analyzed with ammonium nitrate as a unique nitrogen source. All carbon sources tested stimulated higher transcript levels (Figure 3) than PDA, but dextrin was always better than the other carbon sources analyzed. Transcripts were detected many cycles earlier, and their saturation points on VMM plates indicated an increase in GRM expression levels. The cbh1 and cbh2 transcripts were detected starting at cycle 20 when confrontation was performed on VMM supplemented with dextrin, cellulose, and glucose, and their saturation points started at 25 cycles, whereas in glycerol and sucrose, saturation occurred at cycle 30. Similarly, bgn13.1 transcript levels were higher on VMM supplemented with dextrin and glucose (Figure 3).
Protease expression was also influenced by carbon source; prb1 and pra1 transcript levels were detected at earlier cycles, reaching saturation at 25 and 30 cycles, respectively, in media supplemented with glucose, sucrose, and dextrin. As indicated previously, when P. capsici and NI-1 confrontation was carried out on the PDA medium, ech42 transcripts were not detected, whereas on VMM supplemented with dextrin and glucose, high expression levels were observed. Although glycerol does not interfere with the induction of cellobiohydrolase when Trichoderma reesei grows in cellulose [48], all GRM transcripts were expressed at lower levels during the interaction between T. atroviride and P. capsici on VMM with glycerol as a carbon source. Interestingly, glucose, considered the primary carbon source, was documented to repress genes encoding lytic enzymes, but its activity had no impact on the induction of GRM expression in this assay. These results suggest that dextrin and glucose favor a high expression of genes encoding hydrolytic enzymes during T. atroviride parasitism.

3.4. Primary Nitrogen Sources Promoted Mycoparasitic-Related Gene Expression

Considering that the preferent nitrogen sources trigger repression to metabolize secondary sources, two secondary nitrogen sources (sodium nitrate and L-Arginine) were used and compared with the preferential nitrogen source (ammonium) (Figure 4). Notably, the preferred nitrogen source favored the transcript levels detected for all genes; the relative expression was consistently higher, reaching early saturation when the nitrogen source was ammonium nitrate. Only the pra1 gene reached high transcript levels independent of the nitrogen source. These results suggest that the mechanisms of nitrogen metabolism repression do not operate on GRM genes during a parasitic interaction between T. atroviride and P. capsici.

3.5. Trichoderma Atroviride Can Distinguish Its Prey

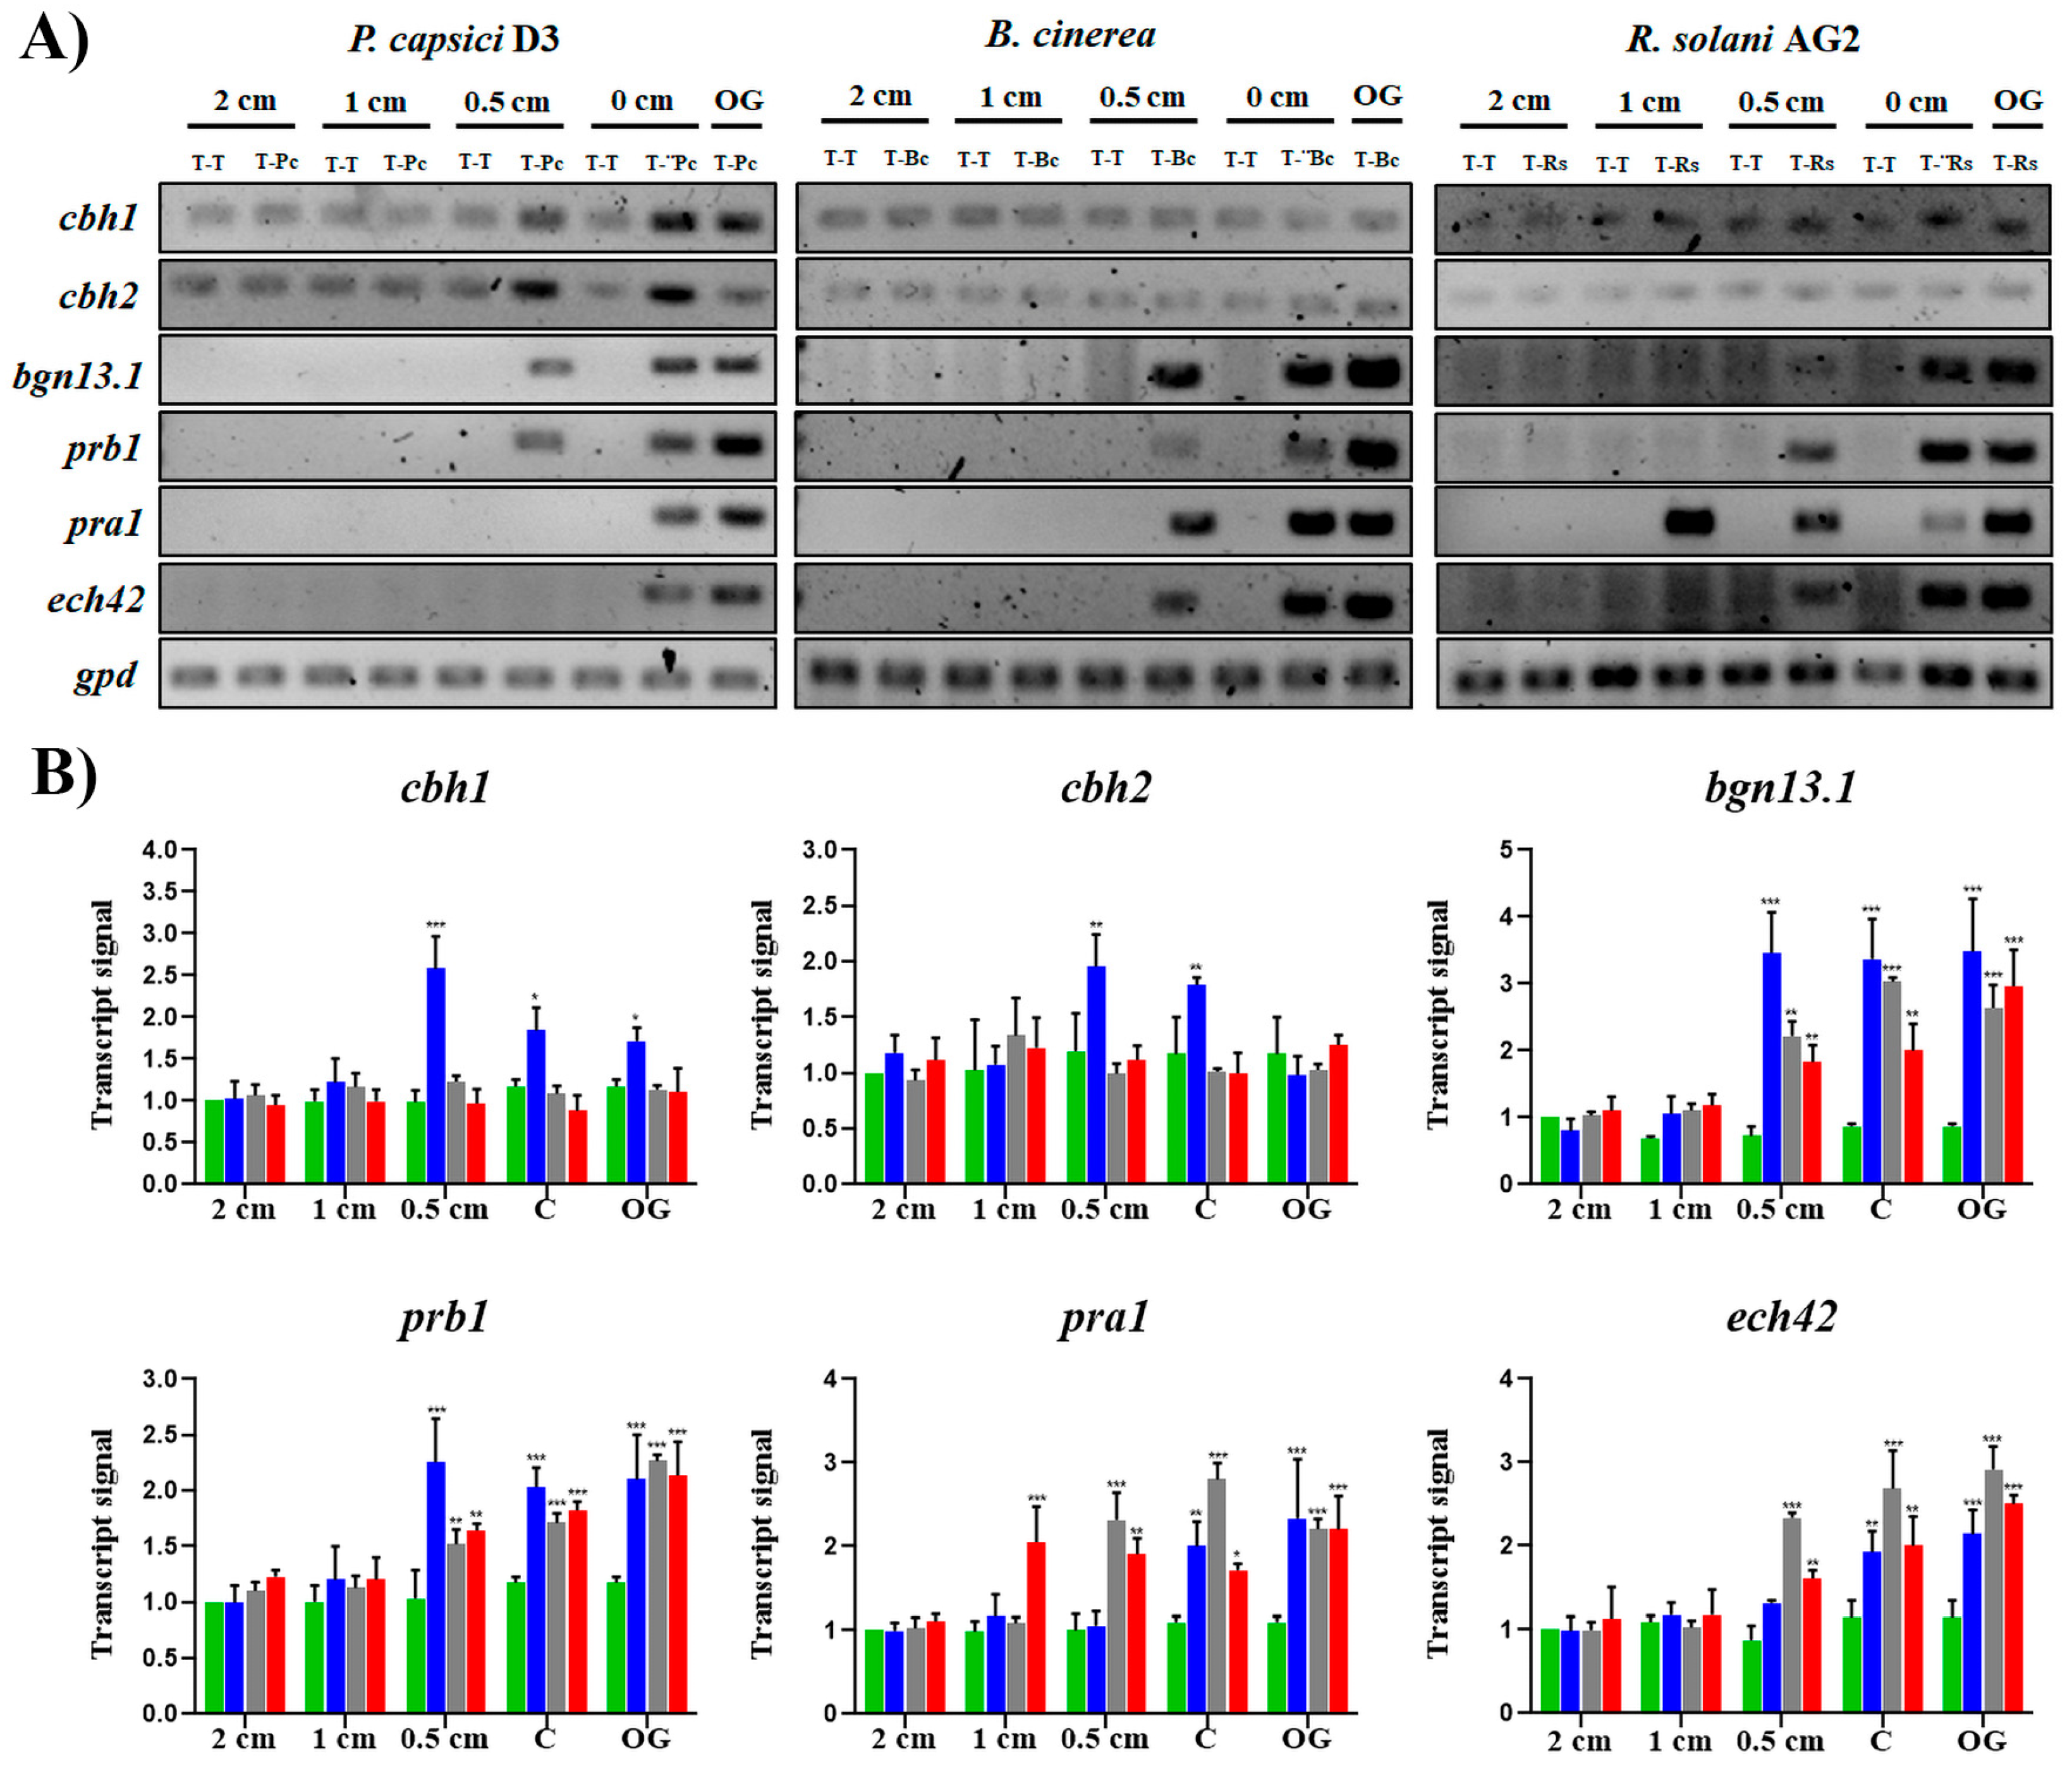
It has been documented that Trichoderma detects its host at a distance by diffusible factors [18], redirecting its growth to reach the host. To analyze the expression of GRM during T. atroviride–phytopathogen interaction, a confrontation assay was carried out, analyzing transcript levels before contact, contact, and overgrowth using minimal medium supplemented with dextrin and ammonium (Figure 5 and Figure S3).
All GRMs analyzed were generally detected before contact with the host, suggesting that diffusible factors regulate their expression. Interestingly, the specific transcript levels varied depending on the host, suggesting that different molecular mechanisms to detect the host are involved in T. atroviride. The background of cbh1 and cbh2 gene expression was detected throughout all stages of confrontation with all phytopathogens, which may be provoked by the cellophane used. The cbh1 and cbh2 genes were specifically induced during the confrontation against P. capsici at 0.5 cm before contact and physical contact. An increase in transcript levels was observed, which decreased during overgrowth (Figure 5A,B), whereas their expression was unresponsive during interaction with either R. solani or B. cinerea.
The bgn13.1 and prb1 transcripts were detected during all confrontation assays of T. atroviride NI-1–phytopathogens, indicating that the expression of both genes is indistinctly induced by the presence of a host when confronted with a fungus or an oomycete. Transcripts of both genes were detected at 0.5 cm before contact and remained high during the contact and overgrowth but were significantly higher during the confrontation with P. capsici concerning B. cinerea and R. solani, which had similar relative expression (Figure 5B).
Also, pra1 and ech42 expression were induced by the host presence; however, during the interaction of NI-1 and P. capsici, both genes were detected until they were in physical contact and maintained their high level during overgrowth (Figure 5A,B). During interaction with B. cinerea and R. solani, both genes were induced at 0.5 cm before contact, but the pra1 gene was induced at 1 cm before contact with R. solani. These results suggest that Trichoderma can distinguish between a fungus and an oomycete, and that Trichoderma detects different signals from a host, both diffusible factors, and by contact with some surface structural components.
The impact of nutrients on T. atroviride parasitism was more evident on ech42; it was not detected during the NI-1–P. capsici interaction on PDA medium (Figure 3 and Figure 4); however, when the interaction was carried out in VMM, it was clearly detected, including when they were in direct contact and overgrowth (Figure 5A). Together, the patterns of GRM expression analyzed when NI-1 confronted B. cinerea and R. solani were similar, but different during interaction with P. capsici, indicating different molecular mechanisms that T. atroviride has when detecting its host.

4. Discussion

Although Trichoderma parasitism has largely been studied to improve plant protection, and several species have been sequenced with data available online, the molecular mechanisms of how Trichoderma senses and transduces signals related to the hosts, which chemical signals of the hosts trigger parasitism of Trichoderma, and how genes related to parasitism are regulated remain to be elucidated [1].
Multiple factors influence mycotrophy, including the host–pathogen, abiotic stresses, and nutrient availability [17]. Based on our results, the aggressive behavior of the NI-1 strain under the conditions evaluated here is due to the carbon and nitrogen sources and phytopathogens. The carbon source significantly impacted GRM expression during the T. atrovirideP. capsici interaction. Although the PDA medium limited the expression of the GRM, T. atroviride could detect and respond to the host. Notably, responsiveness was stronger when the interaction was carried out on MMV supplemented with glucose and dextrin; the latter is a starch byproduct, and both are the primary carbon sources available in the PDA medium. Although glycerol and glucose are generally considered neutral and repressive carbon sources, respectively, they are known not to influence the expression and secretion of hydrolytic enzymes in Trichoderma [48]. Our results indicate that the T. atroviride NI-1 strain can express the analyzed GRM when interacting with a potential host despite these carbon sources. Similar results were observed when T. hamatum expressed prb1 and ech42 while interacting with Sclerotinia sclerotium in the presence of glycerol [10] or T. asperellum expressing a glucanase in the presence of glucose [49]. Considering the above, we suggest that T. atroviride NI-1 possesses a mechanism that prevents the CCR, ensuring the production of an enzymatic arsenal that inhibits the growth of a competitor. In addition, unlike the previous approaches used to analyze Trichoderma parasitism in a low-carbon-available condition [10] that triggers the process of autophagy and cell death in fungi [50], our results suggest that synthetic mediums’ preferent carbon and nitrogen sources improve responsiveness in Trichoderma.
The genes encoding cell wall degrading enzymes are induced by their specific substrates, such as glucan, chitin, cellulose, protein, and fungal cell walls [7,17,51]. Preferent nitrogen and carbon sources repress gene expression, and derepression by starvation is necessary to induce their expression in vitro. For example, the expression of prb1 was induced when T. atroviride IMI206040 grew in the presence of chitin, autoclaved mycelia, or R. solani dried cell walls, but not in the presence of glucose [52]. During interactions between T. atroviride–phytopathogens in the presence of preferent carbon and nitrogen sources, expression of the GRM was induced, indicating that Trichoderma prefers the parasitic lifestyle. Furthermore, these findings suggest that CCR or NCR, the main molecular mechanism devoted to sense the preferent nutrient to optimize resources, could be influenced by signals attributable to the living host. Our results reinforce the hypothesis that mycoparasitism is an ancestral trait in the Trichoderma lineage [26] and a dominant characteristic of T. atroviride.
It was observed that the expression of GRM is enhanced when both organisms compete for the consumption of preferent substrates. The oligosaccharides such as dextrins used in this research are considered ubiquitously used by Trichoderma, Phytophthora, and other fungi [53]. Our results showed that dextrin from starch is a carbon source that does not repress the expression of the genes analyzed here without suppressing their parasitic performance. In that sense, starch is a carbon source that induces the expression of glucanase tag83 in T. asperellum [49]. Therefore, another hypothesis is that Trichoderma employs parasitic strategies to eliminate competitors, ensuring that the substrate is available. To explain the lower responsivity of Trichoderma on PDA means that preferent nitrogen source ammonium is also key to attacking its prey. PDA has high levels of glucose and other carbohydrates present in potatoes, but nitrogen is available mainly in the form of amino acids and proteins.
The availability of carbon or nitrogen triggers signaling pathways that influence the development of Trichoderma. For example, nutritional stress can activate the TOR pathway by negative regulators, and the absence of these regulators decreases the mycoparasitic activity of T. atroviride as well as vegetative development [54]. In that sense, when we elevated the concentrations of carbon and nitrogen to reduce cellular stress, GRM expression increased, suggesting another mechanism that deregulates the activation of signaling pathways and allows the assimilation of alternative carbon and nitrogen sources.
The GRM expressions during interaction with NI-1–R. solani and NI-1–B. cinerea were similar, but they were different during interaction with NI-1–P. capsica under the same conditions, suggesting that T. atroviride can differentiate between a true fungal and an oomycete, linked to specific combat strategies. Trichoderma detected phytopathogens before contact, suggesting that specific diffusible factors associated with the prey were detected. It was documented that a small organic molecule is capable of passing across a cellophane membrane, activating the mycoparasitic response in T. atroviride [18]. Another explanation could be related to differences in cell wall composition [55] or proteins secreted [56] specific to P. capsici in relation to ascomycetes or basidiomycetes. For example, elicitins that are specific to oomycetes and trigger a defense response in tobacco plants [57] can act as MAMPs that also trigger a molecular defense response in the NI-1 strain, which includes the expression of GRM.
The cbh1 and cbh2 genes encode two cellobiohydrolases, which are of biotechnological interest for the degradation of cellulose in T. reesei [58]. However, few reports have suggested that the intervention of this group of genes is related to mycoparasitism [59]. Based on our results, we suggest that cbh1 and cbh2 play a role in the parasitism of P. capsici at the onset of the interaction but not with R. solani or B. cinerea. In this sense, the P. capsici cell wall is mainly composed of β-glucans, cellulose, and proteins [60], and small amounts of chitin in their cell wall are associated with vegetative growth, asexual reproduction, and pathogenicity [61]. However, modification of cell wall composition is a process described by many phytopathogens; therefore, P. capsici could modify their cell wall during parasitic interactions with T. atroviride NI-1 and influence the cbh1 and cbh2 gene expression to protect their cell integrity [62]. Similar results were observed during the interaction of T. reesei with the oomycete Pythium ultimum in which the cbh1 transcript was upregulated when in the presence of the phytopathogen [63].
The Bgn13.1 gene encodes an endo-β-1,3 glucanase that is involved in extracellular digestion of the cell wall components of the host fungus. In this case, we observed the influence of phytopathogen on the expression of bgn13.1, as was reported in T. harzianum, T. asperellum, and T. atroviride [1]. Expression of pra1 does not seem specific for any phytopathogen, as has been reported for other Trichoderma strains. In this sense, pra1 is associated with extracellular proteolytic activities, as we observed in our results because expression occurs before contact, similar to the interaction between T. atroviride IMI206040 and the phytopathogens evaluated here [10]. However, the expression levels could vary depending on the host and stage of interaction, suggesting that the expression of pra1 could be influenced by specific proteins or metabolites from the host. Ech42 is known to be induced by fungal hosts, as well as NI-1, when interacting with R. solani and B. cinerea. However, few reports about the role of this gene during the colonization of oomycetes have been carried out. The NI-1 strain expressed this gene only during the contact and colonization processes, suggesting that the induction of ech42 of NI-1 occurs to counter the defense mechanisms from the oomycete. A similar response was observed on the tripartite interaction system plant–TrichodermaPhytophthora nicotianae in which ech42 of T. asperellum and T. atroviride were upregulated when the systems confronted the phytopathogen [64].
In general, the nutritional status of T. atroviride NI-1 during the antagonistic interaction against a competitor is essential to performing a good parasitism process, in which the expression of genes related to mycoparasitism is involved, and the host to be colonized can be specifically detected. In that sense, the induction of GRM tends to be upregulated in the presence of the fungal host independently of the carbon and nitrogen source in the media.
Considering that CCR and NCR are economizing mechanisms for saving energetic resources on fungi, the transcription of GRM for assimilation of the host’s cell wall carbohydrates and proteins is needed to counter the presence of competitors despite repressive nutriment sources. Consequently, the presence of the host may block the economizing mechanisms to transform T. atroviride NI-1 into a successful competitor. Based on the expression pattern of genes analyzed before contact, Trichoderma can distinguish between an oomycete and a true fungus, indicating the presence of different molecular mechanisms to detect and attack its prey. Therefore, T. atroviride NI-1 hydrolytic enzymes involved in parasitism during confrontation with R. solani, B. cinerea, and P. capsici have a different expression pattern, which might be influenced by specific host metabolic and/or protein-secreting profiling.

5. Conclusions

Environmental factors influence the genetic repertoire expressed by an organism. A dominant regulation of preferent carbon and nitrogen sources on gene expression encoding enzymes to degrade and potentially assimilate the main structural components of the plant pathogens was documented. Consequently, coculture assays to analyze the Trichoderma parasitism were performed on a culture medium limited in carbon and nitrogen sources, implying that the presence of the host elicits stimuli that upregulate the genes involved in consuming structural biomolecules from prey. In this case, parasitism and aggressive behavior of Trichoderma must also be considered as possible mechanisms that ensure their survival. Otherwise, confronting assays between T. atroviride NI-1 and P. capsici, R. solani, or B. cinerea, respectively, showed that Trichoderma can distinguish between oomycetes and fungal hosts. The high parasitic responsiveness exhibited by Trichoderma on preferent carbon and nitrogen sources supports experimental evidence that parasitism is an ancestral lifestyle shared by many strains.

Supplementary Materials

The following supporting information can be downloaded at: https://www.mdpi.com/article/10.3390/jof10100671/s1. The supplementary material comprises Figure S1: Influence of NI-1 Volatile Organic compounds (VOCs) over P. capsici D3. Figure S2: Colonial morphology of NI-1. Figure S3: Plate confrontations between T. atroviride NI-1 against phytopathogens. Table S1: Primers sequences used to analyze gene expression by semi quantitative RT-PCR. References [45,65,66] are cited in the supplementary materials.

Author Contributions

Conceptualization and methodology: V.J.G.-S., K.L.S.-L., J.J.E.M., D.S.-H. and E.U.E.-N.; software, data curation: V.J.G.-S., K.L.S.-L. and E.U.E.-N.; validation: E.U.E.-N., J.C.V.-A., F.L.-J., J.A.C.-C. and A.M.-M.; formal analysis: V.J.G.-S. and E.U.E.-N.; investigation: V.J.G.-S. and E.U.E.-N.; resources: E.U.E.-N.; writing—original draft preparation: V.J.G.-S. and E.U.E.-N.; writing—review and editing: E.U.E.-N., J.C.V.-A., F.L.-J., J.A.C.-C. and A.M.-M.; supervision, project administration, and funding acquisition: E.U.E.-N. All authors have read and agreed to the published version of the manuscript.

Funding

This research was funded by UNIVERSIDAD AUTONOMA DE QUERETARO, grant number FOPER-2022-FCN02636 (Fondo de Proyectos Especiales de Rectoria, UAQ) and FONDEC-UAQ-2022 (Fondo para el desarrollo del Conocimiento—Universidad Autónoma de Querétaro, FNB202204).

Institutional Review Board Statement

The study was conducted in accordance with the Declaration of Helsinki and approved by the Ethics Committee of the Natural Science School of Autonomous University of Queretaro with a number of protocol code 33FCN2020 with the date of approval of 5 May 2020.

Informed Consent Statement

Not applicable.

Data Availability Statement

The original contributions presented in the study are included in the article/Supplementary Materials, further inquiries can be directed to the corresponding author.

Acknowledgments

Special thanks are given to Pérez-Reséndiz Juan-Enrique and the ejidal community of Tolimán and Dolores Hidalgo for their support during the sampling. V.J.G.-S. is indebted with CONAHCYT for his doctoral scholarship.

Conflicts of Interest

The authors declare no conflicts of interest. The funders had no role in the design of the study; in the collection, analyses, or interpretation of data; in the writing of the manuscript, or in the decision to publish the results.

References

  1. Mukherjee, P.K.; Mendoza-Mendoza, A.; Zeilinger, S.; Horwitz, B.A. Mycoparasitism as a Mechanism of Trichoderma-Mediated Suppression of Plant Diseases. Fungal Biol. Rev. 2022, 39, 15–33. [Google Scholar] [CrossRef]
  2. Karlsson, M.; Atanasova, L.; Jensen, D.F.; Zeilinger, S. Necrotrophic Mycoparasites and Their Genomes. Microbiol. Spectr. 2017, 5, 1–21. [Google Scholar] [CrossRef]
  3. Atanasova, L.; Crom, S.L.; Gruber, S.; Coulpier, F.; Seidl-Seiboth, V.; Kubicek, C.P.; Druzhinina, I.S. Comparative Transcriptomics Reveals Different Strategies of Trichoderma mycoparasitism. BMC Genom. 2013, 14, 121. [Google Scholar] [CrossRef]
  4. Singh, N.; Singh, A.; Dahiya, P. Plant Growth-Promoting Endophytic Fungi from Different Habitats and Their Potential Applications in Agriculture. In Recent Trends in Mycological Research: Volume 1: Agricultural and Medical Perspective; Yadav, A.N., Ed.; Fungal Biology; Springer International Publishing: Cham, Switzerland, 2021; pp. 69–87. ISBN 978-3-030-60659-6. [Google Scholar]
  5. Alfiky, A.; Weisskopf, L. Deciphering Trichoderma–Plant–Pathogen Interactions for Better Development of Biocontrol Applications. J. Fungi 2021, 7, 61. [Google Scholar] [CrossRef] [PubMed]
  6. Kappel, L.; Münsterkötter, M.; Sipos, G.; Rodriguez, C.E.; Gruber, S. Chitin and Chitosan Remodeling Defines Vegetative Development and Trichoderma Biocontrol. PLoS Pathog. 2020, 16, e1008320. [Google Scholar] [CrossRef]
  7. Brunner, K.; Peterbauer, C.K.; Mach, R.L.; Lorito, M.; Zeilinger, S.; Kubicek, C.P. The Nag1 N-Acetylglucosaminidase of Trichoderma atroviride Is Essential for Chitinase Induction by Chitin and of Major Relevance to Biocontrol. Curr. Genet. 2003, 43, 289–295. [Google Scholar] [CrossRef]
  8. Sharma, V.; Salwan, R.; Sharma, P.N.; Kanwar, S.S. Elucidation of Biocontrol Mechanisms of Trichoderma harzianum against Different Plant Fungal Pathogens: Universal yet Host Specific Response. Int. J. Biol. Macromol. 2017, 95, 72–79. [Google Scholar] [CrossRef]
  9. Guzmán-Guzmán, P.; Alemán-Duarte, M.I.; Delaye, L.; Herrera-Estrella, A.; Olmedo-Monfil, V. Identification of Effector-like Proteins in Trichoderma spp. and Role of a Hydrophobin in the Plant-Fungus Interaction and Mycoparasitism. BMC Genet. 2017, 18, 16. [Google Scholar] [CrossRef]
  10. Reithner, B.; Ibarra-Laclette, E.; Mach, R.L.; Herrera-Estrella, A. Identification of Mycoparasitism-Related Genes in Trichoderma atroviride. Appl. Environ. Microbiol. 2011, 77, 4361–4370. [Google Scholar] [CrossRef]
  11. Adnan, M.; Zheng, W.; Islam, W.; Arif, M.; Abubakar, Y.S.; Wang, Z.; Lu, G. Carbon Catabolite Repression in Filamentous Fungi. Int. J. Mol. Sci. 2017, 19, 48. [Google Scholar] [CrossRef]
  12. Fayyad-Kazan, M.; Feller, A.; Bodo, E.; Boeckstaens, M.; Marini, A.M.; Dubois, E.; Georis, I. Yeast Nitrogen Catabolite Repression Is Sustained by Signals Distinct from Glutamine and Glutamate Reservoirs. Mol. Microbiol. 2016, 99, 360–379. [Google Scholar] [CrossRef]
  13. Han, L.; Liu, K.; Ma, W.; Jiang, Y.; Hou, S.; Tan, Y.; Yuan, Q.; Niu, K.; Fang, X. Redesigning Transcription Factor Cre1 for Alleviating Carbon Catabolite Repression in Trichoderma reesei. Synth. Syst. Biotechnol. 2020, 5, 230–235. [Google Scholar] [CrossRef]
  14. Pang, A.-P.; Zhang, F.; Hu, X.; Luo, Y.; Wang, H.; Durrani, S.; Wu, F.-G.; Li, B.-Z.; Zhou, Z.; Lu, Z.; et al. Glutamine Involvement in Nitrogen Regulation of Cellulase Production in Fungi. Biotechnol. Biofuels 2021, 14, 199. [Google Scholar] [CrossRef] [PubMed]
  15. Sun, Y.; Qian, Y.; Zhang, J.; Wang, Y.; Li, X.; Zhang, W.; Wang, L.; Liu, H.; Zhong, Y. Extracellular Protease Production Regulated by Nitrogen and Carbon Sources in Trichoderma reesei. J. Basic Microbiol. 2021, 61, 122–132. [Google Scholar] [CrossRef] [PubMed]
  16. Suarez, B.; Rey, M.; Castillo, P.; Monte, E.; Llobell, A. Isolation and Characterization of PRA1, a Trypsin-like Protease from the Biocontrol Agent Trichoderma harzianum CECT 2413 Displaying Nematicidal Activity. Appl. Microbiol. Biotechnol. 2004, 65, 46–55. [Google Scholar] [CrossRef]
  17. Olmedo-Monfil, V.; Mendoza-Mendoza, A.; Gómez, I.; Cortés, C.; Herrera-Estrella, A. Multiple Environmental Signals Determine the Transcriptional Activation of the Mycoparasitism Related Gene Prb1 in Trichoderma atroviride. Mol. Genet. Genom. 2002, 267, 703–712. [Google Scholar] [CrossRef]
  18. Cortés, C.; Gutierrez, A.; Olmedo, V.; Inbar, J.; Chet, I.; Herrera-Estrella, A. The Expression of Genes Involved in Parasitism by Trichoderma harzianum Is Triggered by a Diffusible Factor. Mol. Gen. Genet. 1998, 260, 218–225. [Google Scholar] [CrossRef]
  19. Pons-Hernández, J.L.; Guerrero-Aguilar, B.Z.; González-Chavira, M.M.; González-Pérez, E.; Villalobos-Reyes, S.; Muñoz-Sánchez, C.I.; Pons-Hernández, J.L.; Guerrero-Aguilar, B.Z.; González-Chavira, M.M.; González-Pérez, E.; et al. Phenotypic Variability of Phytophthora capsici Isolates in Guanajuato. Rev. Mex. Cienc. Agrícolas 2020, 11, 1891–1901. [Google Scholar] [CrossRef]
  20. Sevillano-Serrano, J.; Larsen, J.; Rojas-Rojas, F.U.; Vega-Arreguín, J.C. Increasing Virulence and Decreasing Fungicide Sensitivity in Phytophthora capsici after Continuous Metalaxyl-Chlorothalonil Exposure. J. Plant Pathol. 2024. [Google Scholar] [CrossRef]
  21. Velazquez-Robledo, R.; Contreras-Cornejo, H.A.; Macias-Rodriguez, L.; Hernandez-Morales, A.; Aguirre, J.; Casas-Flores, S.; Lopez-Bucio, J.; Herrera-Estrella, A. Role of the 4-Phosphopantetheinyl Transferase of Trichoderma virens in Secondary Metabolism and Induction of Plant Defense Responses. Mol. Plant Microbe Interact. 2011, 24, 1459–1471. [Google Scholar] [CrossRef]
  22. Cummings, M.P. PAUP* (Phylogenetic Analysis Using Parsimony (and Other Methods)). In Dictionary of Bioinformatics and Computational Biology; John Wiley & Sons, Ltd.: Hoboken, NJ, USA, 2014; ISBN 978-0-471-65012-6. [Google Scholar]
  23. Stamatakis, A. RAxML-VI-HPC: Maximum Likelihood-Based Phylogenetic Analyses with Thousands of Taxa and Mixed Models. Bioinformatics 2006, 22, 2688–2690. [Google Scholar] [CrossRef] [PubMed]
  24. Ronquist, F.; Teslenko, M.; van der Mark, P.; Ayres, D.L.; Darling, A.; Höhna, S.; Larget, B.; Liu, L.; Suchard, M.A.; Huelsenbeck, J.P. MrBayes 3.2: Efficient Bayesian Phylogenetic Inference and Model Choice Across a Large Model Space. Syst. Biol. 2012, 61, 539–542. [Google Scholar] [CrossRef]
  25. Samuels, G.J.; Ismaiel, A. Trichoderma evansii and T. lieckfeldtiae: Two New T. hamatum-like Species. Mycologia 2009, 101, 142–156. [Google Scholar] [CrossRef] [PubMed]
  26. Kubicek, C.P.; Herrera-Estrella, A.; Seidl-Seiboth, V.; Martinez, D.A.; Druzhinina, I.S.; Thon, M.; Zeilinger, S.; Casas-Flores, S.; Horwitz, B.A.; Mukherjee, P.K.; et al. Comparative Genome Sequence Analysis Underscores Mycoparasitism as the Ancestral Life Style of Trichoderma. Genome Biol. 2011, 12, R40. [Google Scholar] [CrossRef]
  27. Kullnig, C.; Mach, R.L.; Lorito, M.; Kubicek, C.P. Enzyme Diffusion from Trichoderma atroviride (=T. harzianum P1) to Rhizoctonia solani Is a Prerequisite for Triggering of Trichoderma Ech42 Gene Expression before Mycoparasitic Contact. Appl. Environ. Microbiol. 2000, 66, 2232–2234. [Google Scholar] [CrossRef]
  28. Hoyos-Carvajal, L.; Orduz, S.; Bissett, J. Genetic and Metabolic Biodiversity of Trichoderma from Colombia and Adjacent Neotropic Regions. Fungal Genet. Biol. 2009, 46, 615–631. [Google Scholar] [CrossRef]
  29. Samuels, G.J.; Ismaiel, A.; Bon, M.-C.; De Respinis, S.; Petrini, O. Trichoderma asperellum Sensu Lato Consists of Two Cryptic Species. Mycologia 2010, 102, 944–966. [Google Scholar] [CrossRef]
  30. Druzhinina, I.S.; Kopchinskiy, A.G.; Komoń, M.; Bissett, J.; Szakacs, G.; Kubicek, C.P. An Oligonucleotide Barcode for Species Identification in Trichoderma and Hypocrea. Fungal Genet. Biol. 2005, 42, 813–828. [Google Scholar] [CrossRef]
  31. Holmes, K.A.; Schroers, H.-J.; Thomas, S.E.; Evans, H.C.; Samuels, G.J. Taxonomy and Biocontrol Potential of a New Species of Trichoderma from the Amazon Basin of South America. Mycol. Prog. Progress. 2004, 3, 199–210. [Google Scholar] [CrossRef]
  32. Samuels, G.J.; Dodd, S.L.; Lu, B.-S.; Petrini, O.; Schroers, H.-J.; Druzhinina, I.S. The Trichoderma koningii Aggregate Species. Stud. Mycol. 2006, 56, 67–133. [Google Scholar] [CrossRef]
  33. Rodrigues, A.; Mueller, U.G.; Ishak, H.D.; Bacci, M.; Pagnocca, F.C. Ecology of Microfungal Communities in Gardens of Fungus-Growing Ants (Hymenoptera: Formicidae): A Year-Long Survey of Three Species of Attine Ants in Central Texas. FEMS Microbiol. Ecol. 2011, 78, 244–255. [Google Scholar] [CrossRef] [PubMed]
  34. Jaklitsch, W.M.; Samuels, G.J.; Dodd, S.L.; Lu, B.-S.; Druzhinina, I.S. Hypocrea rufa/Trichoderma viride: A Reassessment, and Description of Five Closely Related Species with and without Warted Conidia. Stud. Mycol. 2006, 56, 135–177. [Google Scholar] [CrossRef] [PubMed]
  35. Li Destri Nicosia, M.G.; Mosca, S.; Mercurio, R.; Schena, L. Dieback of Pinus Nigra Seedlings Caused by a Strain of Trichoderma viride. Plant Dis. 2015, 99, 44–49. [Google Scholar] [CrossRef]
  36. Bissett, J.; Gams, W.; Jaklitsch, W.; Samuels, G.J. Accepted Trichoderma Names in the Year 2015. IMA Fungus 2015, 6, 263–295. [Google Scholar] [CrossRef]
  37. Vu, D.; Groenewald, M.; de Vries, M.; Gehrmann, T.; Stielow, B.; Eberhardt, U.; Al-Hatmi, A.; Groenewald, J.Z.; Cardinali, G.; Houbraken, J.; et al. Large-Scale Generation and Analysis of Filamentous Fungal DNA Barcodes Boosts Coverage for Kingdom Fungi and Reveals Thresholds for Fungal Species and Higher Taxon Delimitation. Stud. Mycol. 2019, 92, 135–154. [Google Scholar] [CrossRef]
  38. Samuels, G.J. Trichoderma: Systematics, the Sexual State, and Ecology. Phytopathology 2006, 96, 195–206. [Google Scholar] [CrossRef]
  39. Druzhinina, I.S.; Kubicek, C.P.; Komoń-Zelazowska, M.; Mulaw, T.B.; Bissett, J. The Trichoderma harzianum Demon: Complex Speciation History Resulting in Coexistence of Hypothetical Biological Species, Recent Agamospecies and Numerous Relict Lineages. BMC Evol. Biol. 2010, 10, 94. [Google Scholar] [CrossRef]
  40. Druzhinina, I.S.; Komoń-Zelazowska, M.; Atanasova, L.; Seidl, V.; Kubicek, C.P. Evolution and Ecophysiology of the Industrial Producer Hypocrea jecorina (Anamorph Trichoderma reesei) and a New Sympatric Agamospecies Related to It. PLoS ONE 2010, 5, e9191. [Google Scholar] [CrossRef]
  41. Degenkolb, T.; Dieckmann, R.; Nielsen, K.F.; Gräfenhan, T.; Theis, C.; Zafari, D.; Chaverri, P.; Ismaiel, A.; Brückner, H.; von Döhren, H.; et al. The Trichoderma brevicompactum Clade: A Separate Lineage with New Species, New Peptaibiotics, and Mycotoxins. Mycol. Prog. 2008, 7, 177–219. [Google Scholar] [CrossRef]
  42. Druzhinina, I.S.; Chenthamara, K.; Zhang, J.; Atanasova, L.; Yang, D.; Miao, Y.; Rahimi, M.J.; Grujic, M.; Cai, F.; Pourmehdi, S.; et al. Massive Lateral Transfer of Genes Encoding Plant Cell Wall-Degrading Enzymes to the Mycoparasitic Fungus Trichoderma from Its Plant-Associated Hosts. PLoS Genet. 2018, 14, e1007322. [Google Scholar] [CrossRef]
  43. Esquivel-Naranjo, E.U.; Herrera-Estrella, A. Enhanced Responsiveness and Sensitivity to Blue Light by Blr-2 Overexpression in Trichoderma atroviride. Microbiology 2007, 153, 3909–3922. [Google Scholar] [CrossRef]
  44. Kibbe, W.A. OligoCalc: An Online Oligonucleotide Properties Calculator. Nucleic Acids Res. 2007, 35, W43–W46. [Google Scholar] [CrossRef] [PubMed]
  45. Calcáneo-Hernández, G.; Landeros-Jaime, F.; Cervantes-Chávez, J.A.; Mendoza-Mendoza, A.; Esquivel-Naranjo, E.U. Osmotic Stress Responses, Cell Wall Integrity, and Conidiation Are Regulated by a Histidine Kinase Sensor in Trichoderma atroviride. J Fungi 2023, 9, 939. [Google Scholar] [CrossRef] [PubMed]
  46. Van Den, T.; Biermann, C.J.; Marlett, J.A. Simple Sugars, Oligosaccharides and Starch Concentrations in Raw and Cooked Sweet Potato. J. Agric. Food Chem. 1986, 34, 421–425. [Google Scholar] [CrossRef]
  47. Hughes, B.P. The Amino-Acid Composition of Potato Protein and of Cooked Potato. Br. J. Nutr. 1958, 12, 188–195. [Google Scholar] [CrossRef]
  48. Ilmén, M.; Saloheimo, A.; Onnela, M.L.; Penttilä, M.E. Regulation of Cellulase Gene Expression in the Filamentous Fungus Trichoderma reesei. Appl. Environ. Microbiol. 1997, 63, 1298–1306. [Google Scholar] [CrossRef]
  49. Marcello, C.M.; Steindorff, A.S.; da Silva, S.P.; do Nascimento Silva, R.; Mendes Bataus, L.A.; Ulhoa, C.J. Expression Analysis of the Exo-β-1,3-Glucanase from the Mycoparasitic Fungus Trichoderma asperellum. Microbiol. Res. 2010, 165, 75–81. [Google Scholar] [CrossRef]
  50. Nitsche, B.M.; Jørgensen, T.R.; Akeroyd, M.; Meyer, V.; Ram, A.F. The Carbon Starvation Response of Aspergillus niger during Submerged Cultivation: Insights from the Transcriptome and Secretome. BMC Genom. 2012, 13, 380. [Google Scholar] [CrossRef]
  51. Ait-Lahsen, H.; Soler, A.; Rey, M.; de la Cruz, J.; Monte, E.; Llobell, A. An Antifungal Exo-α-1,3-Glucanase (AGN13.1) from the Biocontrol Fungus Trichoderma harzianum. Appl. Environ. Microbiol. 2001, 67, 5833–5839. [Google Scholar] [CrossRef]
  52. Geremia, R.A.; Goldman, G.H.; Jacobs, D.; Ardiles, W.; Vila, S.B.; Van Montagu, M.; Herrera-Estrella, A. Molecular Characterization of the Proteinase-Encoding Gene, Prb1, Related to Mycoparasitism by Trichoderma harzianum. Mol. Microbiol. 1993, 8, 603–613. [Google Scholar] [CrossRef]
  53. Oszust, K.; Cybulska, J.; Frąc, M. How Do Trichoderma Genus Fungi Win a Nutritional Competition Battle against Soft Fruit Pathogens? A Report on Niche Overlap Nutritional Potentiates. Int. J. Mol. Sci. 2020, 21, 4235. [Google Scholar] [CrossRef] [PubMed]
  54. Segreto, R.; Bazafkan, H.; Millinger, J.; Schenk, M.; Atanasova, L.; Doppler, M.; Büschl, C.; Boeckstaens, M.; Soto Diaz, S.; Schreiner, U.; et al. The TOR Kinase Pathway Is Relevant for Nitrogen Signaling and Antagonism of the Mycoparasite Trichoderma atroviride. PLoS ONE 2021, 16, e0262180. [Google Scholar] [CrossRef]
  55. Mélida, H.; Sandoval-Sierra, J.V.; Diéguez-Uribeondo, J.; Bulone, V. Analyses of Extracellular Carbohydrates in Oomycetes Unveil the Existence of Three Different Cell Wall Types. Eukaryot. Cell 2013, 12, 194–203. [Google Scholar] [CrossRef]
  56. Meijer, H.J.G.; Mancuso, F.M.; Espadas, G.; Seidl, M.F.; Chiva, C.; Govers, F.; Sabidó, E. Profiling the Secretome and Extracellular Proteome of the Potato Late Blight Pathogen Phytophthora infestans. Mol. Cell Proteom. 2014, 13, 2101–2113. [Google Scholar] [CrossRef]
  57. Bonnet, P.; Bourdon, E.; Ponchet, M.; Blein, J.-P.; Ricci, P. Acquired Resistance Triggered by Elicitins in Tobacco and Other Plants. Eur. J. Plant Pathol. 1996, 102, 181–192. [Google Scholar] [CrossRef]
  58. Wang, Y.; Ren, M.; Wang, Y.; Wang, L.; Liu, H.; Shi, M.; Zhong, Y. Constitutive Overexpression of Cellobiohydrolase 2 in Trichoderma reesei Reveals Its Ability to Initiate Cellulose Degradation. Eng. Microbiol. 2023, 3, 100059. [Google Scholar] [CrossRef]
  59. Ramada, M.H.S.; Steindorff, A.S.; Bloch, C.; Ulhoa, C.J. Secretome Analysis of the Mycoparasitic Fungus Trichoderma harzianum ALL 42 Cultivated in Different Media Supplemented with Fusarium solani Cell Wall or Glucose. Proteomics 2016, 16, 477–490. [Google Scholar] [CrossRef] [PubMed]
  60. Hinkel, L.; Ospina-Giraldo, M.D. Structural Characterization of a Putative Chitin Synthase Gene in Phytophthora spp. and Analysis of Its Transcriptional Activity during Pathogenesis on Potato and Soybean Plants. Curr. Genet. 2017, 63, 909–921. [Google Scholar] [CrossRef]
  61. Cheng, W.; Lin, M.; Qiu, M.; Kong, L.; Xu, Y.; Li, Y.; Wang, Y.; Ye, W.; Dong, S.; He, S.; et al. Chitin Synthase Is Involved in Vegetative Growth, Asexual Reproduction and Pathogenesis of Phytophthora capsici and Phytophthora sojae. Environ. Microbiol. 2019, 21, 4537–4547. [Google Scholar] [CrossRef]
  62. Bellincampi, D.; Cervone, F.; Lionetti, V. Plant Cell Wall Dynamics and Wall-Related Susceptibility in Plant–Pathogen Interactions. Front. Plant Sci. 2014, 5. [Google Scholar] [CrossRef]
  63. Neves Monteiro, V.; Stecca Steindorff, A.; Dos Reis Almeida, F.B.; Cardoso Lopes, F.A.; Ulhoa, C.J.; Roberto Félix, C.; Silva, R.N. Trichoderma reesei Mycoparasitism against Pythium ultimum Is Coordinated by G-Alpha Protein GNA1 Signaling. J. Microb. Biochem. Technol. 2015, 7, 1–7. [Google Scholar] [CrossRef]
  64. La Spada, F.; Stracquadanio, C.; Riolo, M.; Pane, A.; Cacciola, S.O. Trichoderma Counteracts the Challenge of Phytophthora nicotianae Infections on Tomato by Modulating Plant Defense Mechanisms and the Expression of Crinkler, Necrosis-Inducing Phytophthora Protein 1, and Cellulose-Binding Elicitor Lectin Pathogenic Effectors. Front. Plant Sci. 2020, 11, 583539. [Google Scholar] [CrossRef]
  65. LoBuglio, K.F.; Pitt, J.I.; Taylor, J.W. Phylogenetic Analysis of Two Ribosomal Dna Regions Indicates Multiple Independent Losses of a Sexual Talaromyces State Among Asexual Penicillium Species in Subgenus Biverticillium. Mycologia 1993, 85, 592–604. [Google Scholar] [CrossRef]
  66. Nagy, V.; Seidl, V.; Szakacs, G.; Komoń-Zelazowska, M.; Kubicek, C.P.; Druzhinina, I.S. Application of DNA Bar Codes for Screening of Industrially Important Fungi: The Haplotype of Trichoderma harzianum Sensu Stricto Indicates Superior Chitinase Formation. Appl. Environ. Microbiol. 2007, 73, 7048–7058. [Google Scholar] [CrossRef]
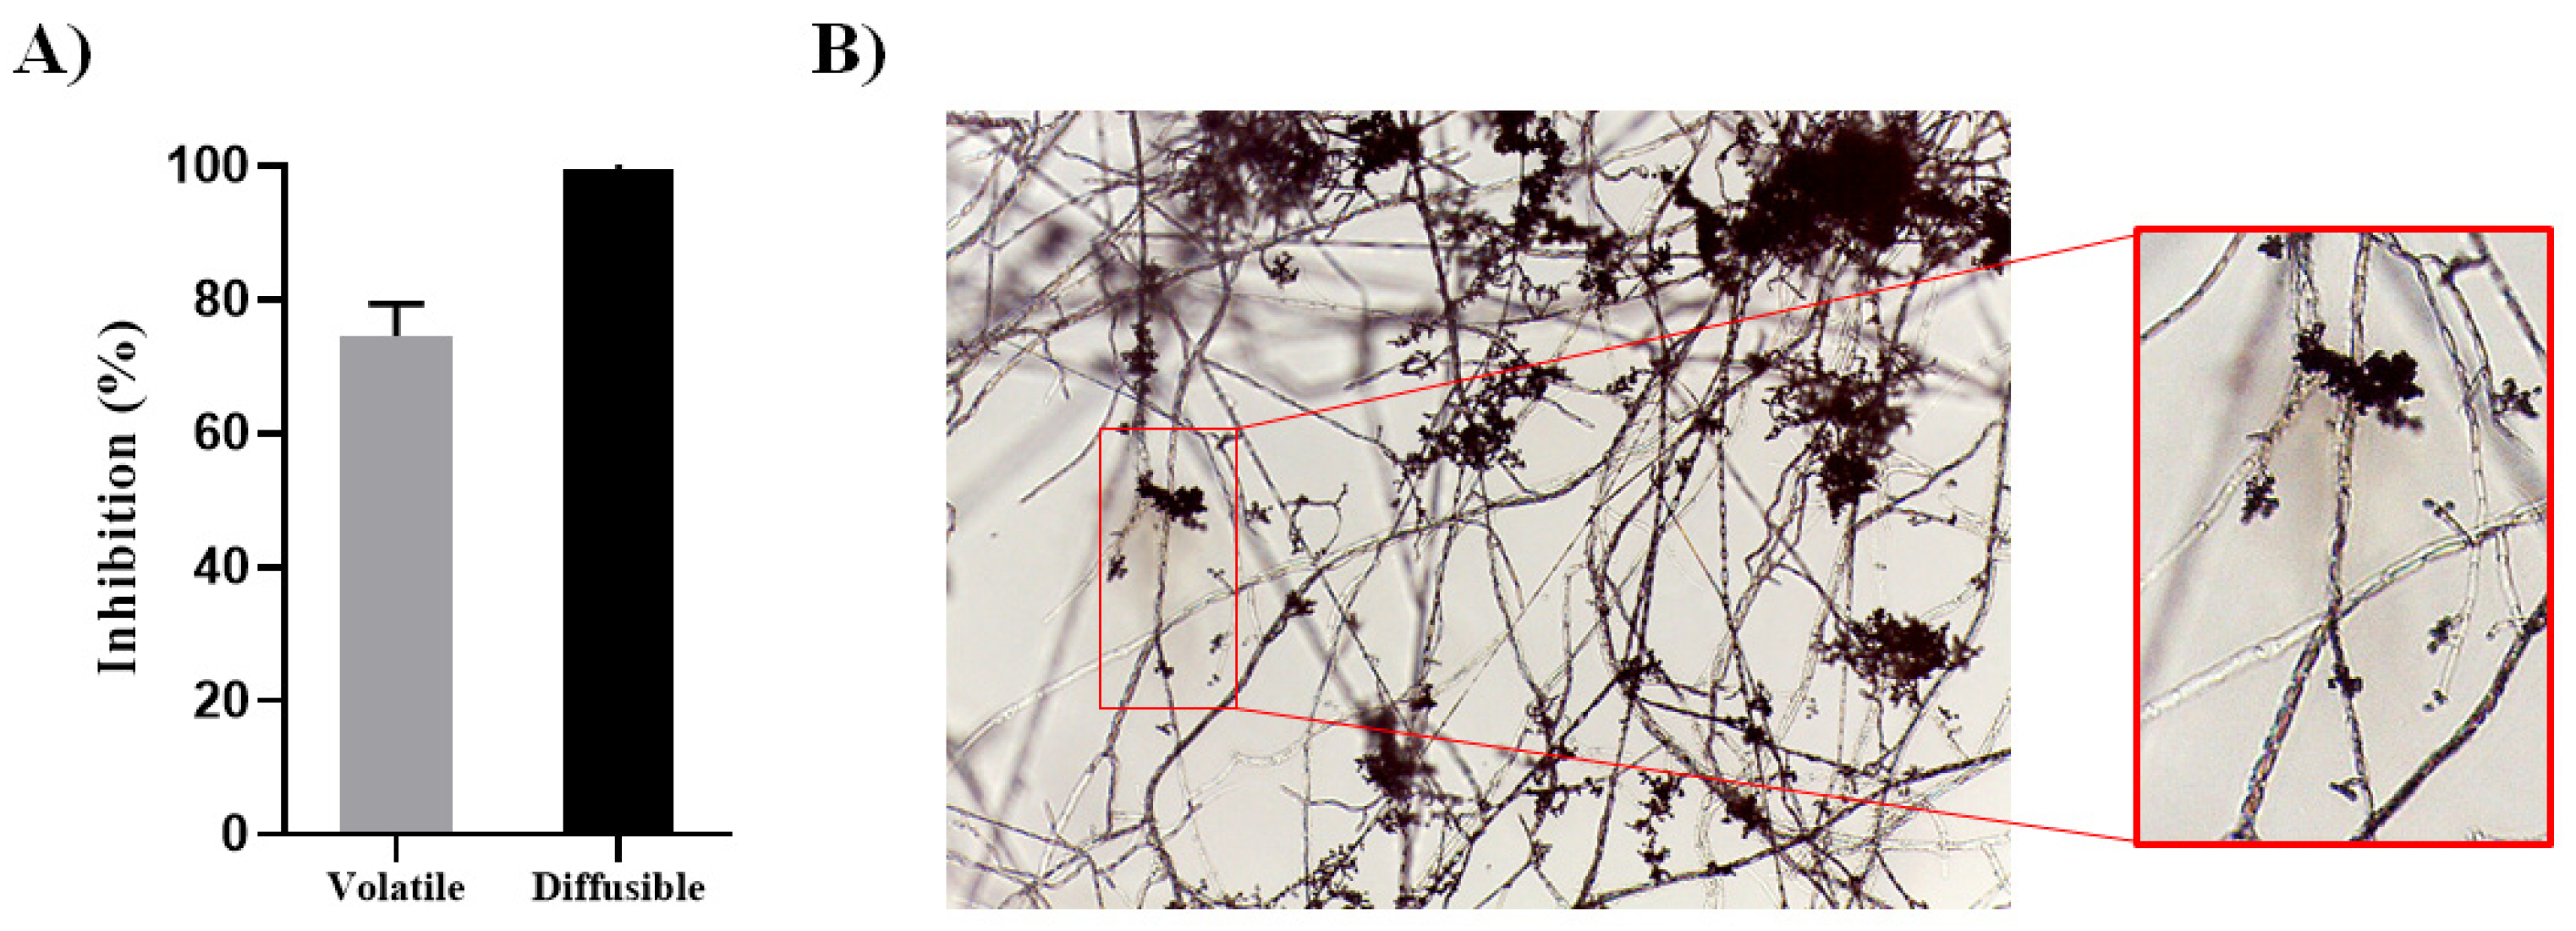
Figure 1. In vitro antagonism against P. capsici D3. (A) Growth inhibition by diffusible and volatile metabolites. Bars represent the average of at least three treatments. Line upper bars indicate the standard deviation (SD). (B) Mycoparasitic behavior of NI-1 against P. capsici D3 (10×). Hyaline hyphae of NI-1 coiled around D3 hyphae. Coiling is indicated by the red square.
Jof 10 00671 g001
Figure 2. Phylogenetic analysis of NI-1. Phylogram based on the combined ITS and TEF-1α sequences. Support values higher than 70% are shown at the nodes. Values are associated with BMP, BML, and PP, respectively. The accession numbers of the reference sequences are shown in Table 1. NI-1 is shown in red. The scale bar represents nucleotide substitutions per base.
Jof 10 00671 g002
Figure 3. Influence of carbon source on the transcript levels of parasitism-related genes during confrontation with NI-1 and D3. Dual culture assays were performed on PDA (-●-) or Vogel’s minimal media supplemented with dextrin (-▼-), cellulose (-●-), glucose (-▲-), glycerol (-◆-), and sucrose (-▅-). RNA was extracted from mycelia after contact in a dual culture assay. The color line identifies carbon sources. Symbols represent average signals, and lanes are SD. n = 3.
Jof 10 00671 g003
Figure 4. Influence of nitrogen source on the transcript levels of parasitism-related genes during confrontation with NI-1 and D3. Dual culture assays were performed on PDA (-●-) or Vogel’s minimal media supplemented with ammonium nitrate (-▅-), sodium nitrate (-▲-), and L-arginine (-▼-). RNA was extracted from mycelia after contact in a dual culture assay. Symbols represent the average signal, and bars are SD. n = 3.
Jof 10 00671 g004
Figure 5. The GRM expression during the confrontation of NI-1 against three different phytopathogens. (A) Gene expression profile during mycoparasitic interaction in dual cultures: before contact (2, 1, 0.5 cm), physical contact (0 cm), and overgrowth (OG). Interactions of T. atroviride against P. capsici (T-Pc), B. cinerea (T-Bc), and R. solani (T-Rs) were analyzed using as a control TrichodermaTrichoderma (T-T). (B) Relative gene expression. The signal area detected before contact (2, 1, 0.5 cm), physical contact (C), and overgrowth (OG) in (A) was quantified, and gene expression was graphed for T-Pc (blue bars), T-Bc (gray bars), and T-Rs (red bars) relative to the control T-T, which was adjusted to the unit (green). The transcript levels of gpd were used to normalize the template amounts for each signal. Two-way ANOVA and multiple comparisons were performed using Dunnett’s test. Asterisks above the bar represent significant differences with respect to control relative expression p < 0.05 (*), p < 0.001 (**), and p < 0.0001 (***). Bars represent average transcript levels, and the lines indicate SD. n = 3.
Jof 10 00671 g005
Table 1. GenBank accession numbers for reference sequences used in phylogenetic analysis.
SpeciesStrainSourceCountryITSTef-1αReference
T. pubescensGJS 01-207BarkCameroonEU856280EU856304[25]
T. atrovirideNI-1SoilMexicoPQ162586PQ335171This work
T. atrovirideIMI 206040SoilSwedenAF278795300828 1[26]
T. atrovirideP1SoilUKOQ360634EF581849[27]
T. atrovirideDAOM 231423SoilMexicoEU280111EU280002[28]
T. asperelloidesGJS 04-217Theobroma cacaoPeruDQ381957DQ381958[29]
T. asperelloidesGJS 99-6WoodUSADQ315464GU198240[29]
T. asperellumTUB-F755SoilMexicoAY857217AY857273[30]
T. asperellumCBS 433.97SclerotiaUSAAY380912AY376058[31]
T. asperellumGJS 90-7SoilVietnamGU198317EU338333[29]
T. yunnanenseCBS 121219SoilChinaGU198302GU198243[29]
T. gamsiiGJS 05-111Ricinus comunisItalyDQ841730DQ841722[32]
T. koningiopsisLESF212Cyphomyrmex wheeleri nestUSAHQ608031KT278985[33]
T. koningiopsisGJS 93-20BranchCubaDQ313140DQ284966[32]
T. virideGJS 05-104PeatItalyDQ841741DQ841727[34]
T. trixiaeCBS 189.79WoodItalyKJ482546KJ482552[35]
T. ovalisporumDAOM 229859SoilPanamaEU280118EU280003[28]
T. erinaceumGJS 02-103WoodSri LankaKR873100KR873098[36]
T. tomentosumCBS 349.93ND 2CanadaMH862417AF401024[37]
T. velutinumDAOM 230014SoilNepalDQ083010AY937446[38]
T. harzianumDAOM 231646SoilSouth AfricaAY605723AY605766[39]
T. harzianumDAOM 229907SoilUSAAY605734AY605777[39]
T. reeseiGJS 97-178Theobroma sp.French GuianaAJ004964GQ354348[40]
T. saturnisporumCBS 886.72Triticum sp.South AfricaX93974AY937414[38]
T. longibrachiatumDAOM 166989SoilCanadaEU330961EU338335[41]
1 Accession number is from protein ID and sequence obtained from the JGI database. (https://mycocosm.jgi.doe.gov/cgi-bin/dispGeneModel?db=Triat2&tid=300828 accessed on 8 August 2024). 2 ND: not determined by the author.
Disclaimer/Publisher’s Note: The statements, opinions and data contained in all publications are solely those of the individual author(s) and contributor(s) and not of MDPI and/or the editor(s). MDPI and/or the editor(s) disclaim responsibility for any injury to people or property resulting from any ideas, methods, instructions or products referred to in the content.