
The Influence of Blood Transfusion Indexed to Patient Blood Volume on 5-Year Mortality After Coronary Artery Bypass Grafting—An EuroSCORE II Adjusted Spline Regression Analysis
 , , , ,
Abstract
1. Introduction
2. Patients and Methods
2.1. Ethical Statement
2.2. Data Collection Instruments
2.3. Definition of Primary Outcome Measure and Model Parameters
2.4. Statistical Analysis
3. Results
3.1. Patients’ Characteristics
3.2. Intraoperative Data
3.3. Clinical Outcomes and Safety Endpoints
3.4. Spline Regression
4. Discussion
5. Limitations
6. Conclusions
Author Contributions
Funding
Institutional Review Board Statement
Informed Consent Statement
Data Availability Statement
Acknowledgments
Conflicts of Interest
Abbreviations
| PRBCs | packed red blood cells |
| PT | platelet transfusion |
| FFP | fresh frozen plasma |
References
- Suleman, M.; Samad, K.; Ullah, H. Frequency of Blood Transfusion in Elective Coronary Artery Bypass Grafting and Its Correlation with Acute Kidney Injury at a Tertiary Care Hospital in a Lower Middle-Income Country. Cureus 2021, 13, e15184. [Google Scholar] [CrossRef]
- Benk, J.; Berger, T.; Gottardi, R.; Walter, T.; Kondov, S.; Rylski, B.; Czerny, M.; Kreibich, M. Perioperative Mass Transfusion Affects In-Hospital but Not Follow-Up Survival in Patients with Acute Type A Aortic Dissection. Medicina 2023, 59, 1825. [Google Scholar] [CrossRef] [PubMed]
- Byrne, R.A.; Fremes, S.; Capodanno, D.; Czerny, M.; Doenst, T.; Emberson, J.R.; Falk, V.; Gaudino, M.; McMurray, J.J.V.; Mehran, R.; et al. 2022 Joint ESC/EACTS review of the 2018 guideline recommendations on the revascularization of left main coronary artery disease in patients at low surgical risk and anatomy suitable for PCI or CABG. Eur. Heart J. 2023, 44, 4310–4320. [Google Scholar] [CrossRef]
- Sultan, I.; Bianco, V.; Brown, J.A.; Kilic, A.; Habertheuer, A.; Aranda-Michel, E.; Navid, F.; Humar, R.; Wang, Y.; Gleason, T.G. Long-term Impact of Perioperative Red Blood Cell Transfusion on Patients Undergoing Cardiac Surgery. Ann. Thorac. Surg. 2021, 112, 546–554. [Google Scholar] [CrossRef] [PubMed]
- Lee, S.H.; Kim, J.E.; Lee, J.H.; Jung, J.S.; Son, H.S.; Kim, H.-J. Perioperative Red Blood Cell Transfusion and Long-Term Mortality in Coronary Artery Bypass Grafting: On-Pump and Off-Pump Analysis. J. Clin. Med. 2025, 14, 2662. [Google Scholar] [CrossRef] [PubMed]
- Koch, M.; Antolovic, D.; Reissfelder, C.; Rahbari, N.N.; Holoch, J.; Michalski, I.; Sweiti, H.; Ulrich, A.; Büchler, M.W.; Weitz, J. Leucocyte-Depleted Blood Transfusion is an Independent Predictor of Surgical Morbidity in Patients Undergoing Elective Colon Cancer Surgery—A Single-Center Analysis of 531 Patients. Ann. Surg. Oncol. 2010, 18, 1404–1411. [Google Scholar] [CrossRef]
- Liao, R.; Liu, J.; Zhang, W.; Zheng, H.; Zhu, Z.; Sun, H.; Yu, Z.; Jia, H.; Sun, Y.; Qin, L.; et al. Individualized red-cell transfusion strategy for non-cardiac surgery in adults: A randomized controlled trial. Chin. Med. J. 2023, 136, 2857–2866. [Google Scholar] [CrossRef] [PubMed]
- Rupprecht, L.; Schopka, S.; Keyser, A.; Lunz, D.; Sossalla, S.; Hilker, M.; Schmid, C. 25 Years’ Experience with Redo Operations in Cardiac Surgery—Third-Time Sternotomy Procedures. Thorac. Cardiovasc. Surg. 2020, 70, 377–383. [Google Scholar] [CrossRef]
- da Cunha, C.B.C.; Lima, T.A.; Ferraz, D.L.M.; Silva, I.T.C.; Santiago, M.K.D.; Sena, G.R.; Monteiro, V.S.; Andrade, L.B. Predicting the Need for Blood Transfusions in Cardiac Surgery: A Comparison between Machine Learning Algorithms and Established Risk Scores in the Brazilian Population. Rev. Bras. Cir. Cardiovasc. 2024, 39, e20230212. [Google Scholar] [CrossRef]
- Casselman, F.P.; Lance, M.D.; Ahmed, A.; Ascari, A.; Blanco-Morillo, J.; Bolliger, D.; Eid, M.; Erdoes, G.; Haumann, R.G.; Jeppsson, A.; et al. 2024 EACTS/EACTAIC Guidelines on patient blood management in adult cardiac surgery in collaboration with EBCP. J. Cardiothorac. Vasc. Anesthesia 2024, 40, ivae170. [Google Scholar] [CrossRef]
- Lin, V.S.; Sun, E.; Yau, S.; Abeyakoon, C.; Seamer, G.; Bhopal, S.; Tucker, H.; Doree, C.; Brunskill, S.J.; McQuilten, Z.K.; et al. Definitions of massive transfusion in adults with critical bleeding: A systematic review. Crit. Care 2023, 27, 265. [Google Scholar] [CrossRef] [PubMed]
- Lee, M.-H.; Gisnarian, C.J.; Shann, K.G. Improved Estimation of Total Blood Volume Can Provide a Reliable Prediction of Dilutional Hematocrit and Oxygen Delivery during Cardiopulmonary Bypass. J. Extracorpor. Technol. 2019, 51, 67–72. [Google Scholar] [CrossRef] [PubMed]
- Kreibich, M.; Rylski, B.; Bavaria, J.E.; Branchetti, E.; Dohle, D.; Moeller, P.; Vallabhajosyula, P.; Szeto, W.Y.; Desai, N.D. Outcome After Operation for Aortic Dissection Type A in Morbidly Obese Patients. Ann. Thorac. Surg. 2018, 106, 491–497. [Google Scholar] [CrossRef] [PubMed]
- Gibson, J.G.; Evans, W.A. Clinical Studies of the Blood Volume. II. The Relation of Plasma and Total Blood Volume to Venous Pressure, Blood Velocity Rate, Physical Measurements, Age and Sex in Ninety Normal Humans. J. Clin. Investig. 1937, 16, 317–328. [Google Scholar] [CrossRef]
- Feldschuh, J.; Enson, Y. Prediction of the normal blood volume. Relation of blood volume to body habitus. Circulation 1977, 56, 605–612. [Google Scholar] [CrossRef] [PubMed]
- Shi, J.; Meng, M.; Sa, R.; Yu, L.; Lu, Y.; Gao, B. Blood transfusion is correlated with elevated adult all-cause mortality and cardiovascular mortality in the United States: NHANES 1999 to 2018 population-based matched propensity score study. Clinics (Sao Paulo) 2024, 79, 100379. [Google Scholar] [CrossRef]
- Xiao, H.; Song, W.; Ai, H.; Zhang, J.; Lu, J.; Zhang, D.; Zhou, Z.; Xu, P. Correlation between mortality and blood transfusion in patients with major surgery initially admitted to intensive care unit: A retrospective analysis. BMC Anesthesiol. 2023, 23, 298. [Google Scholar] [CrossRef]
- Yang, J.-C.; Sun, Y.; Xu, C.-X.; Dang, Q.-L.; Li, L.; Xu, Y.-G.; Song, Y.-J.; Yan, H. Correlation between red blood cell transfusion volume and mortality in patients with massive blood transfusion: A large multicenter retrospective study. Exp. Ther. Med. 2014, 9, 137–142. [Google Scholar] [CrossRef] [PubMed]
- Lemaire, A.; Soto, C.; Salgueiro, L.; Ikegami, H.; Russo, M.J.; Lee, L.Y. The impact of age on outcomes of coronary artery bypass grafting. J. Cardiothorac. Surg. 2020, 15, 158. [Google Scholar] [CrossRef] [PubMed]
- Papp, J.; Toth, A.; Sandor, B.; Kiss, R.; Rabai, M.; Kenyeres, P.; Juricskay, I.; Kesmarky, G.; Szabados, S.; Toth, K. The influence of on-pump and off-pump coronary artery bypass grafting on hemorheological parameters. Clin. Hemorheol. Microcirc. 2011, 49, 331–346. [Google Scholar] [CrossRef]
- Bartoszko, J.; Karkouti, K. Managing the coagulopathy associated with cardiopulmonary bypass. J. Thromb. Haemost. 2021, 19, 617–632. [Google Scholar] [CrossRef]
- Vamvakas, E.C.; Blajchman, M.A. Transfusion-related mortality: The ongoing risks of allogeneic blood transfusion and the available strategies for their prevention. Blood 2009, 113, 3406–3417. [Google Scholar] [CrossRef] [PubMed]
- Perel, P.; Clayton, T.; Altman, D.G.; Croft, P.; Douglas, I.; Hemingway, H.; Hingorani, A.; Morley, K.I.; Riley, R.; Timmis, A.; et al. Red Blood Cell Transfusion and Mortality in Trauma Patients: Risk-Stratified Analysis of an Observational Study. PLoS Med. 2014, 11, e1001664. [Google Scholar] [CrossRef] [PubMed]
- Seeber, P.; Döbel, K.; Isbister, J.P.; Murray, K.; Shander, A.; Trentino, K.M.; Lucas, M. Mortality and morbidity in non-transfusable and transfusable patients: A systematic review and meta-analysis. Transfusion 2021, 62, 685–697. [Google Scholar] [CrossRef] [PubMed]
- Du, Y.; Xia, Y.; You, C.; Wang, Y.; Duan, D.; Xu, W.; Xu, Q.; Zhang, H.; Han, C. Impact of red blood cell transfusion in massive burn: A multicenter cohort study. Sci. Rep. 2025, 15, 6196. [Google Scholar] [CrossRef]
- Aslam, R.; Speck, E.R.; Kim, M.; Freedman, J.; Semple, J.W. Transfusion-related immunomodulation by platelets is dependent on their expression of MHC Class I molecules and is independent of white cells. Transfusion 2008, 48, 1778–1786. [Google Scholar] [CrossRef]
- Ahmadi, J.; Hosseini, E.; Kargar, F.; Maghsudlu, M.; Ghasemzadeh, M. Platelet transfusion enhances pro-aggregatory status shortly after coronary artery bypass grafting (CABG) while modulating platelet pro-inflammatory state 1-week post-surgery. J. Cell. Mol. Med. 2024, 28, e18573. [Google Scholar] [CrossRef] [PubMed]
- Hinton, J.V.; Xing, Z.; Fletcher, C.; Perry, L.A.; Karamesinis, A.; Shi, J.; Penny-Dimri, J.C.; Ramson, D.; Coulson, T.G.; Segal, R.; et al. Association of perioperative transfusion of fresh frozen plasma and outcomes after cardiac surgery. Acta. Anaesthesiol. Scand. 2024, 68, 753–763. [Google Scholar] [CrossRef]
- Yin, Z.; Yu, B.; Liu, W.; Lan, K. Blood transfusion and mortality in myocardial infarction: An updated meta-analysis. Oncotarget 2017, 8, 102254–102262. [Google Scholar] [CrossRef]
- Shishehbor, M.H.; Madhwal, S.; Rajagopal, V.; Hsu, A.; Kelly, P.; Gurm, H.S.; Kapadia, S.R.; Lauer, M.S.; Topol, E.J. Impact of blood transfusion on short- and long-term mortality in patients with ST-segment elevation myocardial infarction. JACC Cardiovasc. Interv. 2009, 2, 46–53. [Google Scholar] [CrossRef]
- Lenet, T.; Baker, L.; Park, L.; Vered, M.B.; Zahrai, A.B.; Shorr, R.M.; Davis, A.M.; McIsaac, D.I.M.; Tinmouth, A.M.; Fergusson, D.A.; et al. A Systematic Review and Meta-analysis of Randomized Controlled Trials Comparing Intraoperative Red Blood Cell Transfusion Strategies. Ann. Surg. 2022, 275, 456–466. [Google Scholar] [CrossRef] [PubMed]
- Johnson, D.J.; Scott, A.V.; Barodka, V.M.; Park, S.; Wasey, J.O.; Ness, P.M.; Gniadek, T.; Frank, S.M. Morbidity and Mortality after High-dose Transfusion. Anesthesiology 2016, 124, 387–395. [Google Scholar] [CrossRef]
- Campwala, I.; Dorken-Gallastegi, A.; Spinella, P.C.; Brown, J.B.; Leeper, C.M. Whole blood to total transfusion volume ratio in injured children: A national database analysis. J. Trauma Acute Care Surg. 2025, 98, 287–294. [Google Scholar] [CrossRef] [PubMed]
- Jacobs, J.W.; Diaz, M.; Salazar, D.E.A.; Tang, A.; Stephens, L.D.; Booth, G.S.; Lehmann, C.U.; Adkins, B.D. United States blood pricing: A cross-sectional analysis of charges and reimbursement at 200 US hospitals. Am. J. Hematol. 2023, 98, E179–E182. [Google Scholar] [CrossRef]
- İndelen, C.; Kızmaz, Y.U.; Kar, A.; Shander, A.; Kırali, K. The cost of one unit blood transfusion components and cost-effectiveness analysis results of transfusion improvement program. Turk. J. Thorac. Cardiovasc. Surg. 2021, 29, 150–157. [Google Scholar] [CrossRef]
- Cázares-Benito, M.; Cázares-Tamez, R.; Pérez-Chávez, F.; Díaz-Olachea, C.; Ramos-García, A.; Díaz-Chuc, E.; Lee-González, B. Impact on costs related to inadequate indication of blood transfusion. Med. Univ. 2016, 18, 148–152. [Google Scholar] [CrossRef]
- Durand-Zaleski, I.; Ducrocq, G.; Mimouni, M.; Frenkiel, J.; Avendano-Solá, C.; Gonzalez-Juanatey, J.R.; Ferrari, E.; Lemesle, G.; Puymirat, E.; Berard, L.; et al. Economic evaluation of restrictive vs. liberal transfusion strategy following acute myocardial infarction (REALITY): Trial-based cost-effectiveness and cost-utility analyses. Eur. Hear. J. Qual. Care Clin. Outcomes 2022, 9, 194–202. [Google Scholar] [CrossRef] [PubMed]
- Czempik, P.F.; Herzyk, J.; Wilczek, D.; Rogalska, A. Cost Reduction in Blood Transfusions After Implementation of Decision Protocol Based on Hemoglobin and Anemia Symptoms: A Pre-Post Analysis. Med. Sci. Monit. 2024, 30, e945854. [Google Scholar] [CrossRef]
- Li, Y.; Cheang, I.; Zhang, Z.; Zuo, X.; Cao, Q.; Li, J. Prognostic Association Between Perioperative Red Blood Cell Transfusion and Postoperative Cardiac Surgery Outcomes. Front. Cardiovasc. Med. 2021, 8, 730492. [Google Scholar] [CrossRef] [PubMed]
- Kim, H.J.; Shin, H.J.; Lee, S.W.; Heo, S.; Lee, S.H.; Kim, J.E.; Son, H.S.; Jung, J.S. Improvement of Transfusion Practice in Cardiothoracic Surgery Through Implementing a Patient Blood Management Program. J. Chest Surg. 2024, 57, 390–398. [Google Scholar] [CrossRef] [PubMed]

| Extent of Perioperative Transfusion | ||||
|---|---|---|---|---|
| Characteristic | Overall, N = 3376 1 | Massive Transfusion, N = 137 1 | No Massive Transfusion, N = 3239 1 | p-Value 2 |
| Sex (female) | 522 (15%) | 40 (29%) | 482 (15%) | <0.001 |
| Age (years) | 68.00 (62.00, 74.00) | 71.00 (66.00, 76.00) | 68.00 (61.00, 74.00) | <0.001 |
| BMI (kg/m2) | 27.40 (25.20, 30.10) | 27.60 (24.60, 30.15) | 27.40 (25.20, 30.10) | 0.8 |
| Diabetes Mellitus | 1141 (34%) | 58 (42%) | 1083 (33%) | 0.032 |
| Dyslipidemia | 2696 (80%) | 114 (83%) | 2582 (80%) | 0.4 |
| History of hypertension | 2816 (84%) | 129 (94%) | 2687 (83%) | <0.001 |
| History of arrhythmia | 283 (8.4%) | 23 (17%) | 260 (8.0%) | <0.001 |
| History of smoking | 1148 (37%) | 51 (40%) | 1097 (37%) | 0.4 |
| Peripheral artery disease | 436 (15%) | 26 (24%) | 410 (14%) | 0.007 |
| History of COPD | 339 (10%) | 20 (15%) | 319 (9.9%) | 0.072 |
| History of myocardial infarction | 1132 (34%) | 77 (56%) | 1055 (33%) | <0.001 |
| History of stroke | 201 (6.0%) | 19 (14%) | 182 (5.6%) | <0.001 |
| History of malignancy | 60 (1.9%) | 1 (0.8%) | 59 (2.0%) | 0.5 |
| NYHA | <0.001 | |||
| Class 1 | 339 (11%) | 7 (5.4%) | 332 (11%) | |
| Class 2 | 1437 (47%) | 38 (29%) | 1399 (48%) | |
| Class 3 | 1188 (39%) | 74 (57%) | 1114 (38%) | |
| Class 4 | 79 (2.6%) | 11 (8.5%) | 68 (2.3%) | |
| Chronic renal failure | 91 (2.8%) | 12 (8.8%) | 79 (2.5%) | <0.001 |
| EuroSCORE II | 1.44 (0.96, 2.28) | 2.53 (1.62, 5.16) | 1.41 (0.95, 2.22) | <0.001 |
| Preoperative creatinine (mg/dL) | 0.95 (0.80, 1.10) | 1.00 (0.84, 1.40) | 0.95 (0.80, 1.10) | 0.017 |
| Preoperative hemoglobin (g/L) | 14.30 (13.20, 15.20) | 13.60 (12.20, 14.90) | 14.40 (13.30, 15.20) | <0.001 |
| Preoperative thrombocyte count (Tsd.) | 221.00 (187.00, 262.00) | 219.00 (187.00, 264.00) | 221.00 (187.00, 262.00) | >0.9 |
| Preoperative CK-MB (IU/L) | 14.00 (11.00, 19.00) | 14.00 (11.00, 21.00) | 14.00 (11.00, 19.00) | 0.5 |
| Preoperative hs-cTnT (ng/L) | 0.01 (0.01, 0.04) | 0.02 (0.01, 0.14) | 0.01 (0.01, 0.04) | <0.001 |
| Preoperative LVEF < 30% | 86 (2.7%) | 11 (8.7%) | 75 (2.5%) | <0.001 |
| Extent of Perioperative Transfusions | ||||
|---|---|---|---|---|
| Characteristic | Overall, N = 3376 1 | Massive Transfusion, N = 137 1 | No Massive Transfusion, N = 3239 1 | p-Value 2 |
| No. of bypasses | 3.12 (0.88) | 3.02 (0.95) | 3.13 (0.87) | 0.3 |
| Complete revascularization | 2754 (91%) | 113 (88%) | 2641 (91%) | 0.2 |
| No. of affected vessels | 0.001 | |||
| 1 vessel | 25 (1%) | 6 (4%) | 19 (1%) | |
| 2 vessels | 277 (8%) | 8 (6%) | 269 (8%) | |
| 3 vessels | 3060 (91%) | 121 (90%) | 2939 (91%) | |
| Time of cardiopulmonary bypass (min) | 90 (74, 107) | 103 (87, 134) | 89 (74, 106) | <0.001 |
| Time of aortic cross-clamping (min) | 69 (55, 83) | 75 (60, 92) | 68 (55, 83) | 0.003 |
| Total time of surgery (min) | 220 (190, 250) | 240 (210, 290) | 220 (190, 250) | <0.001 |
| Off-Pump cases | 304 (9.0%) | 10 (7.3%) | 294 (9.1%) | 0.5 |
| Extent of Perioperative Transfusions | ||||
|---|---|---|---|---|
| Characteristic | Overall, N = 3376 1 | Massive Transfusion, N = 137 1 | No Massive Transfusion, N = 3239 1 | p-Value 2 |
| Follow-up (years) | 6.63 (4.06, 10.62) | 4.87 (2.93, 7.77) | 6.73 (4.11, 10.73) | <0.001 |
| 3-year mortality | 241 (7.1%) | 41 (30%) | 200 (6.2%) | <0.001 |
| 5-year mortality | 381 (11%) | 58 (42%) | 323 (10.0%) | <0.001 |
| Coronary reinterventions after 5 years | 271 (8.1%) | 29 (22%) | 242 (7.6%) | <0.001 |
| Coronary reinterventions after 3 years | 225 (6.8%) | 26 (20%) | 199 (6.2%) | <0.001 |
| Coronary reinterventions after 30 days | 92 (2.8%) | 21 (16%) | 71 (2.2%) | <0.001 |
| Surgical coronary reintervention after 5 years | 6 (0.2%) | 2 (1.5%) | 4 (0.1%) | 0.022 |
| Surgical coronary reintervention after 3 years | 6 (0.2%) | 2 (1.5%) | 4 (0.1%) | 0.022 |
| Surgical coronary reintervention after 30 days | 5 (0.1%) | 2 (1.5%) | 3 (<0.1%) | 0.015 |
| Percutaneous coronary reintervention after 5 years | 271 (8.1%) | 29 (22%) | 242 (7.5%) | <0.001 |
| Percutaneous coronary reintervention after 3 years | 225 (6.7%) | 26 (20%) | 199 (6.2%) | <0.001 |
| Percutaneous coronary reintervention after 30 days | 92 (2.7%) | 21 (16%) | 71 (2.2%) | <0.001 |
| Postoperative coronary angiography | 602 (18%) | 39 (28%) | 563 (17%) | <0.001 |
| Length of hospital stay (days) | 14.00 (11.00, 17.00) | 29.00 (18.00, 39.00) | 14.00 (11.00, 17.00) | <0.001 |
| Length of ICU stay (days) | 0.96 (0.87, 1.87) | 7.13 (2.89, 17.60) | 0.95 (0.87, 1.79) | <0.001 |
| No. of erythrocyte transfusions | 2.64 (4.43) | 18.03 (11.32) | 1.99 (2.16) | <0.001 |
| No. of thrombocyte transfusions | 0.33 (1.15) | 3.00 (4.09) | 0.21 (0.60) | <0.001 |
| No. of FFP units | 1.90 (4.01) | 12.21 (12.51) | 1.46 (2.34) | <0.001 |
| % of calculated blood volume transfused | 13.40 (0.00, 34.34) | 134.17 (96.69, 210.28) | 12.01 (0.00, 30.93) | <0.001 |
| % of calculated blood volume transfused by packed red blood cells | 8.66 (0.00, 18.96) | 74.78 (56.81, 104.85) | 7.67 (0.00, 17.27) | <0.001 |
| % of calculated blood volume transfused by platelet transfusion | 0.00 (0.00, 0.00) | 8.19 (0.00, 16.79) | 0.00 (0.00, 0.00) | <0.001 |
| % of calculated blood volume transfused by fresh frozen plasma | 0.00 (0.00, 17.77) | 49.98 (27.31, 93.92) | 0.00 (0.00, 16.46) | <0.001 |
| Postoperative permanent pacemaker | 49 (1.5%) | 4 (2.9%) | 45 (1.4%) | 0.13 |
| Postoperative dialysis | 100 (3.0%) | 45 (33%) | 55 (1.7%) | <0.001 |
| Postoperative stroke | 67 (2.0%) | 13 (9.6%) | 54 (1.7%) | <0.001 |
| Postoperative atrial fibrillation | 639 (19%) | 41 (30%) | 598 (19%) | <0.001 |
| Postoperative LVEF < 30% | 60 (2.0%) | 6 (5.8%) | 54 (1.8%) | 0.015 |
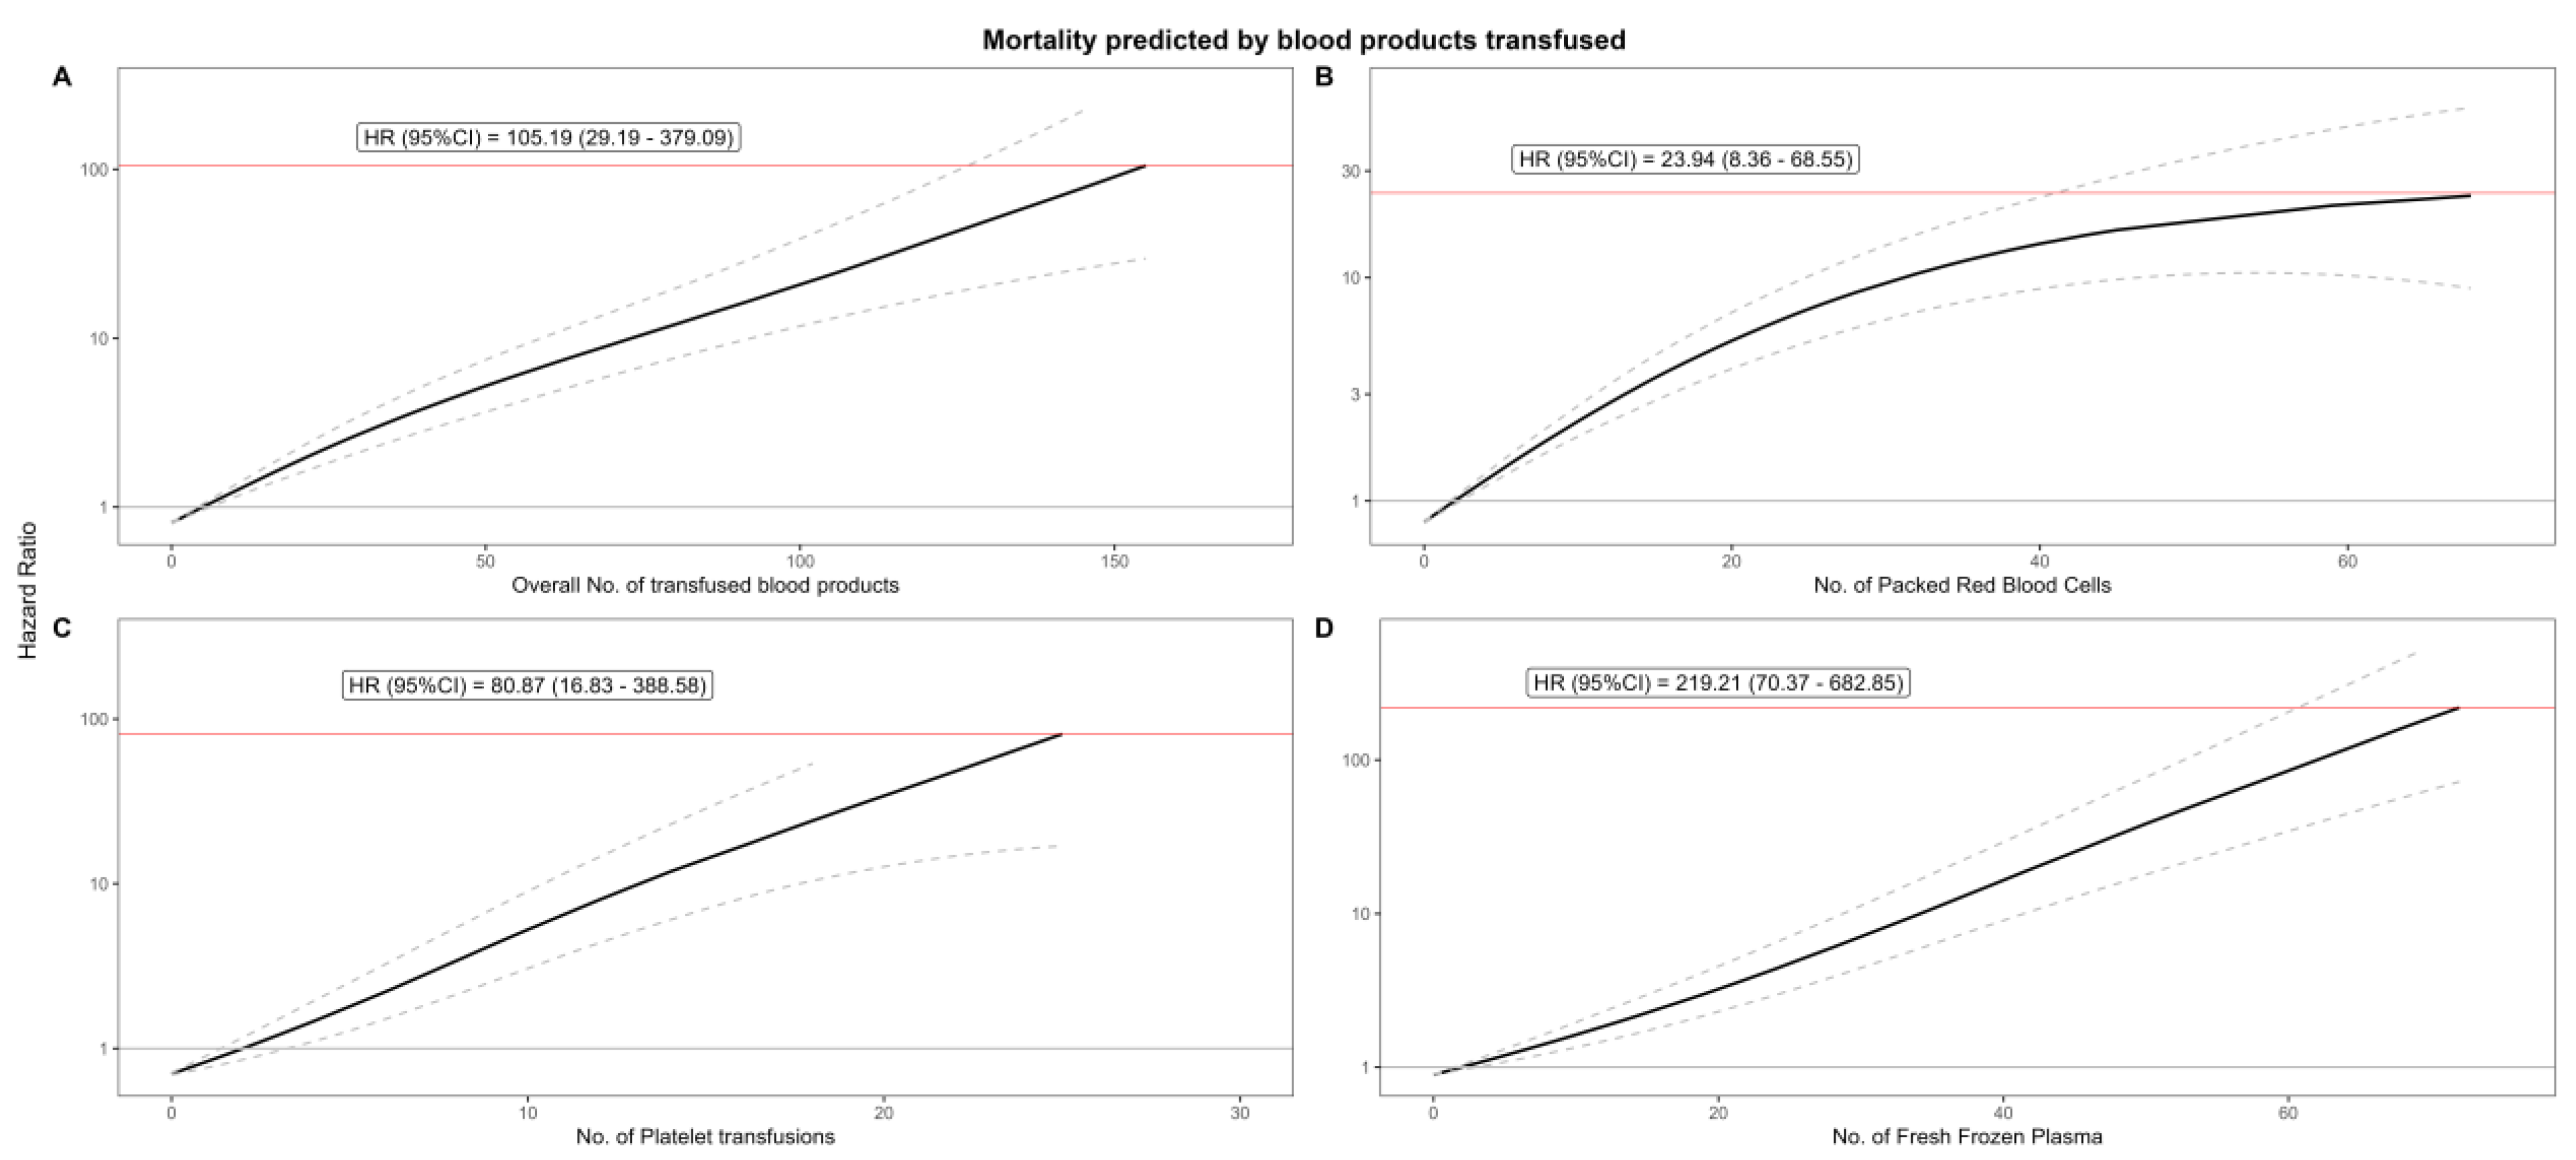
| Qn | No. of Units | Hazard Ratio | Lower CI | Upper CI | p-Value |
|---|---|---|---|---|---|
| Overall | |||||
| Q1 | 14 | 1.462131 | 1.305324 | 1.637774 | <0.001 |
| Q2 | 30 | 2.711864 | 2.116761 | 3.474271 | <0.001 |
| Q3 | 50 | 5.208721 | 3.659172 | 7.414458 | <0.001 |
| Q4 | 155 | 105.1939 | 29.1904 | 379.0892 | <0.001 |
| Packed Red Blood Cells | |||||
| Q1 | 9 | 2.062345 | 1.78387 | 2.384292 | <0.001 |
| Q2 | 19 | 4.855953 | 3.676097 | 6.414487 | <0.001 |
| Q3 | 32 | 10.41509 | 6.997874 | 15.50102 | <0.001 |
| Q4 | 71 | 23.94493 | 8.364491 | 68.54688 | <0.001 |
| Platelets | |||||
| Q1 | 2 | 1 | 0.859157 | 1.163932 | 1 |
| Q2 | 6 | 2.209499 | 1.506778 | 3.23995 | <0.001 |
| Q3 | 10 | 5.263469 | 3.061322 | 9.049721 | <0.001 |
| Q4 | 25 | 80.87303 | 16.83177 | 388.5774 | <0.001 |
| Fresh Frozen Plasma | |||||
| Q1 | 7 | 1.347946 | 1.182089 | 1.537074 | <0.001 |
| Q2 | 16 | 2.422458 | 1.819668 | 3.224931 | <0.001 |
| Q3 | 30 | 7.06773 | 4.435473 | 11.26211 | <0.001 |
| Q4 | 72 | 219.213 | 70.37322 | 682.8498 | <0.001 |
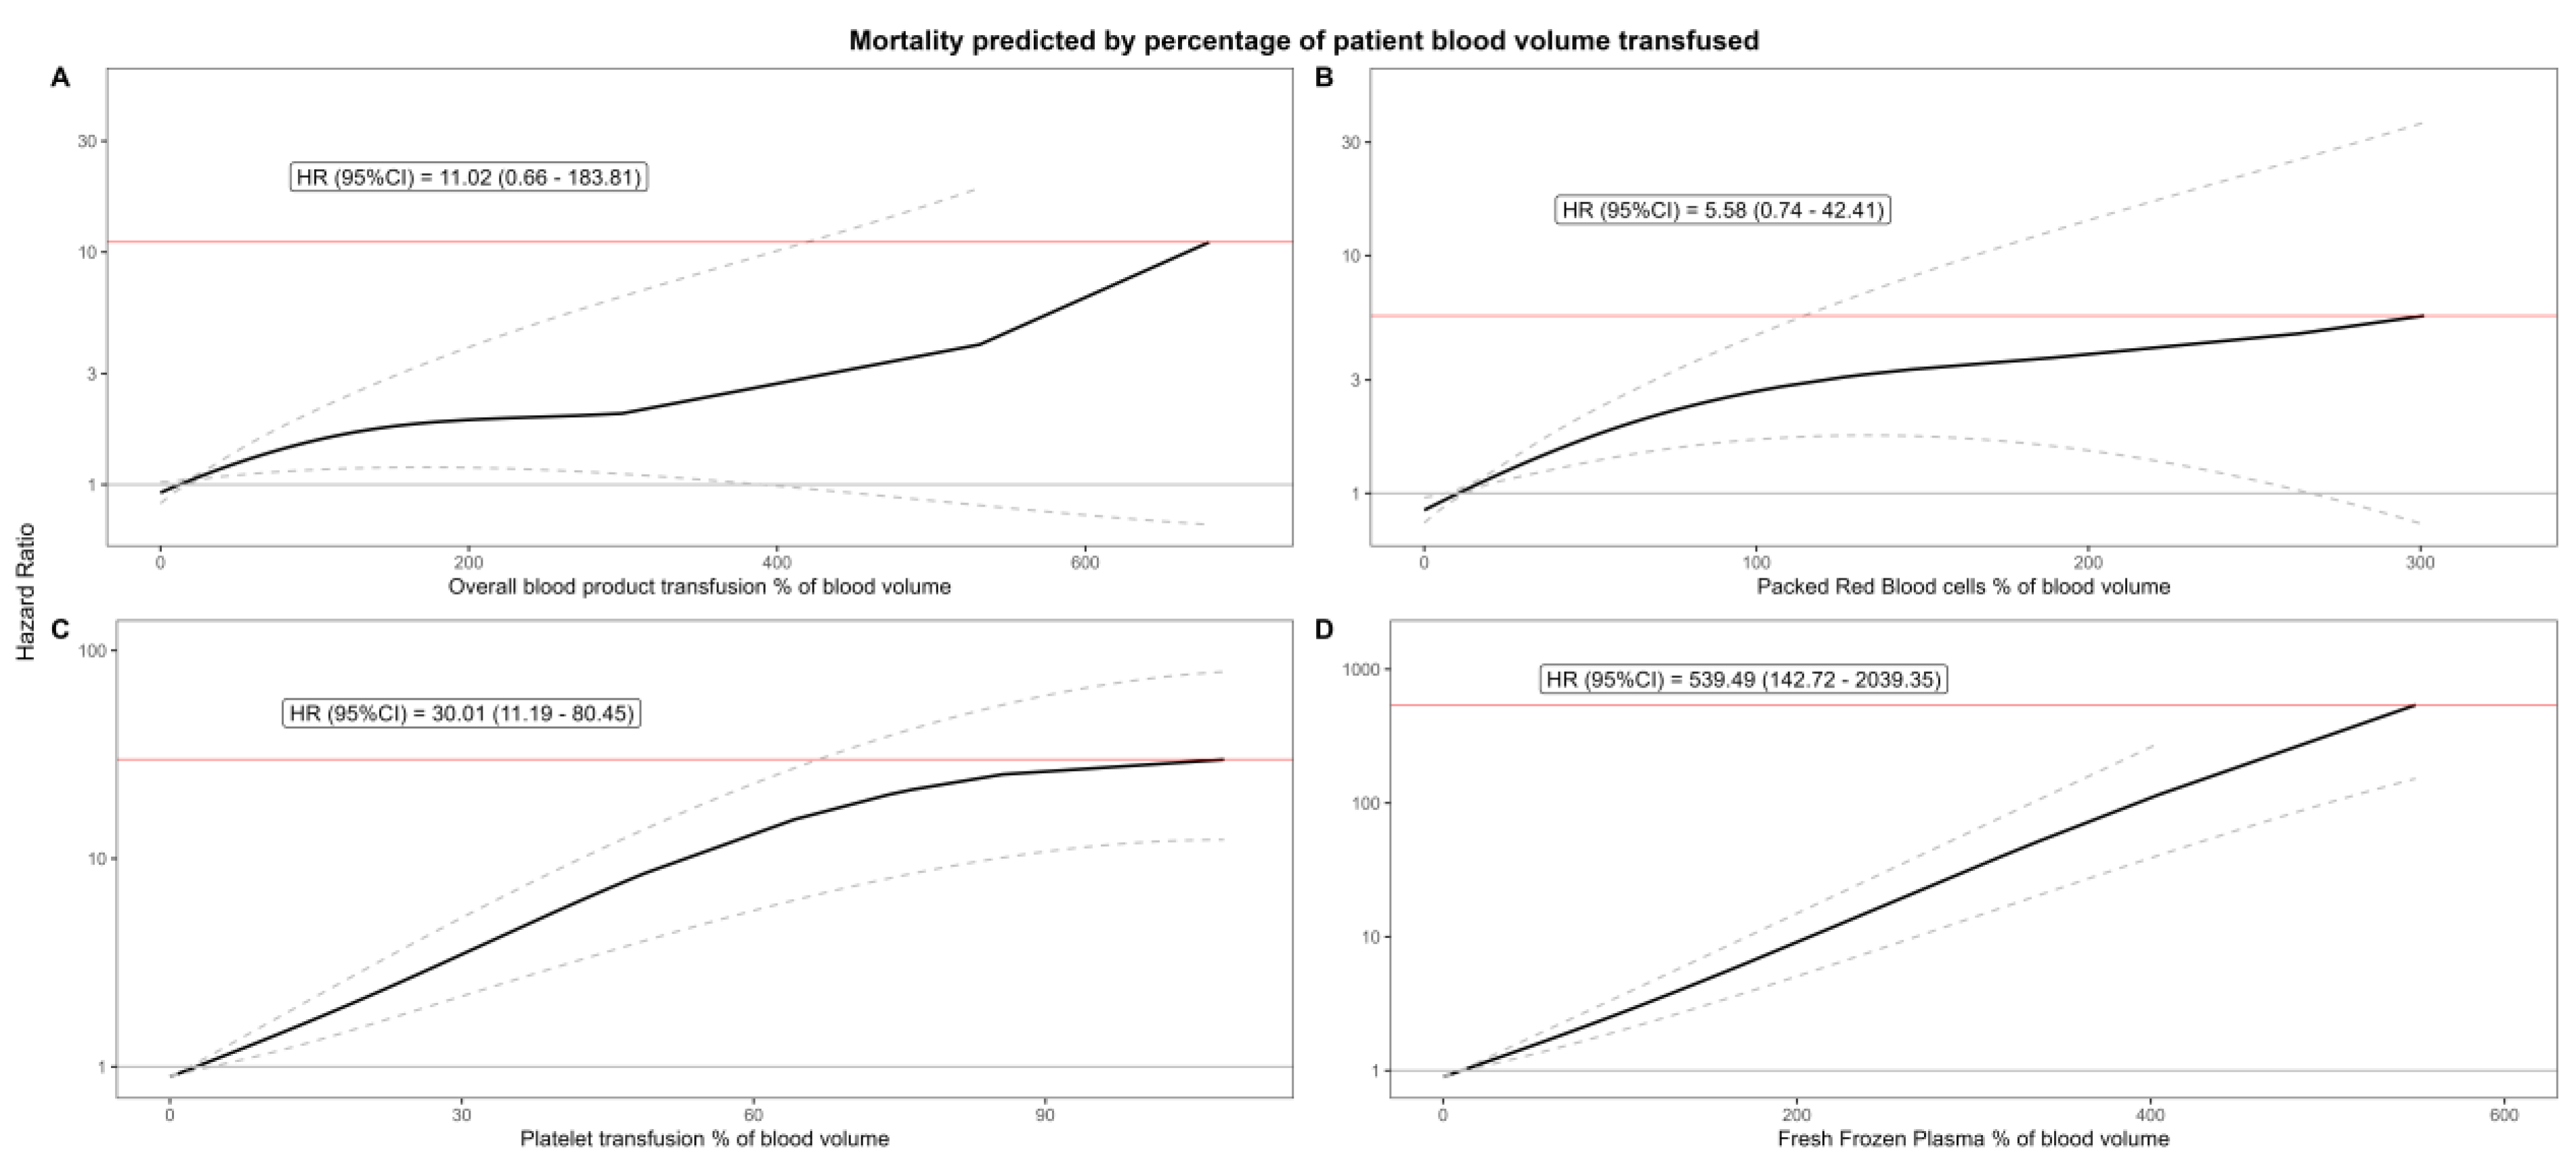
| % of Total Blood Volume | Hazard Ratio | Lower CI | Upper CI | p-Value | |
| % Overall | |||||
| Q1 | 17.02213 | 1.029111 | 1.004066 | 1.054781 | 0.022 |
| Q2 | 32.35479 | 1.126894 | 1.066384 | 1.190837 | <0.001 |
| Q3 | 55.26984 | 1.274282 | 1.105927 | 1.468267 | <0.001 |
| Q4 | 680.2105 | 11.01697 | 0.660317 | 183.8111 | 0.094 |
| % Packed Red Blood Cells | |||||
| Q1 | 11.84874 | 1.02585 | 1.000567 | 1.051771 | 0.045 |
| Q2 | 21.58163 | 1.187205 | 1.1099 | 1.269894 | <0.001 |
| Q3 | 38.07136 | 1.491357 | 1.253226 | 1.774736 | <0.001 |
| Q4 | 301.0827 | 5.584695 | 0.735416 | 42.40976 | 0.096 |
| % Platelets | |||||
| Q1 | 4.900938 | 1.097342 | 1.016071 | 1.185115 | 0.017 |
| Q2 | 7.89916 | 1.246535 | 1.093389 | 1.421132 | <0.001 |
| Q3 | 13.28434 | 1.576469 | 1.266585 | 1.962171 | <0.001 |
| Q4 | 110.0703 | 30.01043 | 11.19416 | 80.45498 | <0.001 |
| % Fresh Frozen Plasma | |||||
| Q1 | 16.87161 | 1.072355 | 1.038509 | 1.107305 | <0.001 |
| Q2 | 27.80924 | 1.204566 | 1.119126 | 1.29653 | <0.001 |
| Q3 | 46.15955 | 1.467765 | 1.278395 | 1.685186 | <0.001 |
| Q4 | 549.667 | 539.4914 | 142.7177 | 2039.347 | <0.001 |
Disclaimer/Publisher’s Note: The statements, opinions and data contained in all publications are solely those of the individual author(s) and contributor(s) and not of MDPI and/or the editor(s). MDPI and/or the editor(s) disclaim responsibility for any injury to people or property resulting from any ideas, methods, instructions or products referred to in the content. |
© 2025 by the authors. Licensee MDPI, Basel, Switzerland. This article is an open access article distributed under the terms and conditions of the Creative Commons Attribution (CC BY) license (https://creativecommons.org/licenses/by/4.0/).
Share and Cite
Kletzer, J.; Kreibich, M.; Czerny, M.; Berger, T.; Fagu, A.; Micek, L.; Franke, U.; Eschenhagen, M.; Hartikainen, T.S.; Wild, M.; et al. The Influence of Blood Transfusion Indexed to Patient Blood Volume on 5-Year Mortality After Coronary Artery Bypass Grafting—An EuroSCORE II Adjusted Spline Regression Analysis. J. Cardiovasc. Dev. Dis. 2025, 12, 287. https://doi.org/10.3390/jcdd12080287
Kletzer J, Kreibich M, Czerny M, Berger T, Fagu A, Micek L, Franke U, Eschenhagen M, Hartikainen TS, Wild M, et al. The Influence of Blood Transfusion Indexed to Patient Blood Volume on 5-Year Mortality After Coronary Artery Bypass Grafting—An EuroSCORE II Adjusted Spline Regression Analysis. Journal of Cardiovascular Development and Disease. 2025; 12(8):287. https://doi.org/10.3390/jcdd12080287
Chicago/Turabian StyleKletzer, Joseph, Maximilian Kreibich, Martin Czerny, Tim Berger, Albi Fagu, Laurin Micek, Ulrich Franke, Matthias Eschenhagen, Tau S. Hartikainen, Mirjam Wild, and et al. 2025. "The Influence of Blood Transfusion Indexed to Patient Blood Volume on 5-Year Mortality After Coronary Artery Bypass Grafting—An EuroSCORE II Adjusted Spline Regression Analysis" Journal of Cardiovascular Development and Disease 12, no. 8: 287. https://doi.org/10.3390/jcdd12080287
APA StyleKletzer, J., Kreibich, M., Czerny, M., Berger, T., Fagu, A., Micek, L., Franke, U., Eschenhagen, M., Hartikainen, T. S., Wild, M., & Bockelmann, D. (2025). The Influence of Blood Transfusion Indexed to Patient Blood Volume on 5-Year Mortality After Coronary Artery Bypass Grafting—An EuroSCORE II Adjusted Spline Regression Analysis. Journal of Cardiovascular Development and Disease, 12(8), 287. https://doi.org/10.3390/jcdd12080287