
Reliability and Time Course of Postexercise Hypotension during Exercise Training among Adults with Hypertension
 , , , ,
Abstract
1. Introduction
2. Materials and Methods
2.1. Participants
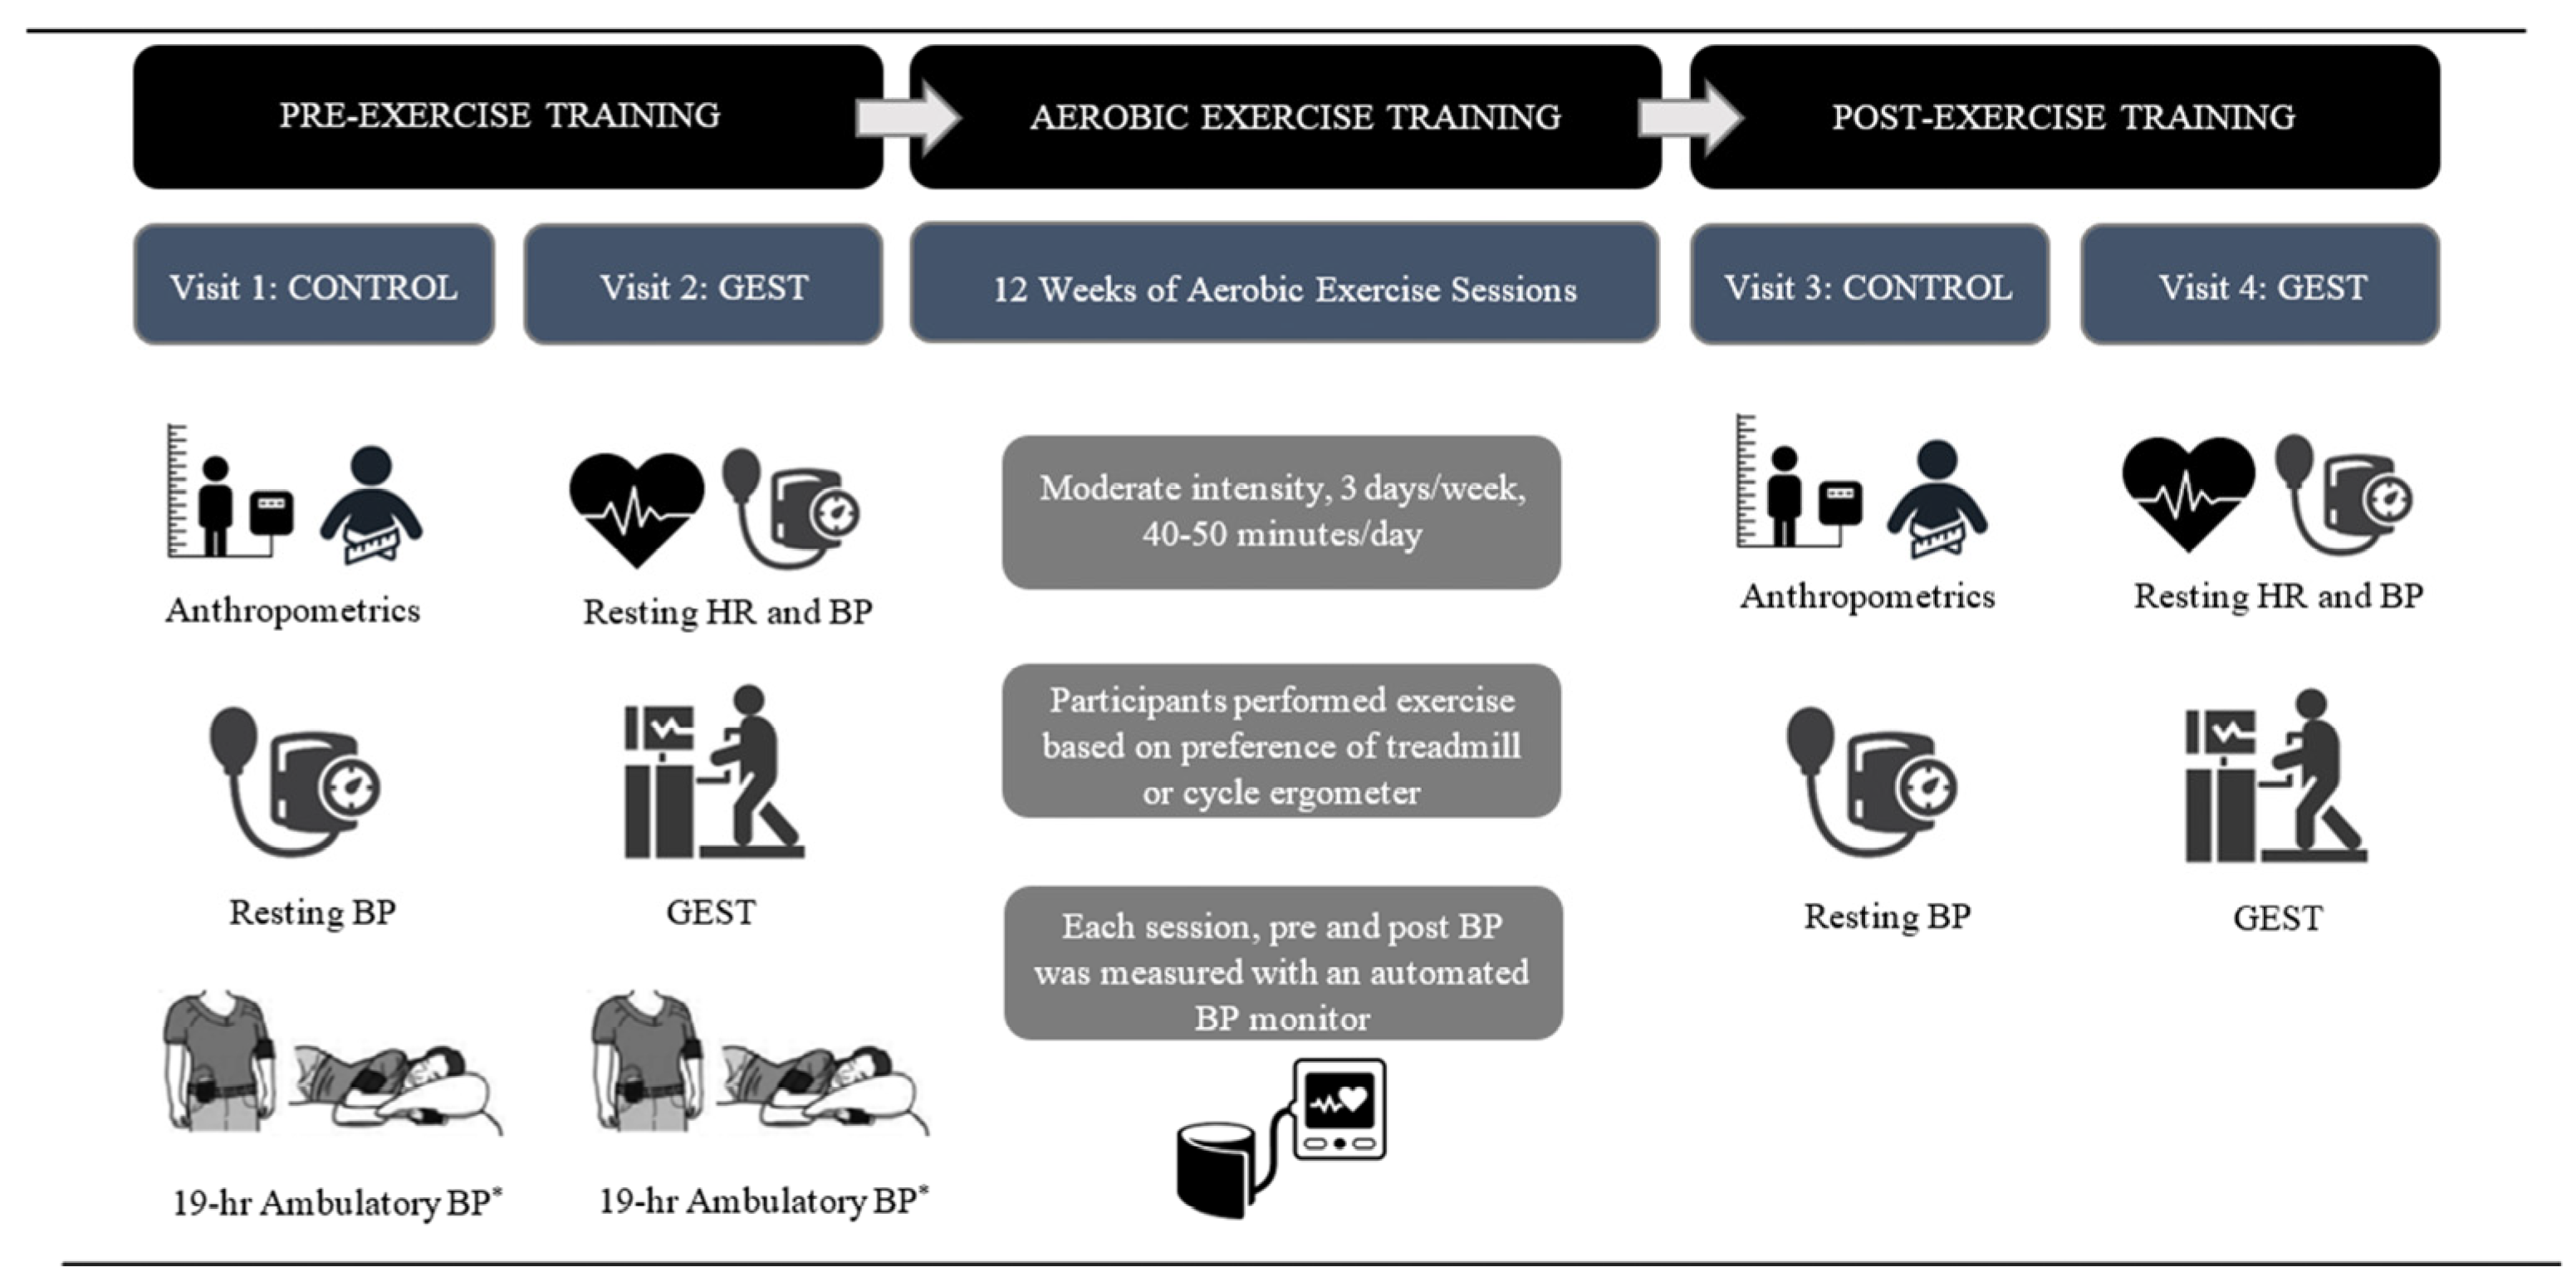
2.2. Study Overview
2.3. Visit 1 and 2: Control Visit and Graded Exercise Stress Test Visit
2.3.1. Control
2.3.2. Maximal Graded Exercise Stress Test
2.4. Exercise Training and Self-Monitoring of Exercise
2.5. Visits 3 and 4: Post-exercise Training Control and GEST
2.6. Measurement Protocols
2.6.1. Body Composition
2.6.2. Ambulatory Blood Pressure
2.6.3. Heart Rate and the Intensity of Exercise
2.6.4. Self-Monitoring of the Frequency, Intensity, Time, and Type of Exercise
2.7. Statistical Analyses
2.7.1. Reliability Statistical Analysis
2.7.2. The Post Hoc Power Analysis
2.7.3. The Magnitude of PEH during Exercise Training Statistical Analysis
3. Results
3.1. Participant Characteristics Pre-Exercise Training
3.2. Exercise Training Program
3.3. Participant Characteristics Post- versus Pre-Exercise Training
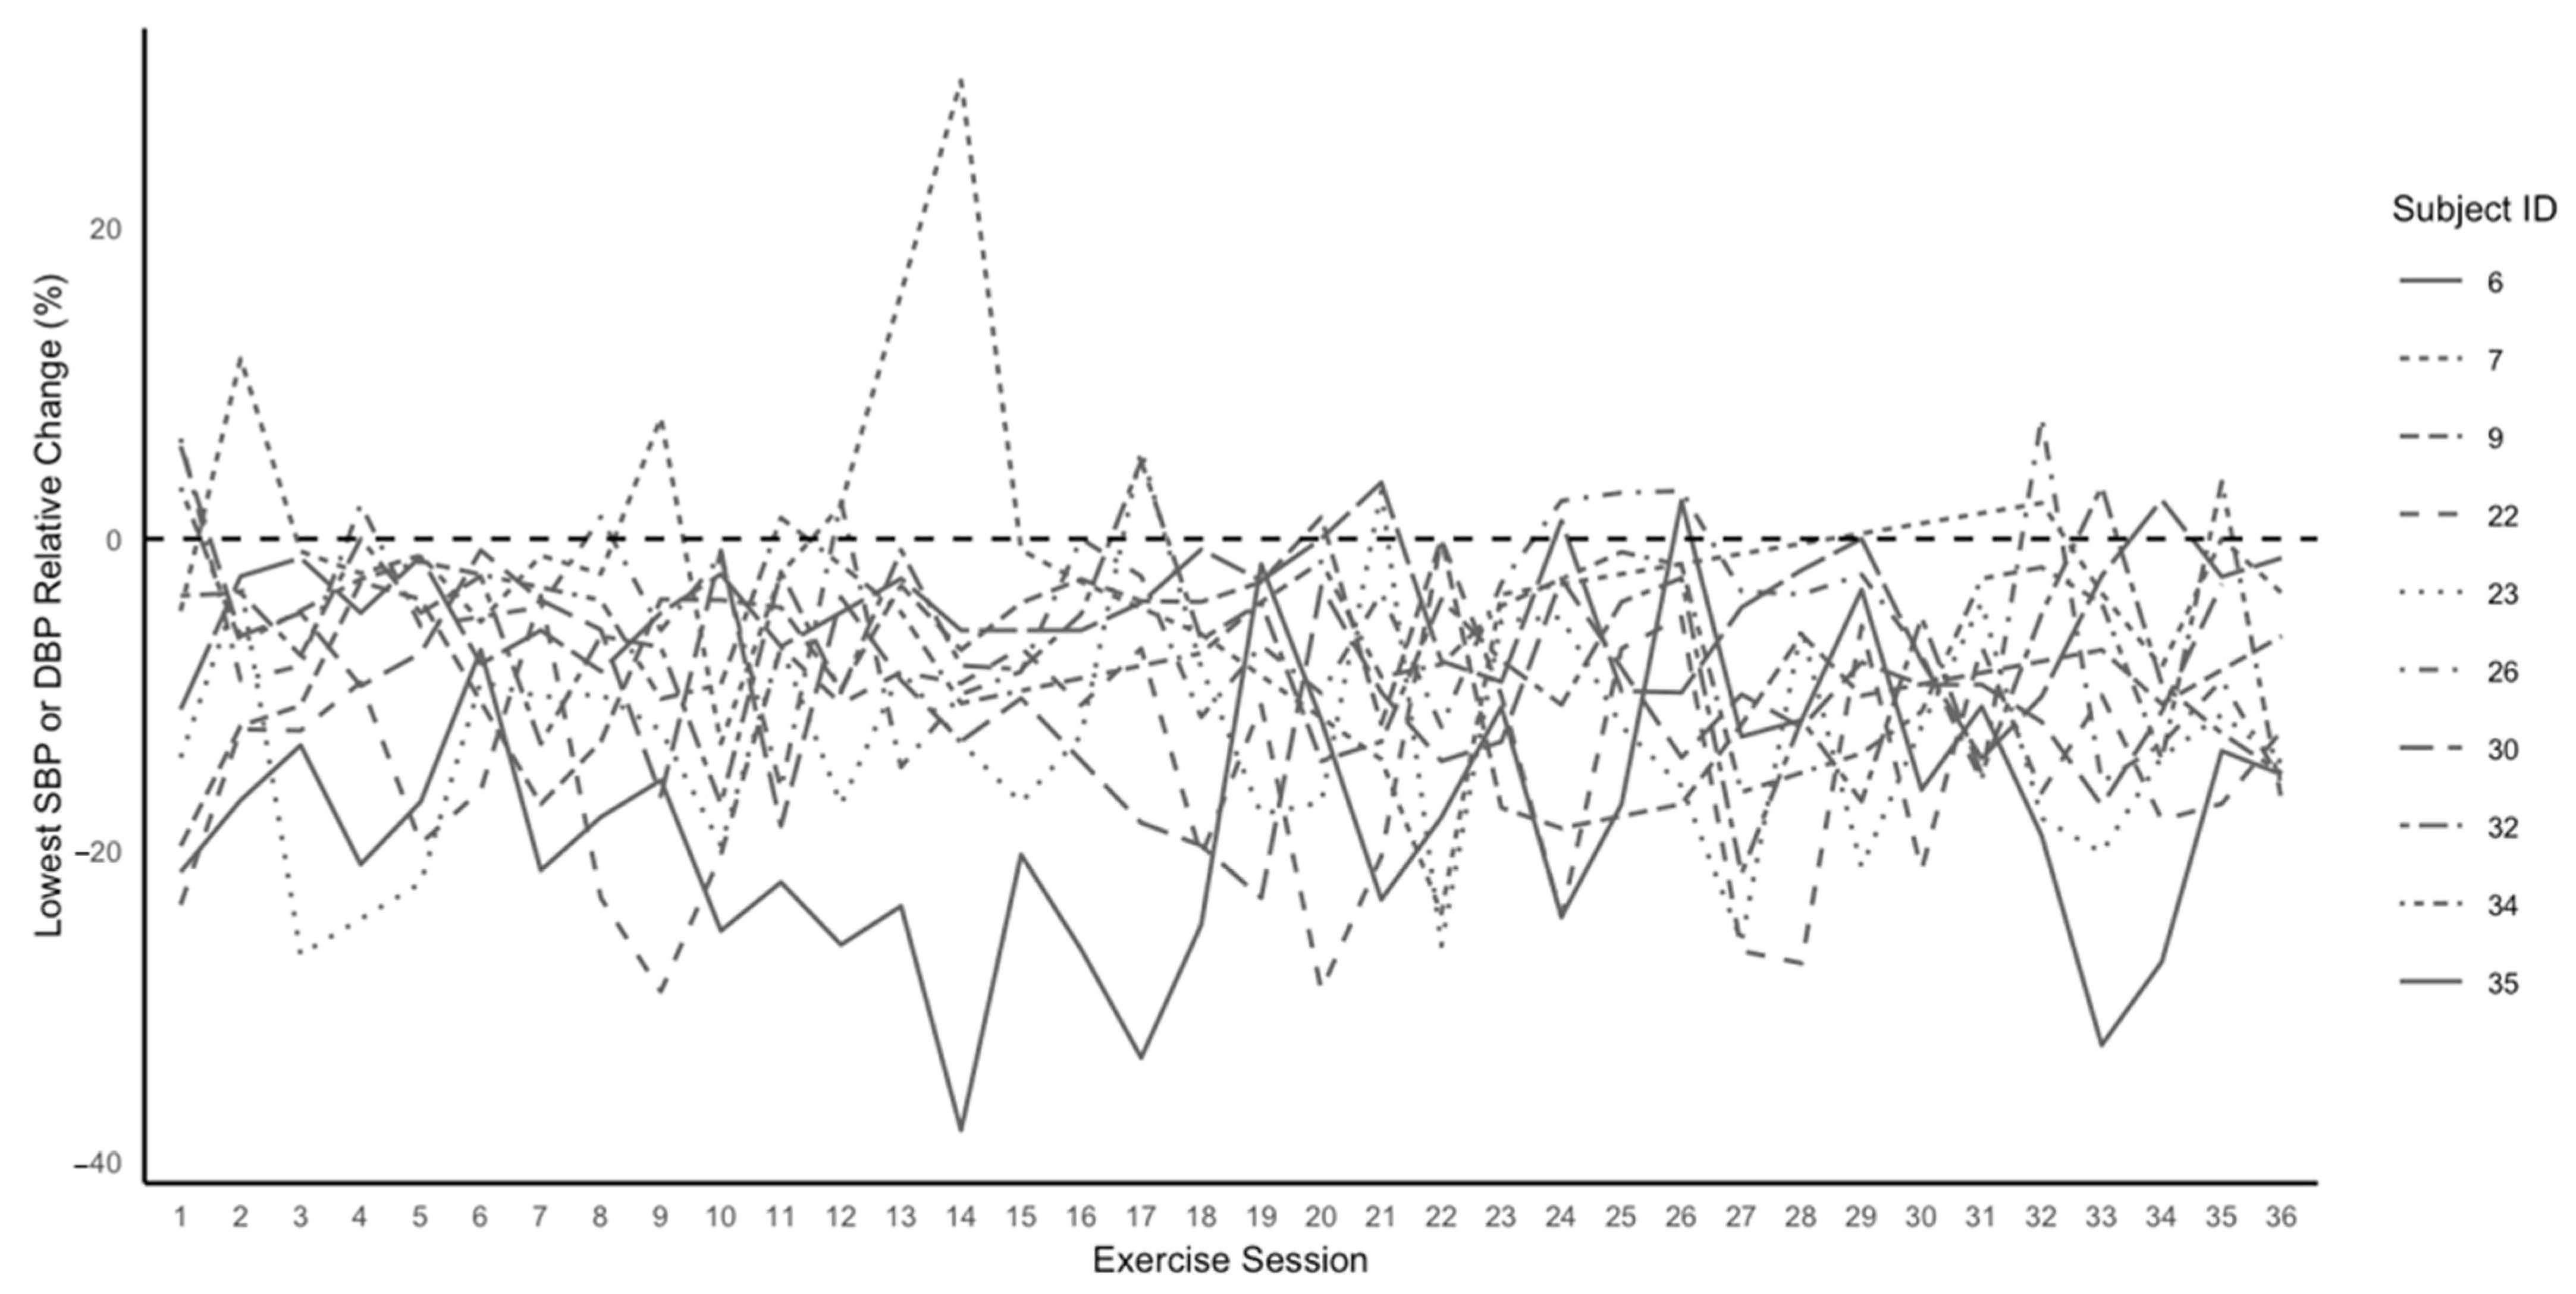
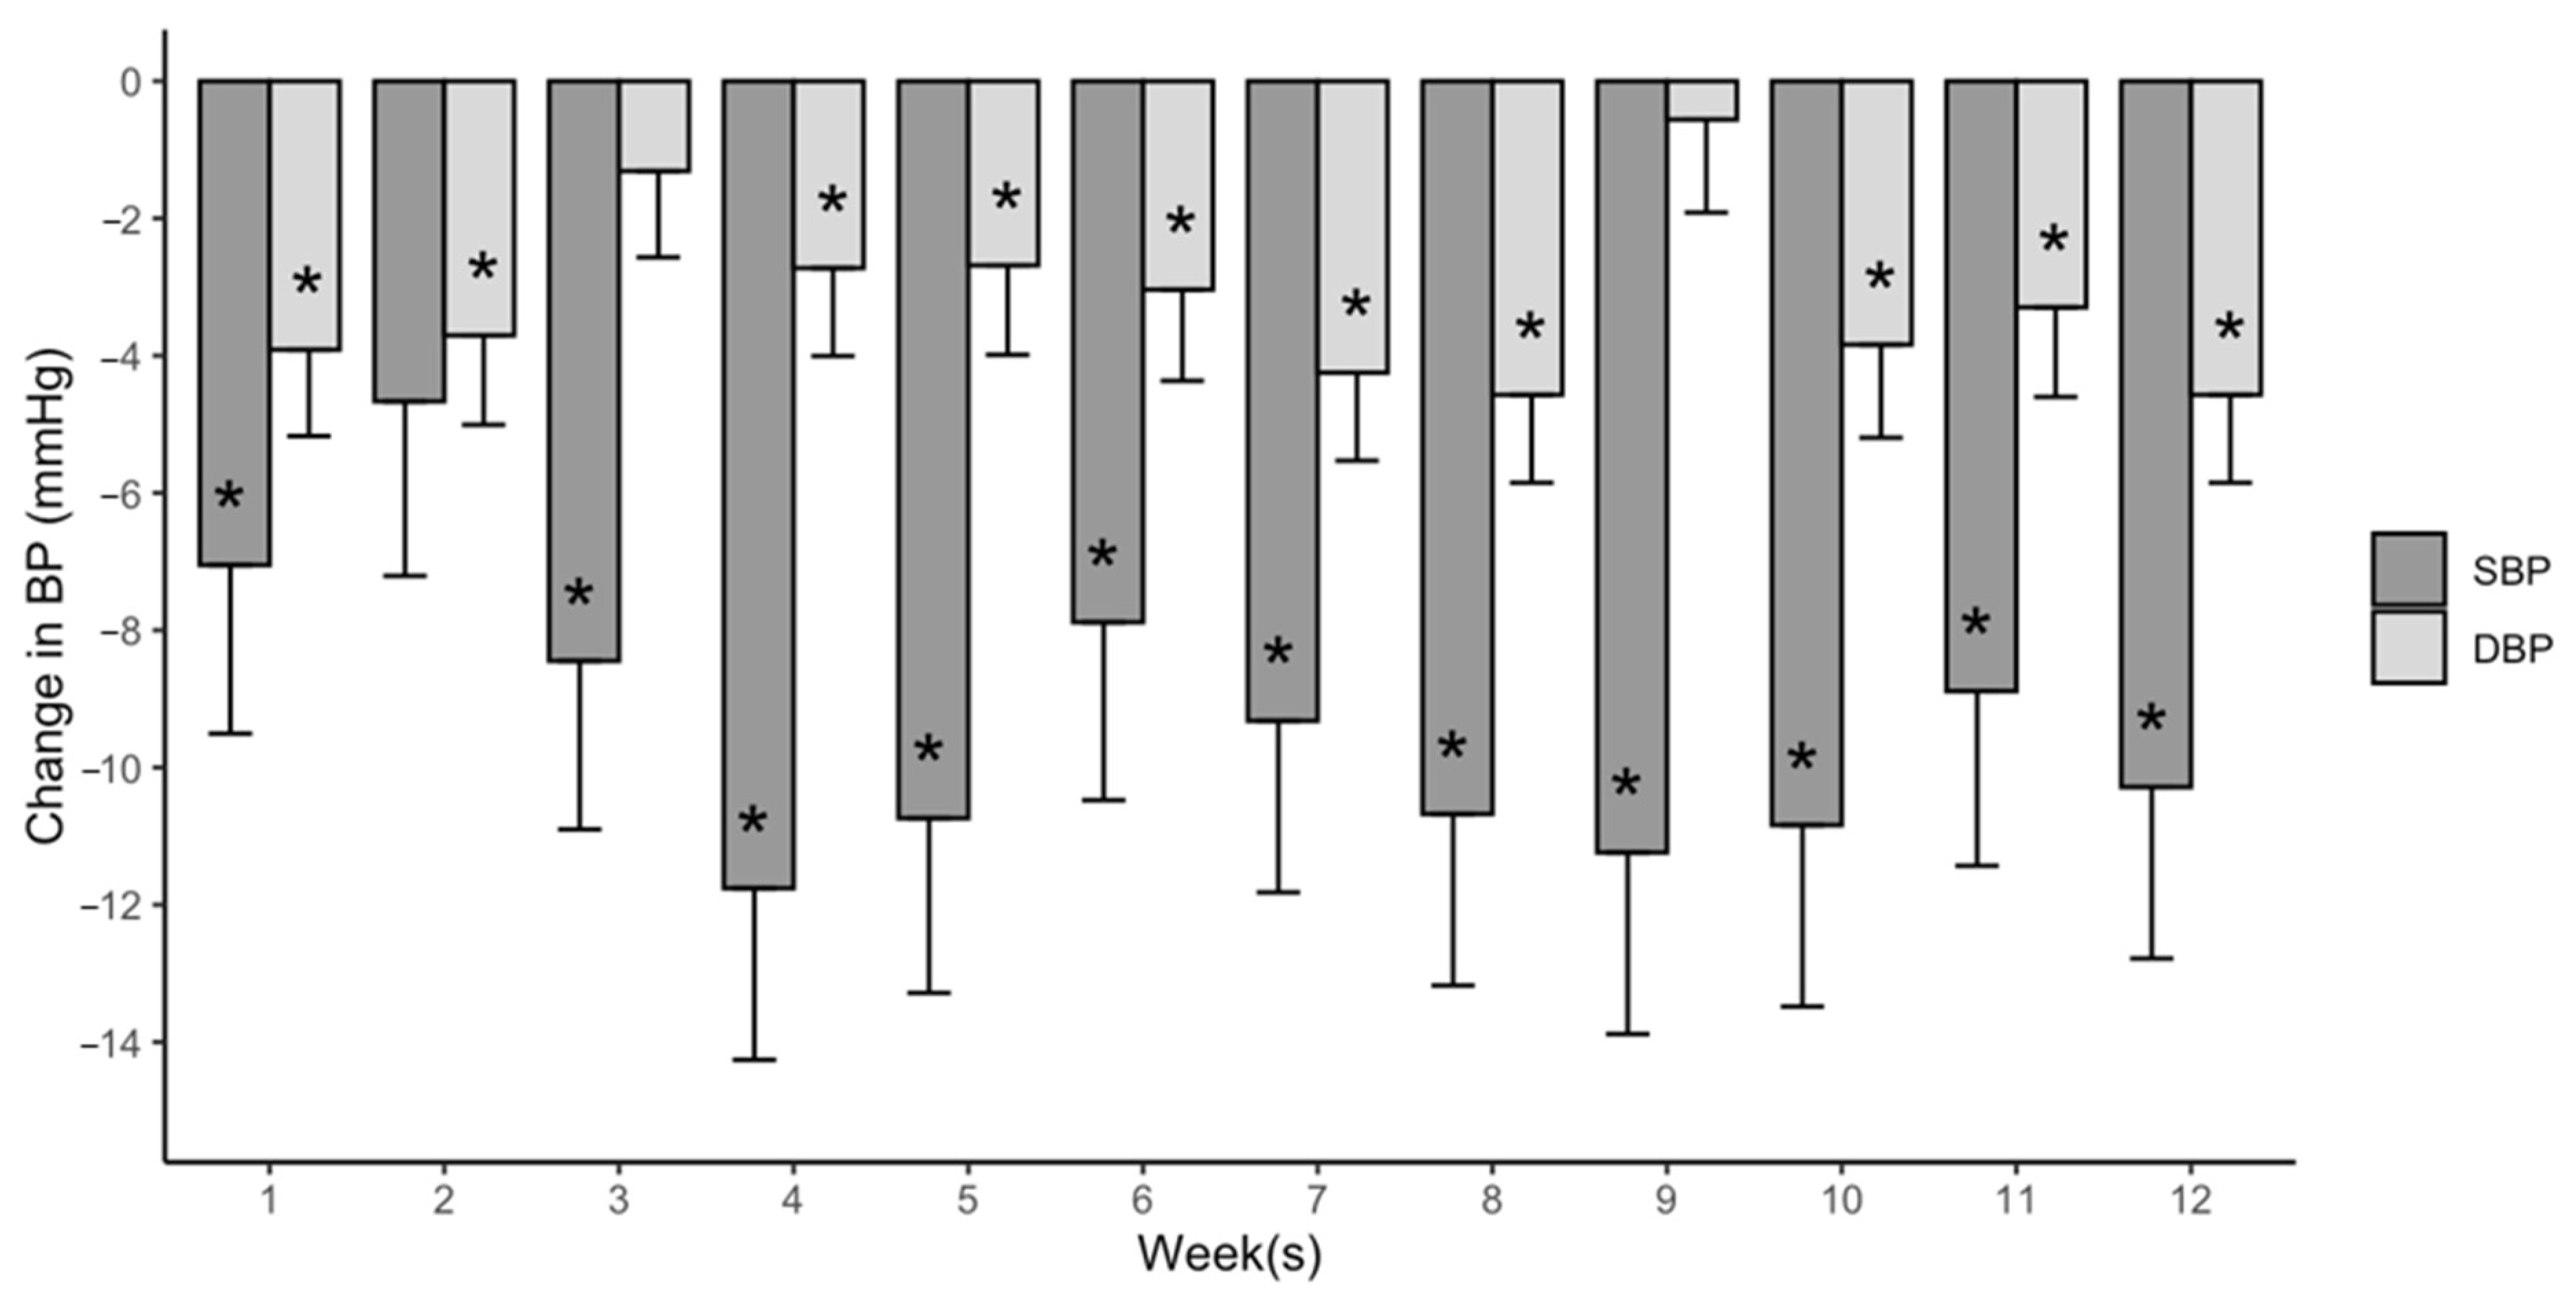
3.4. The Magnitude, Reliability, and Time Course of PEH during Exercise Training
4. Discussion
5. Conclusions
Supplementary Materials
Author Contributions
Funding
Institutional Review Board Statement
Informed Consent Statement
Data Availability Statement
Acknowledgments
Conflicts of Interest
References
- Tsao, C.W.; Aday, A.W.; Almarzooq, Z.I.; Anderson, C.A.M.; Arora, P.; Avery, C.L.; Baker-Smith, C.M.; Beaton, A.Z.; Boehme, A.K.; Buxton, A.E.; et al. Heart disease and stroke statistics-2023 update: A report from the american heart association. Circulation 2023, 147, e93–e621. [Google Scholar] [CrossRef]
- Nelson, S.; Whitsel, L.; Khavjou, O.; Phelps, D.; Leib, A. Projections of cardiovascular disease prevalence and costs: 2015–2035. RTI Int. 2016. Available online: https://www.heart.org/-/media/Files/Get-Involved/Advocacy/Burden-Report-Technical-Report.pdf (accessed on 27 December 2023).
- Alves, A.J.; Wu, Y.; Lopes, S.; Ribeiro, F.; Pescatello, L.S. Exercise to Treat Hypertension: Late Breaking News on Exercise Prescriptions That FITT. Optom. Vis. Sci. 2022, 21, 280–288. [Google Scholar] [CrossRef]
- Whelton, P.K.; Carey, R.M.; Aronow, W.S.; Casey, D.E., Jr.; Collins, K.J.; Dennison Himmelfarb, C.; DePalma, S.M.; Gidding, S.; Jamerson, K.A.; Jones, D.W.; et al. 2017 ACC/AHA/AAPA/ABC/ACPM/AGS/APhA/ASH/ASPC/NMA/PCNA guideline for the prevention, detection, evaluation, and management of high blood pressure in adults: Executive summary: A report of the american college of cardiology/american heart association task force on clinical practice guidelines. Hypertension 2018, 71, 1269–1324. [Google Scholar]
- Zanchetti, A.; Thomopoulos, C.; Parati, G. Randomized controlled trials of blood pressure lowering in hypertension: A critical reappraisal. Circ. Res. 2015, 116, 1058–1073. [Google Scholar] [CrossRef]
- Kenney, M.J.; Seals, D.R. Postexercise hypotension. Key features, mechanisms, and clinical significance. Hypertension 1993, 22, 653–664. [Google Scholar] [CrossRef] [PubMed]
- Forjaz, C.L.; Tinucci, T.; Ortega, K.C.; Santaella, D.F.; Mion, D.; Negrão, C.E. Factors affecting post-exercise hypotension in normotensive and hypertensive humans. Blood Press. Monit. 2000, 5, 255–262. [Google Scholar] [CrossRef] [PubMed]
- Pescatello, L.S.; Buchner, D.M.; Jakicic, J.M.; Powell, K.E.; Kraus, W.E.; Bloodgood, B.; Campbell, W.W.; Dietz, S.; Dipietro, L.; George, S.M.; et al. Physical Activity to Prevent and Treat Hypertension: A Systematic Review. Med. Sci. Sports Exerc. 2019, 51, 1314–1323. [Google Scholar] [CrossRef] [PubMed]
- Moreira, S.R.; Cucato, G.G.; Terra, D.F.; Ritti-Dias, R.M. Acute blood pressure changes are related to chronic effects of resistance exercise in medicated hypertensives elderly women. Clin. Physiol. Funct. Imaging 2016, 36, 242–248. [Google Scholar] [CrossRef]
- Lopes, S.; Mesquita-Bastos, J.; Garcia, C.; Figueiredo, D.; Oliveira, J.; Guimarães, G.V.; Pescatello, L.S.; Polonia, J.; Alves, A.J.; Ribeiro, F. The blood pressure response to acute exercise predicts the ambulatory blood pressure response to exercise training in patients with resistant hypertension: Results from the EnRicH trial. Hypertens. Res. 2022, 45, 1392–1397. [Google Scholar] [CrossRef]
- Farinatti, P.; Pescatello, L.S.; Crisafulli, A.; Taiar, R.; Fernandez, A.B. Editorial: Post-Exercise Hypotension: Clinical Applications and Potential Mechanisms. Front. Physiol. 2022, 13, 899497. [Google Scholar] [CrossRef]
- Brito, L.C.; Fecchio, R.Y.; Peçanha, T.; Andrade-Lima, A.; Halliwill, J.R.; Forjaz, C.L.M. Postexercise hypotension as a clinical tool: A “single brick” in the wall. J. Am. Soc. Hypertens. 2018, 12, e59–e64. [Google Scholar] [CrossRef]
- Moraes, M.R.; Bacurau, R.F.P.; Simões, H.G.; Campbell, C.S.G.; Pudo, M.A.; Wasinski, F.; Pesquero, J.B.; Würtele, M.; Araujo, R.C. Effect of 12 weeks of resistance exercise on post-exercise hypotension in stage 1 hypertensive individuals. J. Hum. Hypertens. 2012, 26, 533–539. [Google Scholar] [CrossRef] [PubMed]
- Mota, M.R.; de Oliveira, R.J.; Dutra, M.T.; Pardono, E.; Terra, D.F.; Lima, R.M.; Simões, H.G.; da Silva, F.M. Acute and Chronic Effects of Resistive Exercise on Blood Pressure in Hypertensive Elderly Women. J. Strength Cond. Res. 2013, 27, 3475–3480. [Google Scholar] [CrossRef]
- Iellamo, F.; Caminiti, G.; Montano, M.; Manzi, V.; Franchini, A.; Mancuso, A.; Volterrani, M. Prolonged Post-Exercise Hypotension: Effects of Different Exercise Modalities and Training Statuses in Elderly Patients with Hypertension. Int. J. Environ. Res. Public Health 2021, 18, 3229. [Google Scholar] [CrossRef]
- Imazu, A.A.; Goessler, K.F.; Casonatto, J.; Polito, M.D. The influence of physical training status on postexercise hypotension in patients with hypertension: A cross-sectional study. Blood Press Monit. 2017, 22, 196–201. [Google Scholar] [CrossRef]
- Fecchio, R.Y.; Chehuen, M.; Brito, L.C.; Peçanha, T.; Queiroz, A.C.C.; de Moraes Forjaz, C.L. Reproducibility (Reliability and Agreement) of Post-exercise Hypotension. Int. J. Sports Med. 2017, 38, 1029–1034. [Google Scholar] [CrossRef] [PubMed]
- Fecchio, R.Y.; Brito, L.C.; Peçanha, T.; Forjaz, C.L.d.M. Consistency of hemodynamic and autonomic mechanisms underlying post-exercise hypotension. J. Hum. Hypertens. 2020, 35, 1003–1011. [Google Scholar] [CrossRef]
- Fonseca, G.F.; Michalski, A.C.; Ferreira, A.S.; Costa, V.A.B.; Massaferri, R.; Farinatti, P.; Cunha, F.A. Is postexercise hypotension a method-dependent phenomenon in chronic stroke? A crossover randomized controlled trial. Clin. Physiol. Funct. Imaging 2023, 43, 242–252. [Google Scholar] [CrossRef] [PubMed]
- Zaleski, A.L.; Taylor, B.A.; Park, C.L.; Santos, L.P.; Panza, G.; Kramarz, M.; McCormick, K.; Thompson, P.D.; Fernandez, A.B.; Chen, M.H.; et al. Using the immediate blood pressure benefits of exercise to improve exercise adherence among adults with hypertension: A randomized clinical trial. J. Hypertens. 2019, 37, 1877–1888. [Google Scholar] [CrossRef]
- Riebe, D. Lippincott Williams and Wilkins: Philadelphia, PA, USA, 2018.Medicine. In ACSM’s Guidelines for Exercise Testing and Prescription, 10th ed.; Lippincott Williams and Wilkins: Philadelphia, PA, USA, 2018. [Google Scholar]
- Chobanian, A.V.; Bakris, G.L.; Black, H.R.; Cushman, W.C.; Green, L.A.; Izzo, J.L., Jr.; Jones, D.W.; Materson, B.J.; Oparil, S.; Wright, J.T., Jr.; et al. The Seventh Report of the Joint National Committee on Prevention, Detection, Evaluation, and Treatment of High Blood Pressure: The JNC 7 Report. JAMA 2003, 289, 2560–2572. [Google Scholar] [CrossRef] [PubMed]
- de Brito, L.C.; Fecchio, R.Y.; Peçanha, T.; Lima, A.; Halliwill, J.; Forjaz, C.L.d.M. Recommendations in Post-exercise Hypotension: Concerns, Best Practices and Interpretation. Int. J. Sports Med. 2019, 40, 487–497. [Google Scholar] [CrossRef] [PubMed]
- Day, C.; Wu, Y.; Pescatello, L.S. Evaluating the Methodological Quality of Postexercise Hypotension Aerobic Exercise Interventions. Front. Physiol. 2022, 13, 851950. [Google Scholar] [CrossRef] [PubMed]
- Balke, B.; Ware, R.W. The present status of physical fitness in the air force. Proj. Rep. USAF Sch. Aviat. Med. 1959, 59, 1–9. [Google Scholar] [PubMed]
- Magid, D.J.; Olson, K.L.; Billups, S.J.; Wagner, N.M.; Lyons, E.E.; Kroner, B.A. A Pharmacist-Led, American Heart Association Heart360 Web-Enabled Home Blood Pressure Monitoring Program. Circ. Cardiovasc. Qual. Outcomes 2013, 6, 157–163. [Google Scholar] [CrossRef] [PubMed]
- Panza, G.A.; Weinstock, J.; Ash, G.I.; Pescatello, L.S. Psychometric evaluation of the Timeline Followback for Exercise among college students. Psychol. Sport Exerc. 2012, 13, 779–788. [Google Scholar] [CrossRef]
- Borg, G. Perceived exertion as an indicator of somatic stress. Scand. J. Rehabil. Med. 1970, 2, 92–98. [Google Scholar] [CrossRef]
- Borresen, J.; Lambert, M.I. The Quantification of Training Load, the Training Response and the Effect on Performance. Sports Med. 2009, 39, 779–795. [Google Scholar] [CrossRef]
- Girden, E.R. ANOVA: Repeated Measures; Sage: Newbury Park, CA, USA, 1992. [Google Scholar]
- Delaney, H.D.; Maxwell, S.E. On Using Analysis Of Covariance In Repeated Measures Designs. Multivar. Behav. Res. 1981, 16, 105–123. [Google Scholar] [CrossRef]
- Dimitrov, D.M. Marginal True-Score Measures and Reliability for Binary Items as a Function of Their IRT Parameters. Appl. Psychol. Meas. 2003, 27, 440–458. [Google Scholar] [CrossRef]
- Koo, T.K.; Li, M.Y. Cracking the code: Providing insight into the fundamentals of research and evidence-based practice a guideline of selecting and reporting intraclass correlation coefficients for reliability research. J. Chiropr. Med. 2016, 15, 155–163. [Google Scholar] [CrossRef]
- Bates, D.; Maechler, M.; Bolker, B.M.; Walker, S. Fitting linear mixed-effects models using lme4. J. Stat. Softw. 2015, 67, 1–48. [Google Scholar] [CrossRef]
- Wickham, H. ggplot2: Elegant Graphics for Data Analysis; Springer: Berlin/Heidelberg, Germany, 2016. [Google Scholar]
- Fox, J.; Weisberg, S. Anœ R Companion to Applied Regression, 3rd ed.; Sage: Los Angeles, CA, USA, 2019. [Google Scholar]
- Wickham, H.; François, R.; Henry, L.; Müller, K. dplyr: A Grammar of Data Manipulation. 2022. Available online: https://dplyr.tidyverse.org (accessed on 10 March 2022).
- Halliwill, J.R.; Buck, T.M.; Lacewell, A.N.; Romero, S.A. Postexercise hypotension and sustained postexercise vasodilatation: What happens after we exercise? Exp. Physiol. 2013, 98, 7–18. [Google Scholar] [CrossRef] [PubMed]
- Brito, L.; Queiroz, A.; Forjaz, C. Influence of population and exercise protocol characteristics on hemodynamic determinants of post-aerobic exercise hypotension. Braz. J. Med. Biol. Res. 2014, 47, 626–636. [Google Scholar] [CrossRef] [PubMed]
- Hagberg, J.M.; Ferrell, R.E.; Dengel, D.R.; Wilund, K.R. Exercise Training-Induced Blood Pressure and Plasma Lipid Improvements in Hypertensives May Be Genotype Dependent. Hypertension 1999, 34, 18–23. [Google Scholar] [CrossRef] [PubMed]
- Akaike, H. A new look at the statistical model identification. IEEE Trans. Autom. Control 1974, 19, 716–723. [Google Scholar] [CrossRef]
- May, K.; Nicewander, W.A. Reliability and Information Functions for Percentile Ranks. J. Educ. Meas. 1994, 31, 313–325. [Google Scholar] [CrossRef]


| Age (years) | 57.2 ± 10.5 |
| Sex (n, men) | 6 |
| Ethnicity (n, non-Hispanic/Hispanic) | 8/2 |
| Race (n, Caucasian/Other) | 8/2 |
| Body mass index (kg·m−2) | 30.6 ± 4.3 |
| Waist circumference (cm) | 99.8 ± 7.2 |
| VO2peak (mL·kg−1·min−1) | 28.5 ± 5.8 |
| Systolic blood pressure (mmHg) | 136.5 ± 12.1 |
| Diastolic blood pressure (mmHg) | 83.4 ± 6.7 |
| Heart rate (bpm) | 71.4 ± 8.2 |
| Duration of hypertension (years) | 6.3 ± 5.7 |
| Medication use (%) 1 | 40.0 |
| Frequency (session/week) | 2.8 ± 0.5 |
| Intensity 1 | |
| Heart rate (bpm) | 128.5 ± 13.1 |
| Heart rate reserve (%) | 62.4 ± 9.0 |
| Rating of perceived exertion | 13 ± 0.1 |
| Training impulse | 52.9 ± 18.4 |
| Heart rate max (%) | 78.5 ± 4.2 |
| Time (min/session) 1,2 | 35.9 ± 6.9 |
| Type | |
| Treadmill modality (%) | 93.7 ± 18.1 |
Disclaimer/Publisher’s Note: The statements, opinions and data contained in all publications are solely those of the individual author(s) and contributor(s) and not of MDPI and/or the editor(s). MDPI and/or the editor(s) disclaim responsibility for any injury to people or property resulting from any ideas, methods, instructions or products referred to in the content. |
© 2024 by the authors. Licensee MDPI, Basel, Switzerland. This article is an open access article distributed under the terms and conditions of the Creative Commons Attribution (CC BY) license (https://creativecommons.org/licenses/by/4.0/).
Share and Cite
Kiernan, P.A.; Day, C.A.; Berkowsky, R.S.; Zaleski, A.L.; Gao, S.; Taylor, B.A.; Santos, L.P.; Panza, G.; Kramarz, M.; McCormick, K.; et al. Reliability and Time Course of Postexercise Hypotension during Exercise Training among Adults with Hypertension. J. Cardiovasc. Dev. Dis. 2024, 11, 42. https://doi.org/10.3390/jcdd11020042
Kiernan PA, Day CA, Berkowsky RS, Zaleski AL, Gao S, Taylor BA, Santos LP, Panza G, Kramarz M, McCormick K, et al. Reliability and Time Course of Postexercise Hypotension during Exercise Training among Adults with Hypertension. Journal of Cardiovascular Development and Disease. 2024; 11(2):42. https://doi.org/10.3390/jcdd11020042
Chicago/Turabian StyleKiernan, Peter A., Christina A. Day, Rachel S. Berkowsky, Amanda L. Zaleski, Simiao Gao, Beth A. Taylor, Lucas P. Santos, Gregory Panza, Melody Kramarz, Kyle McCormick, and et al. 2024. "Reliability and Time Course of Postexercise Hypotension during Exercise Training among Adults with Hypertension" Journal of Cardiovascular Development and Disease 11, no. 2: 42. https://doi.org/10.3390/jcdd11020042
APA StyleKiernan, P. A., Day, C. A., Berkowsky, R. S., Zaleski, A. L., Gao, S., Taylor, B. A., Santos, L. P., Panza, G., Kramarz, M., McCormick, K., Thompson, P. D., Fernandez, A. B., Chen, M.-H., & Pescatello, L. S. (2024). Reliability and Time Course of Postexercise Hypotension during Exercise Training among Adults with Hypertension. Journal of Cardiovascular Development and Disease, 11(2), 42. https://doi.org/10.3390/jcdd11020042