
Diagnostic Accuracy of Global Longitudinal Strain for Detecting Exercise Intolerance in Patients with Ischemic Heart Disease

 ,
,
Abstract
1. Introduction
2. Materials and Methods
2.1. Study Population
2.2. Cardiopulmonary Exercise Testing
2.3. Conventional Echocardiography
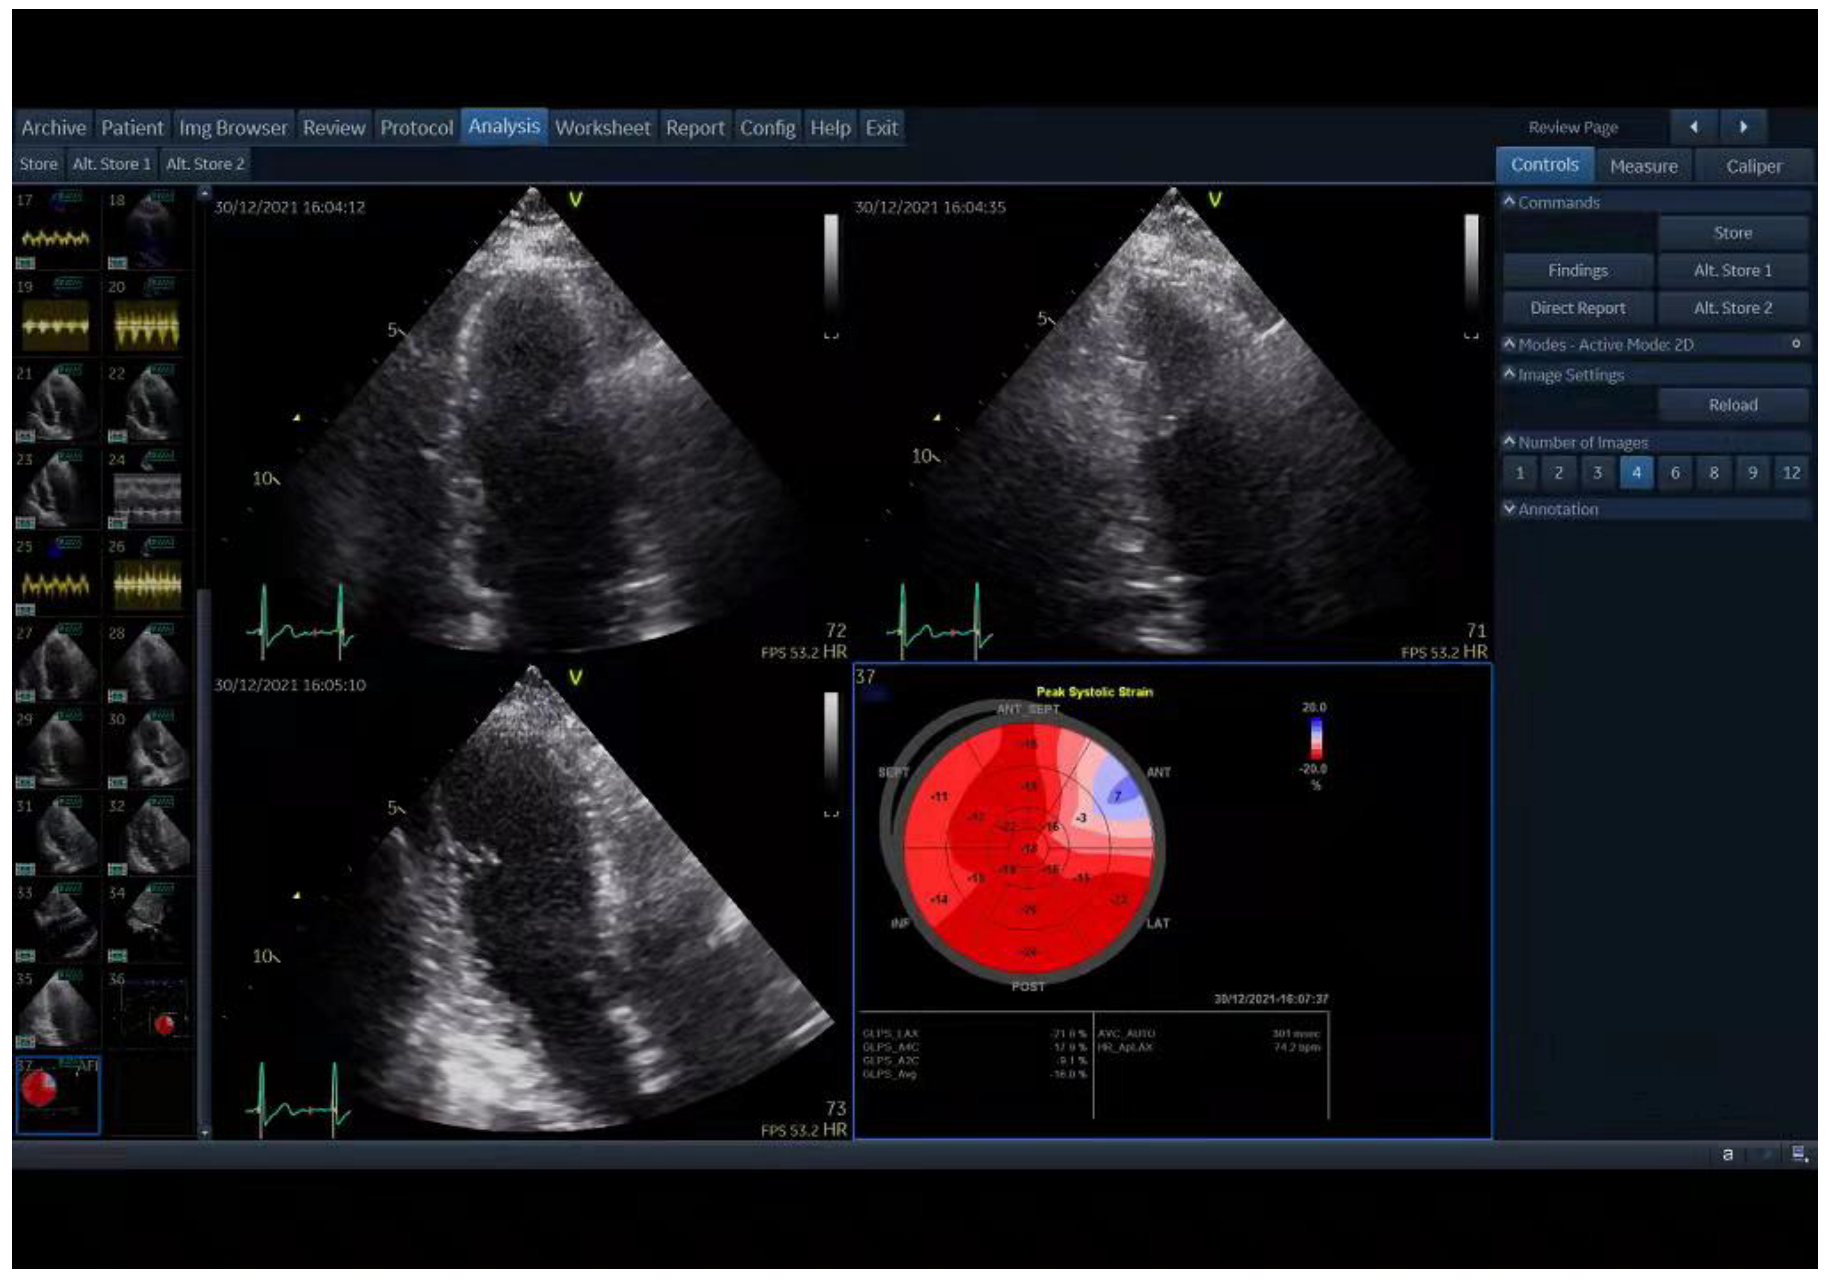
2.4. Two-Dimensional Speckle-Tracking Echocardiography (2D-STE)
2.5. Statistical Analysis
3. Results
3.1. Patients’ Baseline Characteristics
3.2. ECG and CPX data
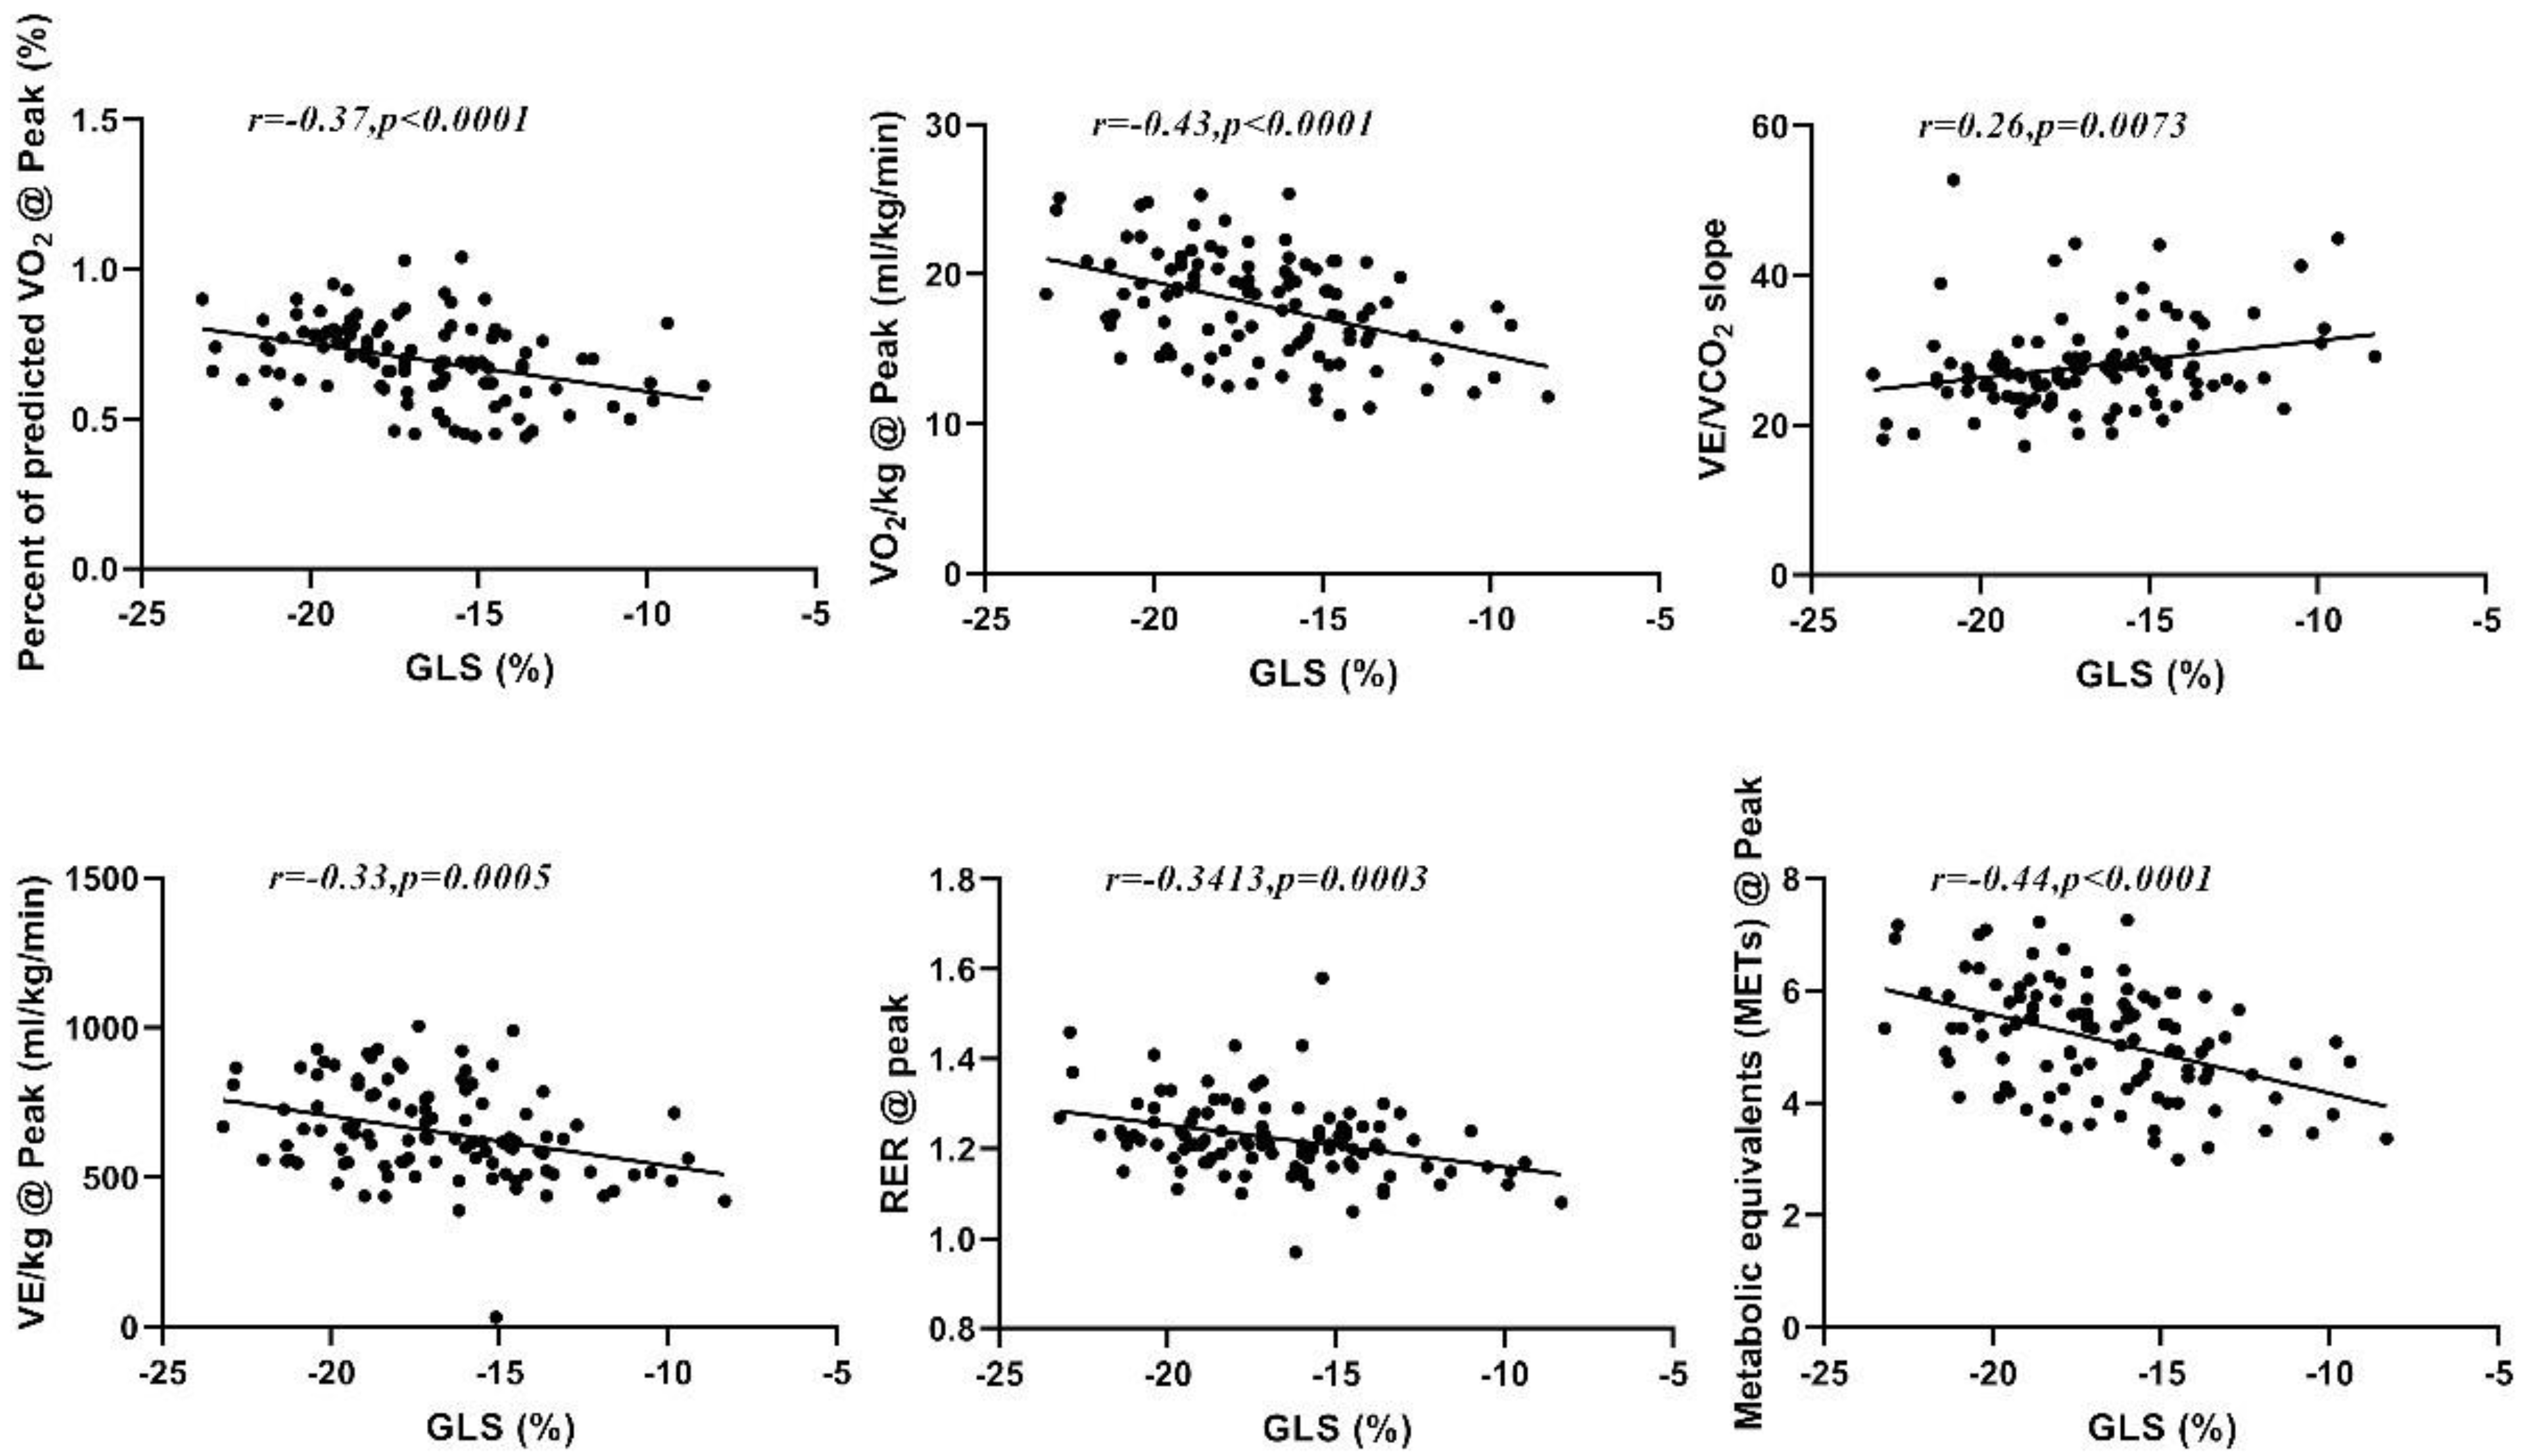
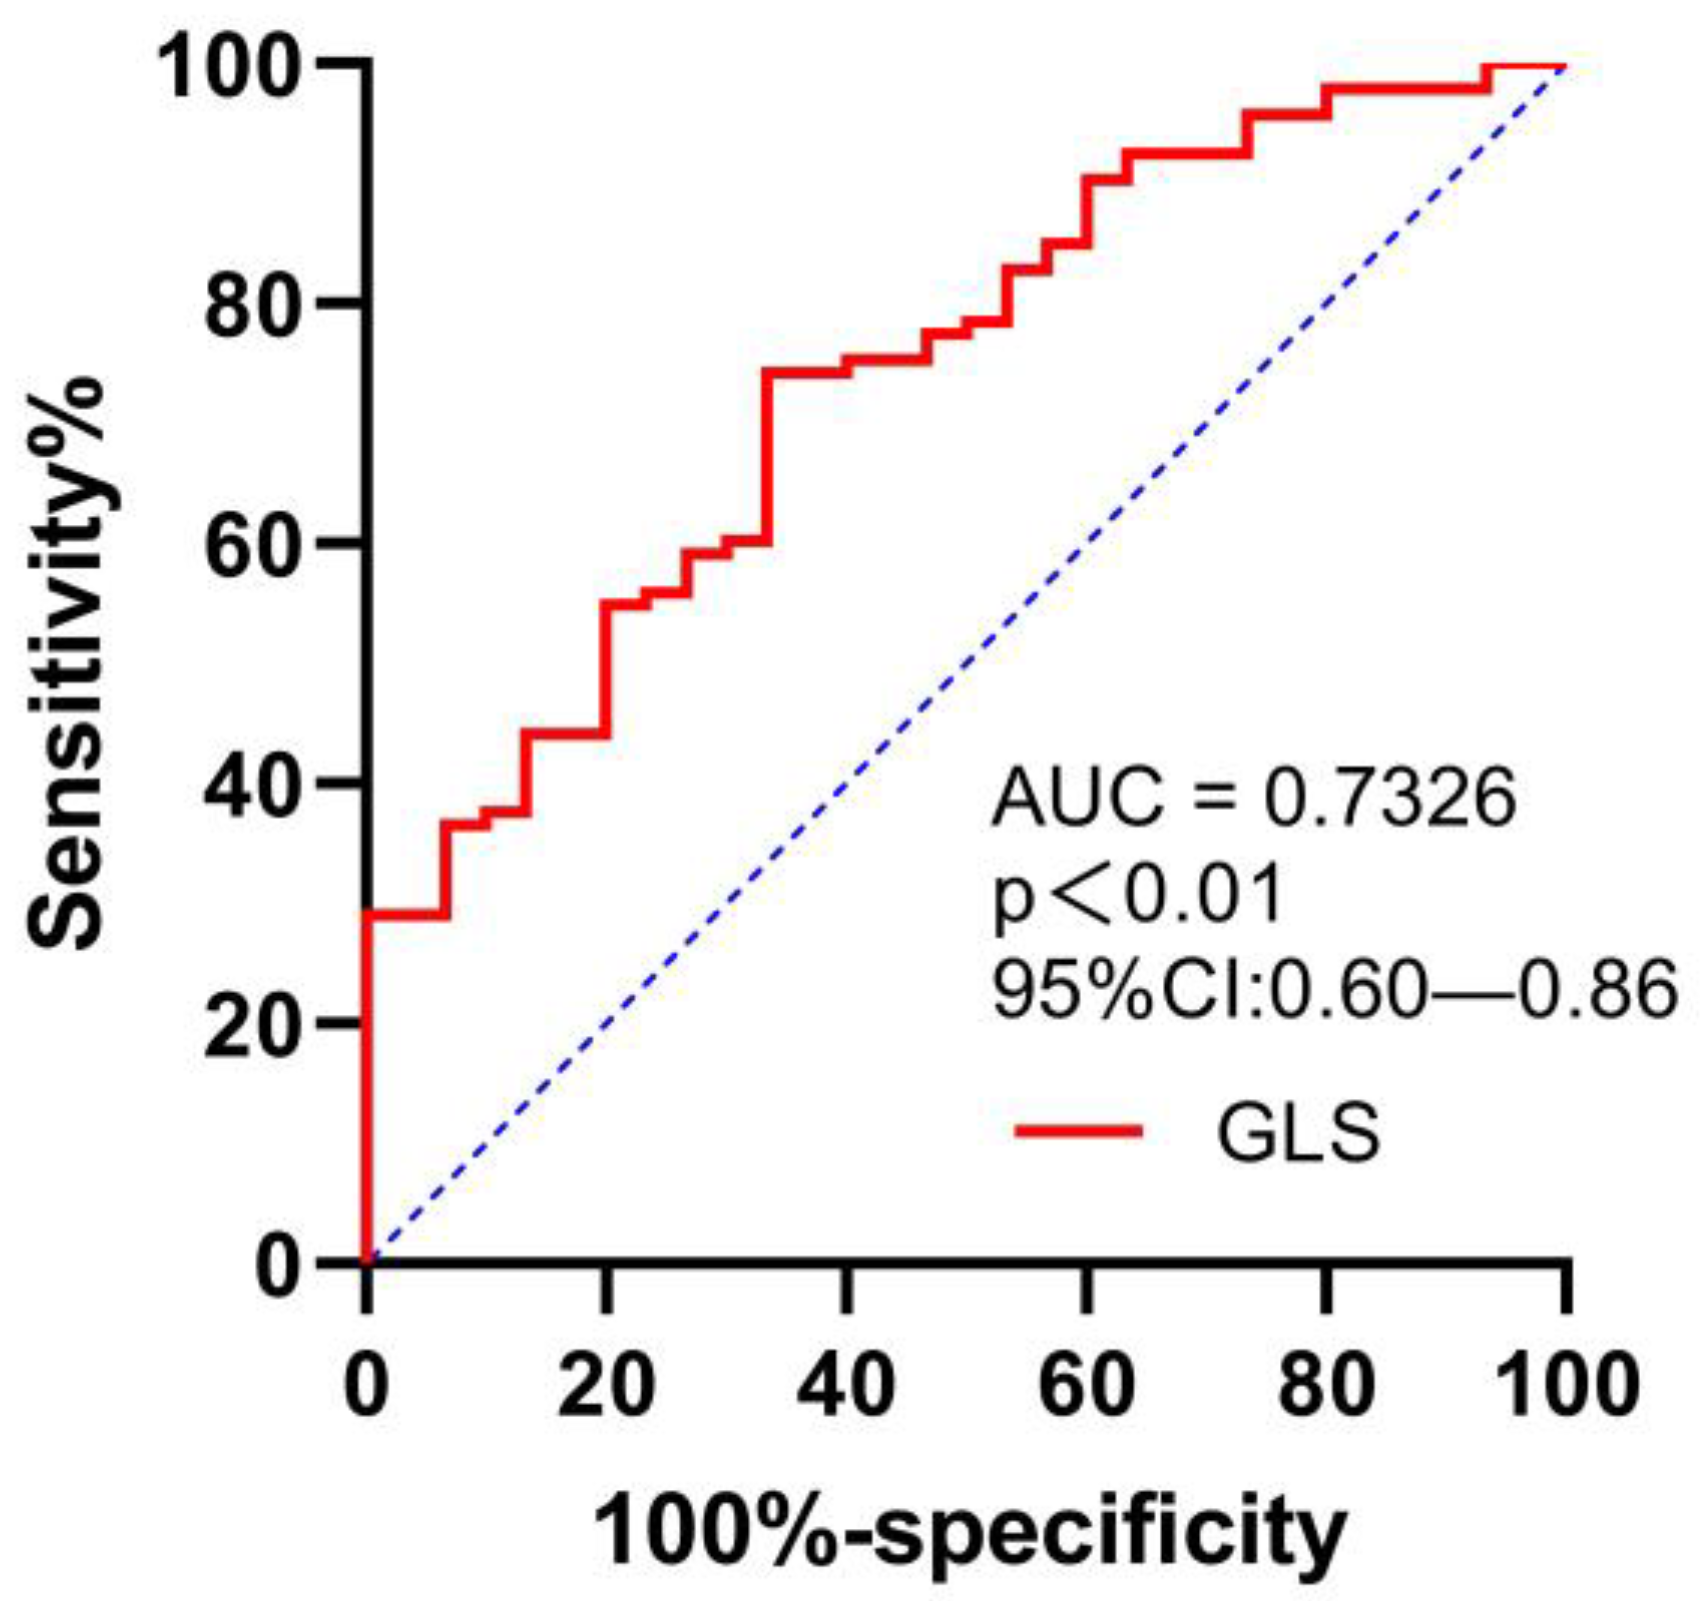
3.3. Correlation of GLS with CPX Variables
4. Discussion
4.1. Limitations
4.2. Conclusions
Author Contributions
Funding
Institutional Review Board Statement
Informed Consent Statement
Data Availability Statement
Conflicts of Interest
References
- DeRouen, T.A.; Murray, J.A.; Owen, W. Variability in the analysis of coronary arteriograms. Circulation 1977, 55, 324–328. [Google Scholar] [CrossRef] [PubMed]
- Sedlak, T.L.; Lee, M.; Izadnegahdar, M.; Merz, C.N.; Gao, M.; Humphries, K.H. Sex differences in clinical outcomes in patients with stable angina and no obstructive coronary artery disease. Am. Heart J. 2013, 166, 38–44. [Google Scholar] [CrossRef] [PubMed]
- Choi, J.O.; Cho, S.W.; Song, Y.B.; Cho, S.J.; Song, B.G.; Lee, S.C.; Park, S.W. Longitudinal 2D strain at rest predicts the presence of left main and three vessel coronary artery disease in patients without regional wall motion abnormality. Eur. J. Echocardiogr. J. Work. Group Echocardiogr. Eur. Soc. Cardiol. 2009, 10, 695–701. [Google Scholar] [CrossRef]
- Fleischmann, K.E.; Lee, R.T.; Come, P.C.; Goldman, L.; Cook, E.F.; Weissman, M.A.; Johnson, P.A.; Lee, T.H. Impact of Valvular Regurgitation and Ventricular Dysfunction on Long-Term Survival in Patients with Chest Pain. Am. J. Cardiol. 1997, 80, 1266–1272. [Google Scholar] [CrossRef] [PubMed]
- Savonitto, S.; Ardissino, D.; Granger, C.B.; Morando, G.; Prando, M.D.; Mafrici, A.; Cavallini, C.; Melandri, G.; Thompson, T.D.; Vahanian, A.; et al. Prognostic value of the admission electrocardiogram in acute coronary syndromes. Jama 1999, 281, 707–713. [Google Scholar] [CrossRef] [PubMed]
- Elhendy, A.; van Domburg, R.T.; Bax, J.J.; Roelandt, J.R. Significance of resting wall motion abnormalities in 2-dimensional echocardiography in patients without previous myocardial infarction referred for pharmacologic stress testing. J. Am. Soc. Echocardiogr. Off. Publ. Am. Soc. Echocardiogr. 2000, 13, 1–8. [Google Scholar] [CrossRef]
- Zito, C.; Longobardo, L.; Citro, R.; Galderisi, M.; Oreto, L.; Carerj, M.L.; Manganaro, R.; Cusmà-Piccione, M.; Todaro, M.C.; Di Bella, G.; et al. Ten Years of 2D Longitudinal Strain for Early Myocardial Dysfunction Detection: A Clinical Overview. BioMed Res. Int. 2018, 2018, 8979407. [Google Scholar] [CrossRef]
- Chaudhry, S.; Arena, R.; Wasserman, K.; Hansen, J.E.; Lewis, G.D.; Myers, J.; Chronos, N.; Boden, W.E. Exercise-induced myocardial ischemia detected by cardiopulmonary exercise testing. Am. J. Cardiol. 2009, 103, 615–619. [Google Scholar] [CrossRef]
- Belardinelli, R.; Lacalaprice, F.; Carle, F.; Minnucci, A.; Cianci, G.; Perna, G.; D’Eusanio, G. Exercise-induced myocardial ischaemia detected by cardiopulmonary exercise testing. Eur. Heart J. 2003, 24, 1304–1313. [Google Scholar] [CrossRef]
- Edvardsen, T.; Skulstad, H.; Aakhus, S.; Urheim, S.; Ihlen, H. Regional myocardial systolic function during acute myocardial ischemia assessed by strain Doppler echocardiography. J. Am. Coll. Cardiol. 2001, 37, 726–730. [Google Scholar] [CrossRef]
- Zuo, H.J.; Yang, X.T.; Liu, Q.G.; Zhang, Y.; Zeng, H.S.; Yan, J.T.; Wang, D.W.; Wang, H. Global Longitudinal Strain at Rest for Detection of Coronary Artery Disease in Patients without Diabetes Mellitus. Curr. Med. Sci. 2018, 38, 413–421. [Google Scholar] [CrossRef] [PubMed]
- Salerno, G.; D’Andrea, A.; Bossone, E.; Scarafile, R.; Riegler, L.; Di Salvo, G.; Gravino, R.; Pezzullo, E.; Limongelli, G.; Romano, M.; et al. Association between right ventricular two-dimensional strain and exercise capacity in patients with either idiopathic or ischemic dilated cardiomyopathy. J. Cardiovasc. Med. 2011, 12, 625–634. [Google Scholar] [CrossRef] [PubMed]
- Hummel, Y.M.; Bugatti, S.; Damman, K.; Willemsen, S.; Hartog, J.W.; Metra, M.; Sipkens, J.S.; van Veldhuisen, D.J.; Voors, A.A. Functional and hemodynamic cardiac determinants of exercise capacity in patients with systolic heart failure. Am. J. Cardiol. 2012, 110, 1336–1341. [Google Scholar] [CrossRef] [PubMed]
- Franciosa, J.A.; Park, M.; Levine, T.B. Lack of correlation between exercise capacity and indexes of resting left ventricular performance in heart failure. Am. J. Cardiol. 1981, 47, 33–39. [Google Scholar] [CrossRef]
- Fletcher, G.F.; Ades, P.A.; Kligfield, P.; Arena, R.; Balady, G.J.; Bittner, V.A.; Coke, L.A.; Fleg, J.L.; Forman, D.E.; Gerber, T.C.; et al. Exercise standards for testing and training: A scientific statement from the American Heart Association. Circulation 2013, 128, 873–934. [Google Scholar] [CrossRef]
- Fletcher, G.F.; Balady, G.J.; Amsterdam, E.A.; Chaitman, B.; Eckel, R.; Fleg, J.; Froelicher, V.F.; Leon, A.S.; Piña, I.L.; Rodney, R.; et al. Exercise standards for testing and training: A statement for healthcare professionals from the American Heart Association. Circulation 2001, 104, 1694–1740. [Google Scholar] [CrossRef]
- Myers, J.; Bellin, D. Ramp exercise protocols for clinical and cardiopulmonary exercise testing. Sport. Med. 2000, 30, 23–29. [Google Scholar] [CrossRef]
- Beaver, W.L.; Wasserman, K.; Whipp, B.J. A new method for detecting anaerobic threshold by gas exchange. J. Appl. Physiol. 1986, 60, 2020–2027. [Google Scholar] [CrossRef]
- Bard, R.L.; Gillespie, B.W.; Clarke, N.S.; Egan, T.G.; Nicklas, J.M. Determining the best ventilatory efficiency measure to predict mortality in patients with heart failure. J. Heart Lung Transplant. Off. Publ. Int. Soc. Heart Transplant. 2006, 25, 589–595. [Google Scholar] [CrossRef]
- Coates, A.L. Principles of Exercise Testing and Interpretation. By K. Wasserman, J.E. Hansen, D.V. Sue, and B.J. Whipp. Philadelphia: Lea & Febiger, 1987; Wiley Online Library: Hoboken, NJ, USA, 1987; Volume 3, p. 378. [Google Scholar] [CrossRef]
- Patel, V.; Critoph, C.H.; Elliott, P.M. Mechanisms and medical management of exercise intolerance in hypertrophic cardiomyopathy. Curr. Pharm. Des. 2015, 21, 466–472. [Google Scholar] [CrossRef]
- Balady, G.J.; Arena, R.; Sietsema, K.; Myers, J.; Coke, L.; Fletcher, G.F.; Forman, D.; Franklin, B.; Guazzi, M.; Gulati, M.; et al. Clinician’ Guide to Cardiopulmonary Exercise Testing in Adults. Circulation 2010, 122, 191–225. [Google Scholar] [CrossRef] [PubMed]
- Lang, R.M.; Badano, L.P.; Mor-Avi, V.; Afilalo, J.; Armstrong, A.; Ernande, L.; Flachskampf, F.A.; Foster, E.; Goldstein, S.A.; Kuznetsova, T.; et al. Recommendations for cardiac chamber quantification by echocardiography in adults: An update from the American Society of Echocardiography and the European Association of Cardiovascular Imaging. J. Am. Soc. Echocardiogr. Off. Publ. Am. Soc. Echocardiogr. 2015, 28, 1–39.e14. [Google Scholar] [CrossRef] [PubMed]
- Duncan, A.E.; Kateby Kashy, B.; Sarwar, S.; Singh, A.; Stenina-Adognravi, O.; Christoffersen, S.; Alfirevic, A.; Sale, S.; Yang, D.; Thomas, J.D.; et al. Hyperinsulinemic Normoglycemia Does Not Meaningfully Improve Myocardial Performance during Cardiac Surgery: A Randomized Trial. Anesthesiology 2015, 123, 272–287. [Google Scholar] [CrossRef] [PubMed]
- Yingchoncharoen, T.; Agarwal, S.; Popović, Z.B.; Marwick, T.H. Normal ranges of left ventricular strain: A meta-analysis. J. Am. Soc. Echocardiogr. Off. Publ. Am. Soc. Echocardiogr. 2013, 26, 185–191. [Google Scholar] [CrossRef]
- Ponikowski, P.; Voors, A.A.; Anker, S.D.; Bueno, H.; Cleland, J.G.F.; Coats, A.J.S.; Falk, V.; González-Juanatey, J.R.; Harjola, V.P.; Jankowska, E.A.; et al. 2016 ESC Guidelines for the diagnosis and treatment of acute and chronic heart failure: The Task Force for the diagnosis and treatment of acute and chronic heart failure of the European Society of Cardiology (ESC)Developed with the special contribution of the Heart Failure Association (HFA) of the ESC. Eur. Heart J. 2016, 37, 2129–2200. [Google Scholar] [CrossRef]
- Arena, R.; Guazzi, M.; Cahalin, L.P.; Myers, J. Revisiting cardiopulmonary exercise testing applications in heart failure: Aligning evidence with clinical practice. Exerc. Sport Sci. Rev. 2014, 42, 153–160. [Google Scholar] [CrossRef]
- Kou, S.; Suzuki, K.; Akashi, Y.J.; Mizukoshi, K.; Takai, M.; Izumo, M.; Shimozato, T.; Hayashi, A.; Ohtaki, E.; Osada, N.; et al. Global longitudinal strain by two-dimensional speckle tracking imaging predicts exercise capacity in patients with chronic heart failure. J. Echocardiogr. 2011, 9, 64–72. [Google Scholar] [CrossRef]
- Shimoni, O.; Korenfeld, R.; Goland, S.; Meledin, V.; Haberman, D.; George, J.; Shimoni, S. Subclinical Myocardial Dysfunction in Patients Recovered from COVID-19 Disease: Correlation with Exercise Capacity. Biology 2021, 10, 1201. [Google Scholar] [CrossRef]
- Boden, W.E.; O’Rourke, R.A.; Teo, K.K.; Hartigan, P.M.; Maron, D.J.; Kostuk, W.J.; Knudtson, M.; Dada, M.; Casperson, P.; Harris, C.L.; et al. Optimal medical therapy with or without PCI for stable coronary disease. N. Engl. J. Med. 2007, 356, 1503–1516. [Google Scholar] [CrossRef]
- Patel, M.R.; Peterson, E.D.; Dai, D.; Brennan, J.M.; Redberg, R.F.; Anderson, H.V.; Brindis, R.G.; Douglas, P.S. Low diagnostic yield of elective coronary angiography. N. Engl. J. Med. 2010, 362, 886–895. [Google Scholar] [CrossRef]
- Engstrøm, T.; Kelbæk, H.; Helqvist, S.; Høfsten, D.E.; Kløvgaard, L.; Holmvang, L.; Jørgensen, E.; Pedersen, F.; Saunamäki, K.; Clemmensen, P.; et al. Complete revascularisation versus treatment of the culprit lesion only in patients with ST-segment elevation myocardial infarction and multivessel disease (DANAMI-3—PRIMULTI): An open-label, randomised controlled trial. Lancet 2015, 386, 665–671. [Google Scholar] [CrossRef] [PubMed]
- Hasselberg, N.E.; Haugaa, K.H.; Sarvari, S.I.; Gullestad, L.; Andreassen, A.K.; Smiseth, O.A.; Edvardsen, T. Left ventricular global longitudinal strain is associated with exercise capacity in failing hearts with preserved and reduced ejection fraction. Eur. Heart J. Cardiovasc. Imaging 2015, 16, 217–224. [Google Scholar] [CrossRef] [PubMed]
- Conraads, V.M.; Pattyn, N.; De Maeyer, C.; Beckers, P.J.; Coeckelberghs, E.; Cornelissen, V.A.; Denollet, J.; Frederix, G.; Goetschalckx, K.; Hoymans, V.Y.; et al. Aerobic interval training and continuous training equally improve aerobic exercise capacity in patients with coronary artery disease: The SAINTEX-CAD study. Int. J. Cardiol. 2015, 179, 203–210. [Google Scholar] [CrossRef] [PubMed]
- Ng, A.C.; Sitges, M.; Pham, P.N.; da Tran, T.; Delgado, V.; Bertini, M.; Nucifora, G.; Vidaic, J.; Allman, C.; Holman, E.R.; et al. Incremental value of 2-dimensional speckle tracking strain imaging to wall motion analysis for detection of coronary artery disease in patients undergoing dobutamine stress echocardiography. Am. Heart J. 2009, 158, 836–844. [Google Scholar] [CrossRef]
- Biering-Sørensen, T.; Hoffmann, S.; Mogelvang, R.; Zeeberg Iversen, A.; Galatius, S.; Fritz-Hansen, T.; Bech, J.; Jensen, J.S. Myocardial strain analysis by 2-dimensional speckle tracking echocardiography improves diagnostics of coronary artery stenosis in stable angina pectoris. Circ. Cardiovasc. Imaging 2014, 7, 58–65. [Google Scholar] [CrossRef]
- Gaibazzi, N.; Pigazzani, F.; Reverberi, C.; Porter, T.R. Rest global longitudinal 2D strain to detect coronary artery disease in patients undergoing stress echocardiography: A comparison with wall-motion and coronary flow reserve responses. Echo Res. Pract. 2014, 1, 61–70. [Google Scholar] [CrossRef]
- Evensen, K.; Sarvari, S.I.; Rønning, O.M.; Edvardsen, T.; Russell, D. Carotid artery intima-media thickness is closely related to impaired left ventricular function in patients with coronary artery disease: A single-centre, blinded, non-randomized study. Cardiovasc. Ultrasound 2014, 12, 39. [Google Scholar] [CrossRef]
- Shimoni, S.; Gendelman, G.; Ayzenberg, O.; Smirin, N.; Lysyansky, P.; Edri, O.; Deutsch, L.; Caspi, A.; Friedman, Z. Differential effects of coronary artery stenosis on myocardial function: The value of myocardial strain analysis for the detection of coronary artery disease. J. Am. Soc. Echocardiogr. Off. Publ. Am. Soc. Echocardiogr. 2011, 24, 748–757. [Google Scholar] [CrossRef]
- Maia, R.J.C.; Brandão, S.C.S.; Leite, J.; Parente, G.B.; Pinheiro, F.; Araújo, B.T.S.; Aguiar, M.I.R.; Martins, S.M.; Brandão, D.C.; Andrade, A.D. Global Longitudinal Strain Predicts Poor Functional Capacity in Patients with Systolic Heart Failure. Arq. Bras. De Cardiol. 2019, 113, 188–194. [Google Scholar] [CrossRef]


| Variable | GLS ≥ −17.6 (n = 61) | GLS < −17.6 (n = 47) | p-Value |
|---|---|---|---|
| Age (years) | 57.21 ± 10.89 | 60.96 ± 5.95 | 0.025 |
| Gender (%) | |||
| Male | 39 (63.93) | 28 (59.57) | 0.643 |
| Female | 22 (36.07) | 19 (40.43) | 0.643 |
| Height (cm) | 164.74 ± 7.19 | 163.12 ± 7.64 | 0.262 |
| Weight (kg) | 163.12 ± 7.64 | 66.29 ± 11.20 | 0.1 |
| BMI (kg/m2) | 25.65 ± 2.97 | 24.80 ± 3.03 | 0.145 |
| Comorbidities (%) | |||
| Hypertension | 31 (50.82) | 30 (63.83) | 0.176 |
| Diabetes | 18 (29.51) | 13 (27.66) | 0.833 |
| Dyslipidemia | 24 (39.34) | 13 (27.66) | 0.205 |
| SBP (mmHg) | 135.79 ± 28.73 | 142.04 ± 15.52 | 0.151 |
| DBP (mmHg) | 73.74 ± 15.21 | 73.55 ± 9.36 | 0.942 |
| HR (bpm) | 101.33 ± 13.30 | 98.28 ± 12.24 | 0.224 |
| Medications (%) | |||
| β-Blocker | 38 (62.30) | 24 (51.06) | 0.242 |
| ACE inhibitors/ARB | 22 (36.07) | 26 (55.32) | 0.046 * |
| Statin | 57 (93.44) | 47 (100.00) | 0.074 |
| Aspirin | 57 (93.44) | 44 (93.62) | 0.971 |
| Clopidogrel | 55 (90.16) | 46 (97.87) | 0.107 |
| CCB | 14 (22.95) | 14 (29.79) | 0.422 |
| Serum marker | |||
| Creatinine (umol/L) | 82.03 ± 23.00 | 76.82 ± 20.28 | 0.233 |
| CK (mmol/L) | 258.11 ± 802.31 | 96.77 ± 42.57 | 0.15 |
| Cholesterol (mmol/L) | 4.39 ± 1.30 | 4.05 ± 1.12 | 0.155 |
| Glucose (mmol/L) | 6.320 (5.4, 8.4) | 6.510 (5.9, 8.2) | 0.479 |
| HDL (mmol/L) | 1.050 (0.9, 1.3) | 1.080 (0.9, 1.2) | 0.942 |
| LDL (mmol/L) | 2.67 ± 1.03 | 2.35 ± 0.94 | 0.111 |
| Lipoprotein (a) (mmol/L) | 40.12 ± 47.97 | 45.81 ± 57.46 | 0.59 |
| Triglycerides (mmol/L) | 1.560 (1.0, 2.7) | 1.600 (0.9, 2.7) | 0.829 |
| Hemoglobin (g/L) | 137.49 ± 16.41 | 135.30 ± 16.79 | 0.507 |
| NT-proBNP | 315.26 ± 789.62 | 286.42 ± 1077.99 | 0.898 |
| IHD (%) | |||
| Non-PCI | 27 (44.26) | 28 (59.57) | 0.115 |
| PCI | 34 (55.74) | 19 (40.43) | 0.115 |
| Variables | GLS ≥ −17.6 (n = 61) | GLS < −17.6 (n = 47) | p-Value |
|---|---|---|---|
| GLS (%) | −14.68 ± 2.16 | −19.61 ± 1.45 | 0.000 |
| LVEDD (mm) | 47.68 ± 4.84 | 47.14 ± 4.68 | 0.568 |
| LVEF (%) | 0.580 (0.5,0.6) | 0.630 (0.6, 0.7) | 0.003 |
| E (cm/s) | 71.53 ± 24.19 | 71.02 ± 19.26 | 0.911 |
| A (cm/s) | 83.96 ± 24.05 | 75.27 ± 20.77 | 0.061 |
| E/A | 0.94 ± 0.44 | 0.96 ± 0.28 | 0.796 |
| E’ (cm/s) | 5.84 ± 1.76 | 6.23 ± 1.58 | 0.254 |
| A’ (cm/s) | 9.58 ± 2.28 | 9.64 ± 2.43 | 0.909 |
| RER@ AT | 1.02 ± 0.07 | 1.05 ± 0.06 | 0.030 * |
| VO2/kg@ AT (mL/kg/min) | 11.32 ± 1.92 | 12.22 ± 1.59 | 0.010 * |
| Load@ AT (w) | 52.52 ± 19.90 | 52.91 ± 13.11 | 0.908 |
| VE@ AT (L/min) | 24.80 ± 5.04 | 24.27 ± 4.42 | 0.573 |
| VE/kg@ AT (mL/kg/min) | 351.52 ± 73.47 | 368.50 ± 55.74 | 0.19 |
| VCO2/kg@ AT (mL/kg/min) | 11.57 ± 2.13 | 12.83 ± 2.08 | 0.003 ** |
| HR@ AT (beats) | 101.33 ± 13.30 | 98.28 ± 12.24 | 0.224 |
| Metabolic equivalents@ AT (Mets) | 3.24 ± 0.55 | 3.50 ± 0.45 | 0.009 ** |
| RER@ peak | 1.21 ± 0.09 | 1.24 ± 0.08 | 0.028 * |
| VO2/kg@ peak (mL/kg/min) | 17.01 ± 3.22 | 19.19 ± 3.42 | 0.001 ** |
| VO2 peak/predicted | 0.66 ± 0.14 | 0.76 ± 0.09 | 0.000 ** |
| Load@ peak (w) | 88.39 ± 30.73 | 92.60 ± 24.83 | 0.446 |
| VE@ peak (L/min) | 43.79 ± 10.89 | 45.82 ± 11.88 | 0.358 |
| VE/kg@ peak (mL/kg/min) | 622.35 ± 159.42 | 691.72 ± 145.81 | 0.022 * |
| VCO2/kg@ peak (mL/kg/min) | 20.65 ± 4.55 | 24.01 ± 5.30 | 0.001 ** |
| HR@ peak (beats) | 123.97 ± 18.77 | 126.09 ± 21.18 | 0.584 |
| Metabolic equivalents@ peak (Mets) | 4.86 ± 0.92 | 5.49 ± 0.97 | 0.001 |
| VE/VCO2 slope | 28.91 ± 5.83 | 26.65 ± 5.98 | 0.051 |
| dVO2/d Work rate (mL/min/watt) | 9.19 ± 1.77 | 9.72 ± 1.64 | 0.112 |
| FEV1 (L) | 2.44 ± 0.70 | 2.47 ± 0.61 | 0.8 |
| FVC (L) | 3.05 ± 0.79 | 3.13 ± 0.80 | 0.622 |
| FEV1/FVC (%) | 0.80 ± 0.09 | 0.80 ± 0.10 | 0.978 |
| VC max | 3.19 ± 0.79 | 3.23 ± 0.78 | 0.784 |
| Values | GLS | EF | ||
|---|---|---|---|---|
| r | p-Value | r | p-Value | |
| dVO2/dWR (mL/min/W) | −0.177 | 0.067 | −0.023 | 0.82 |
| VE @AT (L/min) | 0.007 | 0.944 | −0.064 | 0.526 |
| HR @AT (bpm) | 0.151 | 0.118 | −0.007 | 0.445 |
| Load @AT (watts) | −0.04 | 0.682 | 0.037 | 0.711 |
| RER@ AT | −0.305 | 0.001 ** | 0.081 | 0.421 |
| PETCO2 @AT (mmHg) | −0.274 | 0.004 ** | 0.187 | 0.062 |
| PETO2 @AT (mmHg) | 0.047 | 0.63 | −0.086 | 0.394 |
| Systolic BP@A (mmHg) | −0.077 | 0.431 | 0.144 | 0.151 |
| Diastolic BP@AT (mmHg) | 0.019 | 0.848 | 0.028 | 0.784 |
| VE/kg @AT (mL/kg/min) | −0.158 | 0.102 | 0.097 | 0.335 |
| VO2/kg @AT (mL/kg/min) | −0.267 | 0.005 ** | 0.202 | 0.042 |
| VCO2/kg @AT (mL/kg/min) | −0.335 | 0.000 ** | 0.192 | 0.054 |
| Metabolic equivalents (METs)@ AT | −0.271 | 0.005 ** | 0.205 | 0.04 |
| VE @peak (L/min) | −0.2 | 0.038 | −0.077 | 0.445 |
| HR @peak (bpm) | −0.098 | 0.313 | −0.087 | 0.39 |
| Load @peak (watts) | −0.151 | 0.118 | −0.025 | 0.808 |
| RER@ peak | −0.341 | 0.000 ** | 0.016 | 0.875 |
| PETCO2 @peak (mmHg) | −0.244 | 0.011 | 0.078 | 0.438 |
| PETO2 @peak (mmHg) | 0.035 | 0.717 | −0.126 | 0.209 |
| Systolic BP@peak (mmHg) | −0.167 | 0.085 | 0.131 | 0.19 |
| Diastolic BP@peak (mmHg) | −0.093 | 0.339 | −0.031 | 0.762 |
| VE/kg @peak (mL/kg/min) | −0.328 | 0.001 ** | 0.035 | 0.725 |
| VO2/kg @peak (mL/kg/min) | −0.432 | 0.000 ** | 0.075 | 0.459 |
| VCO2/kg @peak (mL/kg/min) | −0.456 | 0.000 ** | 0.068 | 0.499 |
| Metabolic equivalents (METs)@ peak | −0.438 | 0.000 ** | 0.076 | 0.448 |
| VE/VCO2slope | 0.257 | 0.007 ** | −0.242 | 0.015 |
| %PPeak VO2 (%) | −0.369 | 0.000 ** | 0.135 | 0.178 |
| VC max (L) | −0.087 | 0.369 | −0.045 | 0.655 |
| FEV1 (L) | −0.024 | 0.808 | −0.009 | 0.931 |
| FVC (L) | −0.1 | 0.308 | 0.004 | 0.966 |
| FEV1/FVC (%) | 0.116 | 0.238 | −0.019 | 0.852 |
| Variables | Univariate Analysis | Multivariate Analysis | ||||
|---|---|---|---|---|---|---|
| OR | 95%CI | p-Value | OR | 95%CI | p-Value | |
| Gender | 4 | 1.258–12.72 | 0.019 | 3.998 | 0.766–20.859 | 0.1 |
| Age | 0.869 | 0.791–0.954 | <0.01 | 0.793 | 0.684–0.919 | <0.01 |
| BMI | 0.824 | 0.681–0.997 | 0.047 | 0.663 | 0.487–0.903 | <0.01 |
| EF | 0.975 | 0.010–97.809 | 0.991 | 0.028 | 0.000–4.464 | 0.167 |
| GLS | 0.737 | 0.606–0.896 | <0.01 | 0.618 | 0.445–0.859 | <0.01 |
| LV | 0.946 | 0.844–1.060 | 0.34 | 0.876 | 0.731–1.05 | 0.152 |
Disclaimer/Publisher’s Note: The statements, opinions and data contained in all publications are solely those of the individual author(s) and contributor(s) and not of MDPI and/or the editor(s). MDPI and/or the editor(s) disclaim responsibility for any injury to people or property resulting from any ideas, methods, instructions or products referred to in the content. |
© 2022 by the authors. Licensee MDPI, Basel, Switzerland. This article is an open access article distributed under the terms and conditions of the Creative Commons Attribution (CC BY) license (https://creativecommons.org/licenses/by/4.0/).
Share and Cite
Zhang, S.; Liu, Y.; Jiang, L.; Wang, Z.; Liu, W.; Zuo, H. Diagnostic Accuracy of Global Longitudinal Strain for Detecting Exercise Intolerance in Patients with Ischemic Heart Disease. J. Cardiovasc. Dev. Dis. 2023, 10, 10. https://doi.org/10.3390/jcdd10010010
Zhang S, Liu Y, Jiang L, Wang Z, Liu W, Zuo H. Diagnostic Accuracy of Global Longitudinal Strain for Detecting Exercise Intolerance in Patients with Ischemic Heart Disease. Journal of Cardiovascular Development and Disease. 2023; 10(1):10. https://doi.org/10.3390/jcdd10010010
Chicago/Turabian StyleZhang, Sisi, Yujian Liu, Luying Jiang, Zhaozhao Wang, Wanjun Liu, and Houjuan Zuo. 2023. "Diagnostic Accuracy of Global Longitudinal Strain for Detecting Exercise Intolerance in Patients with Ischemic Heart Disease" Journal of Cardiovascular Development and Disease 10, no. 1: 10. https://doi.org/10.3390/jcdd10010010
APA StyleZhang, S., Liu, Y., Jiang, L., Wang, Z., Liu, W., & Zuo, H. (2023). Diagnostic Accuracy of Global Longitudinal Strain for Detecting Exercise Intolerance in Patients with Ischemic Heart Disease. Journal of Cardiovascular Development and Disease, 10(1), 10. https://doi.org/10.3390/jcdd10010010