
Correlation between the Cognitive Status (SIRT1) and the Metabolic Function in Geriatric Patients Using the Indonesian Version of the Montreal Cognitive Assessment (MoCA-INA)


Abstract
:1. Introduction
2. Materials and Methods
2.1. Ethics Approval and Informed Consent
2.2. Study Design and Population
2.3. Assessment of Clinical Chemistry Parameters
2.3.1. Glycated Hemoglobin (HbA1c)
2.3.2. Cystatin C
2.3.3. Low-Density Lipoprotein-Cholesterol (LDL-C)
2.4. Assessment of the Cognitive Status (MCI) Biomarker (SIRT1)
2.5. Statistical Analysis
3. Results
3.1. Characteristics of the Participants
3.2. Performance of the MoCA-Ina and Association with Demographic and Clinical Variables
4. Discussion
5. Conclusions
Author Contributions
Funding
Institutional Review Board Statement
Informed Consent Statement
Data Availability Statement
Conflicts of Interest
References
- Adioetomo, S.M.; Mujahid, G. UNFPA Indonesia Monograph Series No. 1: Indonesia on the Threshold of Population Ageing, 1st ed.; United Nations Population Fund (UNFPA): Toronto, ON, Canada, 2014. [Google Scholar]
- Violan, C.; Foguet-Boreu, Q.; Flores-Mateo, G.; Salisbury, C.; Blom, J.; Freitag, M.; Glynn, L.; Muth, C.; Valderas, J.M. Prevalence, determinants and patterns of multimorbidity in primary care: A systematic review of observational studies. PLoS ONE 2014, 9, e102149. [Google Scholar] [CrossRef]
- Kadambi, S.; Abdallah, M.; Loh, K.P. Multimorbidity, Function, and Cognition in Aging. Clin. Geriatr. Med. 2020, 36, 569–584. [Google Scholar] [CrossRef] [PubMed]
- Jiao, D.; Li, X.; Zhu, Z.; Zhang, J.; Liu, Y.; Cui, M.; Matsumoto, M.; Banu, A.A.; Sawada, Y.; Watanabe, T.; et al. Latent Subtype of Cognitive Frailty among Multimorbidity Older Adults and Their Association with Social Relationships. Healthcare 2023, 11, 1933. [Google Scholar] [CrossRef] [PubMed]
- He, Q.; Chu, J.; Chen, X.; Liu, S.; Han, Q.; Sun, N.; Shen, Y. Moderated mediation analysis of multimorbidity and health-related quality of life among the Chinese elderly: The role of functional status and cognitive function. Front. Psychol. 2022, 13, 978488. [Google Scholar]
- Petersen, R.C.; Smith, G.E.; Waring, S.C.; Ivnik, R.J.; Tangalos, E.G.; Kokmen, E. Mild cognitive impairment: Clinical characterization and outcome. Arch. Neurol. 1999, 56, 303–308. [Google Scholar] [CrossRef] [PubMed]
- Petersen, R.C. Mild cognitive impairment. Continuum 2016, 22, 404–418. [Google Scholar]
- Dunne, R.A.; Aarsland, D.; O’Brien, J.T.; Ballard, C.; Banerjee, S.; Fox, N.C.; Isaacs, J.D.; Underwood, B.R.; Perry, R.J.; Chan, D.; et al. Mild cognitive impairment: The Manchester consensus. Age Ageing 2021, 50, 72–80. [Google Scholar] [CrossRef]
- Pessoa, R.M.P.; Bomfim, A.J.L.; Ferreira, B.L.C.; Chagas, M.H.N. Diagnostic criteria and prevalence of mild cognitive impairment in older adults living in the community: A systematic review and meta-analysis. Arch. Clin. Psychiatry 2019, 46, 72–79. [Google Scholar] [CrossRef]
- Jackson, C.E.; Yu, M. Neurology Compensation and Productivity Report; 2023 Executive Summary; American Academy of Neurology: Minneapolis, MN, USA, 2023. [Google Scholar]
- D’Angelo, S.; Mele, E.; Di Filippo, F.; Viggiano, A.; Meccariello, R. Sirt1 activity in the brain: Simultaneous effects on energy homeostasis and reproduction. Int. J. Environ. Res. Public Health 2021, 18, 1243. [Google Scholar] [CrossRef]
- Elibol, B.; Kilic, U. High levels of SIRT1 expression as a protective mechanism against disease-related conditions. Front. Endocrinol. 2018, 9, 614. [Google Scholar] [CrossRef]
- Nasreddine, Z.S.; Phillips, N.A.; Bédirian, V.; Charbonneau, S.; Whitehead, V.; Collin, I.; Cummings, J.L.; Chertkow, H. The Montreal Cognitive Assessment, MoCA: A brief screening tool for mild cognitive impairment. J. Am. Geriatr. Soc. 2005, 53, 695–699, Erratum in J. Am. Geriatr. Soc. 2019, 67, 1991. [Google Scholar] [CrossRef]
- Tiffin-Richards, F.E.; Costa, A.S.; Holschbach, B.; Frank, R.D.; Vassiliadou, A.; Krüger, T.; Kuckuck, K.; Gross, T.; Eitner, F.; Floege, J.; et al. The Montreal Cognitive Assessment (MoCA)-a sensitive screening instrument for detecting cognitive impairment in chronic hemodialysis patients. PLoS ONE 2014, 9, e106700. [Google Scholar] [CrossRef] [PubMed]
- Rambe, A.S.; Fitri, F.I. Correlation between the Montreal Cognitive Assessment-Indonesian Version (Moca-INA) and the Mini-Mental State Examination (MMSE) in elderly. Open Access Maced. J. Med. Sci. 2017, 5, 915–919. [Google Scholar] [CrossRef] [PubMed]
- Akbar, N.L.; Effendy, E.; Camellia, V. The Indonesian version of Montreal Cognitive Assessment (MoCA-Ina): The difference scores between male schizophrenia prescribed by risperidone and adjunctive of donepezil in public hospital of Dr Pirngadi Medan, Indonesia. Open Access Maced. J. Med. Sci. 2019, 7, 1762–1767. [Google Scholar] [CrossRef] [PubMed]
- Chen, T.T.; Maevsky, E.I.; Uchitel, M.L. Maintenance of homeostasis in the aging hypothalamus: The central and peripheral roles of succinate. Front. Endocrinol. 2015, 6, 7. [Google Scholar] [CrossRef]
- Cho, S.H.; Chen, J.A.; Sayed, F.; Ward, M.E.; Gao, F.; Nguyen, T.A.; Krabbe, G.; Sohn, P.D.; Lo, I.; Minami, S.; et al. SIRT1 deficiency in microglia contributes to cognitive decline in aging and neurodegeneration via epigenetic regulation of IL-1β. J. Neurosci. 2015, 35, 807–818. [Google Scholar] [CrossRef] [PubMed]
- Fagerli, E.; Escobar, I.; Ferrier, F.J.; Jackson, C.W.; Lao, E.J.P.; Pinzon, M.A.P. Sirtuins and cognition: Implication for learning and memory in neurological disorder. Front. Physiol. 2022, 13, 908689. [Google Scholar] [CrossRef]
- Semadhi, M.P.; Muliaty, D.; Halimah, E.; Levita, J. Healthy mitochondrial DNA in balanced mitochondrial dynamics: A potential marker for neuro-aging prediction (Review). Biomed. Rep. 2023, 19, 64. [Google Scholar] [CrossRef]
- Binder, J.; Marczak, A.; Adler, G. Glycosylated hemoglobin and cognitive impairment in patients at a Memory Clinic. Int. J. Neurol. Neurother. 2017, 4, 069. [Google Scholar]
- Kumar, R.; Chaterjee, P.; Sharma, P.K.; Singh, A.K.; Gupta, A.; Gill, K.; Tripathi, M.; Dey, A.B.; Dey, S. Sirtuin1: A promising serum protein marker for early detection of Alzheimer’s disease. PLoS ONE 2013, 8, e61560. [Google Scholar] [CrossRef]
- Le Couteur, D.G.; Benson, V.L.; McMahon, A.C.; Blyth, F.; Handelsman, D.J.; Seibel, M.J.; Kennerson, M.; Naganathan, V.; Cumming, R.G.; de Cabo, R. Determinants of serum-induced SIRT1 expression in older men: The CHAMP Study. J. Gerontol. A Biol. Sci. Med. Sci. 2011, 66, 3–8. [Google Scholar] [CrossRef] [PubMed]
- Kilic, U.; Gok, O.; Erenberk, U.; Dundaroz, M.R.; Torun, E.; Kucukardali, Y.; Elibol-Can, B.; Uysal, O.; Dundar, T. A remarkable age-related increase in SIRT1 protein expression against oxidative stress in elderly: SIRT1 gene variants and longevity in human. PLoS ONE 2015, 10, e0117954. [Google Scholar] [CrossRef] [PubMed]
- Andersen, I.K.W.; Rungby, J.; Jorgensen, M.B.; Sandbaek, A.; Osler, M.; Andersen, M.K. Risk of dementia and cognitive dysfunction in individuals with diabetes or elevated blood glucose. Epidemiol. Psychiatr. Sci. 2019, 29, e43. [Google Scholar] [CrossRef] [PubMed]
- Xu, L.; Xiong, Q.; Du, Y.; Huang, L.W.; Yu, M. Nonlinear relationship between glycated hemoglobin and cognitive impairment after acute mild ischemic stroke. BMC Neurol. 2023, 23, 116. [Google Scholar] [CrossRef] [PubMed]
- Wang, J.; Luo, X.; Jin, X.; Lv, M.; Li, X.; Dou, J.; Zeng, J.; An, P.; Chen, Y.; Chen, K.; et al. Effects of preoperative HbA1c levels on the postoperative outcomes of coronary artery disease surgical treatment in patients with diabetes mellitus and nondiabetic patients: A systematic review and meta-analysis. J. Diabetes Res. 2020, 2020, 3547491. [Google Scholar] [CrossRef]
- Zhang, B.; Zhang, B.; Zhou, Z.; Guo, Y.; Wang, D. The value of glycosylated hemoglobin in the diagnosis of diabetic retinopathy: A systematic review and meta-analysis. BMC Endocr. Disord. 2021, 21, 82. [Google Scholar] [CrossRef] [PubMed]
- WHO. Guidelines Approved by the Guidelines Review Committee. Use of Glycated Haemoglobin (HbA1c) in the Diagnosis of Diabetes Mellitus: Abbreviated Report of a WHO Consultation; World Health Organization: Geneva, Switzerland, 2011. [Google Scholar]
- Chen, G.; Zhang, R.; Tan, C.; Liu, X.; Yu, L.; Chen, Y. Optimal glycated hemoglobin A1c value for prediabetes and diabetes in patients with pancreatic diseases. Front. Endocrinol. 2023, 14, 1208187. [Google Scholar] [CrossRef]
- Jørgensen, M.E.; Bjerregaard, P.; Borch-Johnsen, K.; Witte, D. New diagnostic criteria for diabetes: Is the change from glucose to HbA1c possible in all populations? J. Clin. Endocrinol. Metab. 2010, 95, E333–E336. [Google Scholar] [CrossRef]
- Ma, C.; Yin, Z.; Zhu, P.; Luo, J.; Shi, X.; Gao, X. Blood cholesterol in late-life and cognitive decline: A longitudinal study of the Chinese elderly. Mol. Neurodegener. 2017, 12, 24. [Google Scholar] [CrossRef]
- Burns, M.; Duff, K. Cholesterol in Alzheimer’s disease and tauopathy. Ann. N. Y. Acad. Sci. 2002, 977, 367–375. [Google Scholar] [CrossRef]
- Sabrina Schilling, S.; Tzourio, C.; Soumaré, A.; Kaffashian, S.; Dartigues, J.-F.; Ancelin, M.-L.; Samieri, C.; Dufouil, D.; Debette, S. Differential associations of plasma lipids with incident dementia and dementia subtypes in the 3C Study: A longitudinal, population-based prospective cohort study. PLoS Med. 2017, 14, e1002265. [Google Scholar] [CrossRef] [PubMed]
- Hua, R.; Ma, Y.; Li, C.; Zhong, B.; Xie, W. Low levels of low-density lipoprotein cholesterol and cognitive decline. Sci. Bull. 2021, 66, 1648–1690. [Google Scholar] [CrossRef] [PubMed]
- Zhang, L.; Li, R.; Hou, Y.; Cao, B.; Wei, Q.; Ou, R.; Liu, K.; Lin, J.; Yang, T.; Xiao, Y.; et al. Cystatin C predicts cognitive decline in multiple system atrophy: A1-year prospective cohort study. Front. Aging Neurosci. 2022, 14, 1069837. [Google Scholar] [CrossRef] [PubMed]
- Chen, X.; Huang, Y.; Bao, T.; Jia, F.; Ou, R.; Wei, Q.; Chen, Y.; Liu, J.; Yang, J.; Shang, H. Changes in serum Cystatin C levels and the associations with cognitive function in Alzheimer’s disease patients. Front. Aging Neurosci. 2022, 13, 790939. [Google Scholar] [CrossRef] [PubMed]
- Fernando, S.; Polkinghorne, K.R. Cystatin C: Not just a marker of kidney function. J. Bras. Nefrol. 2020, 42, 6–7. [Google Scholar] [CrossRef] [PubMed]
- Mussap, M.; Plebani, M. Biochemistry and clinical role of human cystatin C. Crit. Rev. Clin. Lab. Sci. 2004, 41, 467–550. [Google Scholar] [CrossRef]
- Odden, M.C.; Tager, I.B.; Gansevoort, R.T.; Bakker, S.J.; Katz, R.; Fried, L.F.; Newman, A.B.; Canada, R.B.; Harris, T.; Sarnak, M.J.; et al. Age and cystatin C in healthy adults: A collaborative study. Nephrol. Dial. Transplant. 2010, 25, 463–469. [Google Scholar] [CrossRef]
- Lewis, J.; Greene, T.; Appel, L.; Contreras, G.; Douglas, J.; Lash, J.; Toto, R.; Van Lente, F.; Wang, X.; Wright, J.T., Jr.; et al. A comparison of iothalamate-GFR and serum creatinine-based outcomes: Acceleration in the rate of GFR decline in the African American Study of Kidney Disease and Hypertension. J. Am. Soc. Nephrol. 2004, 15, 3175–3183. [Google Scholar] [CrossRef]
- Dutra, M.C.; Uliano, E.J.; Machado, D.F.; Martins, T.; Schuelter-Trevisol, F.; Trevisol, D.J. Assessment of kidney function in the elderly: A population-based study. J. Bras. Nefrol. 2014, 36, 297–303. [Google Scholar] [CrossRef]
- Zhang, Y.P.; Zuo, X.C.; Huang, Z.J.; Kuang, Z.M.; Lu, M.G.; Duan, D.D.; Yuan, H. The impact of blood pressure on kidney function in the elderly: A cross-sectional study. Kidney Blood Press. Res. 2013, 38, 205–216. [Google Scholar] [CrossRef]
- Luo, B.; Luo, Z.; Zhang, X.; Xu, M.; Shi, C. Status of cognitive frailty in elderly patients with chronic kidney disease and construction of a risk prediction model: A cross-sectional study. BMJ Open 2022, 12, e060633. [Google Scholar] [CrossRef] [PubMed]
- Drenth-van Maanen, A.C.; Jansen, P.A.; Proost, J.H.; Egberts, T.C.; van Zuilen, A.D.; van der Stap, D.; van Marum, R.J. Renal function assessment in older adults. Br. J. Clin. Pharmacol. 2013, 76, 616–623. [Google Scholar] [CrossRef] [PubMed]

| Demographics | Male | Female | p |
|---|---|---|---|
| Age (years) | 67 | 68 | 0.025 |
| Body weight (kg) | 51.4 | 63.3 | 0.378 |
| Clinical chemistry parameter | |||
| HbA1c NGSP (%) | 5.7 ± 0.9 | 5.9 ± 0.1 | 0.790 |
| HbA1c IFCC (mmol/mol) | 39.5 ± 1.0 | 41.3 ± 1.3 | 0.882 |
| LDL-C (mg/dL) | 140.4 ± 4.8 | 137.8 ± 4.2 | 0.258 |
| Cystatin C (mg/dL) | 1.04 ± 0.03 | 0.99 ± 0.02 | 0.326 |
| GFR Creatinine-Cystatin (mL/min/1.73 m2) | 76.2 ± 2.1 | 80.1 ± 2.0 | 0.252 |
| Cognitive status biomarker | |||
| SIRT1 (ng/mL) | 0.243 ± 0.005 | 0.230 ± 0.018 | <0.05 ** |
| Cognitive Assessment result | |||
| MoCA-Ina Score | 22 | 20 | 0.463 |
| MoCA-Ina Scoring | |||||||
|---|---|---|---|---|---|---|---|
| Severe-Moderate Cognitive Impairment | Mild Cognitive Impairment | Normal Cognitive | |||||
| Demographics | MoCA-Ina Score ≤17 (N = 20) | MoCA-Ina Score 18–25 (N = 76) | MoCA-Ina Score ≥ 26 (N = 24) | p | |||
| Male | Female | Male | Female | Male | Female | ||
| Age (years) | 66 | 70 | 67 | 68 | 65 | 66 | 0.692 |
| Body weight (kg) | 64 | 55 | 66 | 61 | 66 | 63 | 0.513 |
| Clinical chemistry parameter | |||||||
| HbA1c NGSP (%) | 6.1 ± 0.5 | 6.1 ± 0.4 | 5.8 ± 0.1 | 5.9 ± 0.1 | 5.4 ± 0.2 | 5.4 ± 0.3 | <0.05 ** |
| HbA1c IFCC (mmol/mol) | 42.8 ± 5.1 | 42.8 ± 3.8 | 40.2 ± 1.2 | 40.9 ± 1.5 | 35.9 ± 1.7 | 36.3 ± 3.0 | <0.05 ** |
| LDL-C (mg/dL) | 155.0 ± 19.5 | 142.8 ± 8.0 | 139.7 ± 5.7 | 138.6 ± 6.0 | 135.1 ± 9.0 | 128 ± 7.8 | <0.05 ** |
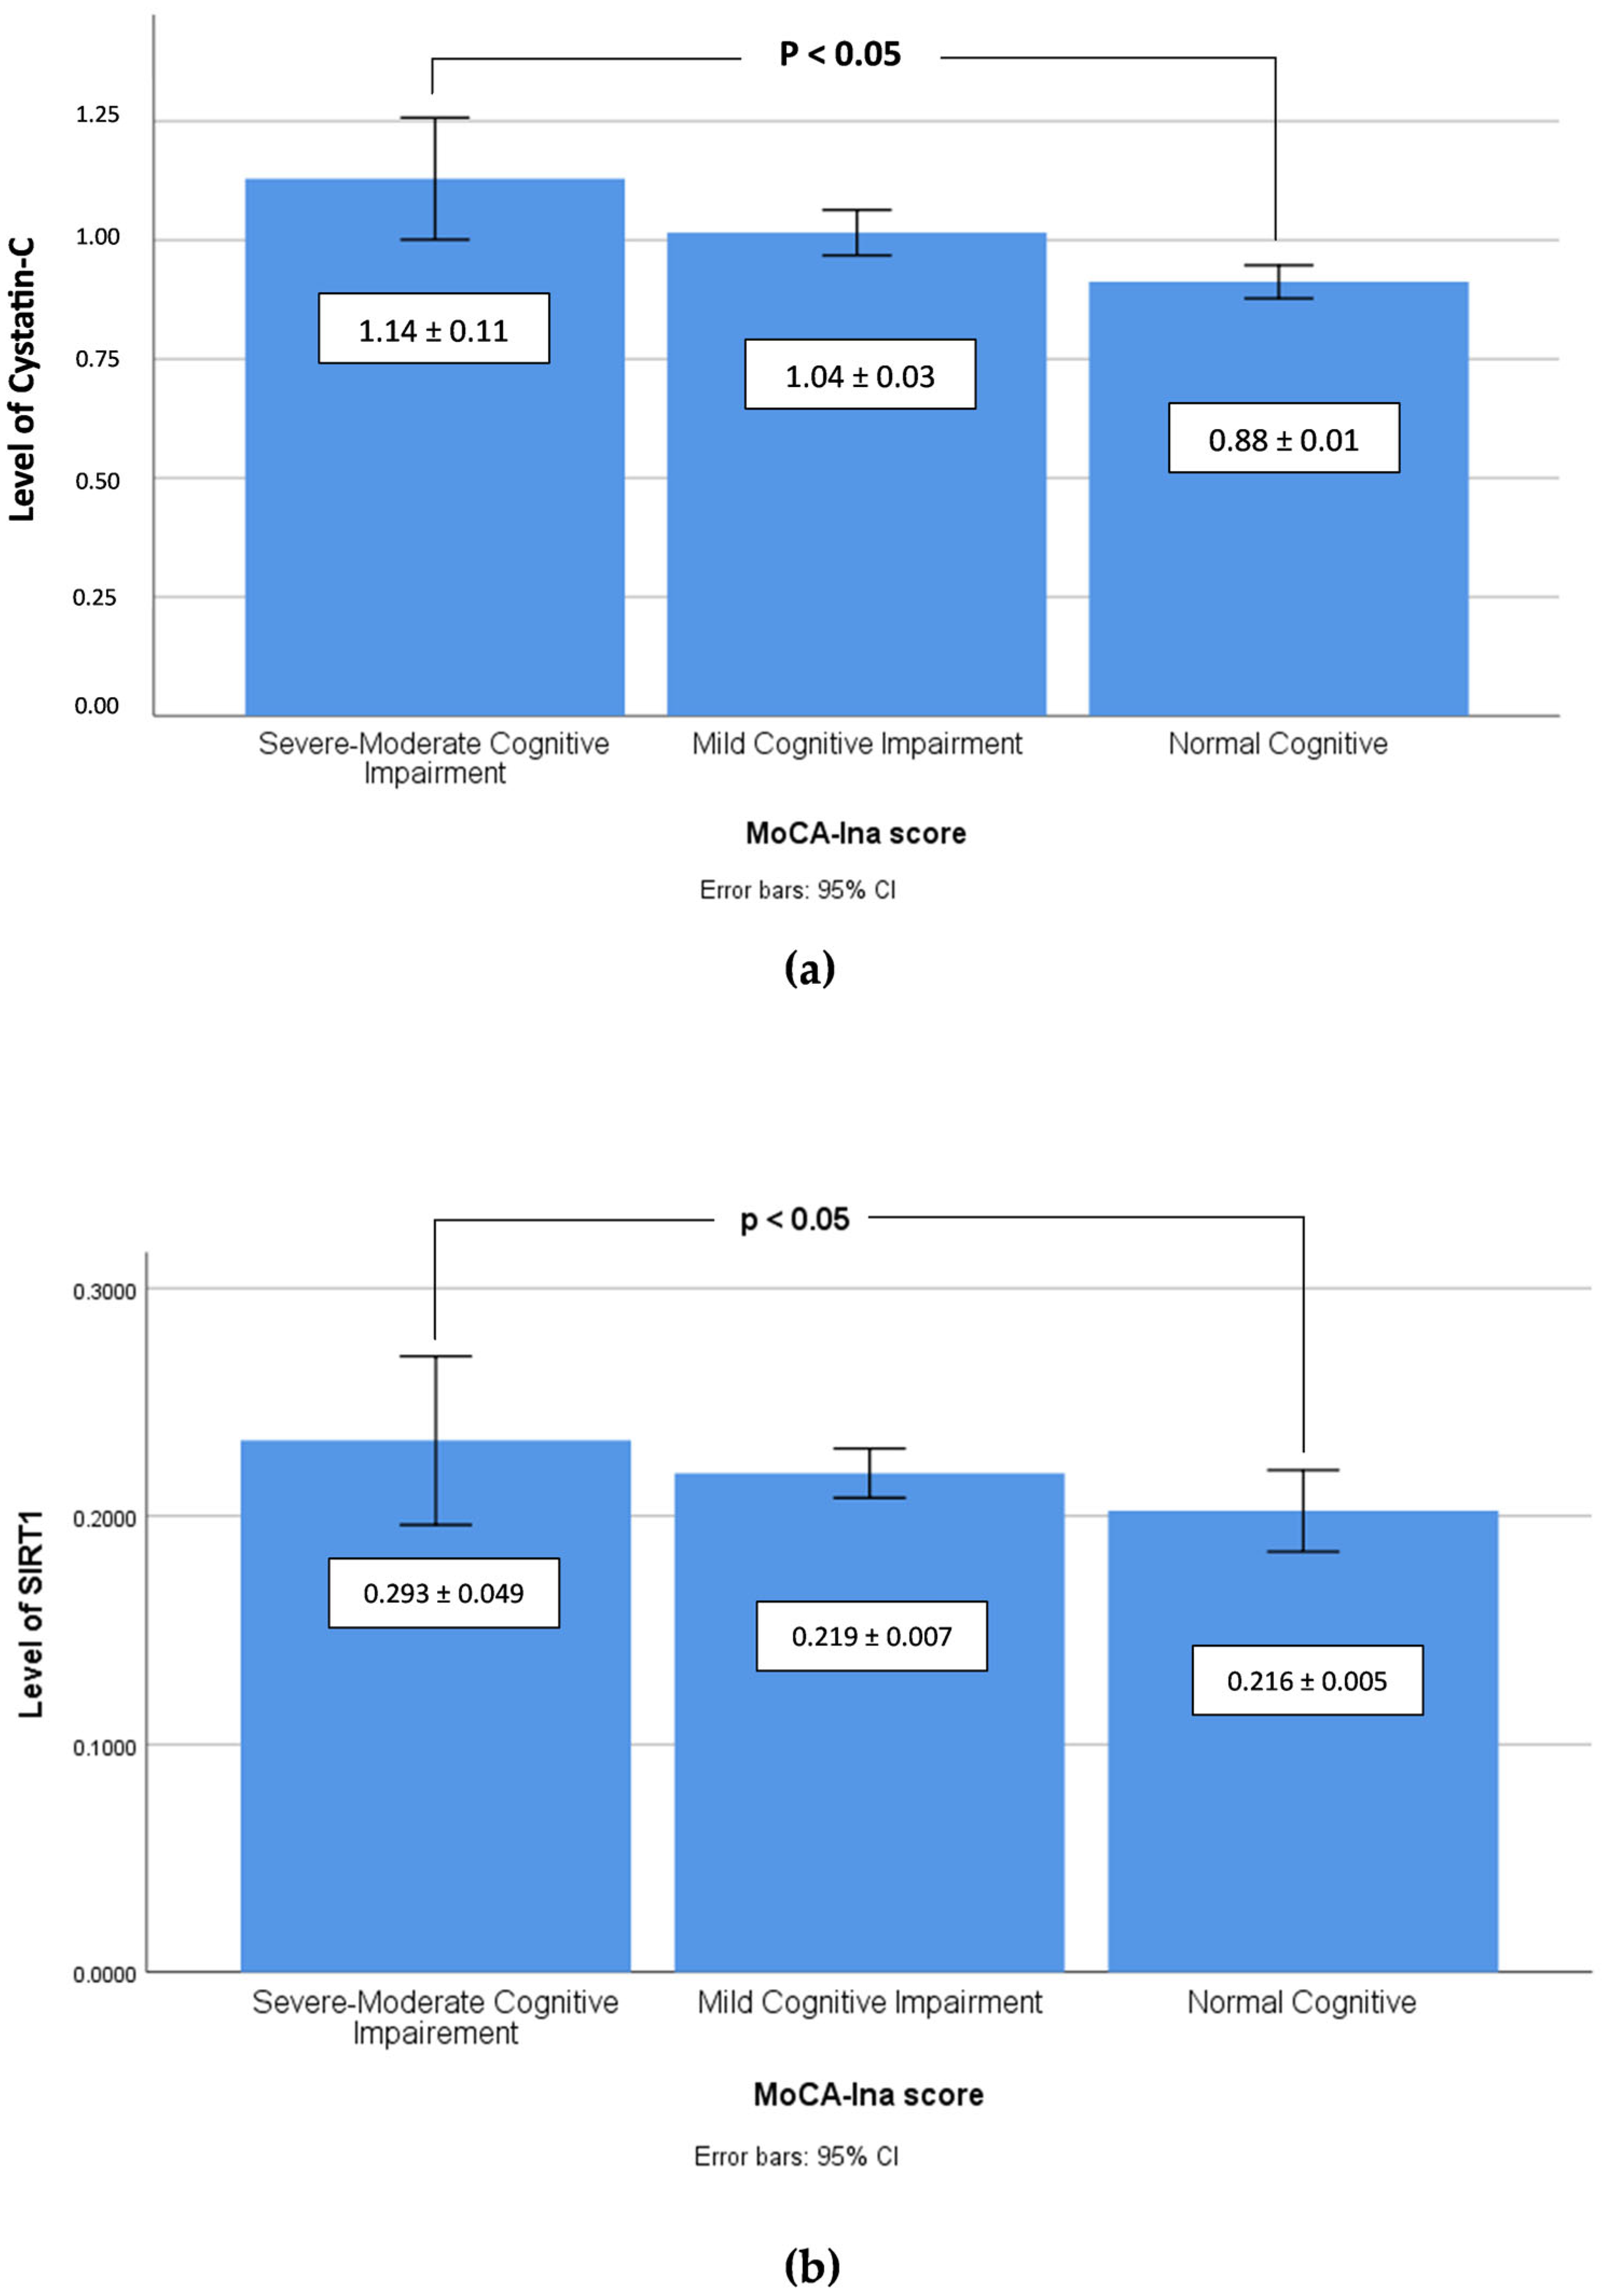
| Cystatin C (mg/dL) | 1.2 ± 0.1 | 1.1 ± 0.1 | 1.1 ± 0.0 | 1.0 ± 0.0 | 0.9 ± 0.0 | 0.9 ± 0.0 | <0.05 ** |
| GFR Creatinine-Cystatin (mL/min/1.73 m2) | 65.5 ± 7.3 | 72.5 ± 5.7 | 74.8 ± 2.6 | 81.4 ± 2.4 | 86.1 ± 3.0 | 85.3 ± 3.0 | <0.05 ** |
| Cognitive status biomarker | |||||||
| SIRT1 (ng/mL) | 0.225 ± 0.015 | 0.338 ± 0.793 | 0.215 ± 0.006 | 0.223 ± 0.009 | 0.213 ± 0.003 | 0.205 ± 0.006 | <0.05 ** |
| Correlation to MoCA-Ina Scoring | ||||||
|---|---|---|---|---|---|---|
| Severe-Moderate Cognitive Impairment (N = 20) | Mild Cognitive Impairment (N = 76) | Normal Cognitive (N = 24) | ||||
| Clinical Chemistry Parameter | Coefficient Correlation | p | Coefficient Correlation | p | Coefficient Correlation | p |
| HbA1c NGSP (%) | 0.256 * | <0.05 * | −0.224 * | <0.05 * | −0.062 | 0.773 |
| HbA1c IFCC (mmol/mol) | 0.254 * | <0.05 * | −0.224 * | <0.05 * | −0.062 | 0.773 |
| LDL-C (mg/dL) | 0.129 | 0.588 | 0.142 | 0.206 | −0.181 | 0.397 |
| Cystatin C (mg/dL) | 0.266 * | <0.05 * | −0.295 * | <0.05 * | −0.018 | 0.935 |
| GFR Creatinine-Cystatin (ml/min/1.73 m2) | −0.787 * | <0.05 * | 0.296 * | <0.05 * | 0.004 | 0.985 |
| Cognitive status biomarker | ||||||
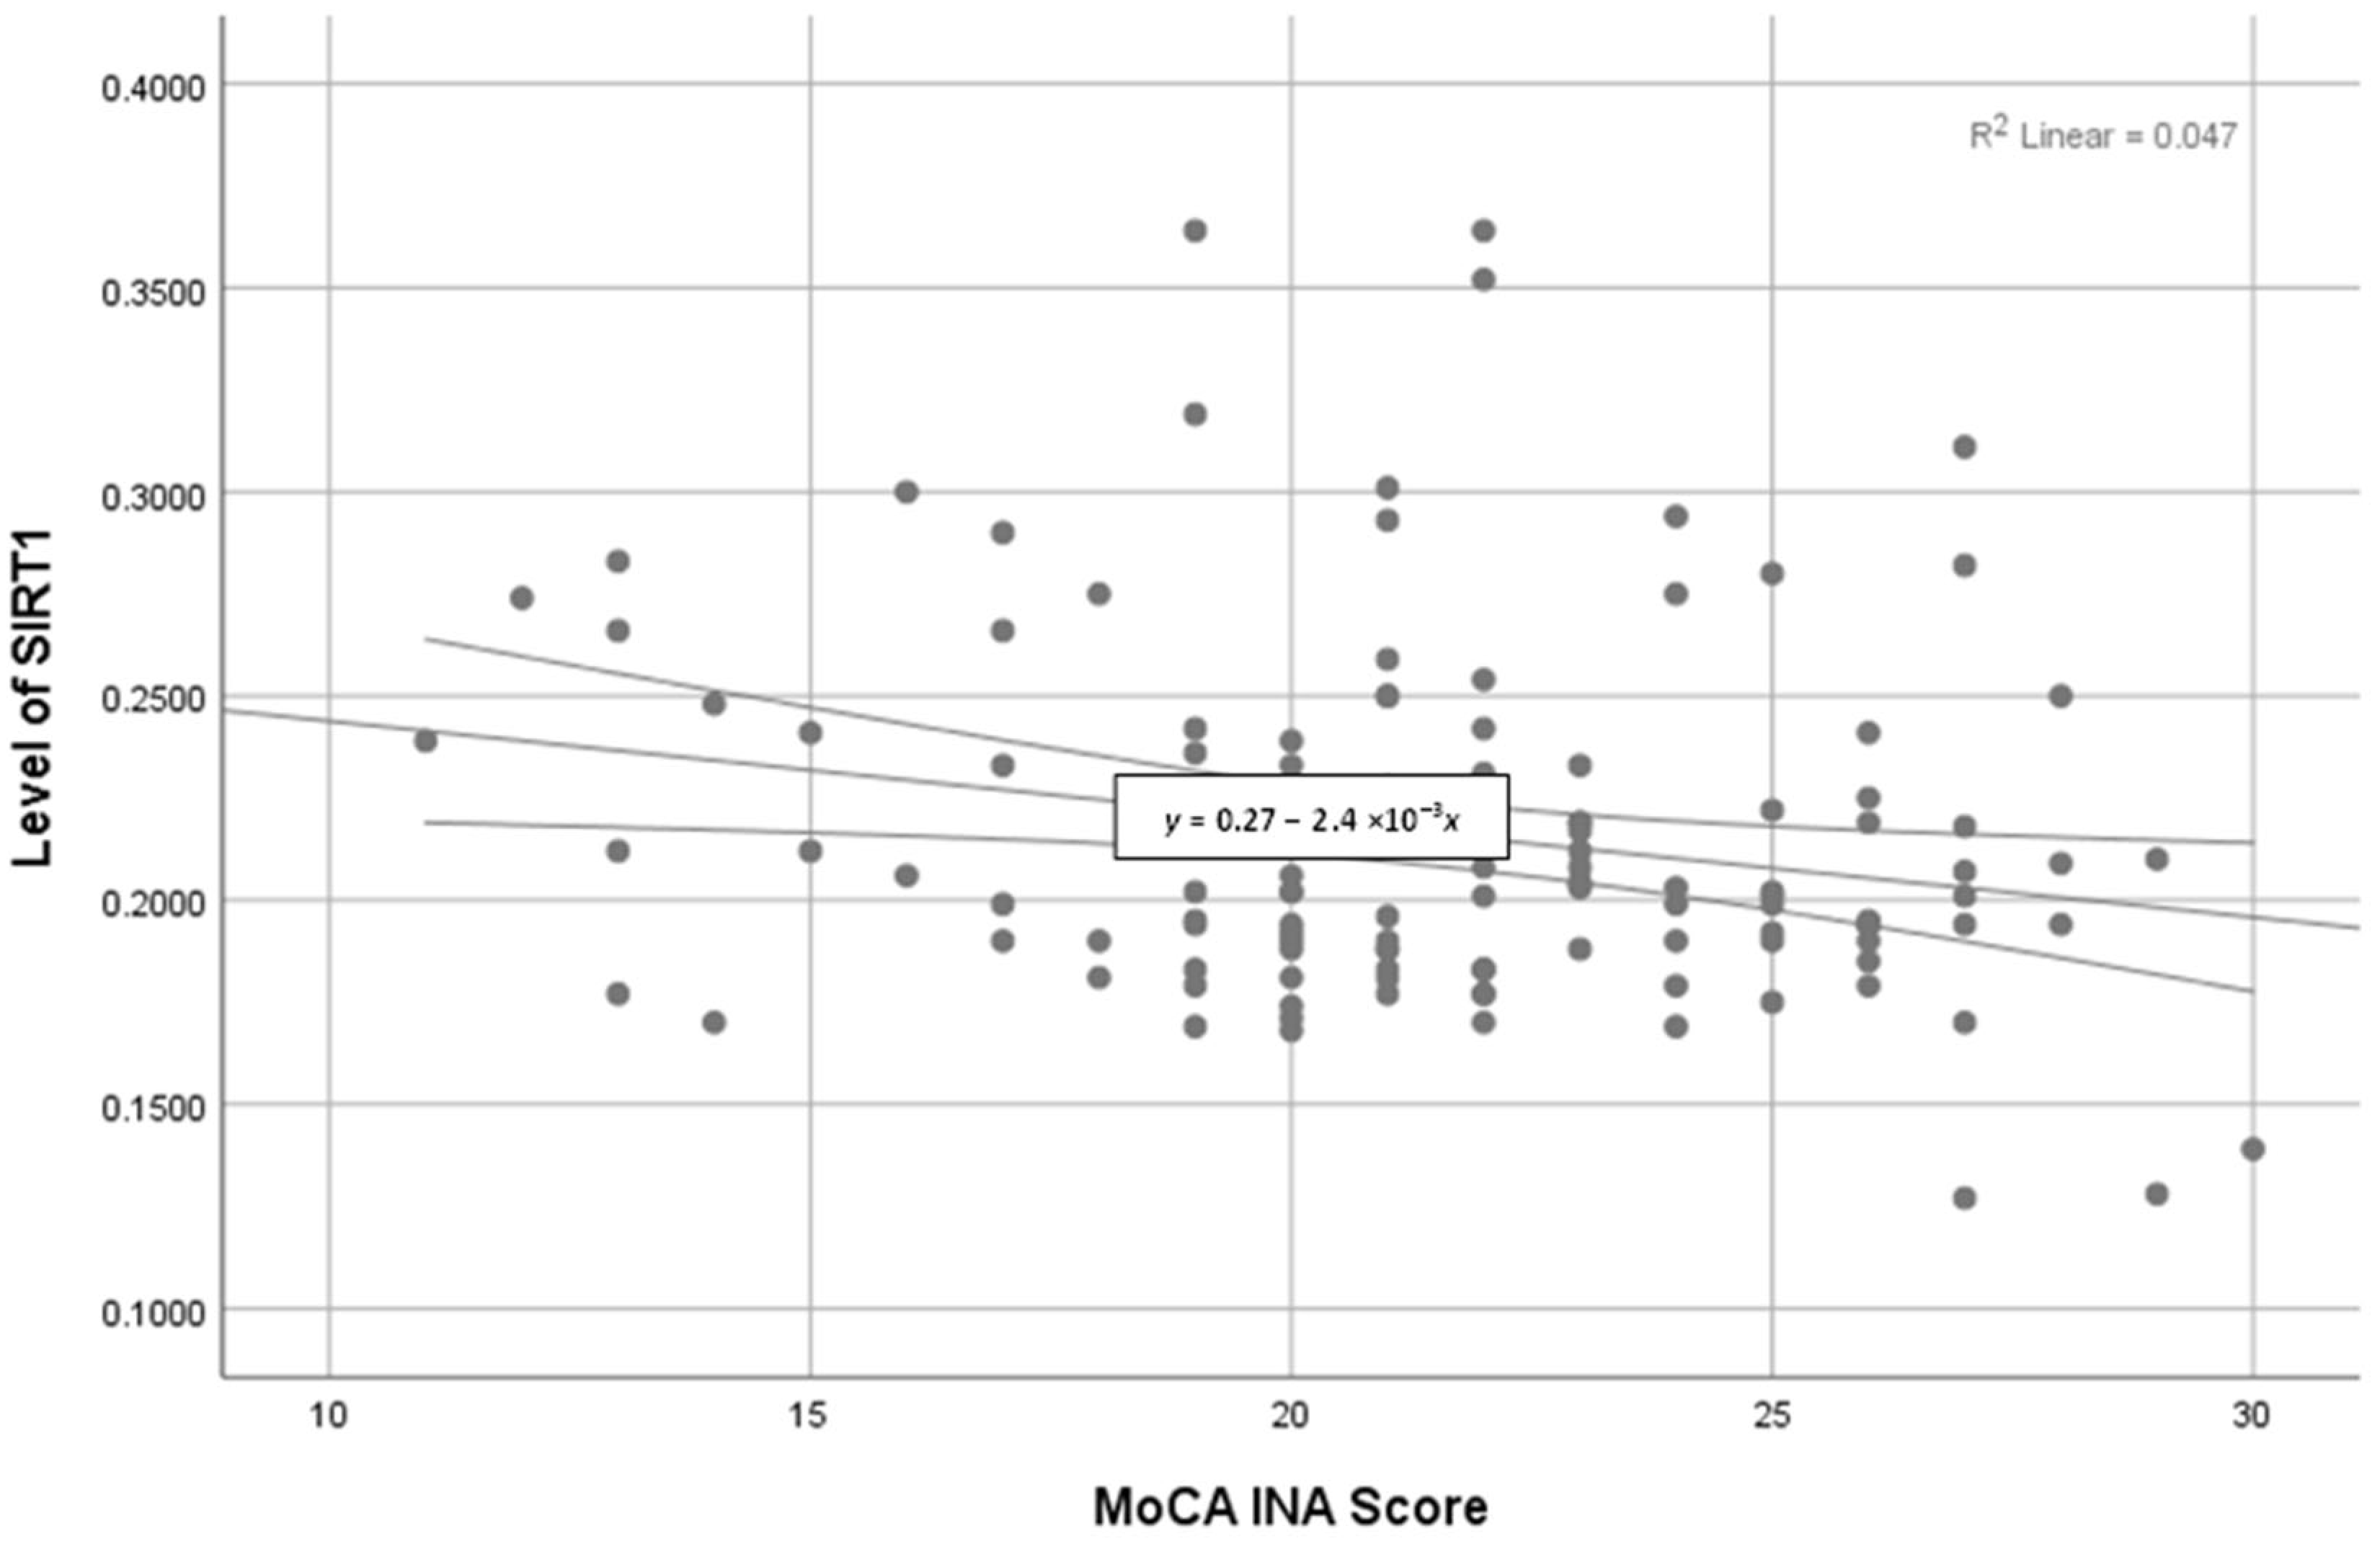
| SIRT1 (ng/mL) | −0.502 * | <0.05 * | 0.069 | 0.543 | 0.437 * | <0.05 * |
| Correlation to SIRT1 | ||||||
|---|---|---|---|---|---|---|
| Severe-Moderate Cognitive Impairment (N = 20) | Mild Cognitive Impairment (N = 76) | Normal Cognitive (N = 24) | ||||
| Clinical Chemistry Parameter | Coefficient Correlation | p | Coefficient Correlation | p | Coefficient Correlation | p |
| HbA1c NGSP (%) | −0.216 * | <0.05 * | −0.204 * | <0.05 * | −0.192 * | <0.05 * |
| HbA1c IFCC (mmol/mol) | −0.224 * | <0.05 * | −0.234 * | <0.05 * | −0.182 * | <0.05 * |
| LDL-C (mg/dL) | −0.109 | 0.548 | −0.132 | 0.236 | −0.121 | 0.397 |
| Cystatin C (mg/dL) | 0.207 * | <0.05 * | 0.275 * | <0.05 * | 0.218 * | <0.05 * |
| GFR Creatinine-Cystatin (mL/min/1.73 m2) | −0.187 * | <0.05 * | −0.196 * | <0.05 * | −0.204 | <0.05 * |
| Cognitive Assessment Result | ||||||
| MoCA-Ina score | −0.502 * | <0.05 * | 0.069 | 0.543 | 0.437 * | <0.05 * |
| Correlation to Age | ||||||
|---|---|---|---|---|---|---|
| Severe-Moderate Cognitive Impairment (N = 20) | Mild Cognitive Impairment (N = 76) | Normal Cognitive (N = 24) | ||||
| Clinical Chemistry Parameter | Coefficient Correlation | p | Coefficient Correlation | p | Coefficient Correlation | p |
| HbA1c NGSP (%) | 0.140 | 0.556 | 0.050 | 0.657 | 0.292 | 0.166 |
| HbA1c IFCC (mmol/mol) | 0.140 | 0.556 | 0.050 | 0.657 | 0.277 | 0.189 |
| LDL-C (mg/dL) | −0.275 | 0.240 | −0.010 | 0.927 | −0.018 | 0.933 |
| Cystatin C (mg/dL) | 0.040 | 0.867 | 0.144 | 0.202 | −0.065 | 0.764 |
| GFR Creatinine-Cystatin (mL/min/1.73 m2) | −0.032 | 0.892 | −0.120 | 0.288 | 0.031 | 0.884 |
| Cognitive Assessment Result | ||||||
| SIRT1 (ng/mL) | −0.029 | 0.549 | −0.002 | 0.987 | −0.268 | 0.205 |
| MoCA-Ina score | −0.383 | 0.305 | −0.064 | 0.571 | −0.186 | 0.385 |
Disclaimer/Publisher’s Note: The statements, opinions and data contained in all publications are solely those of the individual author(s) and contributor(s) and not of MDPI and/or the editor(s). MDPI and/or the editor(s) disclaim responsibility for any injury to people or property resulting from any ideas, methods, instructions or products referred to in the content. |
© 2023 by the authors. Licensee MDPI, Basel, Switzerland. This article is an open access article distributed under the terms and conditions of the Creative Commons Attribution (CC BY) license (https://creativecommons.org/licenses/by/4.0/).
Share and Cite
Semadhi, M.P.; Muliaty, D.; Halimah, E.; Levita, J. Correlation between the Cognitive Status (SIRT1) and the Metabolic Function in Geriatric Patients Using the Indonesian Version of the Montreal Cognitive Assessment (MoCA-INA). Geriatrics 2023, 8, 119. https://doi.org/10.3390/geriatrics8060119
Semadhi MP, Muliaty D, Halimah E, Levita J. Correlation between the Cognitive Status (SIRT1) and the Metabolic Function in Geriatric Patients Using the Indonesian Version of the Montreal Cognitive Assessment (MoCA-INA). Geriatrics. 2023; 8(6):119. https://doi.org/10.3390/geriatrics8060119
Chicago/Turabian StyleSemadhi, Made Putra, Dewi Muliaty, Eli Halimah, and Jutti Levita. 2023. "Correlation between the Cognitive Status (SIRT1) and the Metabolic Function in Geriatric Patients Using the Indonesian Version of the Montreal Cognitive Assessment (MoCA-INA)" Geriatrics 8, no. 6: 119. https://doi.org/10.3390/geriatrics8060119
APA StyleSemadhi, M. P., Muliaty, D., Halimah, E., & Levita, J. (2023). Correlation between the Cognitive Status (SIRT1) and the Metabolic Function in Geriatric Patients Using the Indonesian Version of the Montreal Cognitive Assessment (MoCA-INA). Geriatrics, 8(6), 119. https://doi.org/10.3390/geriatrics8060119