1. Introduction
Population ageing has increased the number of clinical decisions in which the expected time to benefit matters [
1,
2]. In older adults, the balance of benefits and burdens of cancer screening, preventive treatment, rehabilitation, treatment intensification, deprescribing, and advance care planning often depends on whether a person is likely to survive for a clinically relevant period. Prognostic indices can support these discussions, but many require participant-level variables, fitted regression coefficients, or web calculators that are not readily interpretable during routine consultation [
3,
4,
5,
6].
The hazard ratio (HR) remains one of the most common effect measures in survival analysis and is central to the Cox proportional hazards model [
7]. Its interpretation nevertheless remains debated because of non-collapsibility, selection over follow-up, dependence on the proportional hazards assumption, and the gap between relative hazards and absolute survival probabilities [
8,
9,
10]. Even when an HR is statistically valid within its source study, readers may still need to understand what an HR of 1.5, 2.0, or 3.0 implies for remaining years of life at a given age.
Life-table methods provide a direct route from age-specific mortality to survival probabilities and remaining years of life [
11]. Proportional changes in mortality hazards have previously been combined with life tables for quantitative impact assessment and estimation of changes in life expectancy [
12,
13]. Age-based translations of mortality ratios, including effective-age and longevity measures, have also been developed as communication tools under assumptions about proportional hazards and age-related mortality patterns [
14,
15]. In Japan, complete life tables provide publicly available age- and sex-specific one-year probabilities of death [
16]. These data allow specified HRs to be translated into absolute remaining-lifespan measures without presenting the result as a newly fitted patient-level prediction model.
The objective of this study was to construct a reproducible age–sex–HR reference grid for Japanese older adults. Specified mortality HR inputs were translated into median remaining lifespan, mean remaining years, fixed-time survival probabilities, and a baseline-equivalent age shift. We also quantified agreement with official remaining life expectancy, propagated an illustrative HR confidence interval through the transformation, and examined purely hypothetical time-varying HR sequences. The scenario analyses were disease-neutral and were not intended as predictions for any clinical condition.
2. Materials and Methods
2.1. Study Design
This was a deterministic life-table translation study. No participant-level data were used, no regression coefficients were estimated, and no calibration or discrimination analysis was attempted. The life-table baseline represented the Japanese general population in the 23rd Complete Life Tables for Japan, 2020 [
16]. The intended output is a reference translation of specified mortality HR multipliers. The grid does not establish whether an HR reported in another study is transportable to the life-table baseline.
2.2. Life-Table Data
We extracted the age- and sex-specific one-year probability of death, denoted by
, from the national male and female tables of the 23rd Complete Life Tables for Japan, where
is attained age and
is sex [
16]. The HR of 1.00 in this study represents the general-population life-table baseline. It does not represent a disease-free, frailty-free, cancer-free, or otherwise unexposed population. This distinction is central to the interpretation of the results because the general population already contains people with chronic diseases, disability, and high-risk conditions at their prevailing frequencies.
We also transcribed the official remaining life expectancy reported for the 12 age–sex index cells. The published death probabilities terminate at age 113 years in men and 114 years in women; to close the survival curve, we assigned a death probability of 1.0 at the next attained age. For the index ages studied, this terminal closure changed computed mean remaining years by less than 0.00001 years. Agreement between calculated mean remaining years at an HR of 1.00 and the official values was summarized by the mean absolute error, maximum absolute difference, mean absolute percentage error, and maximum absolute percentage error. Because the published one-year death probabilities and official remaining-life-expectancy values are reported to five and two decimal places, respectively, the agreement measures primarily reflect finite source precision and the trapezoidal integration step rather than participant-level model error.
2.3. Hazard Ratio Transformation
For each age and sex, we treated a specified HR as a multiplier of the annual life-table hazard. In discrete time, the transformed one-year probability of death was calculated as , where is the HR and is the transformed probability for age and sex . Conditional survival from index age to integer residual time was calculated as . Median remaining lifespan was defined as the first residual time at which survival reached 0.5, with within-year interpolation given by , where . Mean remaining years were calculated by trapezoidal integration of the annual survival curve. For a time-dependent scenario, we replaced the single by a sequence at residual year .
The fixed-HR grid applies the same multiplier at every attained age and annual interval over the remaining-life trajectory. This is a proportional-hazards input assumption, not an empirical finding. The reference grid itself uses hypothetical multipliers defined against the same life-table baseline and therefore does not require transfer of an estimate from another cohort. Applying an HR reported in an external study is a separate step that assumes compatibility of the mortality endpoint, comparator, adjustment set, target population, and time pattern with the Japanese general-population baseline. Because HRs are non-collapsible and these elements often differ, an external HR should not be treated as a disease-versus-population multiplier without explicit justification [
8,
9,
10].
2.4. Reference-Grid Analyses
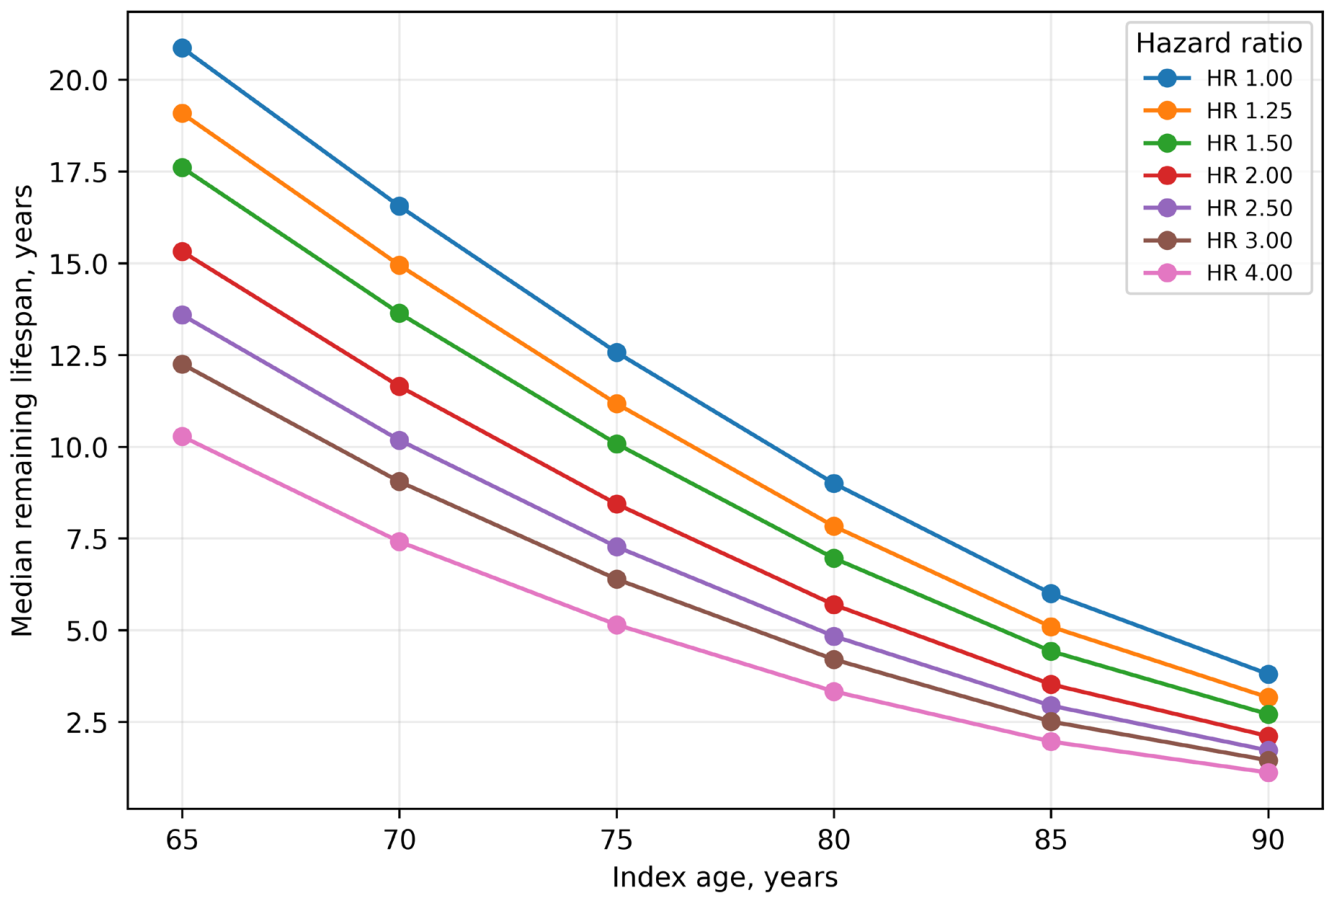
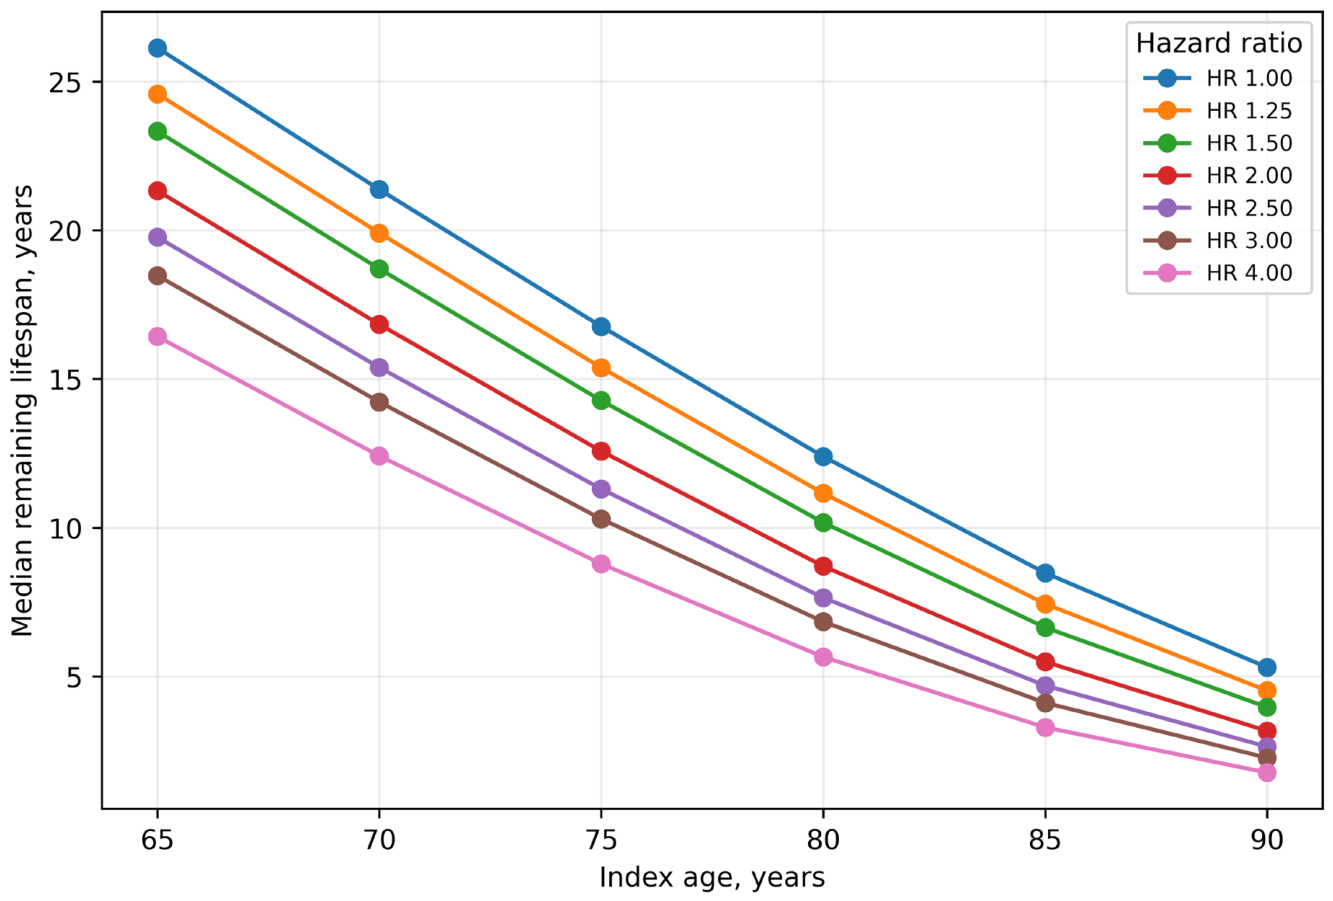
We evaluated index ages of 65, 70, 75, 80, 85, and 90 years for men and women. The primary HR grid included 1.00, 1.25, 1.50, 2.00, 2.50, 3.00, and 4.00. These values were prespecified for interpretability and range coverage rather than selected by a formal frequency analysis of published HRs. An HR of 1.00 defined the life-table baseline; HRs of 1.25 and 1.50 represented modest increments; and HRs of 2.00–4.00 covered larger multipliers while keeping the table compact. Denser spacing near an HR of 1.00 provided additional resolution where the absolute change per HR increment was largest. For each age–sex–HR cell, we calculated median remaining lifespan, mean remaining years, and 1-, 3-, 5-, and 10-year survival. The 5-year horizon was selected as a compact intermediate illustration, not as a universally preferred decision horizon; all four horizons are supplied in machine-readable form.
To provide an age-based communication metric, we defined the baseline-equivalent age for each fixed-HR cell as the age on the sex-specific HR 1.00 curve with the same median remaining lifespan, using linear interpolation between adjacent attained ages. The baseline-equivalent age shift was the matched age minus the index age. This measure is related to prior effective-age and age-based translations of mortality ratios [
14,
15], but its matching rule is defined specifically by equality of median remaining lifespan on the population-average Japanese life-table baseline, rather than by matching an age-specific hazard or life-expectancy quantity. It is an actuarial comparison, not a biological age or patient-level prediction. To examine where approximate age invariance weakened, we fitted ordinary least-squares regressions of the natural logarithm of annual hazards derived from the one-year death probabilities on attained age over the age ranges of 65–89 and 100–110 years. The fitted Gompertz slopes were used only as shape diagnostics for the published life-table mortality curves and did not enter the translation calculations.
2.5. Illustrative Input-Uncertainty and Time-Pattern Analyses
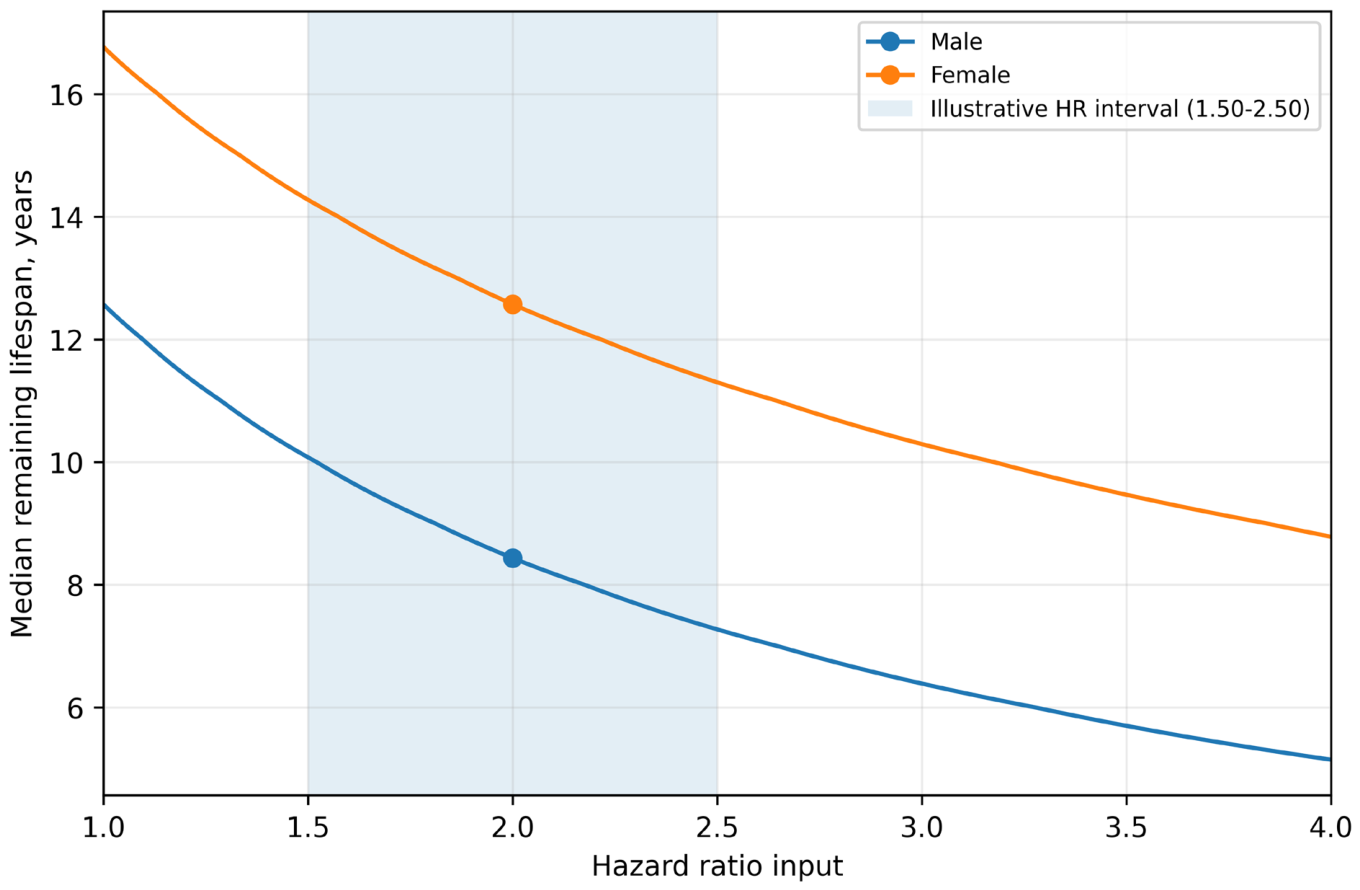
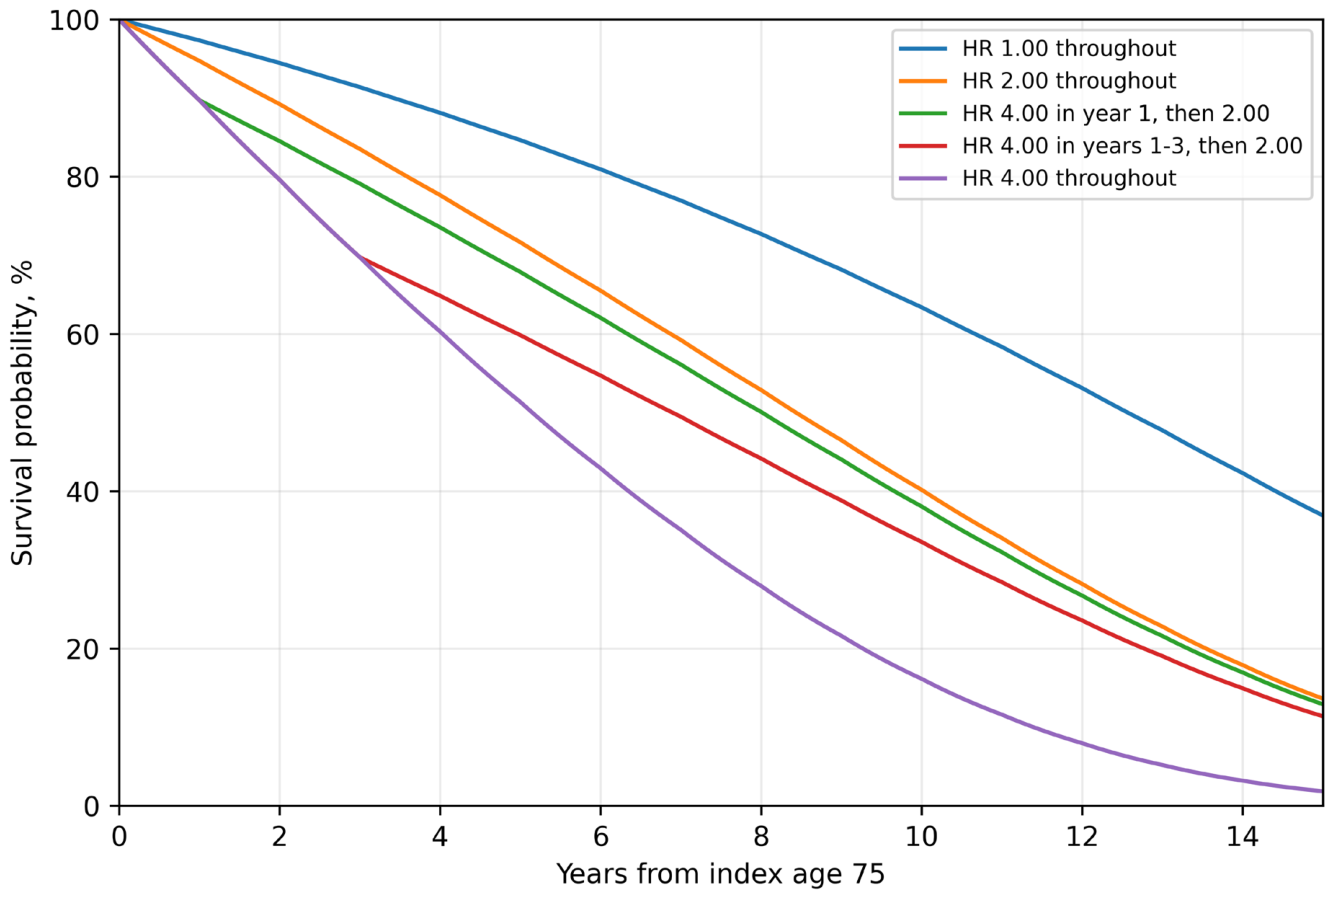
To demonstrate propagation of input uncertainty, we transformed a hypothetical HR of 2.00 and its illustrative 95% confidence interval of 1.50–2.50. The two HR bounds were transformed separately, and the resulting output range was reported without treating it as a validated prediction interval. To examine departure from a constant HR, we compared an HR of 2.00 throughout with hypothetical sequences that applied an HR of 4.00 for the first 1 or 3 years and an HR of 2.00 thereafter, together with an HR of 4.00 throughout as a high constant-HR comparator. These inputs were selected only to make the effects of HR magnitude and duration visible. No scenario was assigned a disease label, linked to a published coefficient, or intended for comparison across clinical conditions. Definitions of the illustrative scenarios are provided in
Supplementary Table S2.
2.6. Software and Reproducibility
All calculations were reproduced with Python 3.13.5 (Python Software Foundation, Beaverton, OR, USA), pandas 2.2.3 (NumFOCUS, Austin, TX, USA), and Matplotlib 3.10.8 (NumFOCUS, Austin, TX, USA). Code S1 contains the transcribed life-table probabilities and official remaining-life-expectancy values, the explicit terminal closure, transformation functions, agreement calculations, reference-grid analyses, baseline-equivalent age calculations, Gompertz slope diagnostics, sensitivity analyses, table generation, and figure generation.
Data S1–S11 provide the baseline validation table, fixed-HR reference grids, time-pattern outputs, an external-HR applicability checklist, the full source data for Figures 3 and 4, and the baseline-equivalent age-shift grid.
4. Discussion
Previous studies established the general principle of combining proportional mortality multipliers with life tables and of expressing mortality differences through life-expectancy, longevity, probability-based, or effective-age measures [
12,
13,
14,
15]. The present study therefore does not claim to provide the first HR-to-life-table transformation. Its contribution is to integrate three elements in one reproducible Japanese age- and sex-specific reference framework: a baseline-equivalent age shift matched on median remaining lifespan rather than on an age-specific hazard or life-expectancy quantity; joint reporting of median remaining lifespan, mean remaining years, fixed-time survival probabilities, and age shift in one grid; and a disease-neutral time-varying HR sensitivity analysis alongside the fixed-HR grid. The last element goes beyond a fixed-HR lookup framework by showing that median lifespan and fixed-horizon survival can respond differently to a front-loaded hazard. Agreement with official remaining life expectancy serves as an implementation check rather than an empirical finding.
The translation varied across index age, sex, HR magnitude, and outcome summary. Equal HR increments had progressively smaller effects at higher starting values. A given fixed HR removed more absolute years at younger index ages because baseline survival was longer; at older ages, it acted on a compressed remaining-lifetime distribution. The baseline-equivalent age shift offered a complementary view. For an HR of 2.00, absolute years lost decreased with age, whereas the age-scale shift remained approximately 5.6–6.7 years in men and 4.7–5.0 years in women. This stability may aid communication, but the matched age depends on the selected life table and summary metric and is not a biological-age estimate. The approximate invariance weakened at the age of 90 and an HR of 4.00, particularly in men, because the matched age entered the late-life mortality-deceleration region rather than the approximately log-linear adult range. Fixed-time survival remains preferable when a decision depends on reaching a specific horizon, which should be chosen for the decision rather than assumed to be 5 years in every setting.
The distinction between a general-population baseline and an unexposed baseline is essential. An HR of 1.00 represents the population-average mortality experience in the Japanese complete life table and is not a healthy reference profile. The fixed-HR grid is internally self-consistent because each multiplier is defined against that same baseline. Mapping an HR from an external study is a separate analytical step. An HR estimated against a selected clinical subgroup, a covariate-defined reference category, or another active treatment should not be treated as a disease-versus-general-population multiplier without justification. Compatibility of the endpoint, comparator, adjustment set, target population, and follow-up pattern must be considered, particularly because HRs are non-collapsible [
8,
9,
10]. The applicability checklist in
Supplementary Table S3 and Data S8 makes these requirements explicit.
Because the transformation operates only on the supplied HR sequence and the baseline survival curve, two inputs with the same HR sequence produce identical outputs regardless of any label attached to them. A condition name therefore carries no numerical information in this framework unless it changes the HR magnitude, its trajectory over time, or the baseline survival source. This is a mathematical property of the translation and is the reason the reference grid and sensitivity analyses are presented without clinical labels; it does not justify transferring an externally estimated HR to an incompatible baseline.
The uncertainty analysis is deliberately limited to deterministic propagation of the HR bounds. It excludes uncertainty in the source-study baseline, sampling variation in the life table, model misspecification, and covariance between parameters. The time-pattern analysis adds a separate interpretive point: a short front-loaded hazard changed the median much less than it changed 5-year survival. Median remaining lifespan can therefore understate an early risk concentration even when it summarizes the full survival trajectory. Reporting both a lifespan measure and decision-relevant fixed-time survival is particularly important when proportional hazards are doubtful. Source-specific time-varying effects or baseline survival curves remain preferable when available.
Several limitations arise directly from the design. First, the framework is not an internally or externally validated prediction model; no participant-level outcomes were available to estimate calibration, discrimination, or prediction error. Second, agreement with official remaining life expectancy confirms numerical implementation at an HR of 1.00 but does not establish clinical validity at HR values above 1.00. Third, the fixed-HR grid assumes that the same multiplier applies at each attained age over the remaining-life trajectory. The hypothetical time-varying analyses illustrate sensitivity to this assumption but do not identify the correct pattern for any condition. Fourth, application of an external HR requires transportability assumptions that may fail because of differences in estimand, comparator, covariate adjustment, endpoint, geography, calendar period, and care setting. Fifth, HRs do not generally have a simple causal interpretation, and mathematical translation does not remove non-collapsibility or selection over follow-up [
8,
9,
10]. Sixth, the baseline-equivalent age shift is specific to the chosen median-based matching rule and should not be interpreted as biological ageing; its approximate age invariance also weakens at the oldest index ages, where late-life mortality deceleration departs from log-linearity and matched ages lie in sparsely surviving tails. Finally, the 2020 Japanese complete life table may not represent other countries, later calendar periods, or selected clinical populations, and an HR of 1.00 already includes chronic disease and frailty at their population frequencies. At the time of this revision (15 August 2026), the 23rd Complete Life Tables remained the most recent complete life tables released by the Ministry of Health, Labour and Welfare. The 2025 abridged life tables had been released, and the Ministry indicated that a complete life table based on the 2025 census was planned but had not yet been released [
16,
17]. Because abridged and complete life tables use different population and vital-statistics sources, we retained the latest complete life table to preserve consistency with the prespecified design. Updating the baseline would require recalculation of all absolute grid values because they depend on age- and sex-specific death probabilities. The transformation algorithm and qualitative ordering across HR inputs would remain unchanged, but the magnitude of each estimate should be recomputed rather than assumed.
Within these boundaries, the framework has practical value as a mathematical interpretation and communication aid. A reader can inspect the age–sex grid, translate the endpoints of an HR confidence interval, express a fixed-HR result on a baseline-equivalent age scale, and test alternative time patterns. Before applying a published HR, the source estimand and comparator should be checked against the conditions in
Supplementary Table S3. Results from HRs estimated under different comparators or models should not be compared as if they represented disease severity on one common scale. The translated quantities may support discussion of time horizons, but they should not be converted into automatic treatment rules without source-specific evidence, patient preferences, and clinical validation.