
The Longitudinal Relationship Between Allostatic Load and Multimorbidity Among Older Americans


Abstract
1. Background
2. Materials and Methods
2.1. Study Design
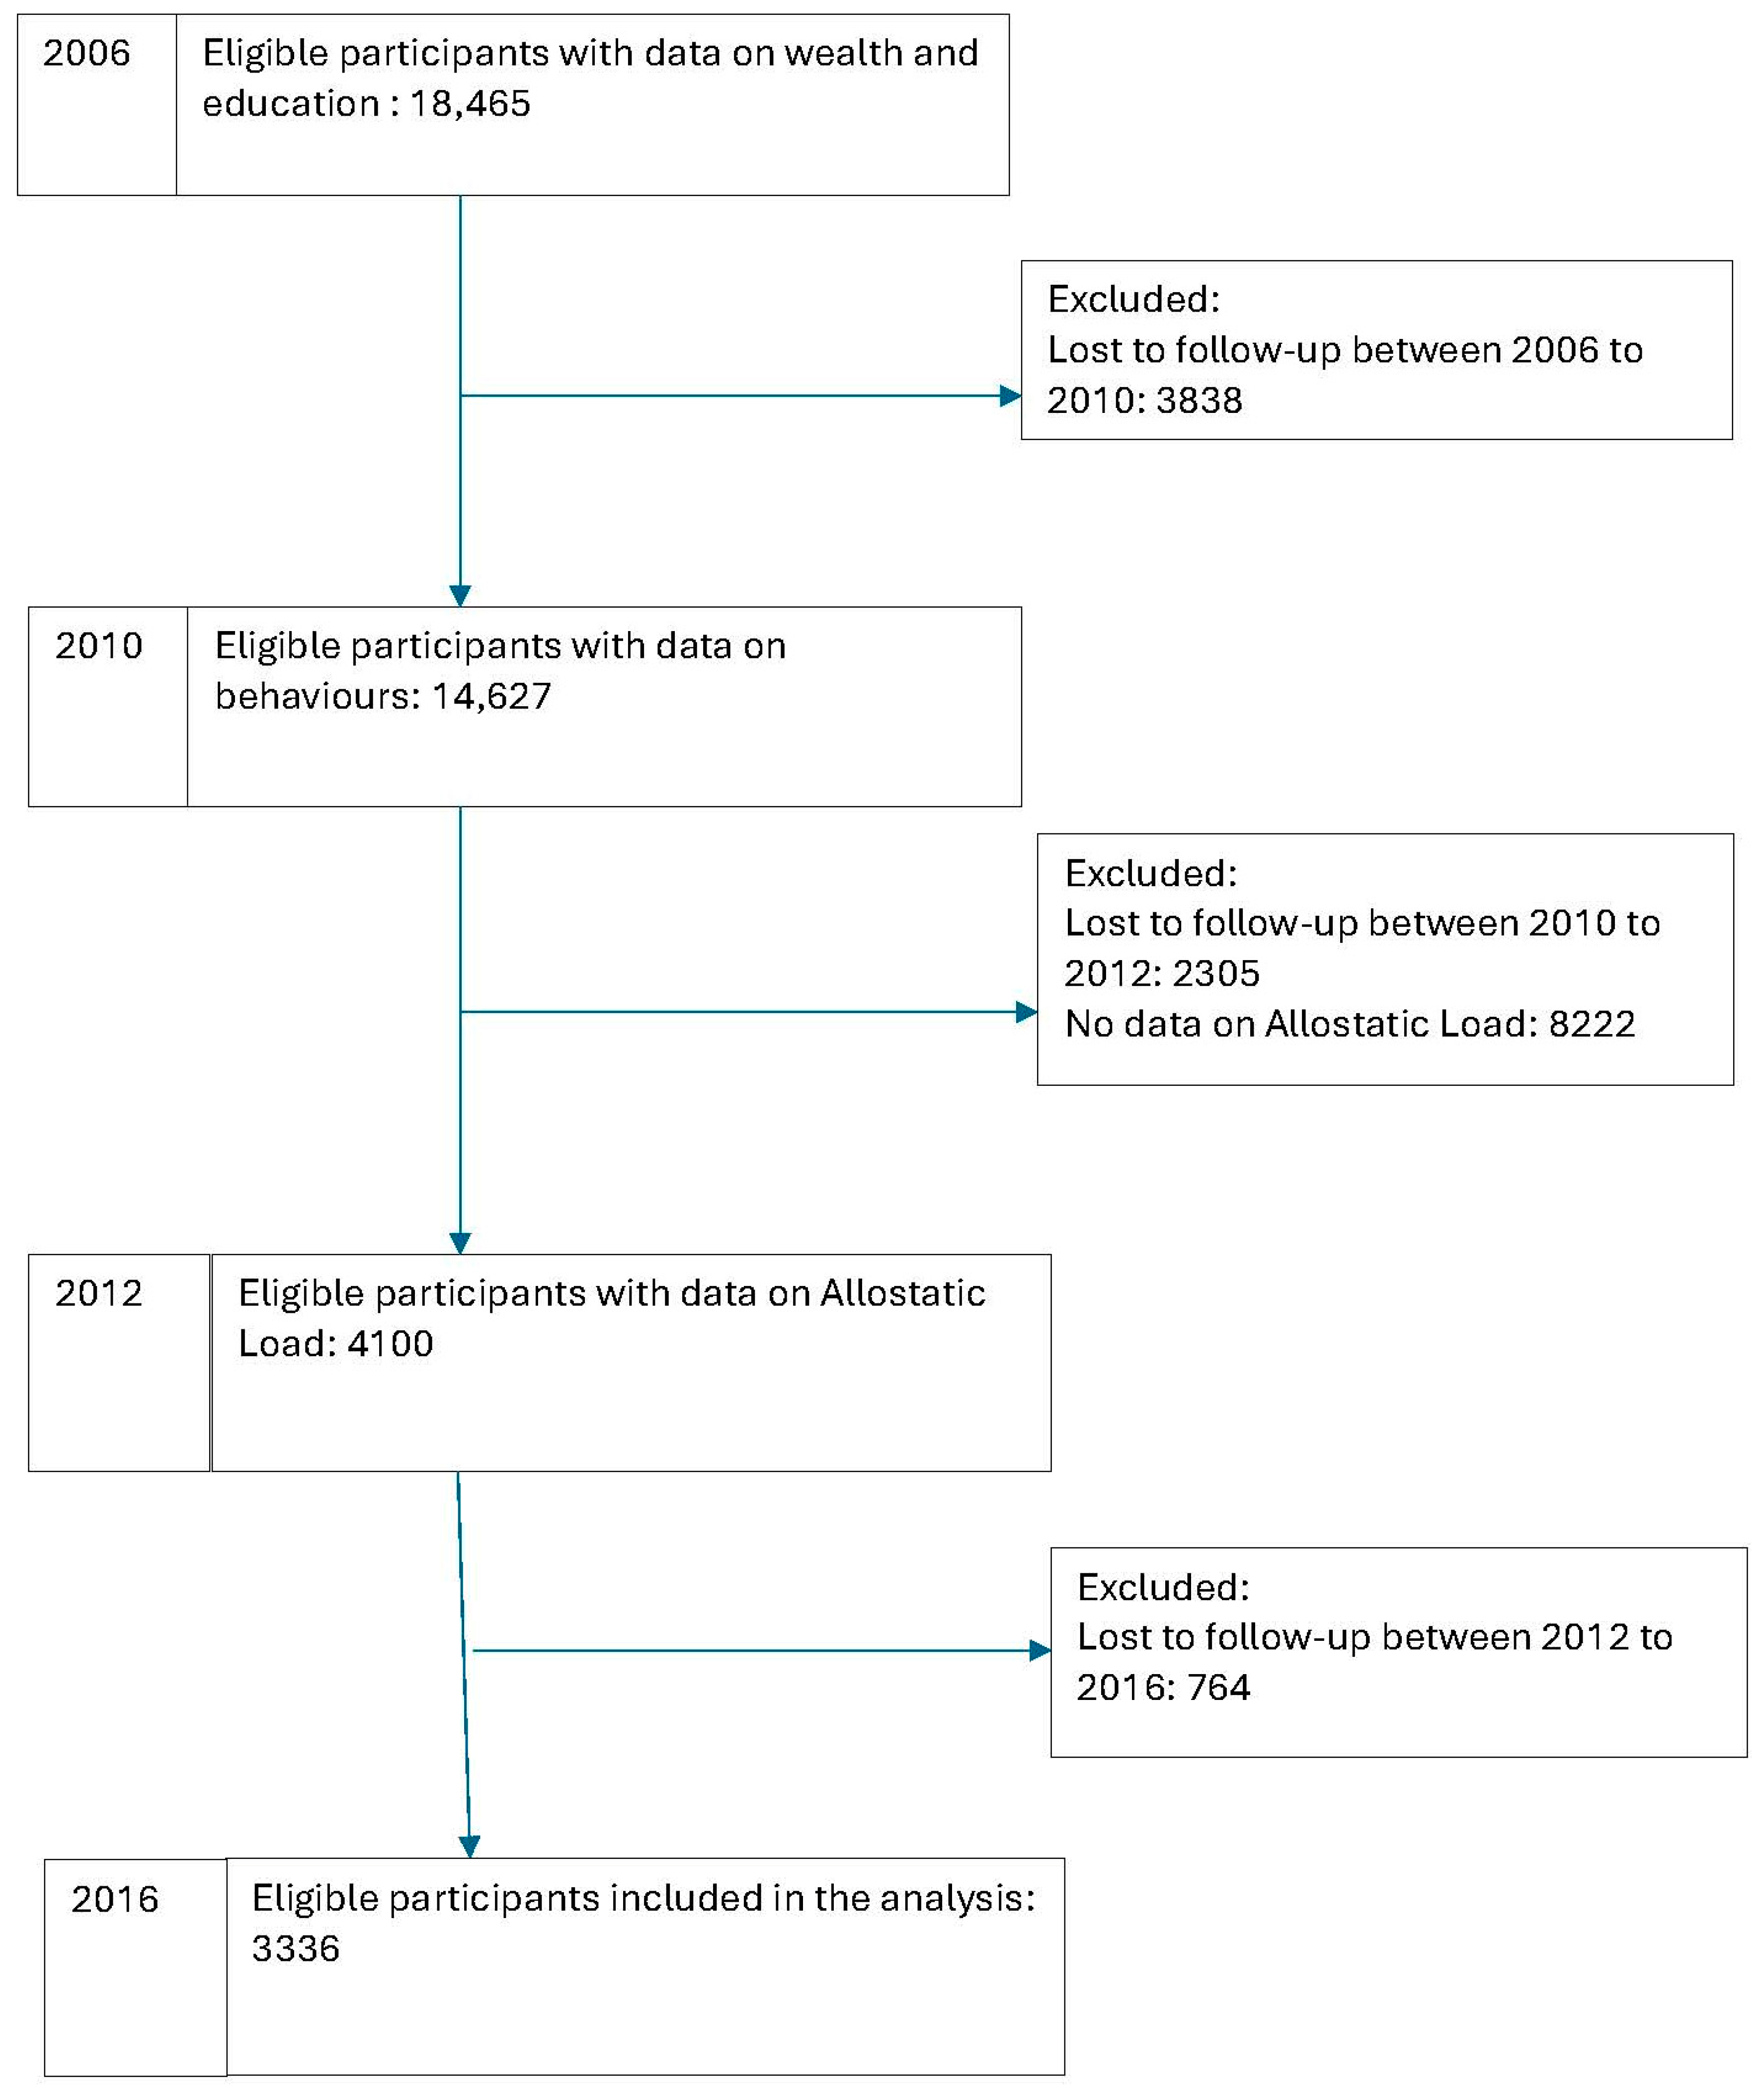
2.2. Study Sample
2.3. Study Variables
2.4. Indicators of Allostatic Load
2.5. Statistical Analysis
3. Results
3.1. Characteristics of the Study Sample
3.2. Association Between Allostatic Load and Incidence of Multimorbidity
3.3. Sensitivity Analysis
4. Discussion
5. Conclusions
Author Contributions
Funding
Institutional Review Board Statement
Informed Consent Statement
Data Availability Statement
Conflicts of Interest
References
- Atun, R. Transitioning health systems for multimorbidity. Lancet 2015, 386, 721–722. [Google Scholar] [CrossRef]
- Beran, D.; Perel, P.; Miranda, J.J. Forty years since Alma-Ata: Do we need a new model for noncommunicable diseases? J. Glob. Health 2019, 9, 010316. [Google Scholar] [CrossRef] [PubMed]
- Salisbury, C.; Johnson, L.; Purdy, S.; Valderas, J.M.; Montgomery, A.A. Epidemiology and impact of multimorbidity in primary care: A retrospective cohort study. Br. J. Gen. Pract. 2011, 61, e12–e21. [Google Scholar] [CrossRef] [PubMed]
- Valderas, J.M.; Starfield, B.; Sibbald, B.; Salisbury, C.; Roland, M. Defining comorbidity: Implications for understanding health and health services. Ann. Fam. Med. 2009, 7, 357–363. [Google Scholar] [CrossRef]
- Nunes, B.P.; Flores, T.R.; Mielke, G.I.; Thumé, E.; Facchini, L.A. Multimorbidity and mortality in older adults: A systematic review and meta-analysis. Arch. Gerontol. Geriatr. 2016, 67, 130–138. [Google Scholar] [CrossRef]
- Ryan, A.; Wallace, E.; O’Hara, P.; Smith, S.M. Multimorbidity and functional decline in community-dwelling adults: A systematic review. Health Qual. Life Outcomes 2015, 13, 168. [Google Scholar] [CrossRef] [PubMed]
- Vetrano, D.L.; Palmer, K.; Marengoni, A.; Marzetti, E.; Lattanzio, F.; Roller-Wirnsberger, R.; Lopez Samaniego, L.; Rodríguez-Mañas, L.; Bernabei, R.; Onder, G. Frailty and multimorbidity: A systematic review and meta-analysis. J. Gerontol. Ser. A 2019, 74, 659–666. [Google Scholar] [CrossRef]
- About Chronic Diseases. Available online: https://www.cdc.gov/chronic-disease/about/?CDC_AAref_Val=https://www.cdc.gov/chronicdisease/about/index.htm (accessed on 16 April 2025).
- Violan, C.; Foguet-Boreu, Q.; Flores-Mateo, G.; Salisbury, C.; Blom, J.; Freitag, M.; Glynn, L.; Muth, C.; Valderas, J.M. Prevalence, determinants and patterns of multimorbidity in primary care: A systematic review of observational studies. PLoS ONE 2014, 9, e102149. [Google Scholar] [CrossRef]
- Mira, R.; Newton, T.; Sabbah, W. Inequalities in the progress of multiple chronic conditions: A systematic review of longitudinal studies. PLoS ONE 2022, 17, e0263357. [Google Scholar] [CrossRef]
- Mira, R.; Newton, T.; Sabbah, W. Socioeconomic and Ethnic Inequalities in the Progress of Multimorbidity and the Role of Health Behaviors. J. Am. Med. Dir. Assoc. 2023, 24, 811–815. [Google Scholar] [CrossRef]
- Rocca, W.A.; Boyd, C.M.; Grossardt, B.R.; Bobo, W.V.; Rutten, L.J.F.; Roger, V.L.; Ebbert, J.O.; Therneau, T.M.; Yawn, B.P.; Sauver, J.L.S. Prevalence of multimorbidity in a geographically defined American population: Patterns by age, sex, and race/ethnicity. Mayo Clin. Proc. 2014, 89, 1336–1349. [Google Scholar] [CrossRef] [PubMed]
- Non Communicable Diseases. Available online: https://www.who.int/news-room/fact-sheets/detail/noncommunicable-diseases (accessed on 16 April 2025).
- Guidi, J.; Lucente, M.; Sonino, N.; Fava, G.A. Allostatic Load and Its Impact on Health: A Systematic Review. Psychother. Psychosom. 2021, 90, 11–27. [Google Scholar] [CrossRef]
- Juster, R.P.; McEwen, B.S.; Lupien, S.J. Allostatic load biomarkers of chronic stress and impact on health and cognition. Neurosci. Biobehav. Rev. 2010, 35, 2–16. [Google Scholar] [CrossRef]
- Mattei, J.; Demissie, S.; Falcon, L.M.; Ordovas, J.M.; Tucker, K. Allostatic load is associated with chronic conditions in the Boston Puerto Rican Health Study. Soc. Sci. Med. 2010, 70, 1988–1996. [Google Scholar] [CrossRef]
- McEwen, B.S.; Stellar, E. Stress and the individual. Mechanisms leading to disease. Arch. Intern. Med. 1993, 153, 2093–2101. [Google Scholar] [CrossRef] [PubMed]
- McEwen, B.S. Stress, adaptation, and disease: Allostasis and allostatic load. Ann. N. Y. Acad. Sci. 1998, 840, 33–44. [Google Scholar] [CrossRef] [PubMed]
- McEwen, B.S. Physiology and neurobiology of stress and adaptation: Central role of the brain. Physiol. Rev. 2007, 87, 873–904. [Google Scholar] [CrossRef]
- de Oliveira, C.; Sabbah, W.; Schneider, I.J.C.; Bernabé, E. Complete Tooth Loss and Allostatic Load Changes Later in Life: A 12-Year Follow-Up Analysis of the English Longitudinal Study of Ageing. Psychosom. Med. 2021, 83, 247–255. [Google Scholar] [CrossRef]
- Sabbah, W.; Watt, R.G.; Sheiham, A.; Tsakos, G. Effects of allostatic load on the social gradient in ischaemic heart disease and periodontal disease: Evidence from the Third National Health and Nutrition Examination Survey. J. Epidemiol. Community Health 2008, 62, 415–420. [Google Scholar] [CrossRef]
- Barnett, K.; Mercer, S.W.; Norbury, M.; Watt, G.; Wyke, S.; Guthrie, B. Epidemiology of multimorbidity and implications for health care, research, and medical education: A cross-sectional study. Lancet 2012, 380, 37–43. [Google Scholar] [CrossRef]
- Seeman, T.E.; McEwen, B.S.; Rowe, J.W.; Singer, B.H. Allostatic load as a marker of cumulative biological risk: MacArthur studies of successful aging. Proc. Natl. Acad. Sci. USA 2001, 98, 4770–4775. [Google Scholar] [CrossRef]
- McEwen, B.S.; Wingfield, J.C. What is in a name? Integrating homeostasis, allostasis and stress. Horm. Behav. 2010, 57, 105–111. [Google Scholar] [CrossRef] [PubMed]
- Seeman, T.E.; Singer, B.H.; Rowe, J.W.; Horwitz, R.I.; McEwen, B.S. Price of adaptation--allostatic load and its health consequences. MacArthur studies of successful aging. Arch. Intern. Med. 1997, 157, 2259–2268. [Google Scholar] [CrossRef]
- McEwen, B.S.; Seeman, T. Protective and damaging effects of mediators of stress. Elaborating and testing the concepts of allostasis and allostatic load. Ann. N. Y. Acad. Sci. 1999, 896, 30–47. [Google Scholar] [CrossRef] [PubMed]
- McEwen, B.S. Central effects of stress hormones in health and disease: Understanding the protective and damaging effects of stress and stress mediators. Eur. J. Pharmacol. 2008, 583, 174–185. [Google Scholar] [CrossRef]
- Obeng-Gyasi, S.; Graham, N.; Kumar, S.; Lee, J.-W.; Jacobus, S.; Weiss, M.; Cella, D.; Zhao, F.; Ip, E.H.; O’Connell, N.; et al. Examining allostatic load, neighborhood socioeconomic status, symptom burden and mortality in multiple myeloma patients. Blood Cancer J. 2022, 12, 53. [Google Scholar] [CrossRef] [PubMed]
- Sonnega, A.; Faul, J.D.; Ofstedal, M.B.; Langa, K.M.; Phillips, J.W.; Weir, D.R. Cohort Profile: The Health and Retirement Study (HRS). Int. J. Epidemiol. 2014, 43, 576–585. [Google Scholar] [CrossRef]
- RAND HRS Longitudinal File 2020. Available online: https://hrsdata.isr.umich.edu/data-products/rand-hrs-longitudinal-file-2020 (accessed on 16 April 2025).
- Guidelines & Statements. Available online: https://professional.heart.org/en/guidelines-and-statements (accessed on 16 April 2025).
- Understanding A1C. Available online: https://www.diabetes.org/diabetes/a1c/diagnosis (accessed on 16 April 2025).
- Johns, I.; Moschonas, K.E.; Medina, J.; Ossei-Gerning, N.; Kassianos, G.; Halcox, J.P. Risk classification in primary prevention of CVD according to QRISK2 and JBS3 ‘heart age’, and prevalence of elevated high-sensitivity C reactive protein in the UK cohort of the EURIKA study. Open Heart 2018, 5, e000849. [Google Scholar] [CrossRef]
- Lee, Y.; McKechnie, T.; Doumouras, A.G.; Handler, C.; Eskicioglu, C.; Gmora, S.; Anvari, M.; Hong, D. Diagnostic Value of C-Reactive Protein Levels in Postoperative Infectious Complications After Bariatric Surgery: A Systematic Review and Meta-Analysis. Obes. Surg. 2019, 29, 2022–2029. [Google Scholar] [CrossRef]
- Healthy Weight, Nutrition and Physical Activity. Available online: https://www.cdc.gov/healthyweight/assessing/index.html#:~:text=Adult%20Body%20Mass%20Index%20or%20BMI%201%20If,or%20higher%2C%20it%20falls%20within%20the%20obese%20range (accessed on 16 April 2025).
- Heart Attack and Stroke Symptoms. Available online: https://www.heart.org/en/health-topics/high-blood-pressure/understanding-blood-pressure-readings (accessed on 16 April 2025).
- McCrory, C.; McLoughlin, S.; Layte, R.; NiCheallaigh, C.; O’Halloran, A.M.; Barros, H.; Berkman, L.F.; Bochud, M.; Crimmins, E.M.; Farrell, M.T.; et al. Towards a consensus definition of allostatic load: A multi-cohort, multi-system, multi-biomarker individual participant data (IPD) meta-analysis. Psychoneuroendocrinology 2023, 153, 106117. [Google Scholar] [CrossRef]
- Rodriguez, J.M.; Karlamangla, A.S.; Gruenewald, T.L.; Miller-Martinez, D.; Merkin, S.S.; Seeman, T.E. Social stratification and allostatic load: Shapes of health differences in the MIDUS study in the United States. J. Biosoc. Sci. 2019, 51, 627–644. [Google Scholar] [CrossRef] [PubMed]
- Kino, S.; Bernabé, E.; Sabbah, W. Socioeconomic inequality in clusters of health-related behaviours in Europe: Latent class analysis of a cross-sectional European survey. BMC Public Health 2017, 17, 497. [Google Scholar] [CrossRef] [PubMed]
- Gay, J.L.; Salinas, J.J.; Buchner, D.M.; Mirza, S.; Kohl, H.W.; Fisher-Hoch, S.P.; McCormick, J.B. Meeting physical activity guidelines is associated with lower allostatic load and inflammation in Mexican Americans. J. Immigr. Minor. Health 2015, 17, 574–581. [Google Scholar] [CrossRef] [PubMed]
- Kusano, Y.; Crews, D.E.; Iwamoto, A.; Sone, Y.; Aoyagi, K.; Maeda, T.; Leahy, R. Allostatic load differs by sex and diet, but not age in older Japanese from the Goto Islands. Ann. Hum. Biol. 2016, 43, 34–41. [Google Scholar] [CrossRef]
- Villafane, J.H.; Valdes, K.; Pedersini, P.; Berjano, P. Osteoarthritis: A call for research on central pain mechanism and personalized prevention strategies. Clin. Rheumatol. 2019, 38, 583–584. [Google Scholar] [CrossRef]
- Christensen, D.S.; Flensborg-Madsen, T.; Garde, E.; Hansen, Å.M.; Masters Pedersen, J.; Mortensen, E.L. Early life predictors of midlife allostatic load: A prospective cohort study. PLoS ONE 2018, 13, e0202395. [Google Scholar] [CrossRef]
- Haapanen, M.J.; Vetrano, D.L.; Mikkola, T.M.; Calderón-Larrañaga, A.; Dekhtyar, S.; Kajantie, E.; Eriksson, J.G.; von Bonsdorff, M.B. Early growth, stress, and socioeconomic factors as predictors of the rate of multimorbidity accumulation across the life course: A longitudinal birth cohort study. Lancet Healthy Longev. 2024, 5, e56–e65. [Google Scholar] [CrossRef]


| Year | Variables | Percentage/Mean | |
|---|---|---|---|
| 2006 | Mean age | 64.48 (95% CI: 64.19, 64.77) | |
| Sex | Males | 38.9% | |
| Females | 61.1% | ||
| Education (2006) | <high school | 22.5% | |
| High school | 31.0% | ||
| Some college | 22.7% | ||
| College or higher | 23.8% | ||
| Wealth (2006) | Highest | 33.1% | |
| 2nd highest | 27.4% | ||
| 2nd lowest | 25.2% | ||
| lowest | 14.3% | ||
| 2010 | Smoking | Former/never | 89.3% |
| current | 10.7% | ||
| Mean physical activities | 1.37 (95% CI: 1.33, 1.41) | ||
| 2012 | Mean allostatic load markers | 1.77 (95% CI: 1.74, 1.82) | |
| 2016 | Multimorbidity (incidence between 2006–2016) | 19.0% | |
| Variables | Estimate (Coefficient) (95% CI) | |
|---|---|---|
| Smoking (2010) | ||
| Lower wealth (2006) | 0.08 *** (0.09, 0.16) | |
| Higher education (2006) | −0.05 ** (−0.09, −0.02) | |
| Physical activities (2010) | ||
| Lower wealth (2006) | −0.14 *** (−0.18, −0.11) | |
| Higher education (2006) | 0.13 *** (0.09, 0.17) | |
| Allostatic load (2012) | ||
| Lower wealth (2006) | 0.15 *** (0.11, 0.18) | |
| Higher education (2006) | −0.10 *** (−0.14, −0.07) | |
| Smoking (2010) | 0.02 (−0.1, 0.05) | |
| Physical activities (2010) | −0.13 *** (−0.17, −0.09) | |
| Multimorbidity ± (2016) | ||
| Gender (Female) | −0.08 *** (−0.11, −0.05) | |
| Age (2006) | 0.11 *** (0.07, 0.14) | |
| Lower wealth (2006) | −0.01 (−0.05, 0.03) | |
| Higher education (2006) | −0.02 (−0.06, 0.01) | |
| Smoking (2010) | 0.06 ** (0.01, 0.08) | |
| Physical activities (2010) | −0.07 *** (−0.10, −0.04) | |
| Allostatic load | 0.10 *** (0.07, 0.14) | |
| Model fit | ||
| RMSEA | 0.035 (0.021, 0.42) | |
| CFI | 1.0 | |
| TLI | 1.0 | |
Disclaimer/Publisher’s Note: The statements, opinions and data contained in all publications are solely those of the individual author(s) and contributor(s) and not of MDPI and/or the editor(s). MDPI and/or the editor(s) disclaim responsibility for any injury to people or property resulting from any ideas, methods, instructions or products referred to in the content. |
© 2025 by the authors. Licensee MDPI, Basel, Switzerland. This article is an open access article distributed under the terms and conditions of the Creative Commons Attribution (CC BY) license (https://creativecommons.org/licenses/by/4.0/).
Share and Cite
Mira, R.; Newton, J.T.; Sabbah, W. The Longitudinal Relationship Between Allostatic Load and Multimorbidity Among Older Americans. Geriatrics 2025, 10, 84. https://doi.org/10.3390/geriatrics10040084
Mira R, Newton JT, Sabbah W. The Longitudinal Relationship Between Allostatic Load and Multimorbidity Among Older Americans. Geriatrics. 2025; 10(4):84. https://doi.org/10.3390/geriatrics10040084
Chicago/Turabian StyleMira, Rolla, Jonathon Timothy Newton, and Wael Sabbah. 2025. "The Longitudinal Relationship Between Allostatic Load and Multimorbidity Among Older Americans" Geriatrics 10, no. 4: 84. https://doi.org/10.3390/geriatrics10040084
APA StyleMira, R., Newton, J. T., & Sabbah, W. (2025). The Longitudinal Relationship Between Allostatic Load and Multimorbidity Among Older Americans. Geriatrics, 10(4), 84. https://doi.org/10.3390/geriatrics10040084