
Single-Nucleotide Polymorphism on Spermatogenesis Associated 16 Gene-Coding Region Affecting Bovine Leukemia Virus Proviral Load


Abstract
:1. Introduction
2. Materials and Methods
2.1. Samples
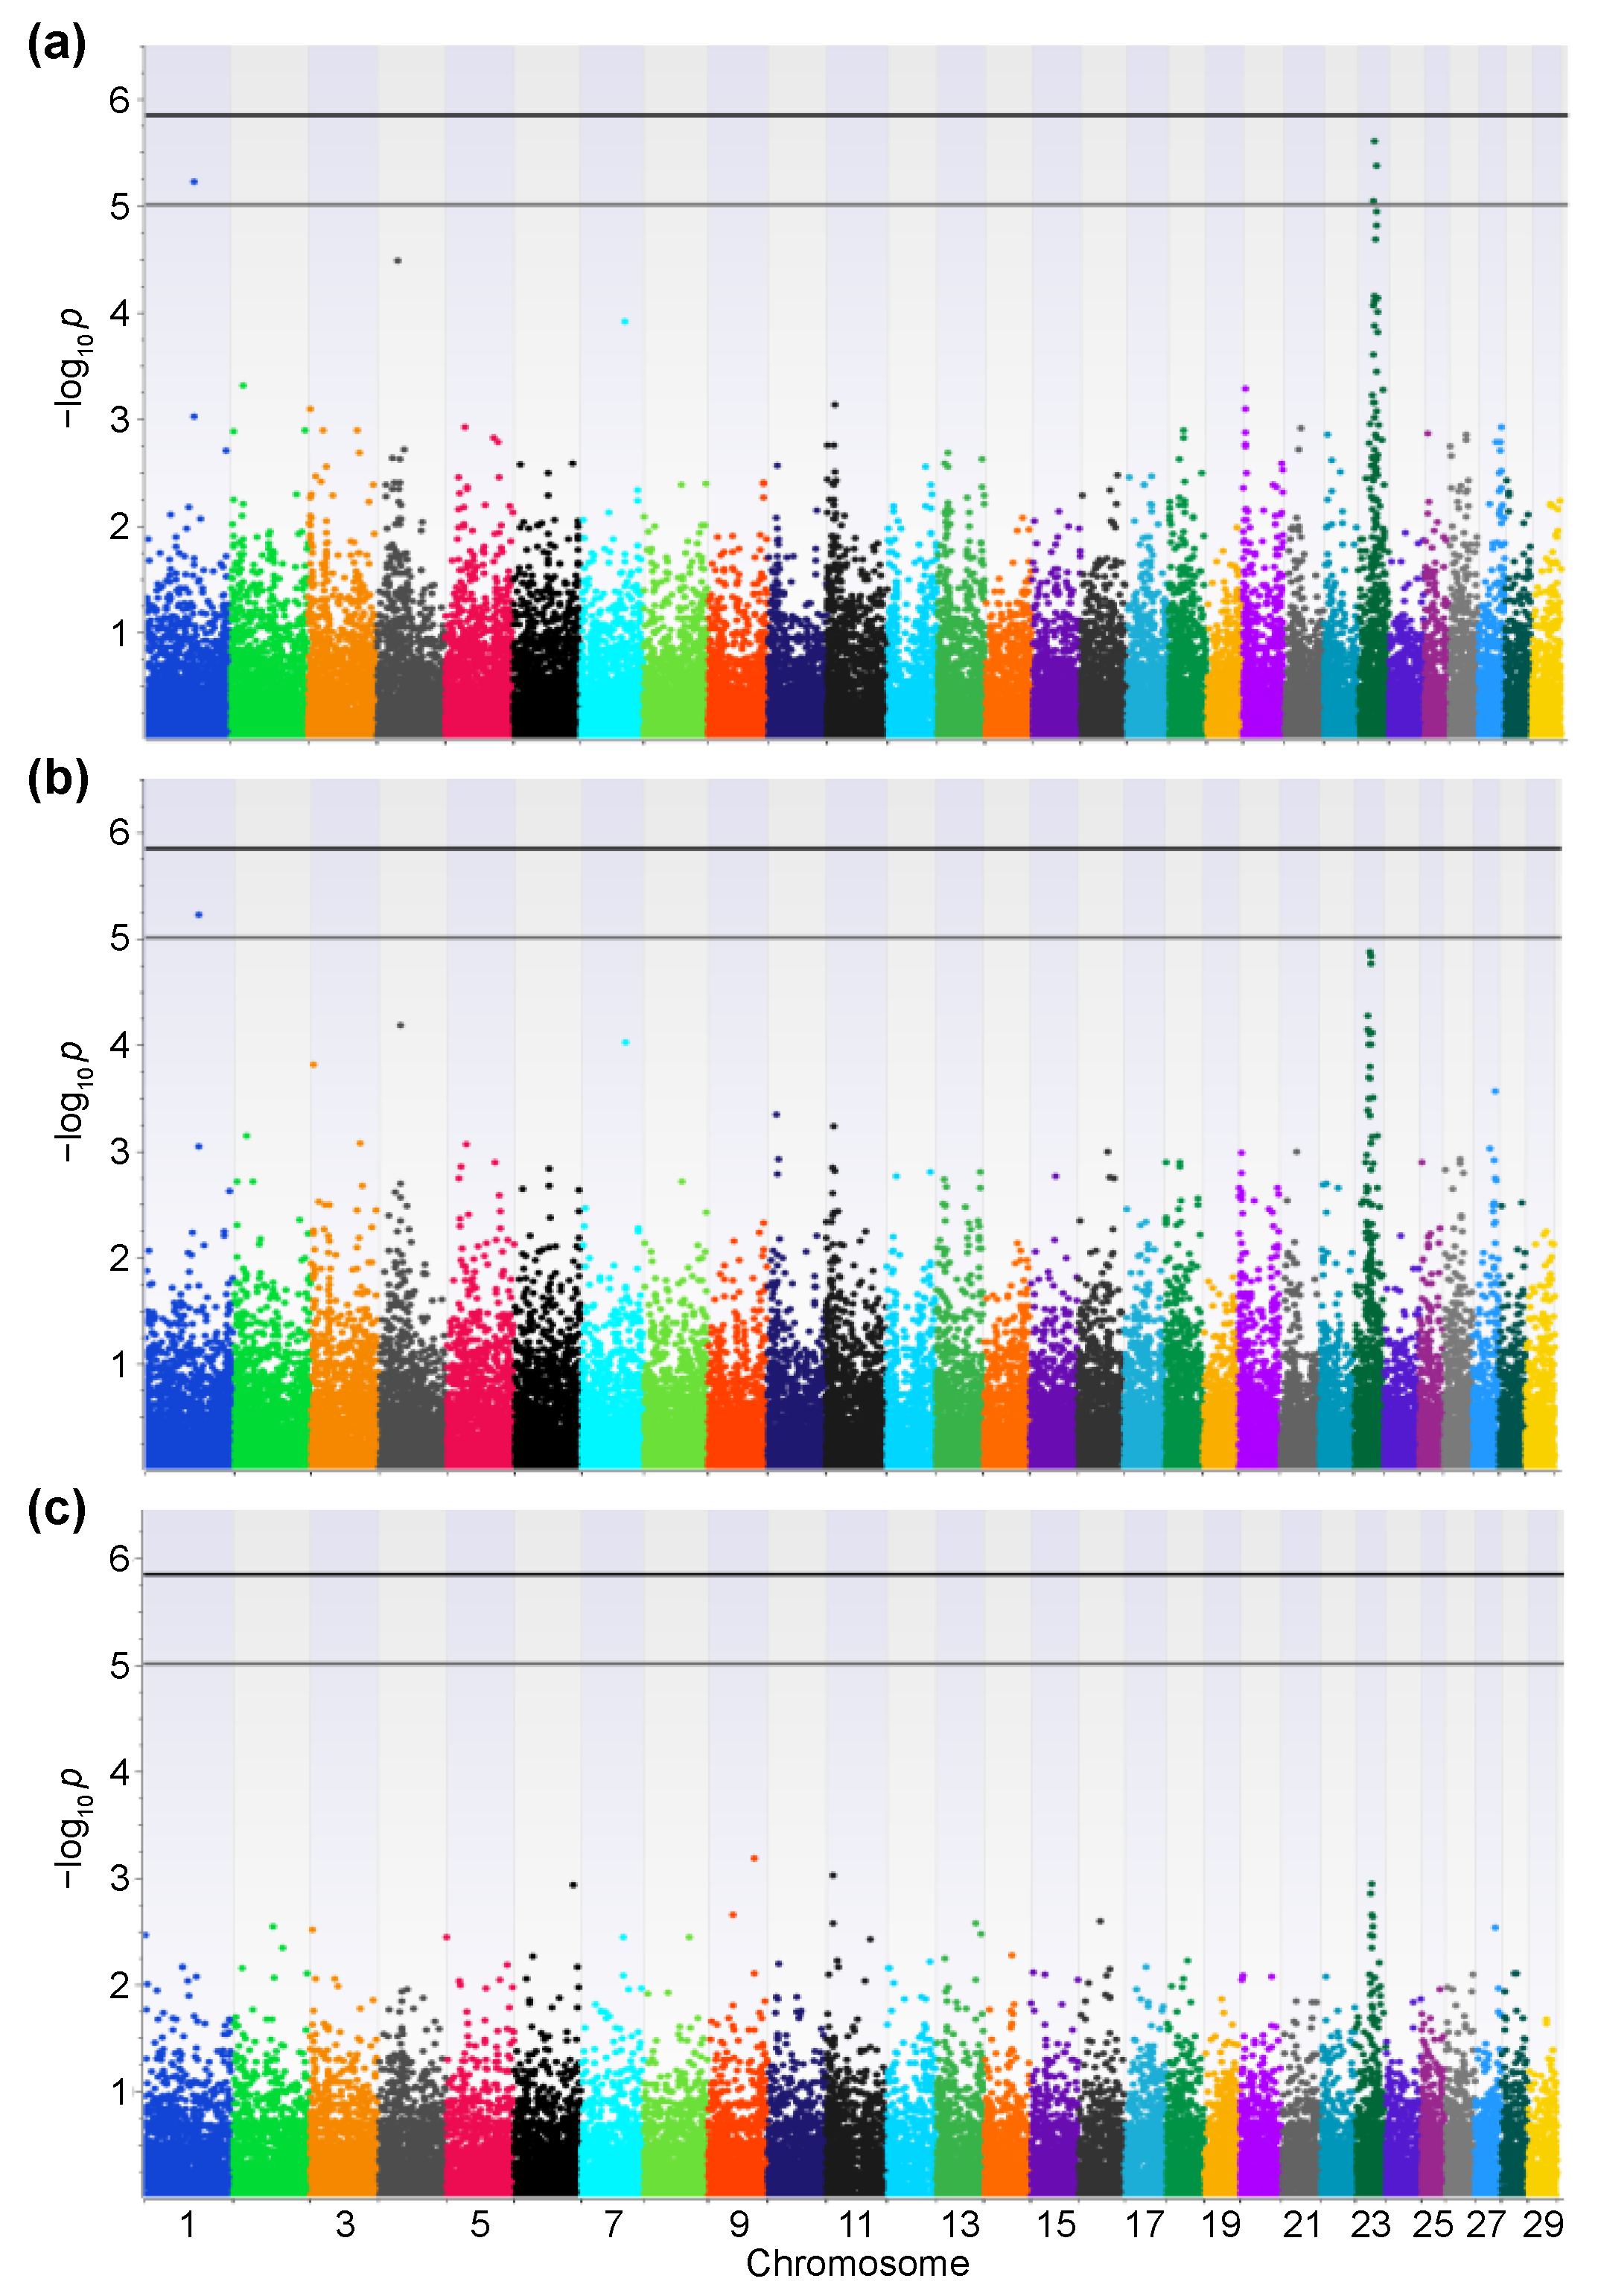
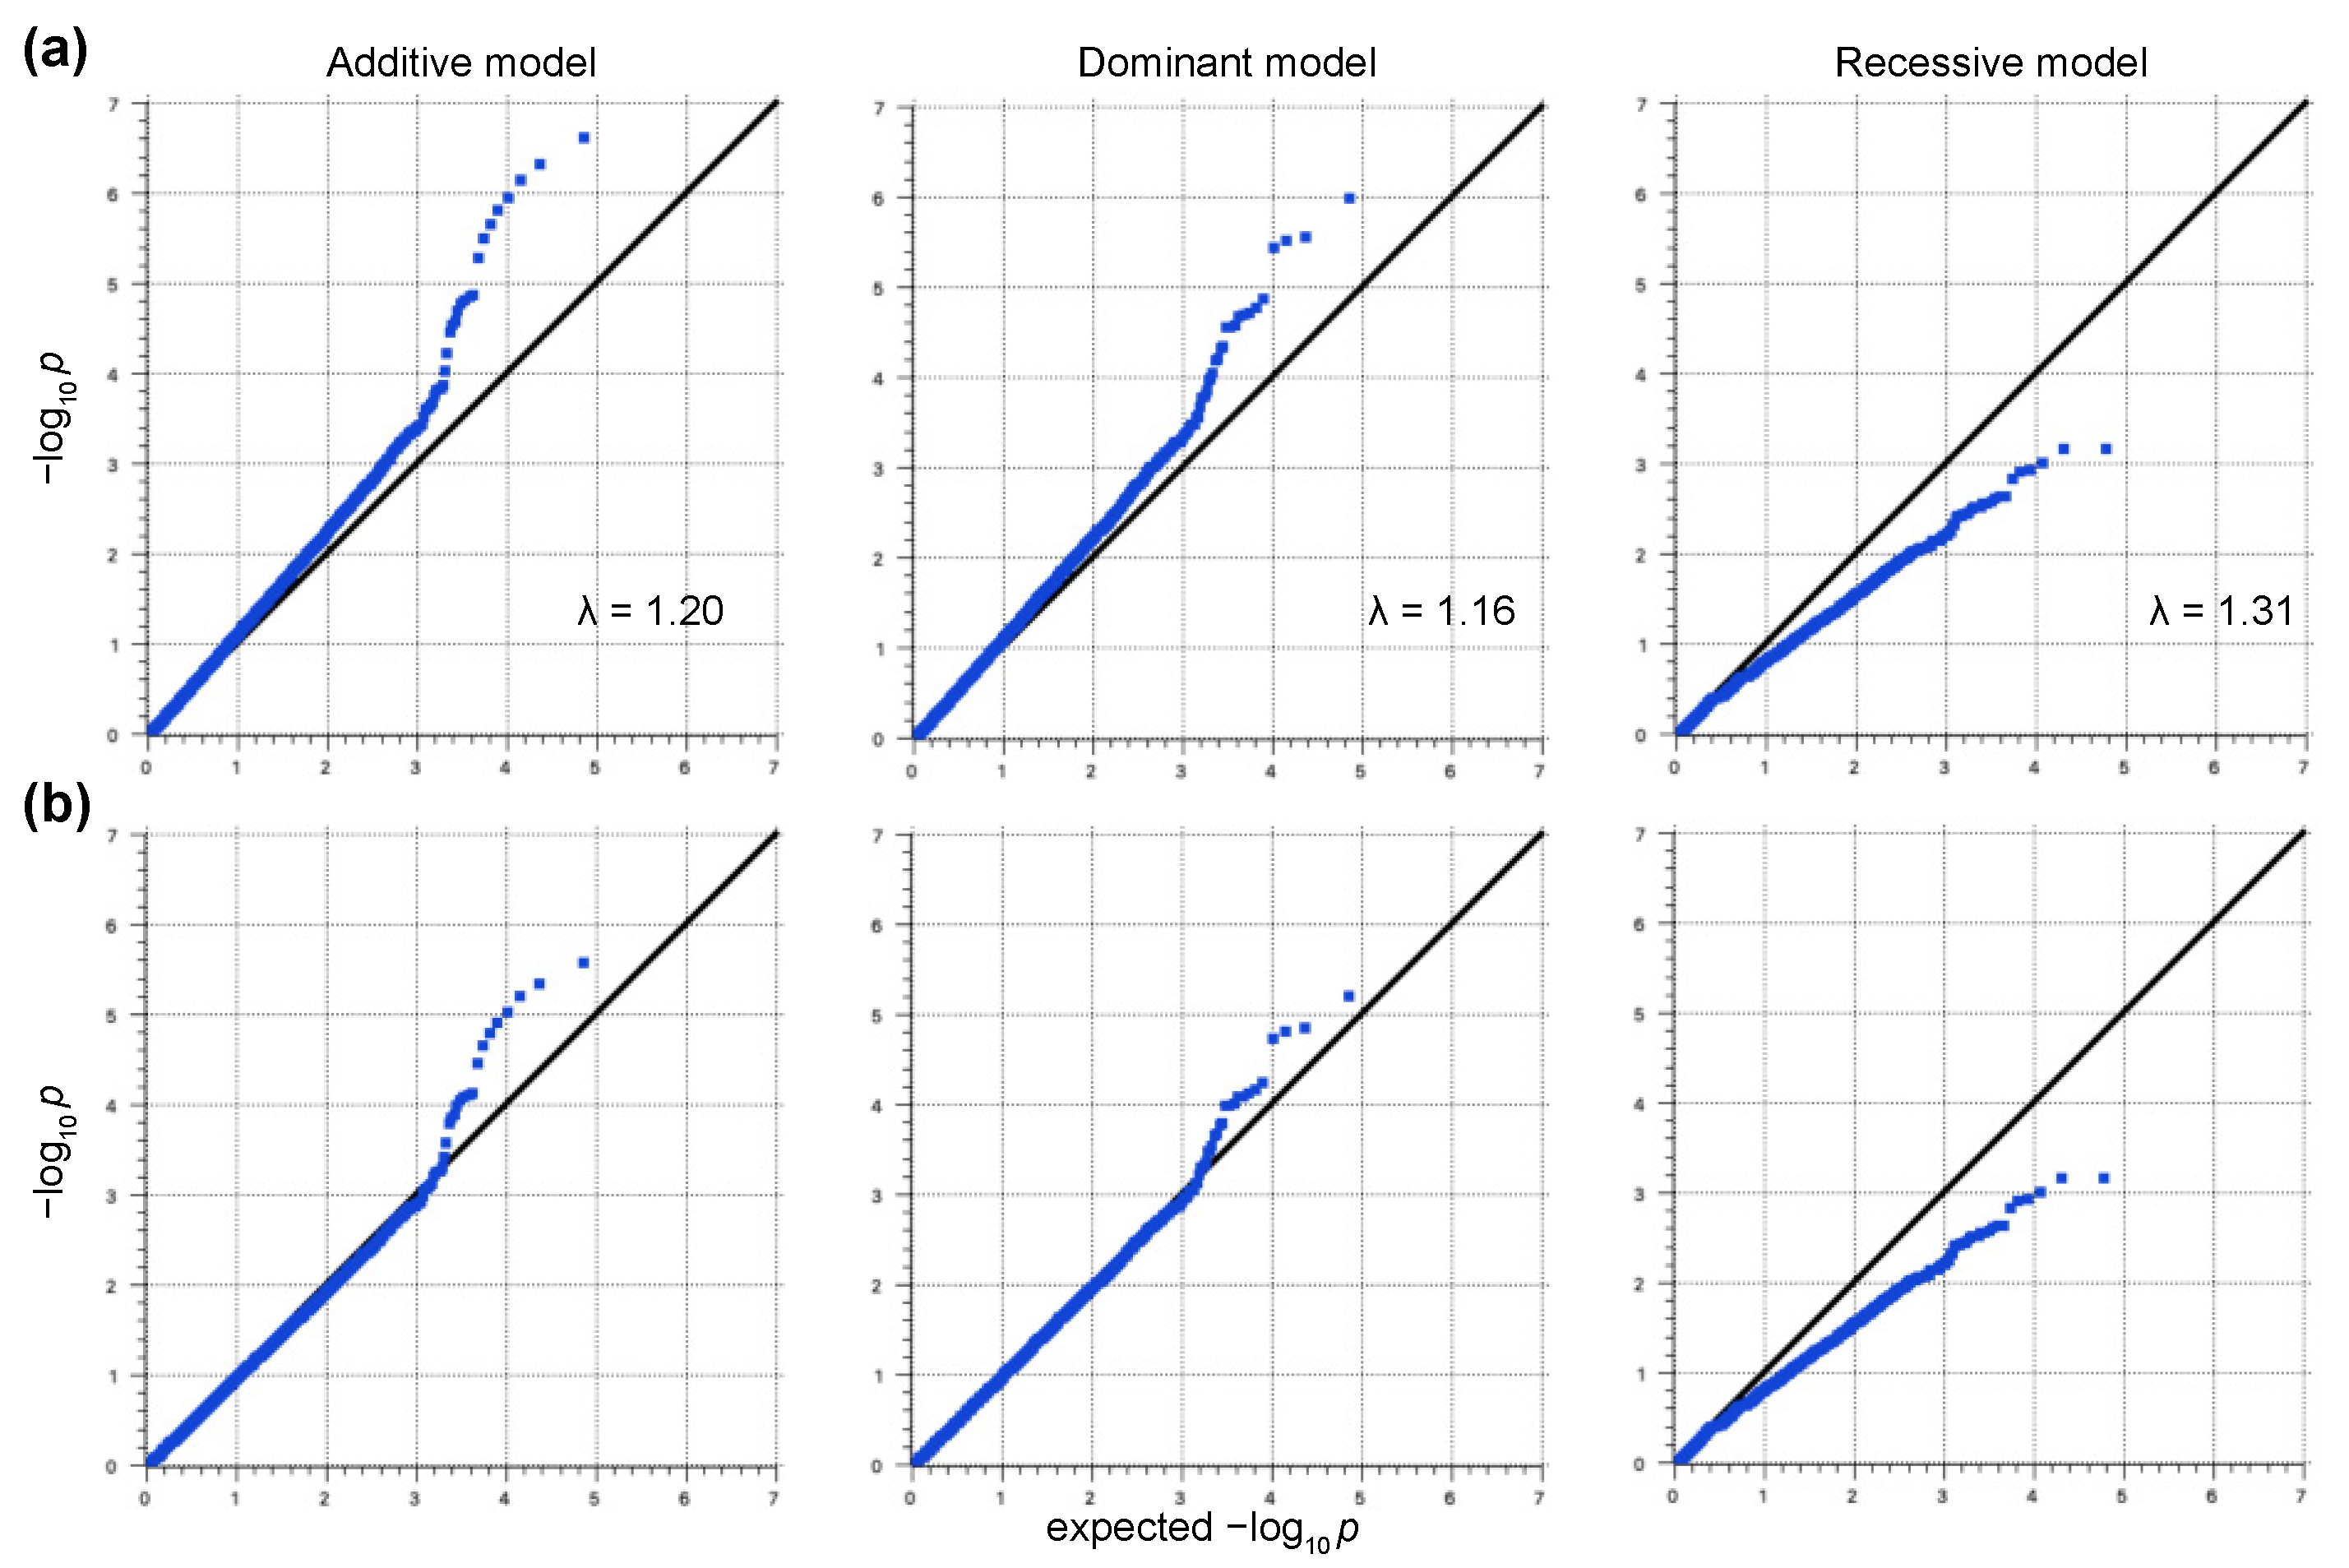
2.2. GWAS
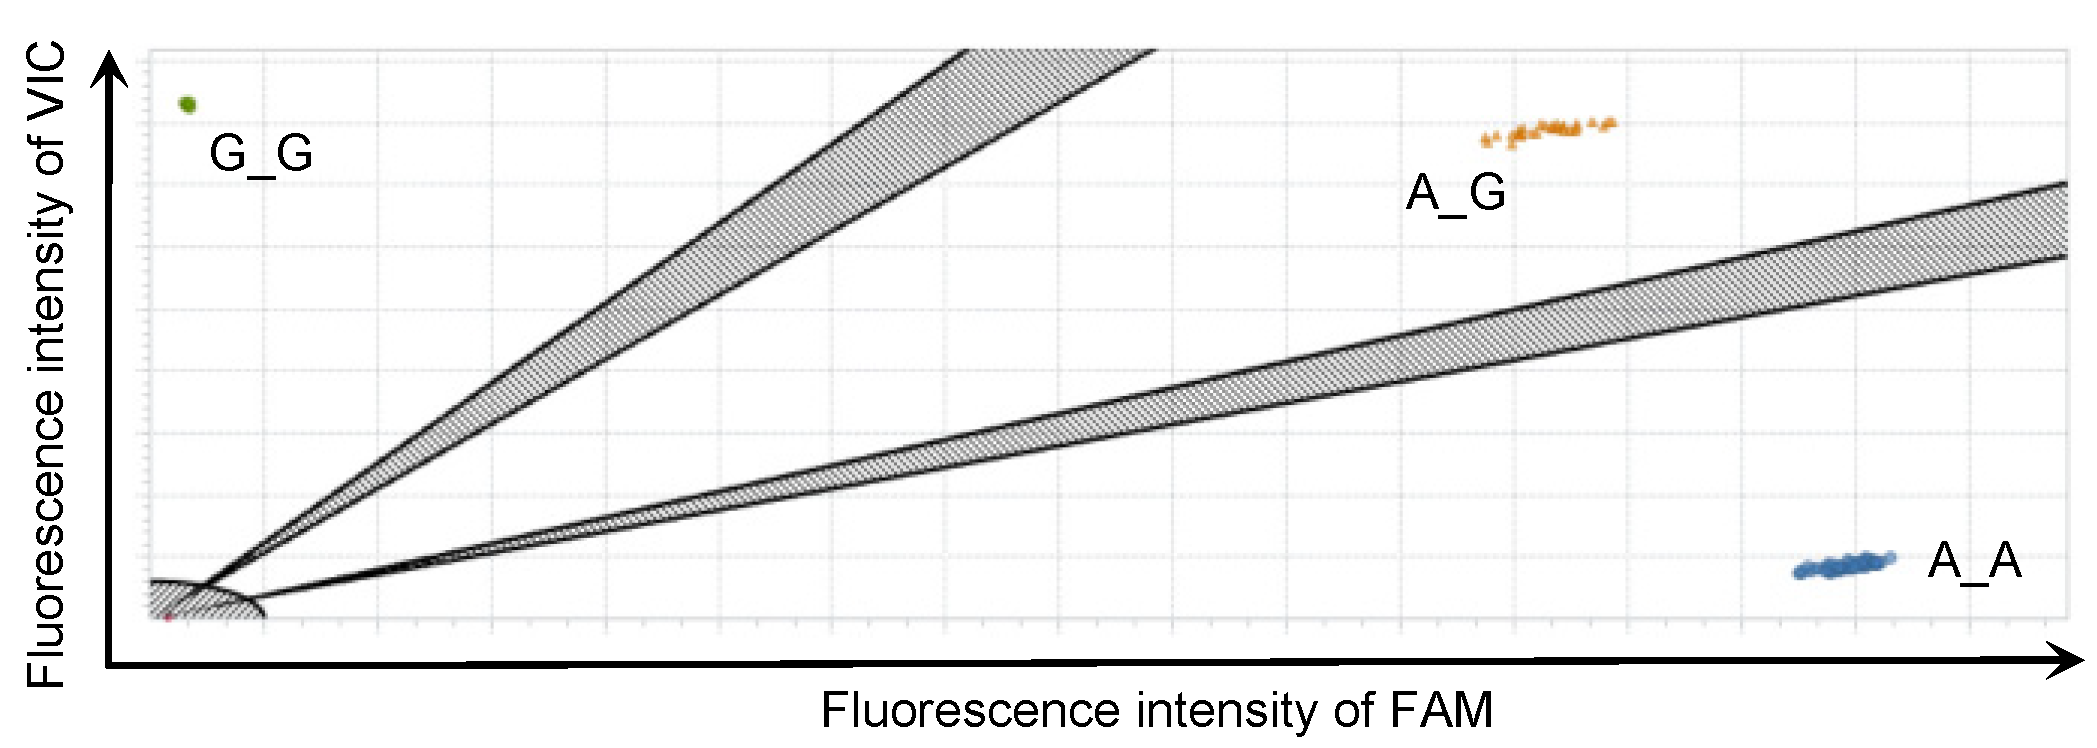
2.3. rhAmp SNP Genotyping
2.4. Statistical Analysis
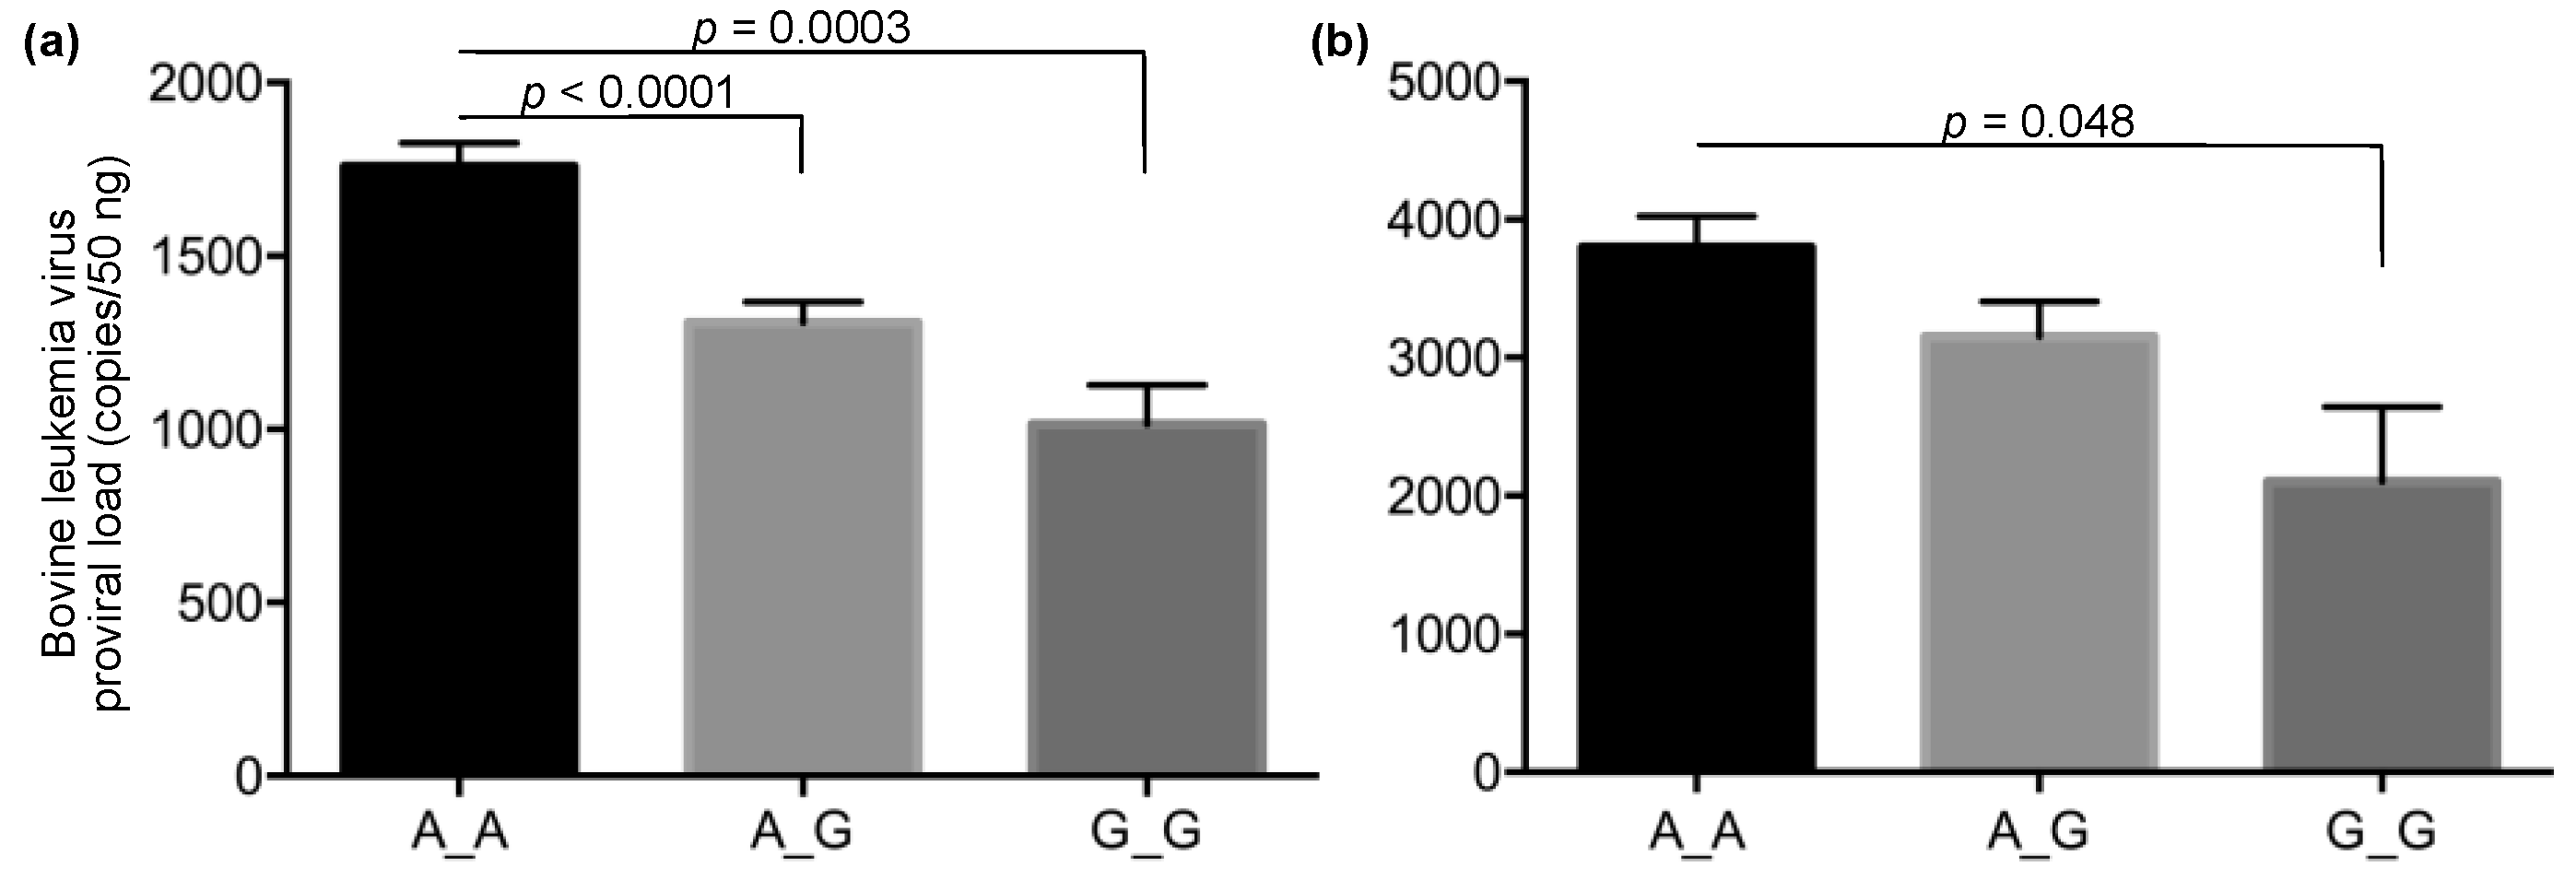
3. Results
4. Discussion
5. Conclusions
Author Contributions
Funding
Institutional Review Board Statement
Informed Consent Statement
Data Availability Statement
Acknowledgments
Conflicts of Interest
References
- Tsutsui, T.; Kobayashi, S.; Hayama, Y.; Yamamoto, T. Fraction of Bovine Leukemia Virus-Infected Dairy Cattle Developing Enzootic Bovine Leukosis. Prev. Vet. Med. 2016, 124, 96–101. [Google Scholar] [CrossRef]
- Schwartz, I.; Lévy, D. Pathobiology of Bovine Leukemia Virus. Vet. Res. 1994, 25, 521–536. [Google Scholar] [PubMed]
- Murakami, K.; Kobayashi, S.; Konishi, M.; Kameyama, K.; Tsutsui, T. Nationwide Survey of Bovine Leukemia Virus Infection among Dairy and Beef Breeding Cattle in Japan from 2009–2011. J. Vet. Med. Sci. 2013, 75, 1123–1126. [Google Scholar] [CrossRef] [PubMed] [Green Version]
- Bauermann, F.V.; Ridpath, J.F.; Dargatz, D.A. Bovine Leukemia Virus Seroprevalence among Cattle Presented for Slaughter in the United States. J. Vet. Diagn. Investig. 2017, 29, 704–706. [Google Scholar] [CrossRef] [PubMed] [Green Version]
- Ramalho, G.C.; Silva, M.L.C.R.; Falcão, B.M.R.; Limeira, C.H.; Nogueira, D.B.; dos Santos, A.M.; Martins, C.M.; Alves, C.J.; Clementino, I.J.; de Santos, C.S.A.B.; et al. High Herd-Level Seroprevalence and Associated Factors for Bovine Leukemia Virus in the Semi-Arid Paraíba State, Northeast Region of Brazil. Prev. Vet. Med. 2021, 190, 105324. [Google Scholar] [CrossRef]
- Gillet, N.A.; Gutiérrez, G.; Rodríguez, S.M.; de Brogniez, A.; Renotte, N.; Alvarez, I.; Trono, K.; Willems, L. Massive Depletion of Bovine Leukemia Virus Proviral Clones Located in Genomic Transcriptionally Active Sites during Primary Infection. PLoS Pathog. 2013, 9, e1003687. [Google Scholar] [CrossRef] [PubMed]
- Mekata, H.; Sekiguchi, S.; Konnai, S.; Kirino, Y.; Honkawa, K.; Nonaka, N.; Horii, Y.; Norimine, J. Evaluation of the Natural Perinatal Transmission of Bovine Leukaemia Virus. Vet. Rec. 2015, 176, 254. [Google Scholar] [CrossRef]
- Juliarena, M.A.; Gutierrez, S.E.; Ceriani, C. Determination of Proviral Load in Bovine Leukemia Virus-Infected Cattle with and without Lymphocytosis. Am. J. Vet. Res. 2007, 68, 1220–1225. [Google Scholar] [CrossRef]
- Kobayashi, T.; Inagaki, Y.; Ohnuki, N.; Sato, R.; Murakami, S.; Imakawa, K. Increasing Bovine Leukemia Virus (BLV) Proviral Load Is a Risk Factor for Progression of Enzootic Bovine Leucosis: A Prospective Study in Japan. Prev. Vet. Med. 2020, 178, 104680. [Google Scholar] [CrossRef] [PubMed]
- Nakada, S.; Fujimoto, Y.; Kohara, J.; Adachi, Y.; Makita, K. Estimation of Economic Loss by Carcass Weight Reduction of Japanese Dairy Cows Due to Infection with Bovine Leukemia Virus. Prev. Vet. Med. 2022, 198, 105528. [Google Scholar] [CrossRef] [PubMed]
- Watanabe, A.; Murakami, H.; Kakinuma, S.; Murao, K.; Ohmae, K.; Isobe, N.; Akamatsu, H.; Seto, T.; Hashimura, S.; Konda, K.; et al. Association between Bovine Leukemia Virus Proviral Load and Severity of Clinical Mastitis. J. Vet. Med. Sci. 2019, 81, 1431–1437. [Google Scholar] [CrossRef] [Green Version]
- Konnai, S.; Murata, S.; Ohashi, K. Immune Exhaustion during Chronic Infections in Cattle. J. Vet. Med. Sci. 2017, 79, 1–5. [Google Scholar] [CrossRef] [Green Version]
- Xu, A.; van Eijk, M.J.; Park, C.; Lewin, H.A. Polymorphism in BoLA-DRB3 Exon 2 Correlates with Resistance to Persistent Lymphocytosis Caused by Bovine Leukemia Virus. J. Immunol. 1993, 151, 6977–6985. [Google Scholar]
- Daous, H.E.; Mitoma, S.; Elhanafy, E.; Nguyen, H.T.; Mai, N.T.; Notsu, K.; Kaneko, C.; Norimine, J.; Sekiguchi, S. Relationship between Allelic Heterozygosity in BoLA-DRB3 and Proviral Loads in Bovine Leukemia Virus-Infected Cattle. Animals 2021, 11, 647. [Google Scholar] [CrossRef]
- Hayashi, T.; Mekata, H.; Sekiguchi, S.; Kirino, Y.; Mitoma, S.; Honkawa, K.; Horii, Y.; Norimine, J. Cattle with the BoLA Class II DRB3*0902 Allele Have Significantly Lower Bovine Leukemia Proviral Loads. J. Vet. Med. Sci. 2017, 79, 1552–1555. [Google Scholar] [CrossRef] [PubMed] [Green Version]
- Takeshima, S.; Ohno, A.; Aida, Y. Bovine Leukemia Virus Proviral Load Is More Strongly Associated with Bovine Major Histocompatibility Complex Class II DRB3 Polymorphism than with DQA1 Polymorphism in Holstein Cow in Japan. Retrovirology 2019, 16, 14. [Google Scholar] [CrossRef]
- Juliarena, M.A.; Poli, M.; Sala, L.; Ceriani, C.; Gutierrez, S.; Dolcini, G.; Rodríguez, E.M.; Mariño, B.; Rodríguez-Dubra, C.; Esteban, E.N. Association of BLV Infection Profiles with Alleles of the BoLA-DRB3.2 Gene. Anim. Genet. 2008, 39, 432–438. [Google Scholar] [CrossRef]
- Amills, M.; Ramiya, V.; Norimine, J.; Lewin, H.A. The Major Histocompatibility Complex of Ruminants. Rev. Sci. Technol. 1998, 17, 108–120. [Google Scholar] [CrossRef] [Green Version]
- Glass, E.J. Genetic Variation and Responses to Vaccines. Anim. Health Res. Rev. 2004, 5, 197–208. [Google Scholar] [CrossRef] [PubMed]
- Lo, C.-W.; Takeshima, S.; Okada, K.; Saitou, E.; Fujita, T.; Matsumoto, Y.; Wada, S.; Inoko, H.; Aida, Y. Association of Bovine Leukemia Virus-Induced Lymphoma with BoLA-DRB3 Polymorphisms at DNA, Amino Acid, and Binding Pocket Property Levels. Pathogens 2021, 10, 437. [Google Scholar] [CrossRef] [PubMed]
- Carignano, H.A.; Roldan, D.L.; Beribe, M.J.; Raschia, M.A.; Amadio, A.; Nani, J.P.; Gutierrez, G.; Alvarez, I.; Trono, K.; Poli, M.A.; et al. Genome-Wide Scan for Commons SNPs Affecting Bovine Leukemia Virus Infection Level in Dairy Cattle. BMC Genom. 2018, 19, 142. [Google Scholar] [CrossRef] [PubMed] [Green Version]
- Takeshima, S.-N.; Sasaki, S.; Meripet, P.; Sugimoto, Y.; Aida, Y. Single Nucleotide Polymorphisms in the Bovine MHC Region of Japanese Black Cattle Are Associated with Bovine Leukemia Virus Proviral Load. Retrovirology 2017, 14, 24. [Google Scholar] [CrossRef] [PubMed]
- Brym, P.; Bojarojć-Nosowicz, B.; Oleński, K.; Hering, D.M.; Ruść, A.; Kaczmarczyk, E.; Kamiński, S. Genome-Wide Association Study for Host Response to Bovine Leukemia Virus in Holstein Cows. Vet. Immunol. Immunop. 2016, 175, 24–35. [Google Scholar] [CrossRef]
- Petersen, M.I.; Carignano, H.A.; Archilla, G.S.; Caffaro, M.E.; Alvarez, I.; Miretti, M.M.; Trono, K. Expression-Based Analysis of Genes Related to Single Nucleotide Polymorphism Hits Associated with Bovine Leukemia Virus Proviral Load in Argentinean Dairy Cattle. J. Dairy Sci. 2021, 104, 1993–2007. [Google Scholar] [CrossRef] [PubMed]
- Mekata, H.; Kusuda, E.; Mori, C. Avoidance of Natural Suckling from Dams with Bovine Leukemia Virus Is a Low Priority Countermeasure against Postnatal Transmission. Vet. Sci. 2021, 8, 255. [Google Scholar] [CrossRef]
- Mekata, H.; Yamamoto, M.; Hayashi, T.; Kirino, Y.; Sekiguchi, S.; Konnai, S.; Horii, Y.; Norimine, J. Cattle with a Low Bovine Leukemia Virus Proviral Load Are Rarely an Infectious Source. Jpn. J. Vet. Res. 2018, 66, 157–163. [Google Scholar] [CrossRef]
- Devlin, B.; Roeder, K. Genomic Control for Association Studies. Biometrics 1999, 55, 997–1004. [Google Scholar] [CrossRef]
- Jiang, Y.; Epstein, M.P.; Conneely, K.N. Assessing the Impact of Population Stratification on Association Studies of Rare Variation. Hum. Hered. 2013, 76, 28–35. [Google Scholar] [CrossRef] [Green Version]
- Broccanello, C.; Chiodi, C.; Funk, A.; McGrath, J.M.; Panella, L.; Stevanato, P. Comparison of Three PCR-Based Assays for SNP Genotyping in Plants. Plant Methods 2018, 14, 28. [Google Scholar] [CrossRef] [Green Version]
- Dam, A.H.D.M.; Koscinski, I.; Kremer, J.A.M.; Moutou, C.; Jaeger, A.-S.; Oudakker, A.R.; Tournaye, H.; Charlet, N.; Lagier-Tourenne, C.; van Bokhoven, H.; et al. Homozygous Mutation in SPATA16 Is Associated with Male Infertility in Human Globozoospermia. Am. J. Hum. Genet. 2007, 81, 813–820. [Google Scholar] [CrossRef] [Green Version]
- Fujihara, Y.; Oji, A.; Larasati, T.; Kojima-Kita, K.; Ikawa, M. Human Globozoospermia-Related Gene Spata16 Is Required for Sperm Formation Revealed by CRISPR/Cas9-Mediated Mouse Models. Int. J. Mol. Sci. 2017, 18, 2208. [Google Scholar] [CrossRef] [PubMed] [Green Version]
- Xu, M.; Xiao, J.; Chen, J.; Li, J.; Yin, L.; Zhu, H.; Zhou, Z.; Sha, J. Identification and Characterization of a Novel Human Testis-specific Golgi Protein, NYD-SP12. Mol. Hum. Reprod. 2003, 9, 9–17. [Google Scholar] [CrossRef] [PubMed] [Green Version]


| SNP ID | Chromosome | Position a | Model | p-Value b | Minor Allele | Minor Allele Frequency |
|---|---|---|---|---|---|---|
| AX-168291905 | 1 | 95,193,165 | Additive | 6.15 × 10⁻⁶ | G | 0.214 |
| Dominant | 6.03 × 10⁻⁶ | |||||
| AX-185116447 | 23 | 28,568,745 | Additive | 2.53 × 10⁻⁶ | A | 0.453 |
| AX-115113358 | 23 | 30,773,701 | Additive | 4.34 × 10⁻⁶ | T | 0.361 |
| AX-124375550 | 23 | 25,642,674 | Additive | 9.13 × 10⁻⁶ | T | 0.383 |
| Japanese Black Cattle b | Holstein Cattle b | |||||
|---|---|---|---|---|---|---|
| Genotype | A_A | A_G | G_G | A_A | A_G | G_G |
| High PVL group a | 64.0% (261) | 31.4% (128) | 4.7% (19) | 60.6% (151) | 34.9% (87) | 4.4% (11) |
| Low PVL group a | 45.5% (112) | 44.7% (110) | 9.8% (24) | 46.5% (46) | 44.4% (44) | 9.1% (9) |
Publisher’s Note: MDPI stays neutral with regard to jurisdictional claims in published maps and institutional affiliations. |
© 2022 by the authors. Licensee MDPI, Basel, Switzerland. This article is an open access article distributed under the terms and conditions of the Creative Commons Attribution (CC BY) license (https://creativecommons.org/licenses/by/4.0/).
Share and Cite
Mekata, H.; Yamamoto, M. Single-Nucleotide Polymorphism on Spermatogenesis Associated 16 Gene-Coding Region Affecting Bovine Leukemia Virus Proviral Load. Vet. Sci. 2022, 9, 275. https://doi.org/10.3390/vetsci9060275
Mekata H, Yamamoto M. Single-Nucleotide Polymorphism on Spermatogenesis Associated 16 Gene-Coding Region Affecting Bovine Leukemia Virus Proviral Load. Veterinary Sciences. 2022; 9(6):275. https://doi.org/10.3390/vetsci9060275
Chicago/Turabian StyleMekata, Hirohisa, and Mari Yamamoto. 2022. "Single-Nucleotide Polymorphism on Spermatogenesis Associated 16 Gene-Coding Region Affecting Bovine Leukemia Virus Proviral Load" Veterinary Sciences 9, no. 6: 275. https://doi.org/10.3390/vetsci9060275
APA StyleMekata, H., & Yamamoto, M. (2022). Single-Nucleotide Polymorphism on Spermatogenesis Associated 16 Gene-Coding Region Affecting Bovine Leukemia Virus Proviral Load. Veterinary Sciences, 9(6), 275. https://doi.org/10.3390/vetsci9060275