Abstract
Background: Dairy goats are highly susceptible to subclinical hyperketonemia (SCHK) during the transition period. This study aimed to compare the variation in metabolic parameters and surrogate indexes of insulin resistance (sIR) between goats with SCHK and clinically healthy (HEAL) goats during the transition period. Methods: Twenty Guanzhong dairy goats were assorted to HEAL (n = 10) and SCHK (n = 10) groups according to the blood β-hydroxybutyrate (BHBA) concentrations. The blood samples were taken from the jugular vein of each goat at −3, −2, −1, 0 (partum), +1, +2, and +3 weeks relative to kidding to analyses GLU and INS. The sIR was calculated from blood metabolic parameters. Results: Compared with the HEAL goats, the insulin concentrations were significantly higher in SCHK goats during the first three weeks postpartum. The QUICKI, revised QUICKI (RQUICKI), and RQUICKIBHBA were significantly lower in goats with SCHK at 1 week postpartum, while the homeostasis model assessment-IR (HOMA-IR) was significantly higher. Conclusion: Goats with SCHK made more efforts through elevated insulin levels at early lactation than HEAL goats, thereby maintaining the normal glucose concentrations.
1. Introduction
The transition period, ranging from 3 weeks prepartum to 3 weeks postpartum, is vital to the health status and reproductive performance of dairy goats [1]. During this period, fetal growth and milk secretion lead to a sharp increase of energy demands. As the rumen is squeezed by fetus, dry matter intake (DMI) is less than normal, leading to an inadequate energy intake [2]. Then, the negative energy balance (NEB) occurs when energy output overpasses input. The situation of energy deficiency motivates adipose tissue mobilization, resulting in elevated concentrations of nonesterified fatty acids (NEFA) and ketone bodies in the blood [3]. Hyperketonemia, which is defined as the increase of ketone bodies in the blood, is one of the metabolic disorders caused by NEB [4]. In dairy goats, hyperketonemia is also known as lactation ketosis or pregnancy toxemia, which usually happens in early postpartum or late pregnancy [5]. Subclinical hyperketonemia (SCHK) usually has no typical symptoms compared with clinical forms, but this metabolic disorder makes dairy goats more susceptible to other production diseases, such as mastitis and hypocalcemia [6]. Furthermore, SCHK is more common than clinical forms. The prevalence of SCHK of the Guanzhong goat in China is about 10% [7], thereby causing enormous economic losses to the dairy goat husbandry due to decreased milk production and SCHK-associated peripartal diseases.
Insulin resistance (IR) is a homeorhetic adaptation in ruminants for partitioning nutrients to support the uterus and mammary gland during the peripartum period [8]. Several surrogate indexes of IR (sIR) are developed to estimate INS sensitivity in human and veterinary medicine, which are calculated on the basis of blood NEAF, BHBA, GLU, and INS. These indexes include homeostasis model assessment-IR (HOMA-IR), quantitative INS sensitivity check index (QUICKI), revised quantitative INS sensitivity check index (RQUICKI), and revised quantitative INS sensitivity check index including β-hydroxybutyrate (RQUICKIBHBA) [9]. The sIR is convenient and simple to use compared with direct measurements of IR such as hyperinsulinemic-euglycemic clamp test (HEC), GLU tolerance test (GTT), and INS tolerance test (ITT) [10]. Several research studies have adopted sIR to estimate INS sensitive in dairy cows [11,12,13].
Underlying mechanisms of SCHK-induced insulin resistance is not yet unstudied in dairy goats. However, in dairy cows, many studies show a closed relationship between NEFA/BHBA with insulin resistance. An increased circulating NEFA concentration has been shown to cause an impaired insulin-stimulated glucose uptake by insulin-sensitive tissues [14]. A group of cows with high BHBA exhibited a higher insulin resistance, which was measured by GTT [15]. Another research study found that the elevated values of cortisol, insulin, NEFA, and BHBA are suggestive of impaired whole-body insulin sensitivity in SCHK cows during the transition period [16]. These data have demonstrated that there was a closed relationship between SCHK and IR, and IR plays a potential role in the development of SCHK. However, the relationship between IR and SCHK in dairy goats is not well understood. The purpose of this study was to compare the variations in sIR and metabolic parameters between dairy goats with SCHK and clinically healthy (HEAL) goats during the transition period.
2. Materials and Methods
2.1. Animals, Location, and Study Design
The study was conducted in Western China (106°55′57″ E, 34°48′41″ N) at the experimental farm of Northwest A&F University (Shaanxi Province, China) between January and March in 2019. The protocol is schematically presented in Figure 1. Two steps were used to screen and group animals. In the first step, 2305 Guanzhong dairy goats on the farm were subjected to estrous synchronization in September so that kidding occurred in February. Then, 96 Guanzhong dairy goats were enrolled and chosen from 2305 Guanzhong dairy goats according to body condition score (BCS) (2.75 ± 0.15, mean ± SEM), parity (primiparous), expected kidding date (within the first week of February), and no medical history. The second step was to select these experimental goats by the litter size of singleton and allocate them to one of the following two groups according to their plasma BHBA concentrations: SCHK (n = 10; BHBA = 0.8–1.7 mmol/L) or HEAL (n = 10; BHBA < 0.8 mmol/L) [6,17,18]. The goats were reared in a free-stall barn from 3 weeks prior to the anticipated time of kidding until 3 weeks after kidding. All goats were fed the same diets comprising a base ration fed as a TMR, which was formulated to meet the nutrient requirements of dairy goats during the transition period according to the Nutrient Requirements of Small Ruminants (National Research Council, 2007). The goats had free access to water, and diets were fed ad libitum during the experimental period. The diet was offered twice daily at 0730 and 1530 h.
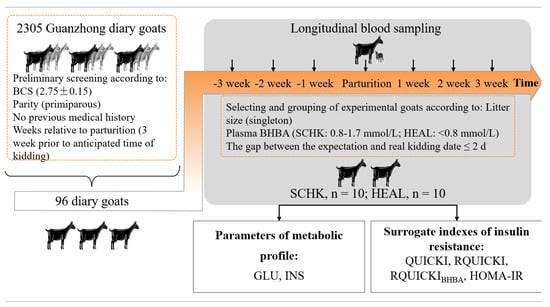
Figure 1.
Study design. Two steps were used to screen and group animals. In the first step, 2035 Guanzhong dairy goats in the farm were subjected to estrous synchronization in September so that kidding occurred in February. Then, 96 Guanzhong dairy goats were enrolled and chosen from 2305 Guanzhong dairy goats according to BCS (2.75 ± 0.15), parity (primiparous), expected kidding date (within the first week of February), and no medical history. The blood samples were taken from the jugular vein of each goat at −3, −2, −1, 0 (partum), +1, +2, and +3 weeks relative to delivery, using vacutainer tubes with sodium heparin. The second step was to select these experimental goats by the litter size of singleton and allocate them to one of two groups according to their plasma BHBA concentrations, as either SCHK (n = 10; BHBA = 0.8–1.7 mmol/L) or HEAL (n = 10; BHBA < 0.8 mmol/L). Finally, the plasma biomarkers of metabolites were measured, and sIR were calculated.
2.2. Plasma Samples and Laboratory Analyses
The blood samples were taken from the jugular vein of each goat at −3, −2, −1, 0 (partum), +1, +2, and +3 weeks relative to kidding, using vacutainer tubes with sodium heparin (Becton-Dickinson, Franklin Lakes, NJ, USA). Blood samples were collected before feeding in the morning prepartum, within 24 h after parturition, and after milking but before feeding in the morning postpartum. All the tubes were immediately placed on ice, centrifuged at 2000 g for 10 min, and stored at −80 °C until analyses of glucose (GLU), insulin (INS), BHBA, and NEFA concentrations.
Plasma concentrations of GLU (cat. No. GL8038, GOD-PAP method), BHBA (cat. No. RB1007, enzymatic method), and NEFA (cat No. FA115, colorimetric method) were analyzed using commercial kits (Randox Laboratories Limited, Crumlin, UK) and an automatic blood analyzer (Hitachi High-Technologies Corporation, Tokyo, Japan). Plasma INS concentrations were measured using a commercial goat INS enzyme-linked immunosorbent assay kit (cat No. MM-14170, Meimian Biotechnology, Yancheng, Jiangsu, China) and a microplate reader Bio-Rad 680 (Bio-Rad, Hercules, CA, USA) at 450 nm following the manufacturers’ protocols. The intra- and inter-assay coefficients of variation were 5.0 and 5.3%, respectively.
2.3. Surrogate Indexes for IR
The sIR, HOMA-IR, QUICKI, RQUICKI, and RQUICKIBHBA, was calculated using the following equations [9]:
HOMA-IR = [GLU (mmol/L) + INS (μIU/mL)]/22.5
QUICKI = 1/[lg GLU (mg/dL) + lg INS (μIU/mL)]
RQUICKI = 1/[lg GLU (mg/dL) + lg INS (μIU/mL) + lg NEFA (mmol/L)]
RQUICKIBHBA = 1/[lg GLU (mg/dL) + lg INS (μIU/mL) + lg NEFA (mmol/L) + lg BHBA (mmol/L)]
2.4. Statistical Analysis
The data were statistically analyzed using GraphPad Prism 7.0 (GraphPad Software Inc., La Jolla, CA, USA). Repeated-measures analysis of variance, followed by Tukey’s multiple comparison test, was used to evaluate the differences in plasma metabolites and sIR. Repeated measures on each goat were taken into account (repeated factor: time during the transition period). The results were presented as mean ± SEM.
3. Results
The results of the present study showed that HEAL goats had slightly higher plasma GLU concentrations than SCHK except at 1 week postpartum (Figure 2A). The INS concentrations were significantly higher in goats with SCHK than in HEAL goats during early lactation (p < 0.05 or p < 0.01, Figure 2B). The QUICKI, RQUICKI, and RQUICKIBHBA were significantly lower in goats with SCHK at 1 week postpartum than in HEAL (p < 0.05 or p < 0.01, Figure 2C–E). In contrast, The HOMA-IR was significantly higher in goats with SCHK at 1 week postpartum compared with the HEAL goats (p < 0.01, Figure 2F). The RQUICKI and RQUICKIBHBA were the lowest at parturition.
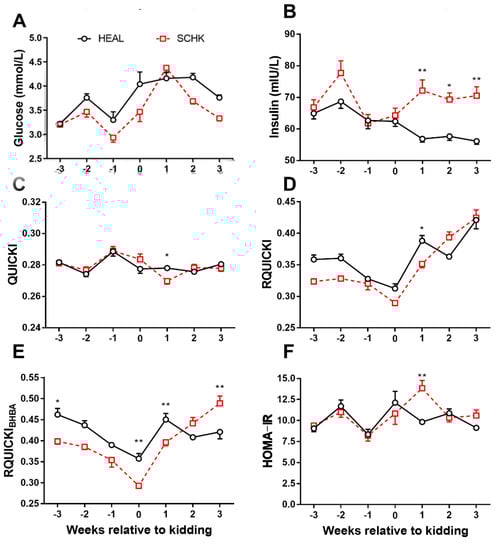
Figure 2.
Changes in the concentrations of glucose (A), insulin (B), QUICKI (C), RQUICKI (D), RQUICKIBHBA (E), and HOMA-IR (F) in goats with SCHK and HEAL goats during the peripartum period. * p < 0.05, ** p < 0.01. Values are presented as means ± SEM from 10 goats per group (n = 10).
4. Discussion
In the present study, we found that HEAL goats had slightly higher plasma GLU than SCHK. Another study found higher GLU concentrations in HEAL goats compared with multiparous goats with SCHK, which was consistent with the results of the present study [19]. The differences in the parity and severity of hyperketonemia might explain significant differences between the two studies. The lower GLU concentrations in SCHK were possibly a result of decreased endogenous GLU production, which was suppressed by high BHBA concentrations around parturition [2,20]. Unlike GLU, the INS concentrations were significantly higher in goats with SCHK than in HEAL goats during early lactation. This observation was consistent with a previous report in dairy cow [16]. It was speculated that INS secretion induced by elevated BHBA concentrations during lactation avoided further mobilization of adipose tissue, giving priority to energy for lactation [21]. The concentrations of INS in SCHK goats had significant increases after kidding. In our research, the plasma GLU in SCHK goats is just slightly lower than HEAL goats, but the plasma INS in SCHK goats is significantly higher than HEAL. That means that the large amounts of INS could not induce a comparable insulin-stimulated glucose utilization by skeletal muscle and adipose tissue. In other words, insulin induced a decreased biological response in insulin-sensitive tissues, which means insulin resistance.
Several surrogate indexes have been referenced as the evaluation indexes of INS sensitivity according to their importance in veterinary medicine [22]. The results of this study showed that the values of QUICKI, RQUICKI, and RQUICKIBHBA were lower, while the value of HOMA-IR was higher, at 1 week postpartum in goats with SCHK compared with HEAL goats. It was concluded that goats with SCHK in this study exhibited significantly lower INS sensitivity at 1 week postpartum. However, estimating INS sensitivity using the aforementioned indexes in farm animals is still debatable. One study reported just two parameters of GTT, which are GLU clearance rate and fatty acids; area under the curve had weak correlations with IRs in periparturient dairy cows [23]. Another showed that IRs were not correlations with the parameters derived from the HEC in dairy cows at the end of the dry period [10]. More studies are needed to investigate the relationship between sIR and the parameters of direct measurements in order to determine the availability and effectiveness of sIR in dairy goats.
5. Conclusions
The results of the present study demonstrated that dairy goats with SCHK made more efforts to maintain the normal concentrations of GLU through elevated INS levels during the first 3 weeks of lactation.
Author Contributions
S.L. performed the experiments and wrote the manuscript; Y.K., J.W. (Jing Wen), and Y.H. designed the experiments; Y.L. collected the materials in this study; X.Z. and B.Z. managed laboratory work; B.C. revised the manuscript; J.W. (Jianguo Wang) obtained the funding and revised the manuscript. All authors have read and agreed to the published version of the manuscript.
Funding
This study was funded by the National Natural Science Foundation of China (grant number 31873032) and the Key Research and Development Project of Shaanxi Province, China (grant numbers 2019NY-075, NYKJ-2019-YL21).
Institutional Review Board Statement
The study was approved by the Animal Ethical and Welfare Committee, Northwest A&F University (approval code: 2021046).
Informed Consent Statement
Not applicable.
Acknowledgments
We thank Bo Li and his colleagues for expert technical assistance in the commercial dairy farm located in Shaanxi Province of China.
Conflicts of Interest
The authors declare no conflict of interest. The funders had no role in the design of the study; in the collection, analyses, or interpretation of data; in the writing of the manuscript, or in the decision to publish the results.
Abbreviations
| SCHK | Subclinical hyperketonemia |
| HEAL | Health |
| HK | Hyperketonemia |
| BHBA | β-hydroxybutyrate |
| INS | Insulin |
| GLU | Glucose |
| NEFA | Non-esterified fatty acids |
| IR | Insulin resistance |
| sIR | Surrogate indexes of insulin resistance |
| QUICKI | Quantitative insulin sensitivity check index |
| RQUICKI | Revised quantitative insulin sensitivity check index |
| RQUICKIBHBA | Revised quantitative insulin sensitivity check index including β-hydroxybutyrate |
| HOMA-IR | Homeostasis model assessmentinsulin resistance |
| DMI | Dry matter intake |
| AT | Adipose tissue |
| BCS | Body condition score |
| NEB | Negative energy balance |
| HEC | Hyperinsulinemic euglycemic clamp test |
| GTT | Glucose tolerance test |
| ITT | Insulin tolerance test |
References
- Matthews, J.G. Diseases of the Goat: The Periparturient Goat, 4th ed.; John Wiley & Sons Limited: Chichester, UK, 2016. [Google Scholar]
- Hayirli, A. The role of exogenous insulin in the complex of hepatic lipidosis and ketosis associated with insulin resistance phenomenon in postpartum dairy cattle. Vet. Res. Commun. 2006, 30, 749–774. [Google Scholar] [CrossRef] [PubMed]
- Cai, C.; Kong, Y.; Wu, D.; Wang, J. Changes of macrominerals and calcitropic hormones in serum of periparturient dairy cows subject to subclinical hypocalcaemia. J. Dairy Res. 2018, 85, 12–15. [Google Scholar] [CrossRef] [PubMed]
- Dore, V.; Dubuc, J.; Belanger, A.M.; Buczinski, S. Definition of prepartum hyperketonemia in dairy goats. J. Dairy Sci. 2015, 98, 4535–4543. [Google Scholar] [CrossRef] [PubMed]
- Marteniuk, J.V.; Herdt, T.H. Pregnancy toxemia and ketosis of ewes and does. Vet. Clin. N. A. Food. A. 1988, 4, 307–315. [Google Scholar] [CrossRef]
- Simões, J.; Gutiérrez, C. Nutritional and Metabolic Disorders in Dairy Goats. In Sustainable Goat Production in Adverse Environments, 1st ed.; Simões, J., Gutiérrez, C., Eds.; Springer International Publishing: Chan, France, 2017; Volume 1, pp. 177–194. [Google Scholar]
- Metabolic Characteristics of Subclinical Hyperketonemia and Subclinical Hypocalcemia in Dairy Goats. Available online: http://www.cnhonneur.net/news/10.html (accessed on 27 February 2020).
- Zamuner, F.; DiGiacomo, K.; Cameron, A.W.N.; Leury, B.J. Endocrine and metabolic status of commercial dairy goats during the transition period. J. Dairy Sci. 2020, 103, 5616–5628. [Google Scholar] [CrossRef] [PubMed]
- De Koster, J.D.; Opsomer, G. Insulin resistance in dairy cows. Vet. Clin. N. A. Food. A. 2013, 29, 299–322. [Google Scholar] [CrossRef] [PubMed]
- De Koster, J.; Hostens, M.; Hermans, K.; Broeck, W.v.D.; Opsomer, G. Validation of different measures of insulin sensitivity of glucose metabolism in dairy cows using the hyperinsulinemic euglycemic clamp test as the gold standard. Domest. Anim. Endocrin. 2016, 57, 117–126. [Google Scholar] [CrossRef] [PubMed]
- Holtenius, P.; Holtenius, K. A model to estimate insulin sensitivity in dairy cows. Acta Vet. Scand. 2007, 49, 29. [Google Scholar] [CrossRef] [PubMed]
- Rico, J.E.; Bandaru, V.V.; Dorskind, J.M.; Haughey, N.J.; McFadden, J.W. Plasma ceramides are elevated in overweight Holstein dairy cows experiencing greater lipolysis and insulin resistance during the transition from late pregnancy to early lactation. J. Dairy Sci. 2015, 98, 7757–7770. [Google Scholar] [CrossRef] [PubMed]
- Abuelo, A.; Hernandez, J.; Benedito, J.L.; Castillo, C. Association of oxidative status and insulin sensitivity in periparturient dairy cattle: An observational study. J. Anim. Physiol. Anim. Nutr. 2016, 100, 279–286. [Google Scholar] [CrossRef] [PubMed]
- Schoenberg, K.M.; Ehrhardt, R.M.; Overton, T.R. Effects of plane of nutrition and feed deprivation on insulin responses in dairy cattle during late gestation. J. Dairy Sci. 2012, 95, 670–682. [Google Scholar] [CrossRef] [PubMed]
- Kerestes, M.; Faigl, V.; Kulcsar, A.; Balogh, O.; Foldi, J.; Febel, H.; Chilliard, Y.; Huszenicza, G. Periparturient insulin secretion and whole-body insulin responsiveness in dairy cows showing various forms of ketone pattern with or without puerperal metritis. Domest. Anim. Endocrin. 2009, 37, 250–261. [Google Scholar] [CrossRef] [PubMed]
- Youssef, M.A.; El-Ashker, M.R.; Younis, M.S. The effect of subclinical ketosis on indices of insulin sensitivity and selected metabolic variables in transition dairy cattle. Comp. Clin. Pathol. 2017, 26, 329–334. [Google Scholar] [CrossRef]
- Ramin, A.G.; Asri, S.; Majdani, R. Correlations among serum glucose, beta-hydroxybutyrate and urea concentrations in non-pregnant ewes. Small Rumin. Res. 2005, 57, 265–269. [Google Scholar] [CrossRef]
- Sadjadian, R.; Seifi, H.A.; Mohri, M.; Naserian, A.A.; Farzaneh, N. Variations of energy biochemical metabolites in periparturient dairy Saanen goats. Comp. Clin. Pathol. 2013, 22, 449–456. [Google Scholar] [CrossRef]
- Ismail, Z.A.B.; Al-Majali, A.M.; Amireh, F.; Al-Rawashdeh, O.F.; Ismail, Z.; Al-Majali, A.; Amireh, F.; Al-Rawashdeh, O. Metabolic profiles in goat does in late pregnancy with and without subclinical pregnancy toxemia. Vet. Clin. Pathol. 2008, 37, 434–437. [Google Scholar] [CrossRef] [PubMed]
- Schlumbohm, C.; Harmeyer, J. Hyperketonemia impairs glucose metabolism in pregnant and nonpregnant ewes. J. Dairy Sci. 2004, 87, 350–358. [Google Scholar] [CrossRef]
- Magistrelli, D.; Rosi, F. Trend analysis of plasma insulin level around parturition in relation to parity in Saanen goats. J. Anim. Sci. 2014, 92, 2440–2446. [Google Scholar] [CrossRef] [PubMed]
- Hasegawa, R.; Iwase, I.; Takagi, T.; Kondo, M.; Matsui, M.; Kawashima, C. Insulin resistance: Relationship between indices during late gestation in dairy cows and effects on newborn metabolism. Anim. Sci. J. 2019, 90, 1544–1555. [Google Scholar] [CrossRef] [PubMed]
- Samii, S.S.; Rico, J.E.; Mathews, A.T.; Davis, A.N.; Orndorff, C.L.; Aromeh, L.O.; McFadden, J.W. Effects of body condition score on direct and indirect measurements of insulin sensitivity in periparturient dairy cows. Animal 2019, 13, 2547–2555. [Google Scholar] [CrossRef] [PubMed]
Publisher’s Note: MDPI stays neutral with regard to jurisdictional claims in published maps and institutional affiliations. |
© 2021 by the authors. Licensee MDPI, Basel, Switzerland. This article is an open access article distributed under the terms and conditions of the Creative Commons Attribution (CC BY) license (https://creativecommons.org/licenses/by/4.0/).