
Blood Leukocyte Ratios as Predictive Markers of Chronic Enteropathy Phenotypes in Cats

 , , ,
, , ,
Simple Summary
Abstract
1. Introduction
2. Materials and Methods
2.1. Healthy Control Cats
2.2. Cats with Chronic Enteropathies
2.3. Laboratory Measurements
2.4. Statistical Analyses
3. Results
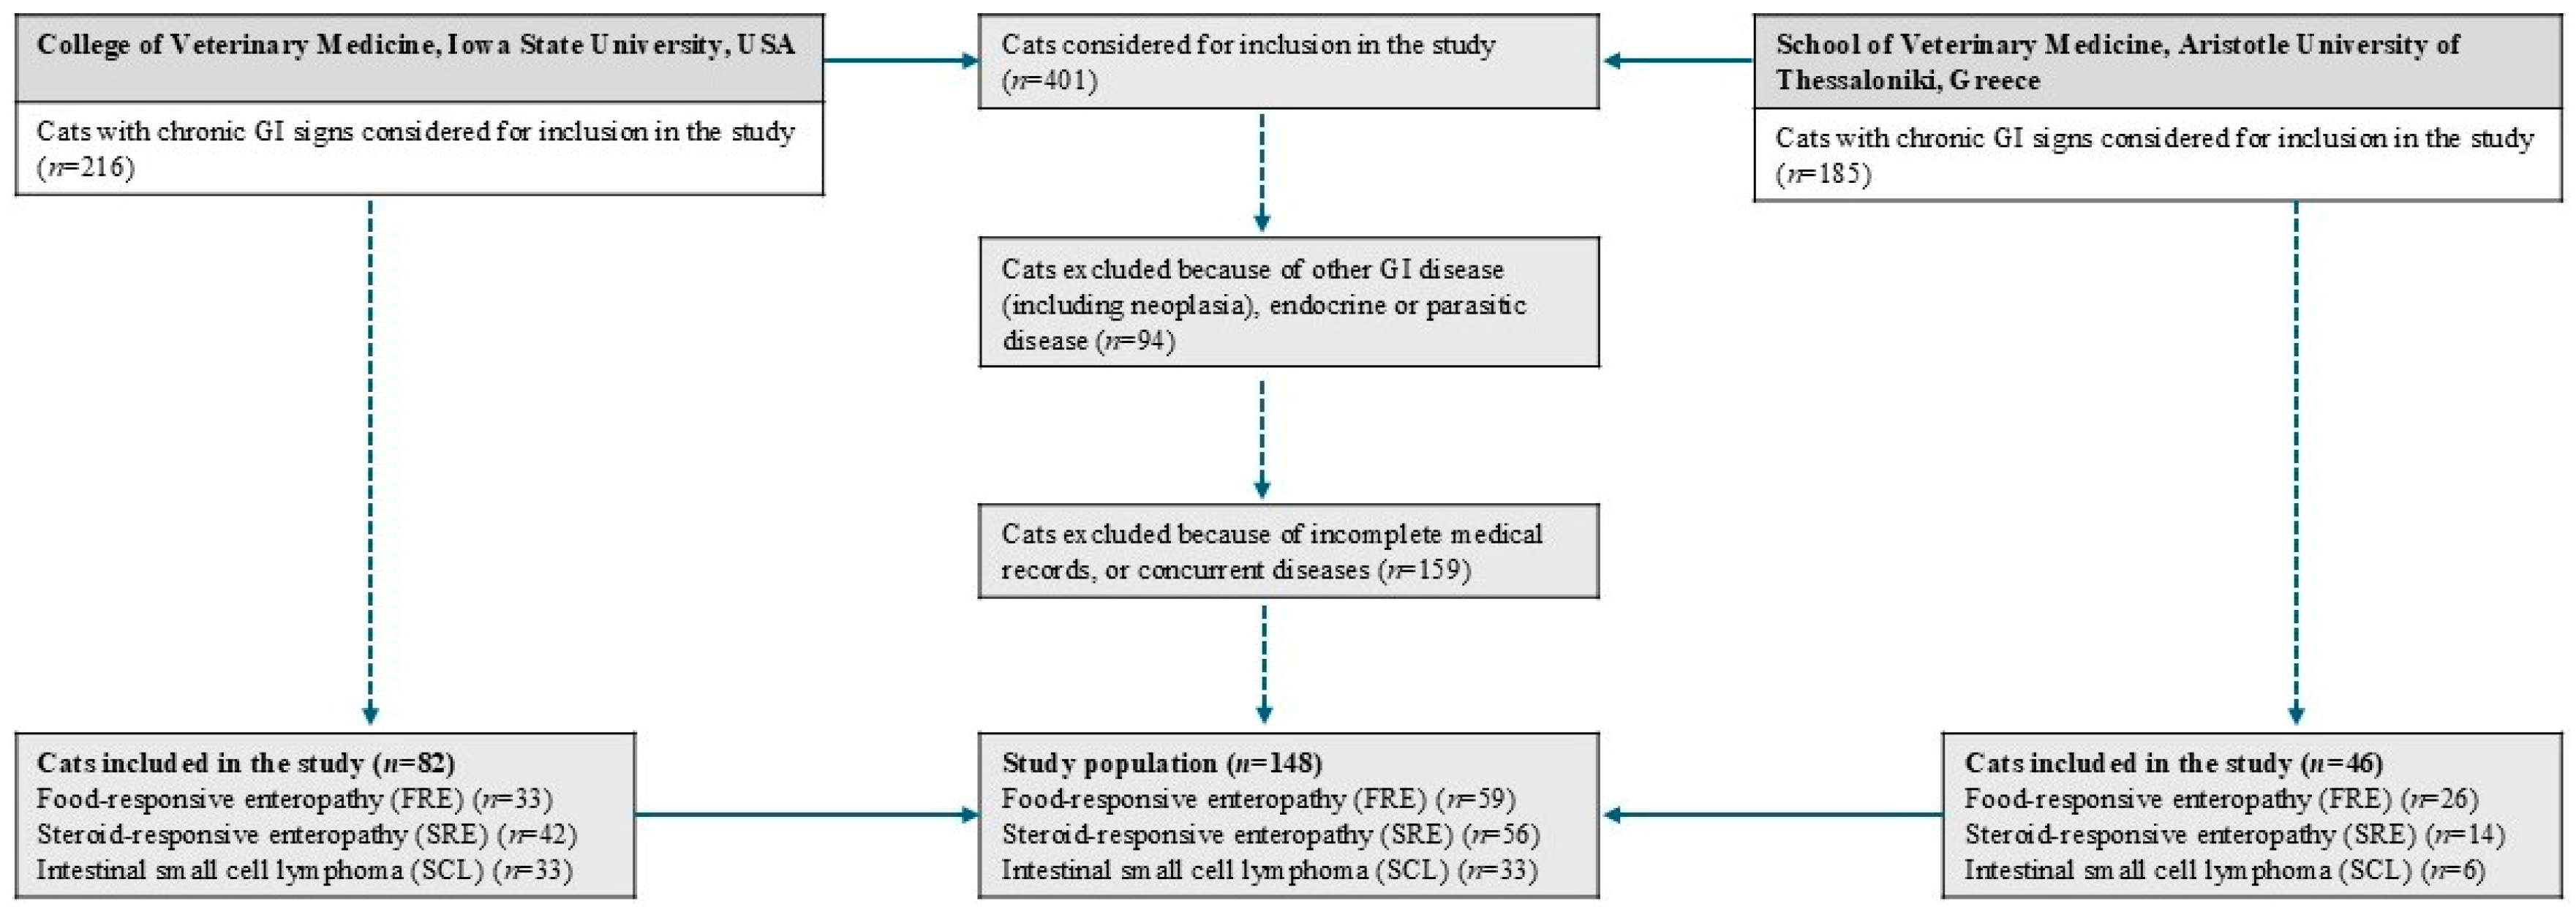
3.1. Animals
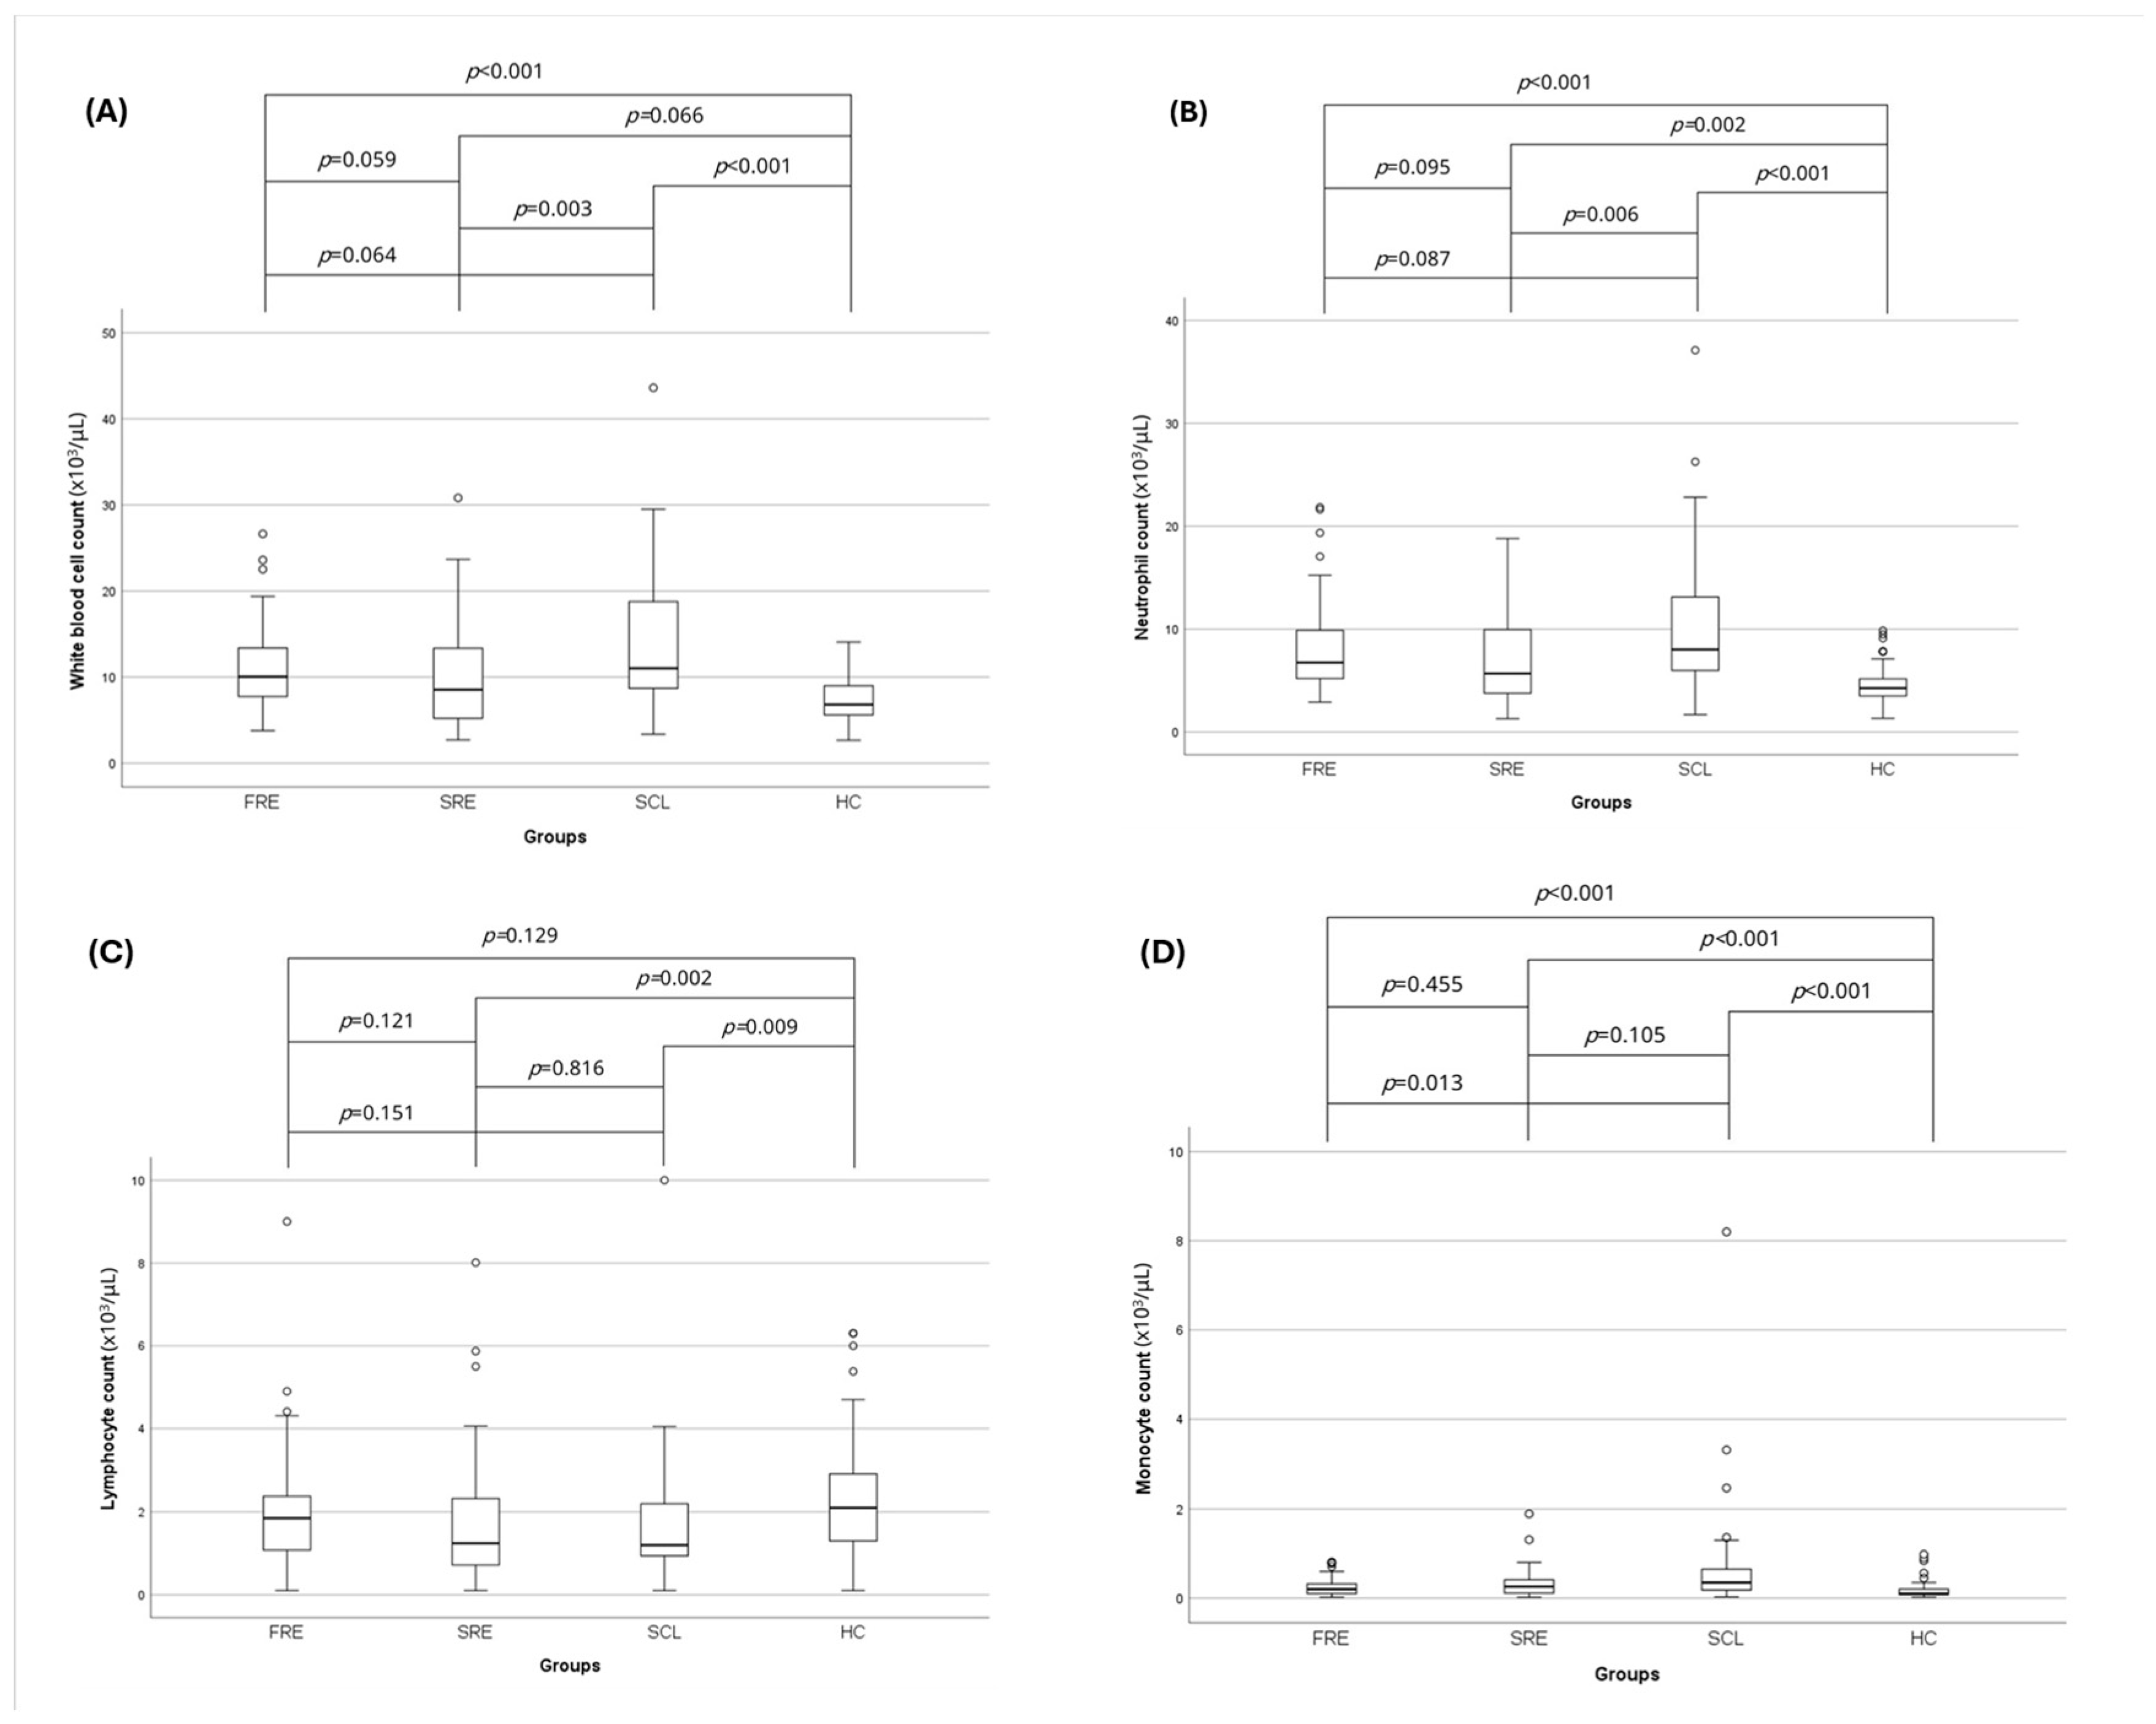
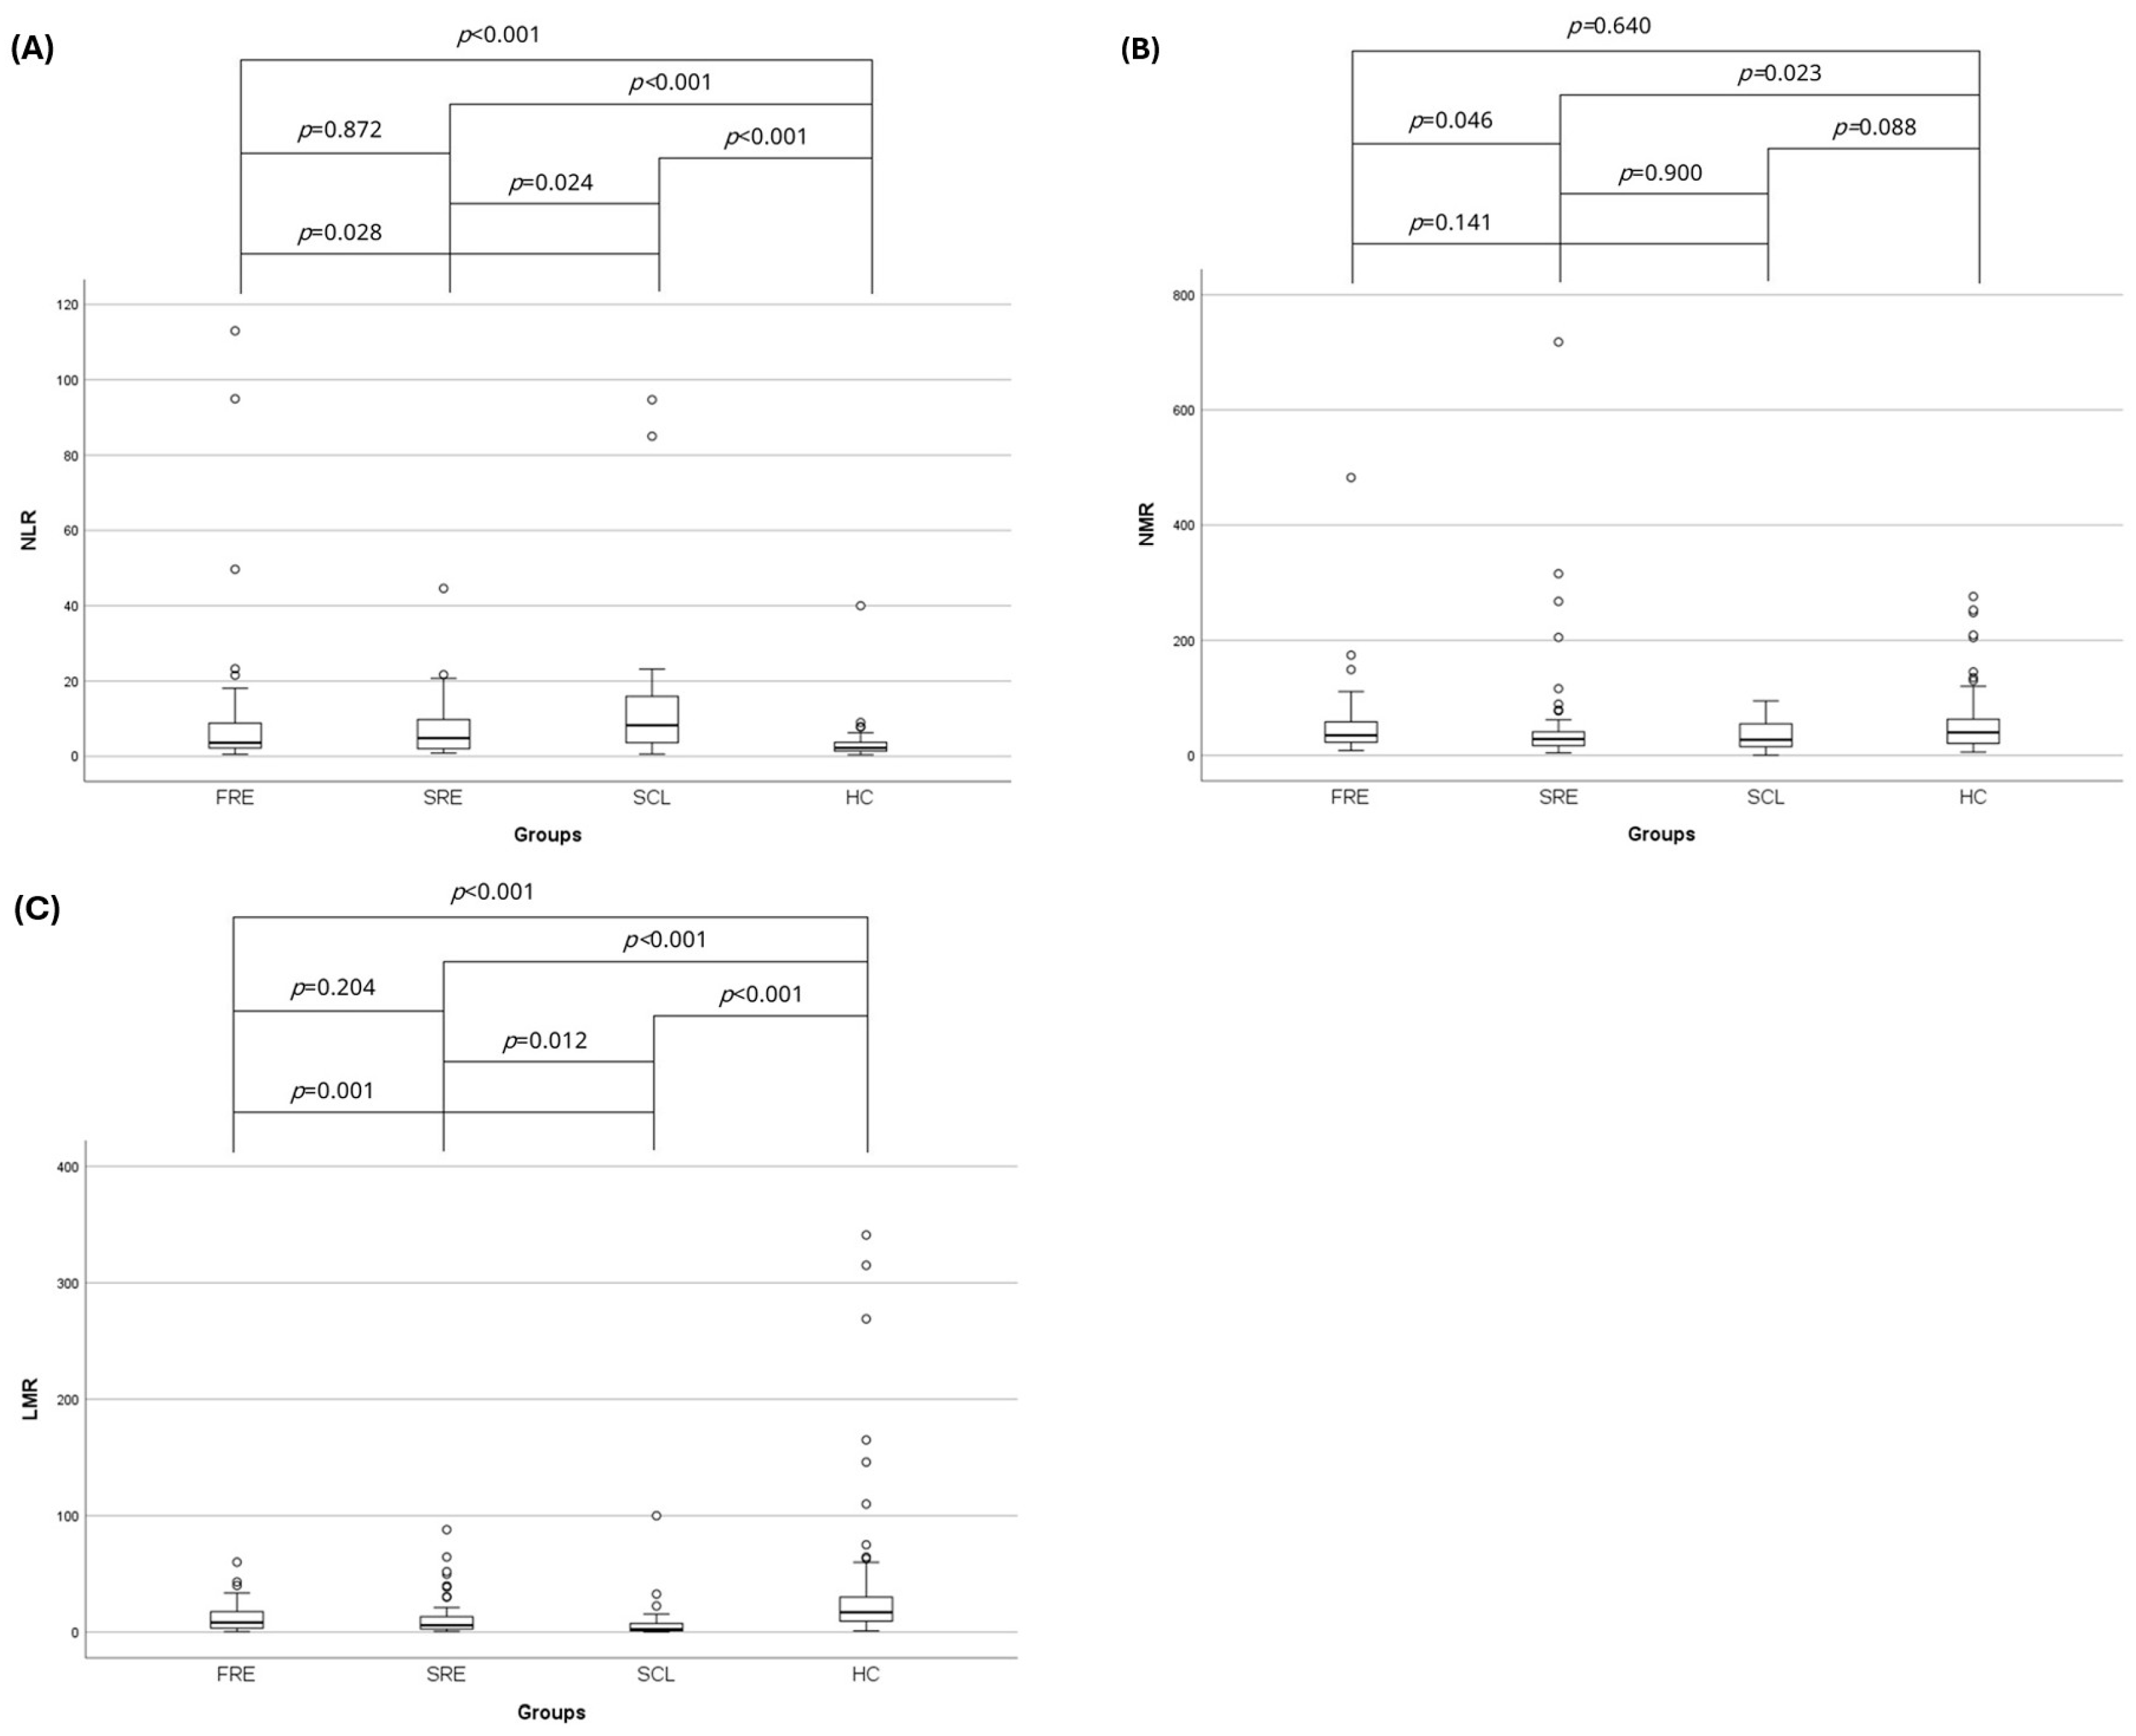
3.2. Complete Blood Count and Leukocyte Ratios
3.3. Serum Total Protein and Albumin Concentration
3.4. Correlation of NLR, NMR, and LMR with Clinicopathologic Variables
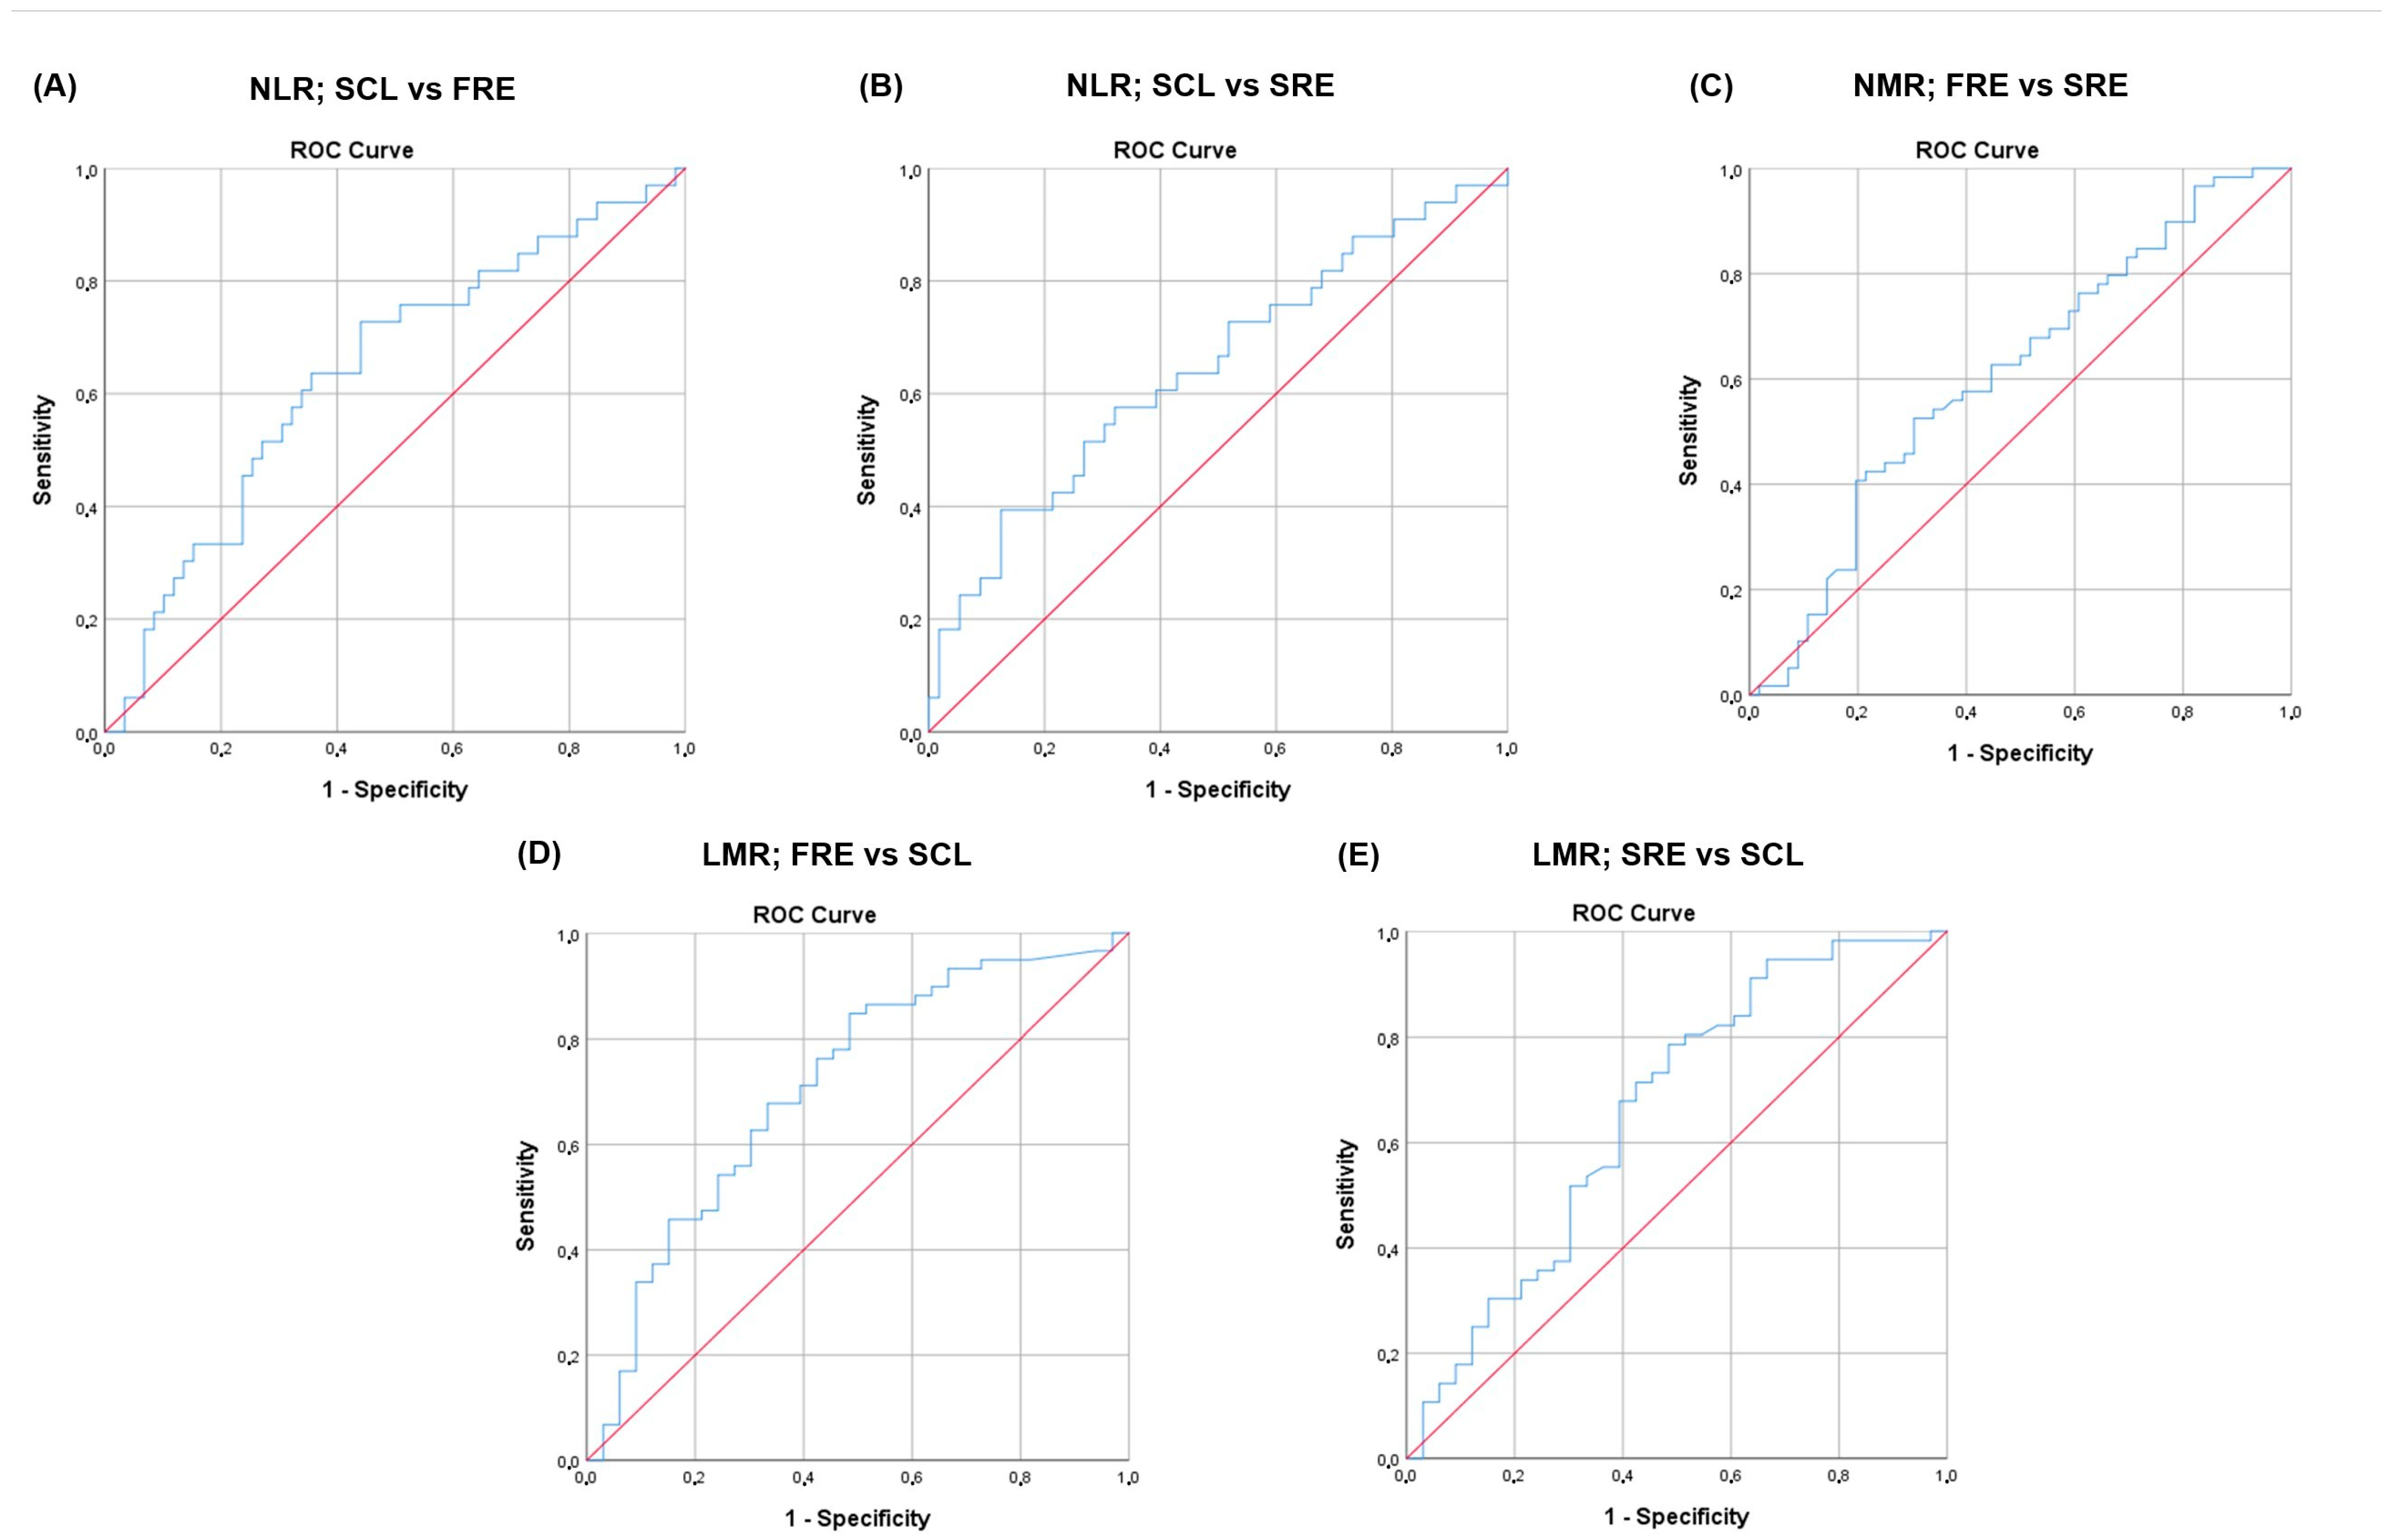
3.5. NLR, NMR, and LMR and Disease Classification
4. Discussion
5. Conclusions
Supplementary Materials
Author Contributions
Funding
Institutional Review Board Statement
Informed Consent Statement
Data Availability Statement
Conflicts of Interest
Abbreviations
| Alb | albumin |
| AUC | area under the curve |
| AUROC | area under the ROC |
| CBC | complete blood count |
| CE | chronic enteropathies |
| FCEAI | feline chronic enteropathy activity index |
| FeLV | feline leukemia virus |
| FIV | feline immunodeficiency virus |
| fPLI | feline pancreatic lipase immunoreactivity |
| FRE | food-responsive enteropathy |
| GI | gastrointestinal |
| IBD | inflammatory bowel disease |
| IHC | immunohistochemistry |
| LMR | lymphocyte-to-monocyte ratio |
| NLR | neutrophil-to-lymphocyte ratio |
| NMR | neutrophil-to-monocyte ratio |
| PARR | PCR assay for antigen receptor rearrangement |
| PLR | platelet-to-lymphocyte ratio |
| ROC | receiver operating characteristic |
| SCL | small cell lymphoma |
| SRE | steroid-responsive enteropathy |
| TLI | trypsin-like immunoreactivity |
| TP | total protein |
References
- Jergens, A.E.; Moore, F.M.; Haynes, J.S.; Miles, K.G. Idiopathic inflammatory bowel disease in dogs and cats: 84 cases (1987–1990). J. Am. Vet. Med. Assoc. 1992, 201, 1603–1608. [Google Scholar] [CrossRef] [PubMed]
- Jergens, A.E.; Crandell, J.M.; Evans, R.; Ackermann, M.; Miles, K.G.; Wang, C. A clinical index for disease activity in cats with chronic enteropathy. J. Vet. Intern. Med. 2010, 24, 1027–1033. [Google Scholar] [CrossRef]
- Moore, P.F.; Rodriguez-Bertos, A.; Kass, P.H. Feline gastrointestinal lymphoma: Mucosal architecture, immunophenotype, and molecular clonality. Vet. Pathol. 2012, 49, 658–668. [Google Scholar] [CrossRef] [PubMed]
- Jergens, A.E. Inflammatory bowel disease in veterinary medicine. Front. Biosci. (Elite Ed.) 2012, E4, 1404. [Google Scholar] [CrossRef]
- Jergens, A.E. Feline Idiopathic inflammatory bowel disease: What we know and what remains to be unraveled. J. Feline Med. Surg. 2012, 14, 445–458. [Google Scholar] [CrossRef]
- Marsilio, S. Feline chronic enteropathy. J. Small Anim. Pract. 2021, 62, 409–419. [Google Scholar] [CrossRef]
- Kathrani, A.; Church, D.B.; Brodbelt, D.C.; Pegram, C.; O’Neill, D.G. The use of hydrolysed diets for vomiting and/or diarrhoea in cats in primary veterinary practice. J. Small Anim. Pract. 2020, 61, 723–731. [Google Scholar] [CrossRef]
- Mandigers, P.; German, A.J. Dietary hypersensitivity in cats and dogs. Tijdschr. Diergeneeskd. 2010, 135, 706–710. [Google Scholar] [PubMed]
- Guilford, W.G.; Jones, B.R.; Markwell, P.J.; Arthur, D.G.; Collett, M.G.; Harte, J.G. Food sensitivity in cats with chronic idiopathic gastrointestinal problems. J. Vet. Intern. Med. 2001, 15, 7–13. [Google Scholar] [CrossRef]
- Marsilio, S. Differentiating inflammatory bowel disease from alimentary lymphoma in cats: Does it matter? Vet. Clin. N. Am. Small Anim. Pract. 2021, 51, 93–109. [Google Scholar] [CrossRef]
- Marsilio, S.; Freiche, V.; Johnson, E.; Leo, C.; Langerak, A.W.; Peters, I.; Ackermann, M.R. ACVIM consensus statement guidelines on diagnosing and distinguishing low-grade neoplastic from inflammatory lymphocytic chronic enteropathies in cats. J. Vet. Intern. Med. 2023, 37, 794–816. [Google Scholar] [CrossRef] [PubMed]
- Bandara, Y.; Priestnall, S.L.; Chang, Y.M.; Kathrani, A. Outcome of chronic inflammatory enteropathy in cats: 65 cases (2011–2021). J. Small Anim. Pract. 2023, 64, 121–129. [Google Scholar] [CrossRef] [PubMed]
- Freiche, V.; Fages, J.; Paulin, M.V.; Bruneau, J.; Couronné, L.; German, A.J.; Penninck, D.; Hermine, O. Clinical, laboratory and ultrasonographic findings differentiating low-grade intestinal t-cell lymphoma from lymphoplasmacytic enteritis in cats. J. Vet. Intern. Med. 2021, 35, 2685–2696. [Google Scholar] [CrossRef]
- Freiche, V.; Paulin, M.V.; Cordonnier, N.; Huet, H.; Turba, M.E.; Macintyre, E.; Molina, T.J.; Hermine, O.; Couronné, L.; Bruneau, J. Histopathologic, phenotypic, and molecular criteria to discriminate low-grade intestinal t-cell lymphoma in cats from lymphoplasmacytic enteritis. J. Vet. Intern. Med. 2021, 35, 2673–2684. [Google Scholar] [CrossRef] [PubMed]
- Richter, K.P. Feline gastrointestinal lymphoma. Vet. Clin. N. Am. Small Anim. Pract. 2003, 33, 1083–1098. [Google Scholar] [CrossRef]
- Moore, P.F.; Woo, J.C.; Vernau, W.; Kosten, S.; Graham, P.S. Characterization of feline T cell receptor gamma (TCRG) variable region genes for the molecular diagnosis of feline intestinal T cell lymphoma. Vet. Immunol. Immunopathol. 2005, 106, 167–178. [Google Scholar] [CrossRef]
- Paulin, M.V.; Couronné, L.; Beguin, J.; Le Poder, S.; Delverdier, M.; Semin, M.O.; Bruneau, J.; Cerf-Bensussan, N.; Malamut, G.; Cellier, C.; et al. Feline low-grade alimentary lymphoma: An emerging entity and a potential animal model for human disease. BMC Vet. Res. 2018, 14, 306. [Google Scholar] [CrossRef]
- Marsilio, S.; Ackermann, M.R.; Lidbury, J.A.; Suchodolski, J.S.; Steiner, J.M. Results of histopathology, immunohistochemistry, and molecular clonality testing of small intestinal biopsy specimens from clinically healthy client-owned cats. J. Vet. Intern. Med. 2019, 33, 551–558. [Google Scholar] [CrossRef]
- Parikh, N.I.; Vasan, R.S. Assessing the clinical utility of biomarkers in medicine. Biomark. Med. 2007, 1, 419–436. [Google Scholar] [CrossRef]
- Love, E.K.; Leibman, N.F.; Ringold, R.; Lamb, K. Serum haptoglobin concentrations in feline inflammatory bowel disease and small-cell alimentary lymphoma: A potential biomarker for feline chronic enteropathies. J. Feline Med. Surg. 2021, 23, 959–964. [Google Scholar] [CrossRef]
- Heilmann, R.M.; Grützner, N.; Handl, S.; Suchodolski, J.S.; Steiner, J.M. Preanalytical validation of an in-house radioimmunoassay for measuring calprotectin in feline specimens. Vet. Clin. Pathol. 2018, 47, 100–107. [Google Scholar] [CrossRef] [PubMed]
- Tamamoto, T.; Ohno, K.; Takahashi, M.; Nakashima, K.; Fujino, Y.; Tsujimoto, H. serum amyloid A as a prognostic marker in cats with various diseases. J. Vet. Diagn. Invest. 2013, 25, 428–432. [Google Scholar] [CrossRef] [PubMed]
- Yang, Y.; He, X.; Tan, S.; Qu, X.; Huang, W.; Cai, J.; You, J.; Fu, X.; He, Y.; Yang, H. The association between immunoinflammatory biomarkers NLR, PLR, LMR and nonalcoholic fatty liver disease: A systematic review and meta-analysis. Clin. Exp. Med. 2025, 25, 39. [Google Scholar] [CrossRef]
- Afari, M.E.; Bhat, T. Neutrophil to lymphocyte ratio (NLR) and cardiovascular diseases: An update. Expert. Rev. Cardiovasc. Ther. 2016, 14, 573–577. [Google Scholar] [CrossRef]
- Mandaliya, H.; Jones, M.; Oldmeadow, C.; Nordman, I.I.C. Prognostic biomarkers in stage IV non-small cell lung cancer (NSCLC): Neutrophil to lymphocyte ratio (NLR), lymphocyte to monocyte ratio (LMR), platelet to lymphocyte ratio (PLR) and advanced lung cancer inflammation index (ALI). Transl. Lung Cancer Res. 2019, 8, 886. [Google Scholar] [CrossRef] [PubMed]
- Wu, Y.; Chen, Y.; Yang, X.; Chen, L.; Yang, Y. Neutrophil-to-lymphocyte ratio (NLR) and platelet-to-lymphocyte ratio (PLR) were associated with disease activity in patients with systemic lupus erythematosus. Int. Immunopharmacol. 2016, 36, 94–99. [Google Scholar] [CrossRef]
- Marchioni, M.; Primiceri, G.; Ingrosso, M.; Filograna, R.; Castellan, P.; De Francesco, P.; Schips, L. The clinical use of the neutrophil to lymphocyte ratio (NLR) in urothelial cancer: A systematic review. Clin. Genitourin. Cancer 2016, 14, 473–484. [Google Scholar] [CrossRef]
- Fu, W.; Fu, H.; Ye, W.; Han, Y.; Liu, X.; Zhu, S.; Li, H.; Tang, R.; Wang, Q. Peripheral blood neutrophil-to-lymphocyte ratio in inflammatory bowel disease and disease activity: A meta-analysis. Int. Immunopharmacol. 2021, 101, 108235. [Google Scholar] [CrossRef]
- Ma, L.; Pang, X.; Ji, G.; Ma, X.; Li, J.; Chang, Y.; Ma, C.; Cheng, Y. Application of the neutrophil to lymphocyte ratio in the diagnosis and activity determination of ulcerative colitis: A meta-analysis and systematic review. Medicine 2021, 100, E27551. [Google Scholar] [CrossRef]
- Okba, A.M.; Amin, M.M.; Abdelmoaty, A.S.; Ebada, H.E.; Kamel, A.H.; Allam, A.S.; Sobhy, O.M. neutrophil/lymphocyte ratio and lymphocyte/monocyte ratio in ulcerative colitis as non-invasive biomarkers of disease activity and severity. Auto. Immun. Highlights 2019, 10, 4. [Google Scholar] [CrossRef]
- Hassan ALJAF, K.A.; Hama, S.A.; Mohammed, M.O.; Rahim, H.M. Diagnostic value of lymphocyte-to-monocyte ratio in Crohn’s disease: A cross-sectional study. Ann. Med. Surg. 2025, 87, 2608–2614. [Google Scholar] [CrossRef] [PubMed]
- Langley, B.O.; Guedry, S.E.; Goldenberg, J.Z.; Hanes, D.A.; Beardsley, J.A.; Ryan, J.J. Inflammatory bowel disease and neutrophil–lymphocyte ratio: A systematic scoping review. J. Clin. Med. 2021, 10, 4219. [Google Scholar] [CrossRef]
- Posul, E.; Yilmaz, B.; Aktas, G.; Kurt, M. Does neutrophil-to-lymphocyte ratio predict active ulcerative colitis? Wien. Klin. Wochenschr. 2015, 127, 262–265. [Google Scholar] [CrossRef] [PubMed]
- Schoepfer, A.M.; Beglinger, C.; Straumann, A.; Trummler, M.; Renzulli, P.; Seibold, F. Ulcerative colitis: Correlation of the Rachmilewitz endoscopic activity index with fecal calprotectin, clinical activity, C-Reactive Protein, and blood leukocytes. Inflamm. Bowel Dis. 2009, 15, 1851–1858. [Google Scholar] [CrossRef]
- Celikbilek, M.; Dogan, S.; Ozbakir, O.; Zararsiz, G.; Kücük, H.; Gürsoy, S.; Yurci, A.; Güven, K.; Yücesoy, M. Neutrophil-lymphocyte ratio as a predictor of disease severity in ulcerative colitis. J. Clin. Lab. Anal. 2013, 27, 72–76. [Google Scholar] [CrossRef]
- Feng, J.R.; Qiu, X.; Wang, F.; Chen, P.F.; Gao, Q.; Peng, Y.N.; Lin, X.; Liu, Q.; Liu, J.; Zhao, Q.; et al. Diagnostic value of neutrophil-to-lymphocyte ratio and platelet-to-lymphocyte ratio in Crohn’s disease. Gastroenterol. Res. Pract. 2017, 2017, 3526460. [Google Scholar] [CrossRef]
- Stojkovic Lalosevic, M.; Pavlovic Markovic, A.; Stankovic, S.; Stojkovic, M.; Dimitrijevic, I.; Radoman Vujacic, I.; Lalic, D.; Milovanovic, T.; Dumic, I.; Krivokapic, Z. Combined diagnostic efficacy of neutrophil-to-lymphocyte ratio (NLR), platelet-to-lymphocyte ratio (PLR), and mean platelet volume (MPV) as biomarkers of systemic inflammation in the diagnosis of colorectal cancer. Dis. Markers 2019, 2019, 6036979. [Google Scholar] [CrossRef]
- Haram, A.; Boland, M.R.; Kelly, M.E.; Bolger, J.C.; Waldron, R.M.; Kerin, M.J. The prognostic value of neutrophil-to-lymphocyte ratio in colorectal cancer: A systematic review. J. Surg. Oncol. 2017, 115, 470–479. [Google Scholar] [CrossRef] [PubMed]
- Karra, S.; Gurushankari, B.; Rajalekshmy, M.R.; Elamurugan, T.P.; Mahalakshmy, T.; Kate, V.; Nanda, N.; Rajesh, N.G.; Shankar, G. Diagnostic utility of NLR, PLR and MLR in early diagnosis of gastric cancer: An analytical cross-sectional study. J. Gastrointest. Cancer 2023, 54, 1322–1330. [Google Scholar] [CrossRef]
- Gori, E.; Pierini, A.; Lippi, I.; Lubas, G.; Marchetti, V. Leukocytes ratios in feline systemic inflammatory response syndrome and sepsis: A retrospective analysis of 209 cases. Animals 2021, 11, 1644. [Google Scholar] [CrossRef]
- Petrucci, G.N.; Lobo, L.; Queiroga, F.; Martins, J.; Prada, J.; Pires, I.; Henriques, J. Neutrophil-to-lymphocyte ratio is an independent prognostic marker for feline mammary carcinomas. Vet. Comp. Oncol. 2021, 19, 482–491. [Google Scholar] [CrossRef] [PubMed]
- Chiti, L.E.; Martano, M.; Ferrari, R.; Boracchi, P.; Giordano, A.; Grieco, V.; Buracco, P.; Iussich, S.; Giudice, C.; Miniscalco, B.; et al. Evaluation of leukocyte counts and neutrophil-to-lymphocyte ratio as predictors of local recurrence of feline injection site sarcoma after curative intent surgery. Vet. Comp. Oncol. 2020, 18, 105–116. [Google Scholar] [CrossRef]
- Tsouloufi, T.K.; Frezoulis, P.S.; Soubasis, N.; Kritsepi-Konstantinou, M.; Oikonomidis, I.L. Diagnostic and prognostic value of peripheral blood leucocyte ratios in sick cats. Acta Vet. Hung. 2021, 69, 308–314. [Google Scholar] [CrossRef]
- Becher, A.; Suchodolski, J.S.; Steiner, J.M.; Heilmann, R.M. Blood neutrophil-to-lymphocyte ratio (NLR) as a diagnostic marker in dogs with chronic enteropathy. J. Vet. Diagn. Investig. 2021, 33, 516–527. [Google Scholar] [CrossRef]
- Benvenuti, E.; Pierini, A.; Gori, E.; Lucarelli, C.; Lubas, G.; Marchetti, V. Neutrophil-to-lymphocyte ratio (NLR) in canine inflammatory bowel disease (IBD). Vet. Sci. 2020, 7, 141. [Google Scholar] [CrossRef] [PubMed]
- Cagnasso, F.; Borrelli, A.; Bottero, E.; Benvenuti, E.; Ferriani, R.; Marchetti, V.; Ruggiero, P.; Bruno, B.; Maurella, C.; Gianella, P. Comparative evaluation of peripheral blood neutrophil to lymphocyte ratio, serum albumin to globulin ratio and serum C-reactive protein to albumin ratio in dogs with inflammatory protein-losing enteropathy and healthy dogs. Animals 2023, 13, 484. [Google Scholar] [CrossRef] [PubMed]
- Pierini, A.; Esposito, G.; Gori, E.; Benvenuti, E.; Ruggiero, P.; Lubas, G.; Marchetti, V. Platelet abnormalities and platelet-to-lymphocyte ratios in canine-responsive and non-responsive enteropathy: A retrospective study in 41 dogs. J. Vet. Med. Sci. 2021, 83, 248. [Google Scholar] [CrossRef]
- Washabau, R.J.; Day, M.J.; Willard, M.D.; Hall, E.J.; Jergens, A.E.; Mansell, J.; Minami, T.; Bilzer, T.W. Endoscopic, biopsy, and histopathologic guidelines for the evaluation of gastrointestinal inflammation in companion animals. J. Vet. Intern. Med. 2010, 24, 10–26. [Google Scholar]
- Marchesi, M.C.; Maggi, G.; Cremonini, V.; Miglio, A.; Contiero, B.; Guglielmini, C.; Antognoni, M.T. Monocytes count, NLR, MLR and PLR in canine inflammatory bowel disease. Animals 2024, 14, 837. [Google Scholar] [CrossRef]
- Heilmann, R.M.; Berghoff, N.; Mansell, J.; Grützner, N.; Parnell, N.K.; Gurtner, C.; Suchodolski, J.S.; Steiner, J.M. Association of fecal calprotectin concentrations with disease severity, response to treatment, and other biomarkers in dogs with chronic inflammatory enteropathies. J. Vet. Intern. Med. 2018, 32, 679–692. [Google Scholar] [CrossRef]
- Petrie, A.; Watson, P. Statistics for Veterinary and Animal Science, 3rd ed.; Wiley-Blackwell: Hoboken, NJ, USA, 2013. [Google Scholar]
- Park, J.; Lee, D.; Yun, T.; Koo, Y.; Chae, Y.; Kim, H.; Yang, M.P.; Kang, B.T. Evaluation of the blood neutrophil-to-lymphocyte ratio as a biomarker for meningoencephalitis of unknown etiology in dogs. J. Vet. Intern. Med. 2022, 36, 1719–1725. [Google Scholar] [CrossRef] [PubMed]
- Šimundić, A.-M. Measures of Diagnostic Accuracy: Basic Definitions. EJIFCC 2009, 19, 203. [Google Scholar] [PubMed]
- Gardner, I.A.; Greiner, M. Receiver-operating characteristic curves and likelihood ratios: Improvements over traditional methods for the evaluation and application of veterinary clinical pathology tests. Vet. Clin. Pathol. 2006, 35, 8–17. [Google Scholar] [CrossRef] [PubMed]
- Mehta, C.R.; Patel, N.R. SPSS Exact Tests 7.0 for Windows; SPSS Incorporated: Chicago, IL, USA, 1996. [Google Scholar]
- Demir, A.K.; Demirtas, A.; Kaya, S.U.; Tastan, I.; Butun, I.; Sagcan, M.; Sahin, S.; Tasliyurt, T.; Yilmaz, A. The relationship between the neutrophil-lymphocyte ratio and disease activity in patients with ulcerative colitis. Kaohsiung J. Med. Sci. 2015, 31, 585–590. [Google Scholar] [CrossRef]
- Bertani, L.; Rossari, F.; Barberio, B.; Demarzo, M.G.; Tapete, G.; Albano, E.; Svizzero, G.B.; Ceccarelli, L.; Mumolo, M.G.; Brombin, C.; et al. Novel prognostic biomarkers of mucosal healing in ulcerative colitis patients treated with anti-TNF: Neutrophil-to-lymphocyte ratio and platelet-to-lymphocyte ratio. Inflamm. Bowel Dis. 2020, 26, 1579–1587. [Google Scholar] [CrossRef]
- Torun, S.; Tunc, B.D.; Suvak, B.; Yildiz, H.; Tas, A.; Sayilir, A.; Ozderin, Y.O.; Beyazit, Y.; Kayacetin, E. Assessment of neutrophil-lymphocyte ratio in ulcerative colitis: A promising marker in predicting disease severity. Clin. Res. Hepatol. Gastroenterol. 2012, 36, 491–497. [Google Scholar] [CrossRef]
- Acarturk, G.; Acay, A.; Demir, K.; Ulu, M.S.; Ahsen, A.; Yuksel, S. neutrophil-to-lymphocyte ratio in inflammatory bowel disease—As a new predictor of disease severity. Bratisl. Lek. Listy 2015, 116, 213–217. [Google Scholar] [CrossRef]
- Pierini, A.; Gori, E.; Lippi, I.; Lubas, G.; Marchetti, V. Are leukocyte and platelet abnormalities and complete blood count ratios potential prognostic markers in canine sepsis? Front. Vet. Sci. 2020, 7, 578846. [Google Scholar] [CrossRef]
- Janeczko, S.; Atwater, D.; Bogel, E.; Greiter-Wilke, A.; Gerold, A.; Baumgart, M.; Bender, H.; McDonough, P.L.; McDonough, S.P.; Goldstein, R.E.; et al. The relationship of mucosal bacteria to duodenal histopathology, cytokine mRNA, and clinical disease activity in cats with inflammatory bowel disease. Vet. Microbiol. 2008, 128, 178–193. [Google Scholar] [CrossRef]
- Waly, N.E.; Stokes, C.R.; Gruffydd-Jones, T.J.; Day, M.J. Immune cell populations in the duodenal mucosa of cats with inflammatory bowel disease. J. Vet. Intern. Med. 2004, 18, 816–825. [Google Scholar] [CrossRef]
- Nguyen Van, N.; Taglinger, K.; Helps, C.R.; Tasker, S.; Gruffydd-Jones, T.J.; Day, M.J. Measurement of cytokine mRNA expression in intestinal biopsies of cats with inflammatory enteropathy using quantitative real-time RT-PCR. Vet. Immunol. Immunopathol. 2006, 113, 404–414. [Google Scholar] [CrossRef] [PubMed]
- Norsworthy, G.D.; Estep, J.S.; Hollinger, C.; Steiner, J.M.; Lavallee, J.O.; Gassler, L.N.; Restine, L.M.; Kiupel, M. Prevalence and underlying causes of histologic abnormalities in cats suspected to have chronic small bowel disease: 300 cases (2008-2013). J. Am. Vet. Med. Assoc. 2015, 247, 629–635. [Google Scholar] [CrossRef]
- Heilmann, R.M.; Riggers, D.S.; Trewin, I.; Köller, G.; Kathrani, A. Treatment success in cats with chronic enteropathy is associated with a decrease in fecal calprotectin concentrations. Front. Vet. Sci. 2024, 11, 1390681. [Google Scholar] [CrossRef] [PubMed]
- Gianella, P.; Pietra, M.; Crisi, P.E.; Famigli Bergamini, P.; Fracassi, F.; Morini, M.; Boari, A. Evaluation of clinicopathological features in cats with chronic gastrointestinal signs. Pol. J. Vet. Sci. 2017, 20, 429–437. [Google Scholar] [CrossRef]
- Du, J.; Chen, S.; Shi, J.; Zhu, X.; Ying, H.; Zhang, Y.; Chen, S.; Shen, B.; Li, J. The association between the lymphocyte-monocyte ratio and disease activity in rheumatoid arthritis. Clin. Rheumatol. 2017, 36, 2689–2695. [Google Scholar] [CrossRef]
- Xu, M.; Cen, M.; Chen, X.; Chen, H.; Liu, X.; Cao, Q. Correlation between serological biomarkers and disease activity in patients with inflammatory bowel disease. Biomed. Res. Int. 2019, 2019, 6517549. [Google Scholar] [CrossRef]
- Alaimo, C.; De Feo, G.; Lubas, G.; Gavazza, A. Utility and prognostic significance of leukocyte ratios in dogs with primary immune-mediated hemolytic anemia. Vet. Res. Commun. 2023, 47, 305–310. [Google Scholar] [CrossRef]
- Gavazza, A.; Cremonini, V.; Miglio, A.; Starita, C.; Rossi, G.; Antognoni, M.T. Hematological ratios and indices in canine large B-cell lymphoma. Open Vet. J. 2024, 14, 980. [Google Scholar] [CrossRef] [PubMed]
- Donato, G.; Pennisi, M.G.; Persichetti, M.F.; Archer, J.; Masucci, M. A retrospective comparative evaluation of selected blood cell ratios, acute phase proteins, and leukocyte changes suggestive of inflammation in cats. Animals 2023, 13, 2579. [Google Scholar] [CrossRef]
- Rossi, A.; Proverbio, D.; Perego, R.; Baggiani, L.; Spada, E. Evaluation of leukocyte ratios as survival prognostic markers in feline retrovirus infections. Vet. J. 2024, 305, 106128. [Google Scholar] [CrossRef]
- Neumann, S. Neutrophil-to-lymphocyte and platelet-to-lymphocyte ratios in dogs and cats with acute pancreatitis. Vet. Clin. Pathol. 2021, 50, 45–51. [Google Scholar] [CrossRef]
- Castro-López, J.; Ramis, A.; Planellas, M.; Teles, M.; Pastor, J. Cyclooxygenase-2 immunoexpression in intestinal epithelium and lamina propria of cats with inflammatory bowel disease and low grade alimentary lymphoma. BMC Vet. Res. 2018, 14, 158. [Google Scholar] [CrossRef] [PubMed]
- Webb, T.L.; Webb, C.B. Comparing adipose-derived mesenchymal stem cells with prednisolone for the treatment of feline inflammatory bowel disease. J. Feline Med. Surg. 2022, 24, e244–e250. [Google Scholar] [CrossRef] [PubMed]
- Willard, M.; Mansell, J. Correlating clinical activity and histopathologic assessment of gastrointestinal lesion severity: Current challenges. Vet. Clin. N. Am. Small Anim. Pract. 2011, 41, 457–463. [Google Scholar] [CrossRef] [PubMed]
- Willard, M.D.; Jergens, A.E.; Duncan, R.B.; Leib, M.S.; McCracken, M.D.; DeNovo, R.C.; Helman, R.G.; Slater, M.R.; Harbison, J.L. Interobserver variation among histopathologic evaluations of intestinal tissues from dogs and cats. J. Am. Vet. Med. Assoc. 2002, 220, 1177–1182. [Google Scholar] [CrossRef]
- Rudinsky, A.J.; Rowe, J.C.; Parker, V.J. Nutritional management of chronic enteropathies in dogs and cats. J. Am. Vet. Med. Assoc. 2018, 253, 570–578. [Google Scholar] [CrossRef]


| Parameter | FRE (n = 59) | SRE (n = 56) | SCL (n = 33) | HC (n = 73) | |||||
|---|---|---|---|---|---|---|---|---|---|
| Age (years) Median (range) Kruskal–Wallis test p < 0.001 | 8 (1–16) | 8.5 (1.5–17) | 11 (6–16) | 7 (1–15) | |||||
| FRE vs. HC (Mann–Whitney test) p = 0.170 | SRE vs. HC (Mann–Whitney test) p = 0.008 | SCL vs. HC (Mann–Whitney test) p < 0.001 | FRE vs. SRE (Mann–Whitney test) p = 0.250 | FRE vs. SCL (Mann–Whitney test) p < 0.001 | SRE vs. SCL (Mann–Whitney test) p = 0.003 | ||||
| Sex male/female (%) χ2 test p = 0.053 | 31 (52.5)/28 (47.5) | 31 (55.4)/25 (44.6) | 18 (54.5)/15 (45.5) | 25 (34.2)/48 (65.8) | |||||
| Breed | |||||||||
| DSH | 33 | 42 | 28 | 61 | |||||
| DLH | 5 | 5 | 3 | 5 | |||||
| Siamese | 7 | 1 | 1 | ||||||
| Persian | 3 | 2 | 1 | ||||||
| British Shorthair | 2 | ||||||||
| Russian Blue | 1 | 1 | |||||||
| Ragdoll | 1 | 1 | 1 | ||||||
| Norwegian Forest | 1 | ||||||||
| Scottish Fold | 1 | ||||||||
| Balinese | 1 | ||||||||
| Birman | 1 | ||||||||
| Snowshoe | 1 | 2 | |||||||
| Devon Rex | 1 | ||||||||
| Siberian | 1 | ||||||||
| Leopard Bengal | 1 | ||||||||
| American Shorthair | 1 | ||||||||
| Exotic Shorthair | 1 | ||||||||
| Burmese | 1 | ||||||||
| Angora | 1 | ||||||||
| Maine Coon | 1 | 2 | |||||||
| FCEAI score; median (range) Kruskal–Wallis test p < 0.001 | 2 (1–8) | 4 (2–10) | 5 (2–10) | 0 (0–0) | |||||
| FRE vs. HC (Mann–Whitney test) p < 0.001 | SRE vs. HC (Mann–Whitney test) p < 0.001 | SCL vs. HC (Mann–Whitney test) p < 0.001 | FRE vs. SRE (Mann–Whitney test) p < 0.001 | FRE vs. SCL (Mann–Whitney test) p < 0.001 | SRE vs. SCL (Mann–Whitney test) p = 0.002 | ||||
| Parameter | FRE (n = 59) Median (Range) | SRE (n = 56) Median (Range) | SCL (n = 33) Median (Range) | HC (n = 73) Median (Range) | K-W Test p-Value |
|---|---|---|---|---|---|
| WBC (×103/μL) | 10 (3.8–26.6) | 8.54 (2.7–30.8) | 11.02 (3.4–43.6) | 6.8 (2.7–14.1) | <0.001 |
| Neutrophils (×103/μL) | 6.8 (2.9–21.8) | 5.7 (1.3–18.8) | 8 (1.7–37.1) | 4.3 (1.3–9.9) | <0.001 |
| Lymphocytes (×103/μL) | 1.9 (0.1–9.0) | 1.3 (0.1–8) | 1.2 (0.1–10) | 2.1 (0.1–6.3) | 0.007 |
| Monocytes (×103/μL) | 0.2 (0–0.8) | 0.3 (0–1.9) | 0.4 (0–8.2) | 0.1 (0–1) | <0.001 |
| NLR | 3.6 (0.5–113) | 4.8 (0.9–44.6) | 8.3 (0.6–94.7) | 2.2 (0.4–40) | <0.001 |
| NMR | 35 (8.3–482.5) | 28.4 (4.3–718) | 27.1 (0.5–94.7) | 39.8 (5.7–276) | 0.055 |
| LMR | 8.3 (0.5–60.1) | 6 (0.7–88) | 2.5 (0.3–100) | 17 (1–341) | <0.001 |
| Total protein (g/L) | 75.0 (52.0–97.0) * | 73.0 (39.0–102.0) | 70.0 (46.0–78.0) | 72.0 (60.0–82.0) | 0.011 |
| Albumin (g/L) | 36.0 (17.0–43.0) | 34.0 (15.0–49.0) | 32.0 (17.0–41.0) | 39.0 (29.0–48.0) | <0.001 |
Disclaimer/Publisher’s Note: The statements, opinions and data contained in all publications are solely those of the individual author(s) and contributor(s) and not of MDPI and/or the editor(s). MDPI and/or the editor(s) disclaim responsibility for any injury to people or property resulting from any ideas, methods, instructions or products referred to in the content. |
© 2025 by the authors. Licensee MDPI, Basel, Switzerland. This article is an open access article distributed under the terms and conditions of the Creative Commons Attribution (CC BY) license (https://creativecommons.org/licenses/by/4.0/).
Share and Cite
Konstantinidis, A.O.; Adamama-Moraitou, K.K.; Griggs, A.; Musser, M.L.; Nenninger, A.S.; Soubasis, N.; Pardali, D.; Mylonakis, M.E.; Jergens, A.E. Blood Leukocyte Ratios as Predictive Markers of Chronic Enteropathy Phenotypes in Cats. Vet. Sci. 2025, 12, 613. https://doi.org/10.3390/vetsci12070613
Konstantinidis AO, Adamama-Moraitou KK, Griggs A, Musser ML, Nenninger AS, Soubasis N, Pardali D, Mylonakis ME, Jergens AE. Blood Leukocyte Ratios as Predictive Markers of Chronic Enteropathy Phenotypes in Cats. Veterinary Sciences. 2025; 12(7):613. https://doi.org/10.3390/vetsci12070613
Chicago/Turabian StyleKonstantinidis, Alexandros O., Katerina K. Adamama-Moraitou, Ashley Griggs, Margaret L. Musser, Ariel S. Nenninger, Nektarios Soubasis, Dimitra Pardali, Mathios E. Mylonakis, and Albert E. Jergens. 2025. "Blood Leukocyte Ratios as Predictive Markers of Chronic Enteropathy Phenotypes in Cats" Veterinary Sciences 12, no. 7: 613. https://doi.org/10.3390/vetsci12070613
APA StyleKonstantinidis, A. O., Adamama-Moraitou, K. K., Griggs, A., Musser, M. L., Nenninger, A. S., Soubasis, N., Pardali, D., Mylonakis, M. E., & Jergens, A. E. (2025). Blood Leukocyte Ratios as Predictive Markers of Chronic Enteropathy Phenotypes in Cats. Veterinary Sciences, 12(7), 613. https://doi.org/10.3390/vetsci12070613