Article

Parity-Associated Differences in the Antioxidants and Fecal Microbiota of Bactrian Camels

1
Innovative Team for Hetao Agricultural Products’ Nutrition and High-Value Utilization, Department of Agriculture, Hetao College, Bayannur 015000, China
2
School of Agriculture and Biology, Shanghai Jiao Tong University, Shanghai 200042, China
3
Inner Mongolia Yinggesu Biotechnology Co., Ltd., Bayannur 015000, China
4
Hulunbuir Agricultural and Animal Husbandry Institute, Hulunbuir 021008, China
*
Author to whom correspondence should be addressed.
Vet. Sci. 2025, 12(5), 440; https://doi.org/10.3390/vetsci12050440
Submission received: 1 April 2025 / Revised: 24 April 2025 / Accepted: 28 April 2025 / Published: 3 May 2025

Simple Summary

In certain nations, there has been an increase in the breeding and management of dromedary and Bactrian camels for milk production. Parity is an important physiological process, and this study was designed to reveal the dynamics of antioxidant parameters and the fecal microbiome. Antioxidant parameters affect animal health and welfare, and the gastrointestinal microbiome can be influenced by environmental changes that the host may face. This study focused on the possible relationships among parity, antioxidants, and the gastrointestinal microbiome. This study revealed changes in antioxidants in milk and serum and in the fecal microbial communities of lactating camels of different parities. Camel behavior and welfare are new phenomena in the area of animal production, so this study may provide scientific information for the friendly management of lactating camels.

Abstract

Camels survive in deserts through unique, adapted metabolic and immunological processes that are normally lethal to other species. Antioxidants and the gastrointestinal microbiota play major roles in redox homeostasis, yet they remain unexplored in camels to date. The objectives of this study were to characterize the dynamics of milk antioxidants, serum antioxidants, and the fecal microbiome of lactating Bactrian camels with different parities. In total, 30 lactating camels were selected and categorized into the following 3 groups: 10 were assigned to the first parity group (P_1), 10 were classified into the third parity group (P_3), and 10 belonged to the fifth parity group (P_5). The antioxidant parameters of the lactating camels were determined in milk and serum. The fecal microbial community of lactating camels was assessed using 16S rRNA amplicon sequencing, and the resulting library was sequenced on an Illumina NovaSeq platform. The amount of total antioxidant capacity (T-AOC) and antioxidant activity for polypepetides (DPPH) in the third parity was the highest among the groups both in the camel milk and its serum. In the case of hydroxyl radical (OH) and SOD, the amounts were 9.62 U/mL (SEM = 0.4950) and 13.64 U/mL (SEM = 0.5144), respectively, for P_1 in the serum, which were extremely significantly greater than those of the other groups. The Shannon index was significantly different between the P_1 group and either the P_3 or P_5 group. Additionally, Simpson’s diversity index significantly differed between the P_1 group and the P_5 group. Furthermore, the number of OH in camels is positively associated with the metabolic pathway of non-oxidative pentose phosphate pathway and ANAGLYCOLYSIS-PWY. In conclusion, this study revealed that different parities were associated with distinct levels of antioxidant parameters and fecal microbial ecologies in lactating Bactrian camels, where parity affects metabolic and microbial health. Understanding these dynamics in camels could optimize their nutritional management, enhancing their welfare in challenging environments.

1. Introduction

In deserts, camels hold irreplaceable significance for rangeland ecology [1] and food production [2]. Camels have evolved unique traits and physiological mechanisms to thrive in arid climates, with dromedaries and Bactrian camels adapting to these environments [3,4]. Camels survive in arid climates through unique, adapted metabolic and immunological processes that are normally lethal to other species [5]. However, antioxidants play a major role in redox homeostasis in animals by controlling the overproduction of prooxidants [6]. A better understanding of redox changes may provide a deeper understanding of the pathophysiology and help in the development of control strategies for healthy animals related to growth, pregnancy, parturition, and lactation periods [7].
In camels, research on antioxidants and oxidative stress has focused mainly on the peripartum, pregnancy, and early lactation periods. Research on the effects of reproductive disorders on milk production and proinflammatory cytokines has revealed that the use of prooxidants may be necessary for early diagnosis to prevent related diseases in camels suffering from reproductive disorders [8]. Furthermore, periparturient camels experience substantial oxidative stress, particularly at parturition and the week after calving, as indicated by increased total antioxidant capacity [9]. Moreover, studies have revealed linkages between steroid hormones and antioxidant parameters during pregnancy and early lactation in female camels [10]. Dynamic changes in serum or milk antioxidant parameters as a result of lactation in the postpartum period in camels have also been reported [4].
The gut microbiome and its metabolites have significant effects on host health, immunity, metabolism, and neurobehavioral traits in mammals [11,12]. Conversely, environmental factors such as diet, host genetics, parity, sex, and animal health influence the composition of the microbial community both quantitatively and qualitatively [13,14]. Camels provide the necessary physiological conditions for microbial growth, as they rely on these microbes for the digestion of shrubs and nutrient supply [15]. However, camels possess a distinct gastrointestinal system consisting of the rumen, reticulum, and abomasum but lacking the omasum, which suggests that their gastrointestinal microbiome is likely distinct [16].
The number of times a woman has given birth has long-term implications for women’s physical and mental health [17,18]. In humans, the vaginal microbiota composition is strongly associated with advancing gestational age and parity [19]. In dairy cattle, increasing parity is inversely associated with survival and reproduction [20]. The relative abundance of Actinobacteria was greater in primiparous cows than in multiparous cows, emphasizing the association of the uterine microbiota with parity [21]. In multiparous Holstein dairy cattle, reactive oxygen species and malondialdehyde increase oxidative stress during the early lactation period [22]. High-yield dairy cattle commonly exhibit high levels of oxidative parameters and are exposed to inflammatory stimuli during parturition and early lactation [23,24]. Cows in the first and second lactations had greater levels of antioxidants than cows in their third and greater lactations did [25].
In camels, milk proteins and free fatty acids are markedly affected by parity in traditional rangeland production systems [26]. The milk fat of primiparous camels, an intensive production system, appears to have relatively high nutritional value, as it contains relatively high levels of unsaturated fatty acids [27].
However, the dynamics of antioxidant parameters and gastrointestinal microbes remain largely unexploited for camels with different parities. Therefore, this study aims to characterize the differences among antioxidants in milk, antioxidants in serum, and the fecal microbial community in lactating Bactrian camels with different parities.

2. Materials and Methods

This study was carried out in accordance with the recommendations of the Instructive Notions with Respect to Caring for Experimental Animals of the Ministry of Technology of China. The protocol was approved by the Ethics Committee of Hetao College (protocol code HTDX2330 and date of approval 7 July 2023).

2.1. Experimental Design, Animals, and Sample Collection

Prior to the first parturition, the camels remained in the traditional rangeland production system, where the main vegetation belongs to Amaranthaceae, Fabaceae, Zygophyllaceae, Poaceae, and Liliaceae. They are capable of ingesting shrubs, such as Caragana tibetica, Haloxylon ammodendron, Caragana korshinskii, and Sarcozygium xanthoxylon. After parturition and 60 days of lactation, the lactating camels were sent to the intensive production system, which was housed in an open yard that provided total mixed rations (TMR), and the diet composition and nutrient levels are displayed in Table 1. The camels of different parities were housed together in the same open yard, and the TMR was provided three times a day for the camels ad libitum.
The animals were group-fed a diet of 20 kg/head/day, and drinking water and alkali stones were provided all day. After the lactating period, the female camels returned to the traditional rangeland until the next parturition. The lactating Bactrian camels, with a mean body weight of 473 kg (ranging from 460–490 kg), and their kids, with a mean body weight of 154 kg (ranging from 140–160 kg), included in this research, were obtained from Inner Mongolia Yinggesu Biotechnology Co. Ltd. (Urad-North Banner, Bayannur, China).
There were 642 lactating camels in total, the majority of the lactating camels’ parities ranged from 1st to 5th parity, and the parturition time ranged from mid-March to mid-April. In total, 30 camels with parturition times ranging from 20 March to 25 March were selected, and the lactating camels were categorized into the following 3 groups: P_1 (10 female lactating camels, 1st parity), P_3 (10 female lactating camels, 3rd parity), and P_5 (10 female lactating camels, 5th parity). The mean ages for the P_1 group was 5 years (average milk production of 1.53 kg/d per camel), 9 years for the P_3 group (average milk production of 2.62 kg/d per camel), and 14 years for the P_5 group (average milk production of 2.99 kg/d per camel).
The lactating day ranged from the 155th day to the 160th day, and sampling was conducted on 30 August. Blood samples from the respective camels were collected from the jugular vein and placed into 10 mL plain vacutainer tubes after the morning milking, and 15 mL of blood was collected from each individual camel. The serum was separated immediately and stored at −20 °C. The respective individual milk and fecal samples were obtained from lactating camels by collecting the samples from each camel into sterile frozen tubes (FalconTM 10 mL conical) and collecting 10 mL of milk and feces, respectively. The collected milk and fecal samples were then stored at temperatures of −20 °C and −80 °C, respectively. Finally, antioxidant analysis of milk and serum was conducted within twenty days, while microbial DNA extraction and 16S rRNA sequencing were performed within thirty days.

2.2. Antioxidant Analysis in Milk and Serum

The total antioxidant capacity (T-AOC), catalase (CAT), antioxidant activity for hydroxyl radical (OH), superoxide dismutase (SOD), and glutathione peroxidase (GSH), and antioxidant activity for polypeptides (DPPH) in milk and serum were examined via commercial kits (Nanjing Jiancheng Biotech Institute, Nanjing, China).

2.3. Microbial DNA Extraction and 16S rRNA Sequencing

The total genomic DNA from the samples was extracted using the hexadecyltrimethylammonium bromide method. The concentration and purity of the DNA were assessed via 1% agarose gels and a Nanodrop spectrophotometer (Thermo Fisher Scientific, Madison, WI, USA). The DNA was diluted to a concentration of 1 ng/µL in sterile water. The 16S rRNA genes, specifically the V3~V4 regions, were amplified via the specific primers 341F (5′-CCTAYGGGRBGCASCAG-3′) and 806R (5′-GGACTACNNGGGTATCTAAT-3′) with barcodes, and the barcode sequence was dual-indexed for each sample. All PCRs were performed with 15 µL of Phusion® High-Fidelity PCR Master Mix (New England Biolabs, Beijing, China), 2 µM forward and reverse primers, and about 10 ng of template DNA. The thermal cycling protocol included an initial denaturation step at 98 °C for 1 min, followed by 30 cycles of denaturation at 98 °C for 10 s, annealing at 50 °C for 30 s, and elongation at 72 °C for 30 s, with a final extension step at 72 °C for 5 min. The PCR products were then mixed with an equal volume of buffer and subjected to electrophoresis on a 2% agarose gel for detection. The PCR products at equal ratios were pooled together, and the mixture was purified via universal DNA purification kits (TianGen, Tianjin, China). The PCR was performed in three technical replicates for each individual sample. The technical replicate (3 independent DNA extractions/sequencing per set) were designed to verify the experimental robustness.

2.4. Libraries Generated, Illumina NovaSeq Sequencing, and Bioinformatics

The NEB Next® Ultra DNA Library Prep Kit (Illumina, San Diego, CA, USA) was utilized to generate sequencing libraries following the manufacturer’s guidelines. Index codes were added to the libraries. The quality of the libraries was evaluated via an Agilent 5400 system (Agilent Technologies Co., Ltd., Santa Clara, CA, USA). Finally, the libraries were sequenced on an Illumina NovaSeq platform (Illumina, San Diego, CA, USA), resulting in the generation of 250 bp paired-end reads.
The analysis was performed following the “Atacama soil microbiome tutorial” provided in the Quantitative Insights into Microbial Ecology (QIIME2) documentation, along with customized program scripts (https://docs.qiime2.org/2019.1/; accessed on 10 February 2023). Normalization was conducted on the read counts before downstream analysis using the Shapiro-Wilk test. The total good depth was 99.51%, and the mean read count was 79,161 for the samples. In summary, the raw data FASTQ files were imported into a format compatible with the QIIME2 system via the QIIME tools import program. The demultiplexed sequences from each sample were subjected to quality filtering, trimming, denoising, and merging. The QIIME2 dada2 plugin was utilized to identify and eliminate chimeric sequences, resulting in the generation of an amplicon sequence variant (ASV) feature table [28]. To assign taxonomic classifications, the QIIME2 feature-classifier plugin was employed to align the ASVs to a pretrained GREENGENES 13_8 99% database (trimmed to the V3-V4 region defined by the 338F/806R primer pair), producing a taxonomy table [29]. The QIIME2 feature-table plugin was used to remove any mitochondrial or chloroplast sequences that could contaminate the analysis. Unless otherwise specified, default parameters were employed for the analysis. Additionally, the potential functional profiles of the microbial communities, including Kyoto Encyclopedia of Genes and Genomics (KEGG) pathways and Enzyme Commission (EC) annotations, were predicted via phylogenetic investigation of communities by reconstruction of unobserved states (PICRUSt) [30]. The pathway abundances were normalized.
Diversity metrics were calculated using the core-diversity plugin in QIIME2. Alpha diversity indices at the feature level, including observed operational taxonomic units (OTUs), the Shannon diversity index, and Faith’s phylogenetic diversity index, were computed to assess the microbial diversity within each sample. The rarefaction cutoff level was 38084. The Wilcoxon test was employed to evaluate the significance of differences between the groups. To assess the structural variation in microbial communities across samples, beta diversity distance measurements, specifically weighted UniFrac, were performed. Principal coordinate analysis (PCoA) of the fecal microbial communities was performed using the FactoMineR package and visualized via the ggplot2 package in R software (version 3.5.2). The relative abundances of the microbes, KEGG, and ECs were ranked by QIIME and visualized via the ggplot2 package in R.

2.5. Statistical Analysis

The statistical analysis accounted for multiple testing corrections to avoid false positives. To identify taxa with differing abundances among groups, linear discriminant analysis effect size (LEfSe) was employed, and significant differences were defined as linear discriminant analysis (LDA > 4) and p < 0.05. Additionally, principal component analysis (PCA) of all the samples was performed using the FactoMineR package and visualized using the ggplot2 package in R.
One-way ANOVA of the amounts of T-AOC, OH, SOD, GSH, and DPPH in milk and serum was performed by SAS (v9.4). Duncan’s test was carried out to determine significant differences at p < 0.05.
Considering the false discovery rate, Spearman’s rank correlations were calculated to explore the relationships among the top 20 genera, top 20 MetaCyc, top 20 KEGG, and top 20 ECs with the oxidative stress parameters, and these correlations were visualized via the pheatmap package in R. There were significant correlations (p < 0.05), highly significant correlations (p < 0.01), and extremely significant correlations (p < 0.001).

3. Results

3.1. Dynamics of Antioxidants in the Lactating Camel

As shown in Table 2, concerning the P_3 group, the amounts of T-AOC (86.09 mg/mL), SOD (68.17 U/mL), and DPPH (205.43 μg Trolox/mL) were significantly greater than those in the other groups. In the case of OH, the amounts were 16.75 U/mL and 16.08 U/mL for the P_3 and P_5 groups, respectively, which were significantly greater than those of P_1. Concerning the P_1 group, the amount of CAT (2.87 U/mL) was greater than that in the other groups.
As shown in Table 3, concerning the P_3 group, the amounts of T-AOC (5.30 mg/mL) and DPPH (126.04 μg Trolox/mL) were significantly greater than those in the other groups. In the case of OH and SOD, the amounts were 9.62 U/mL and 13.64 U/mL for P_1, respectively, which were significantly greater than those of the other groups. In the P_5 group, the amount of SOD (11.50 U/mL) was greater than that in the P_3 group.

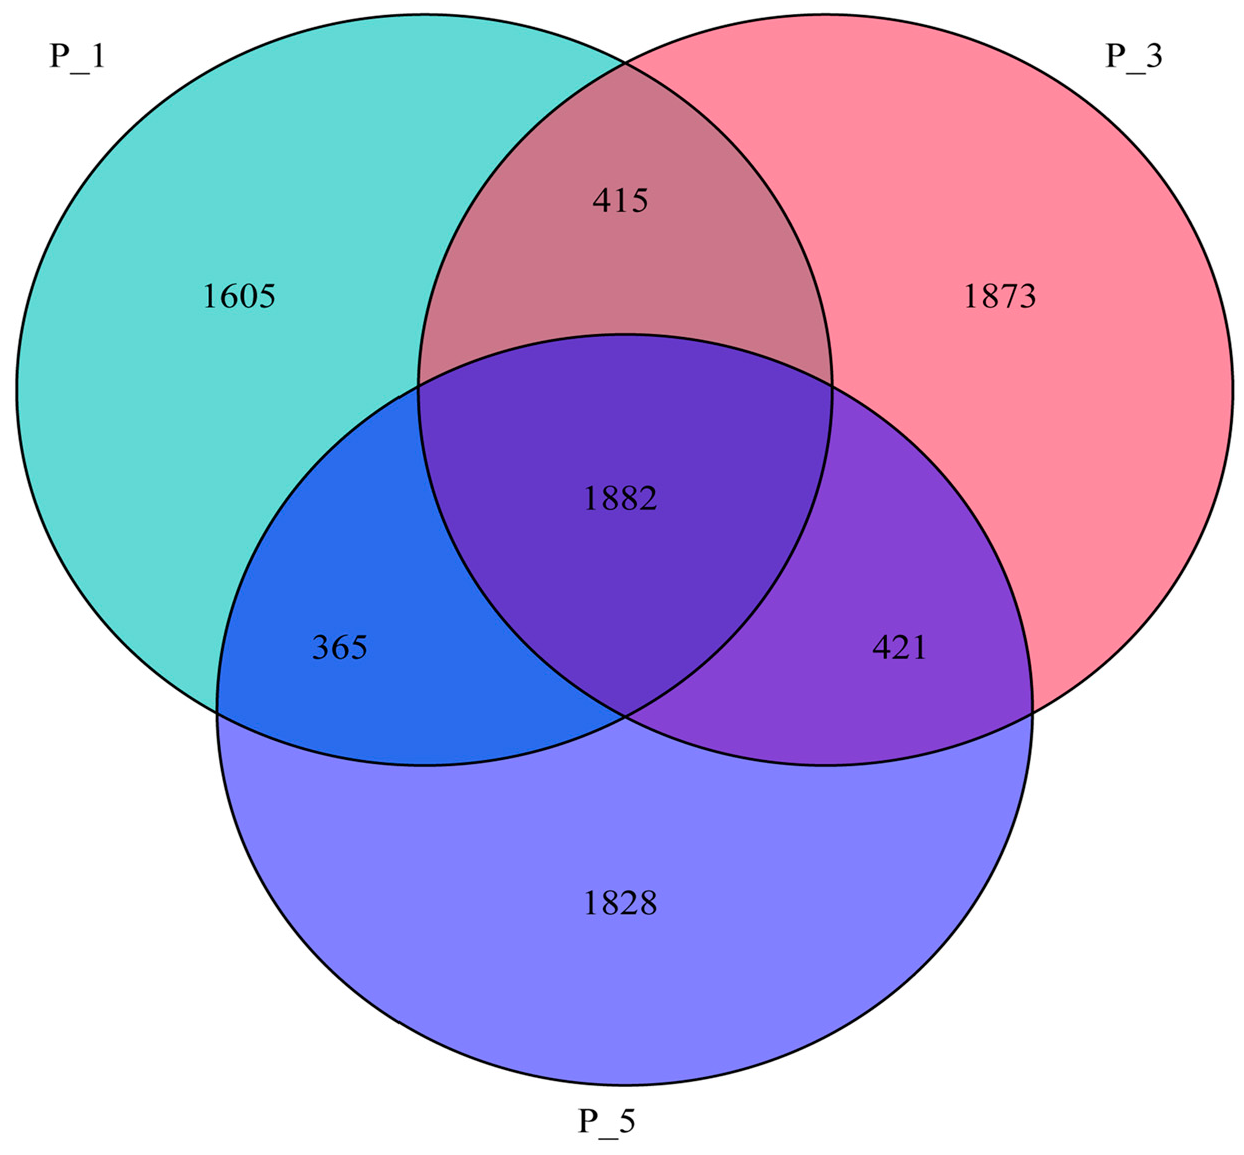
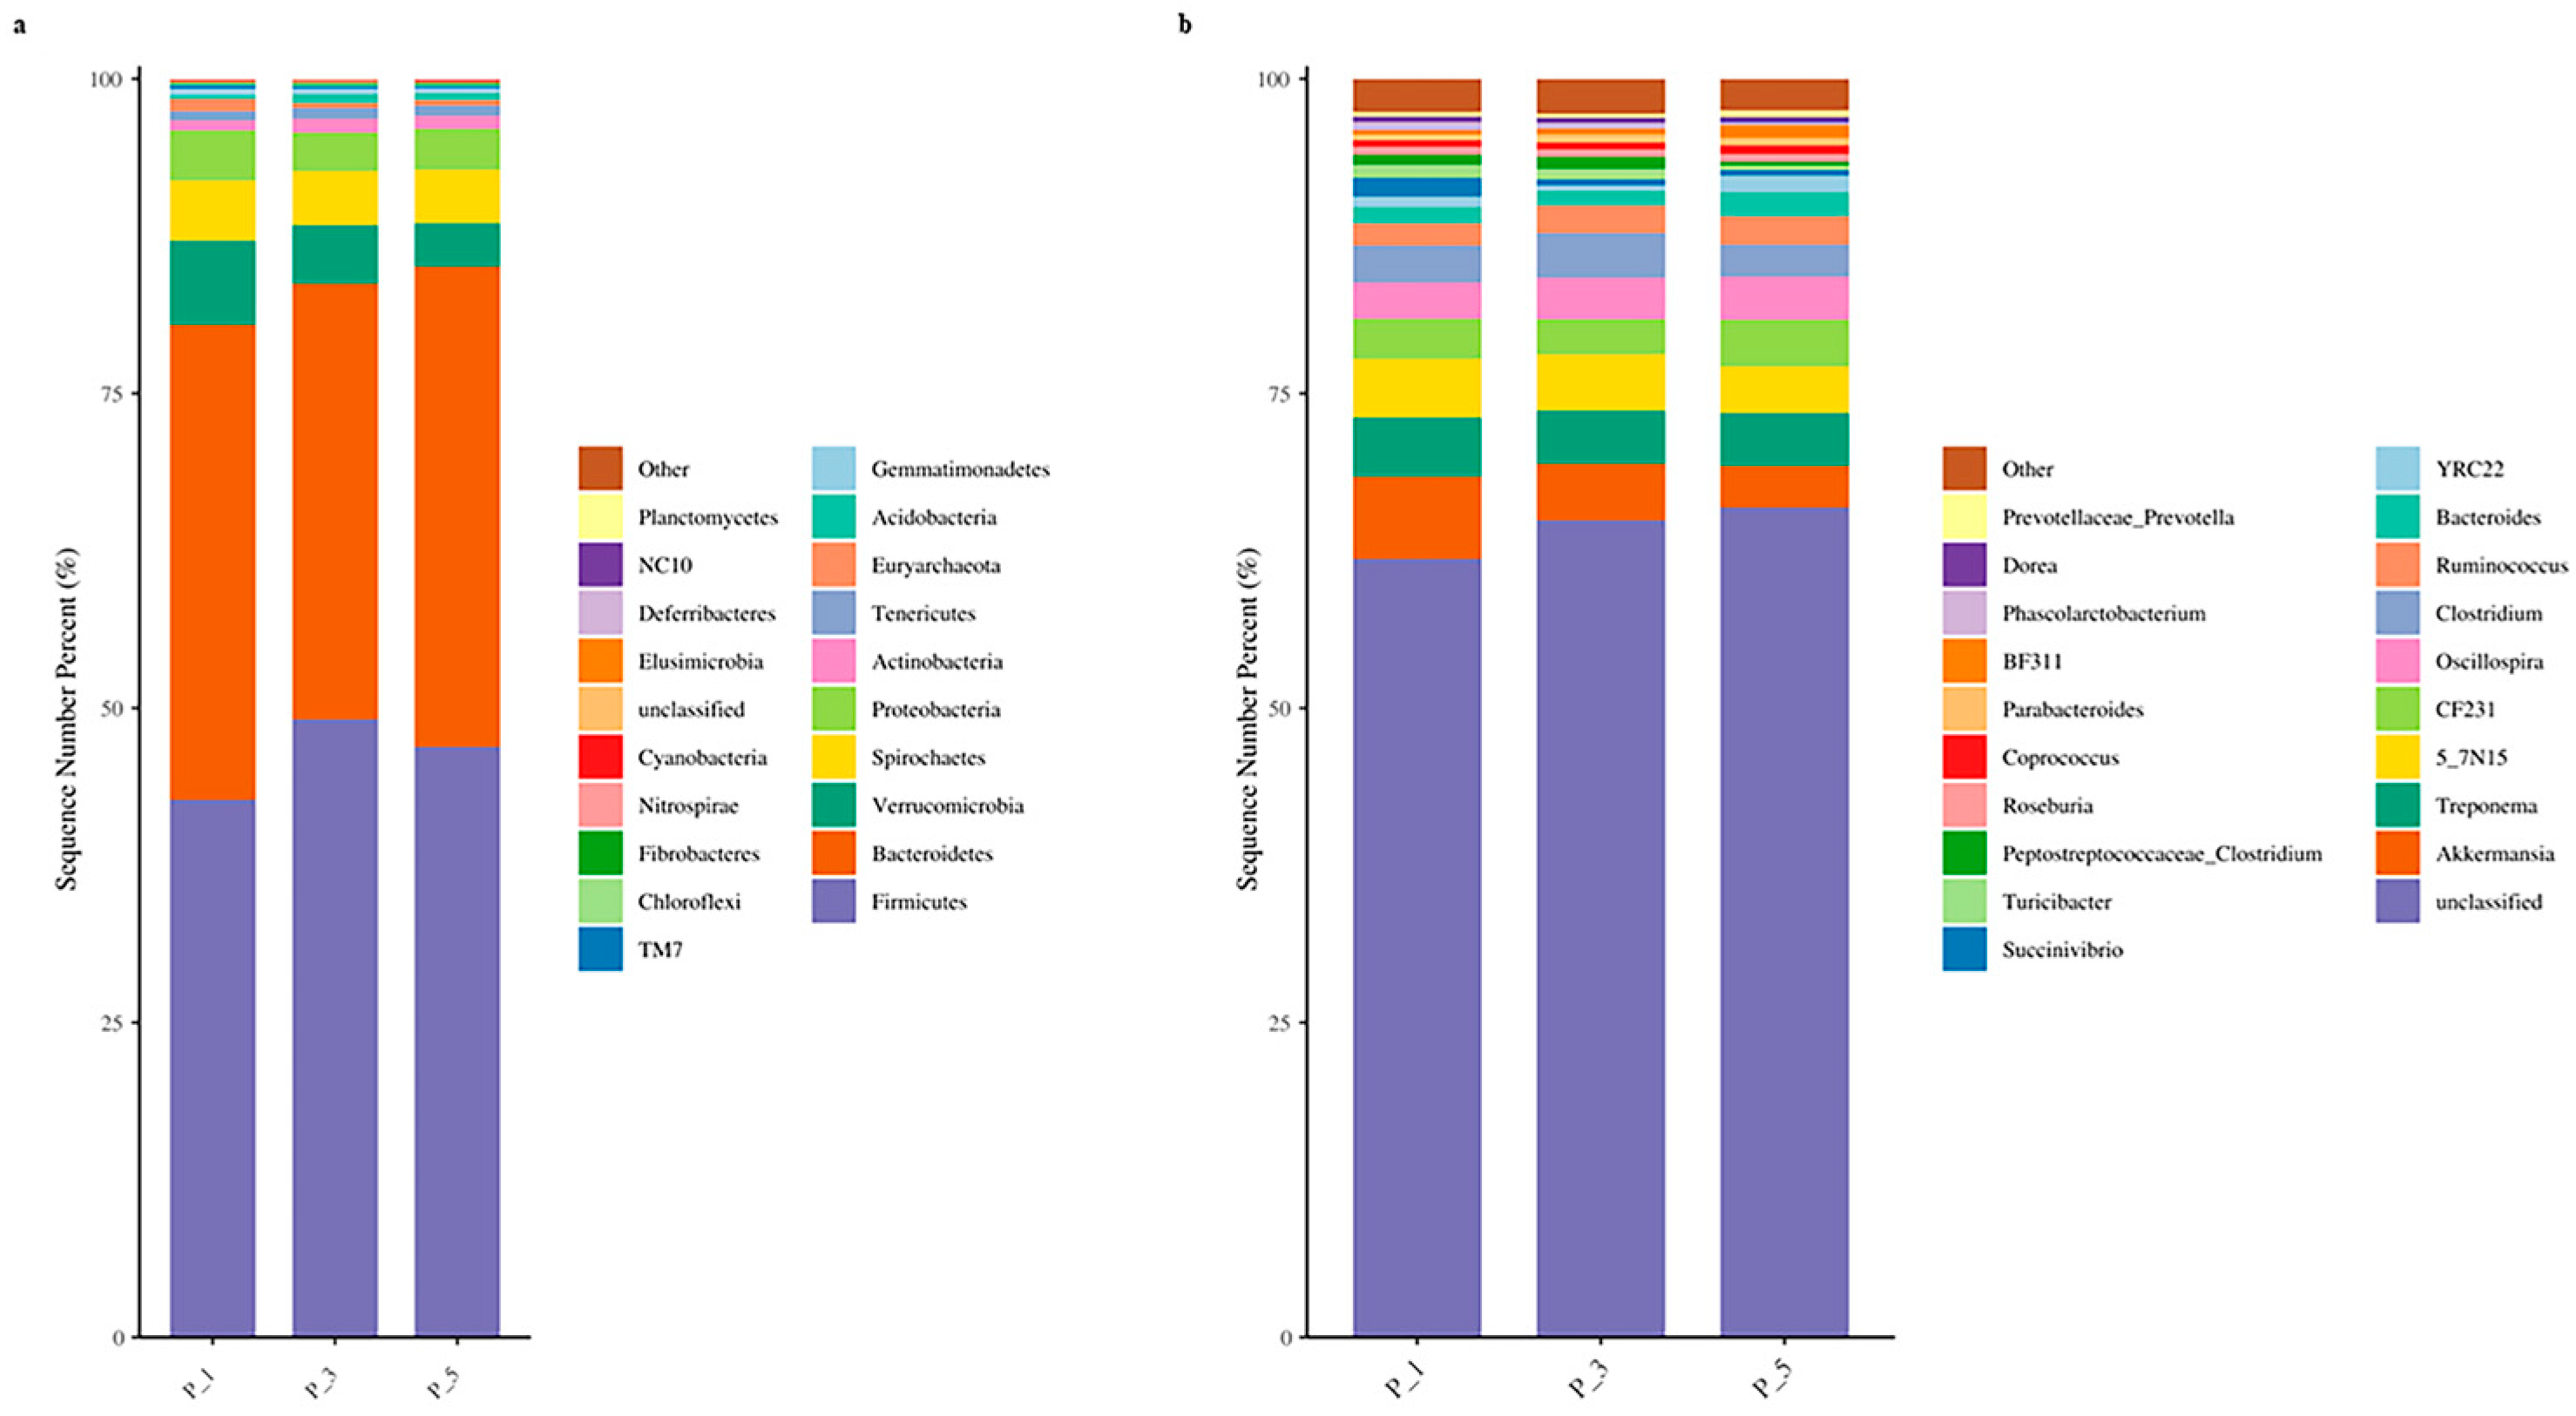
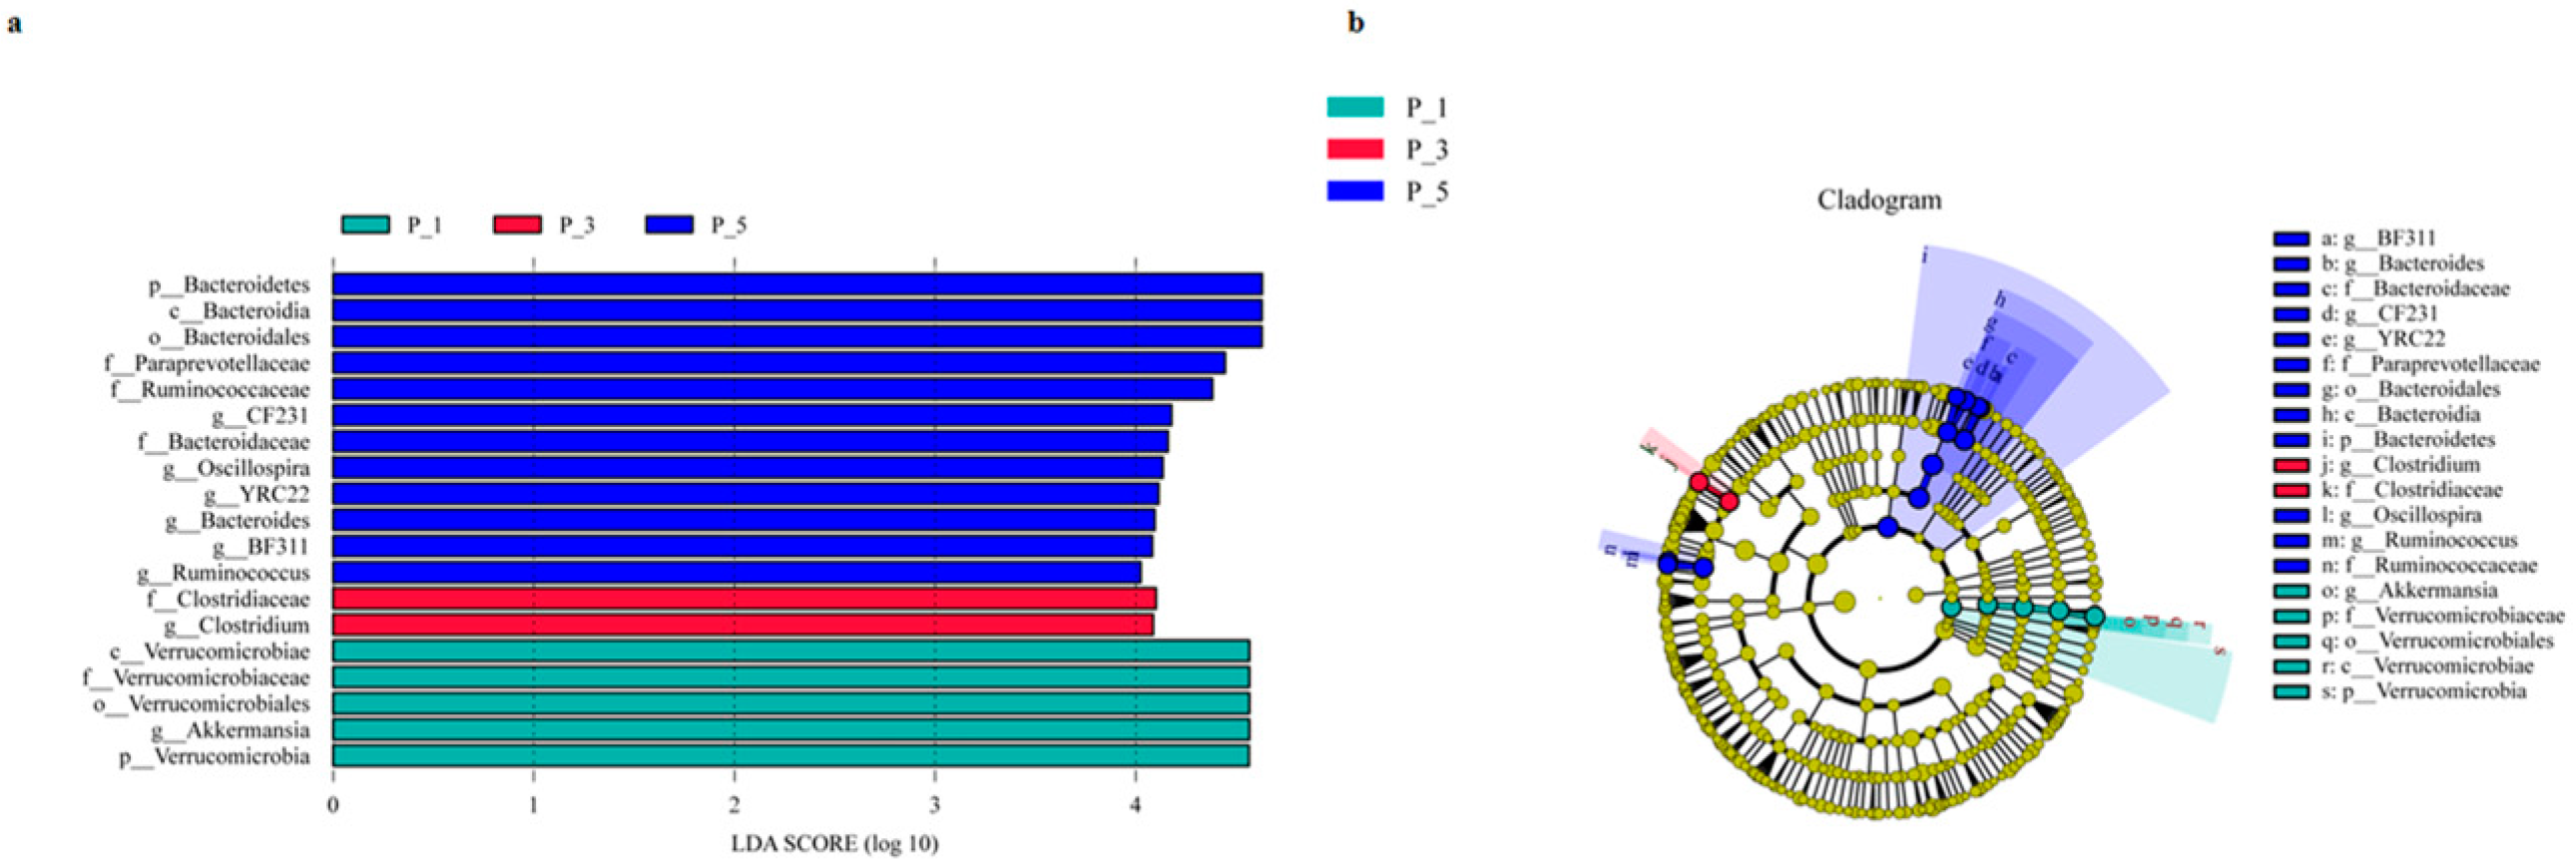
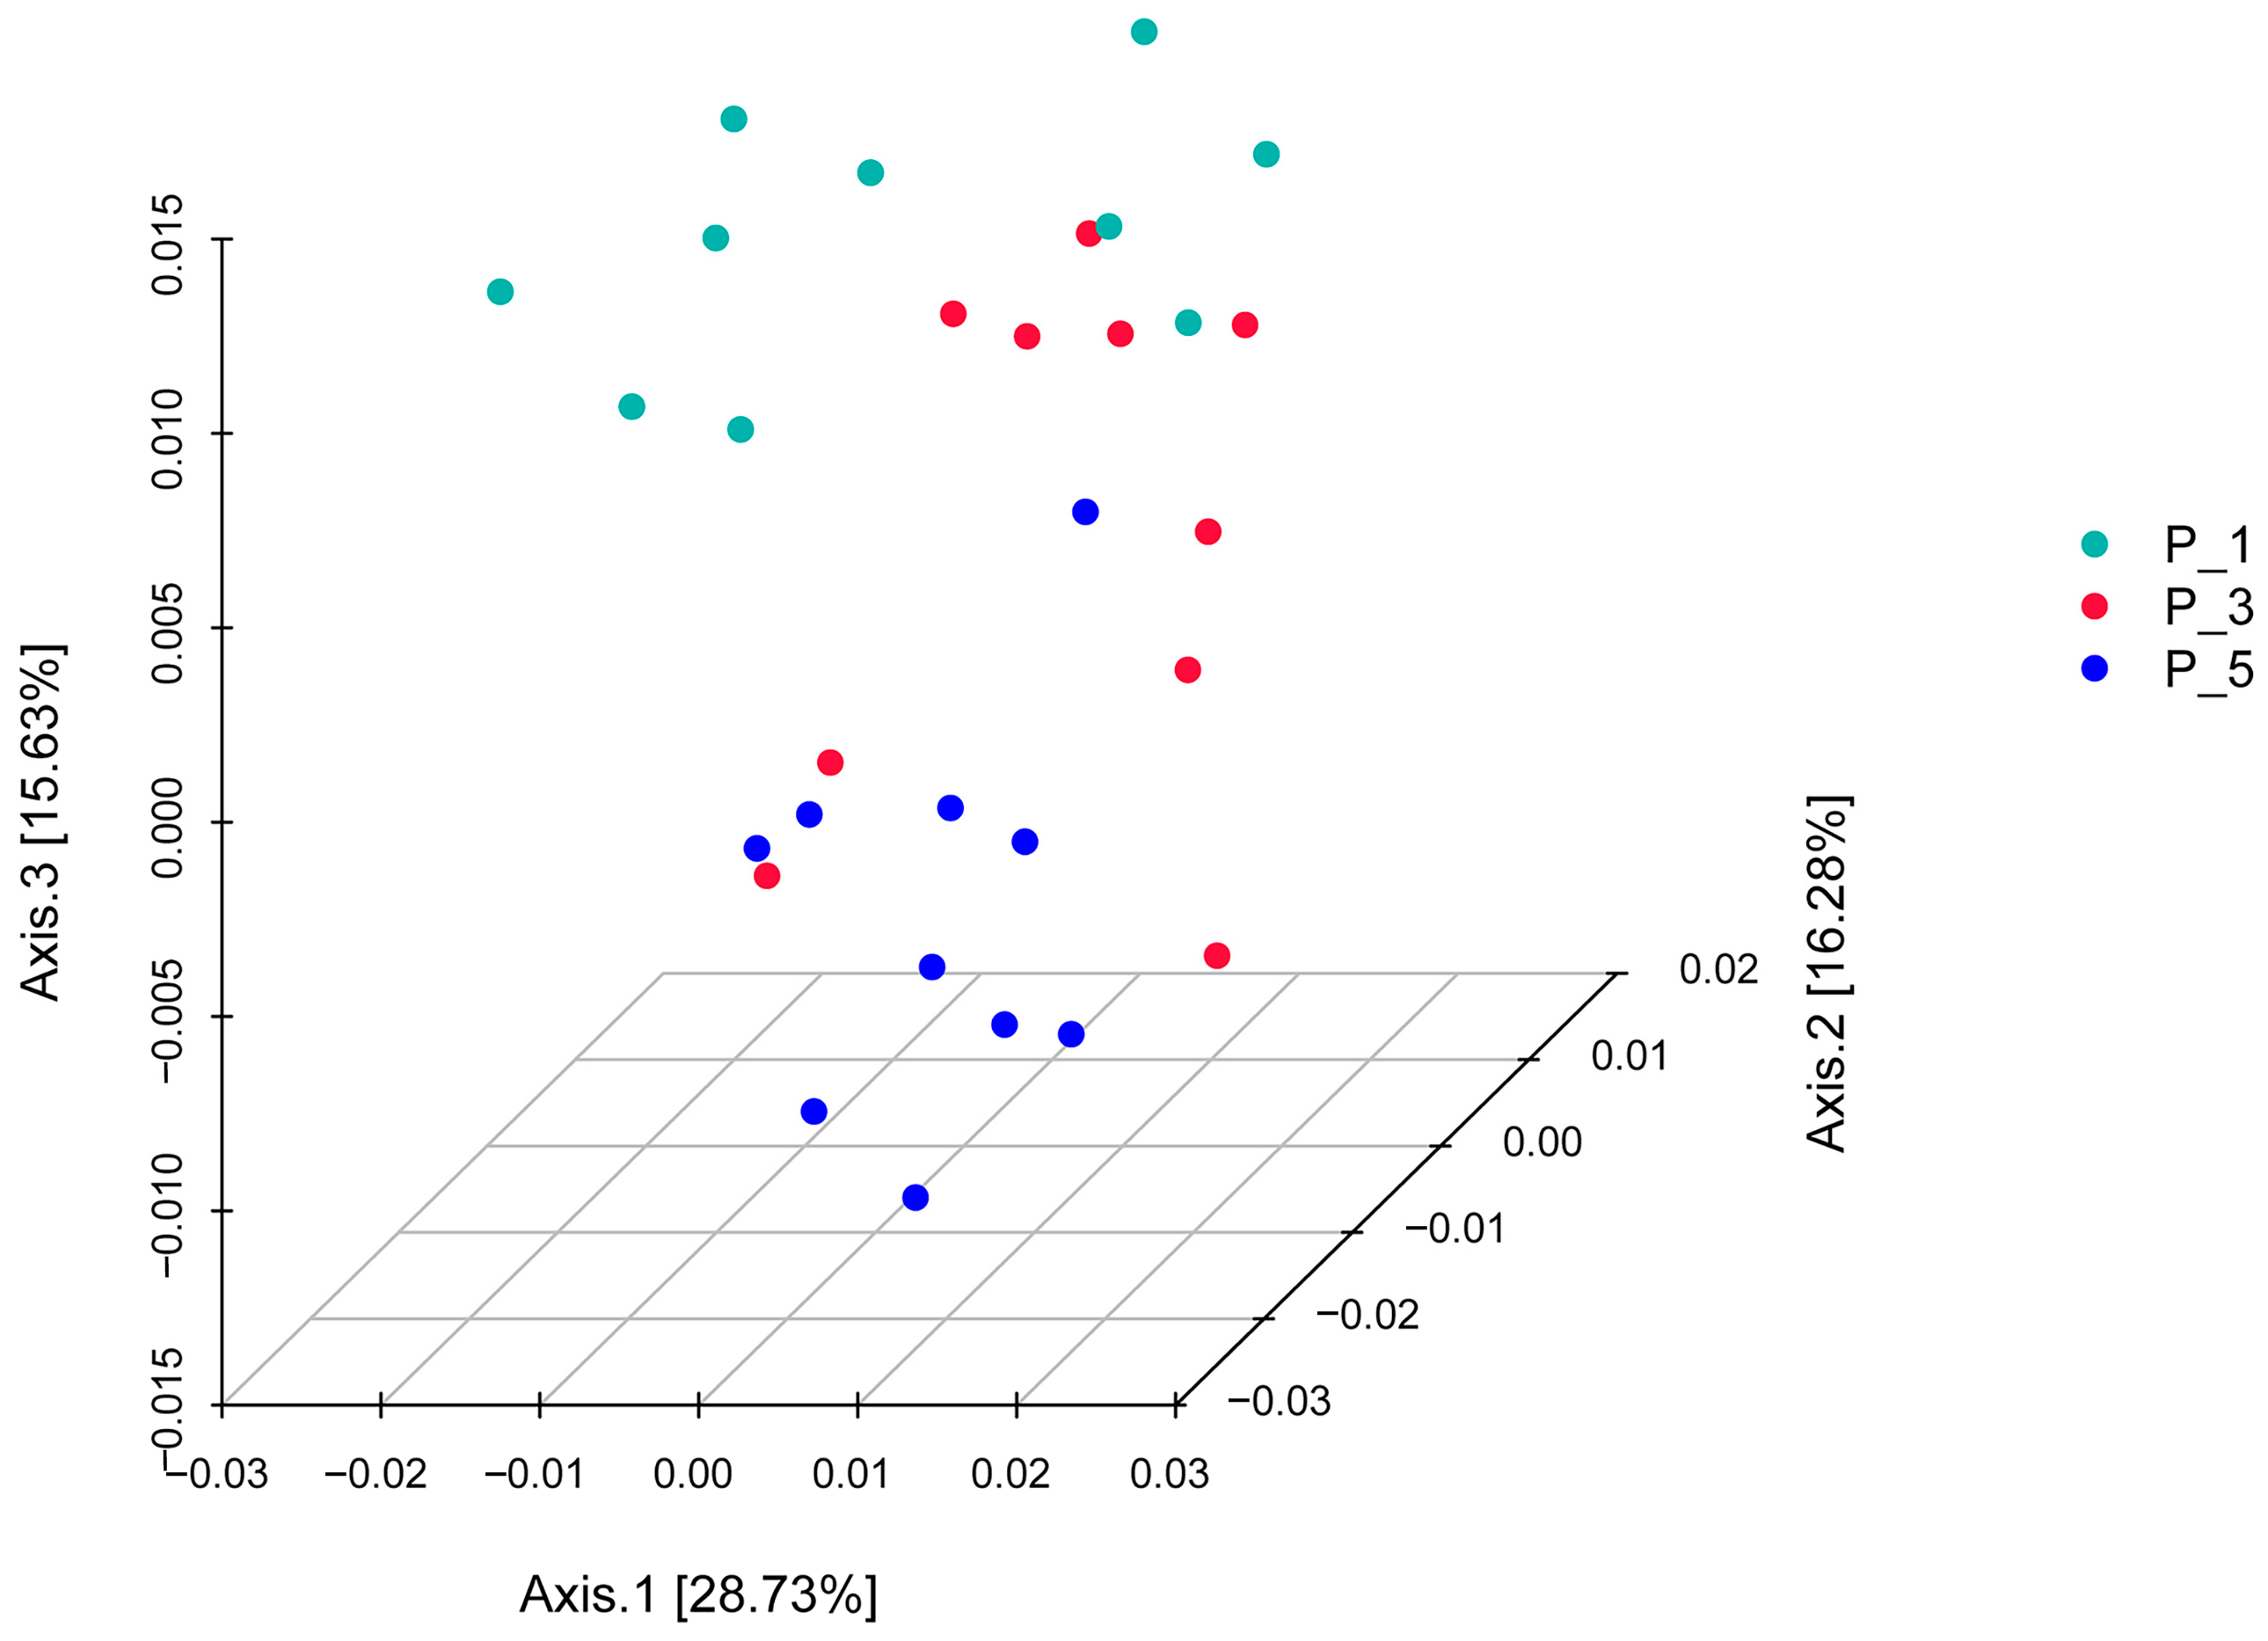
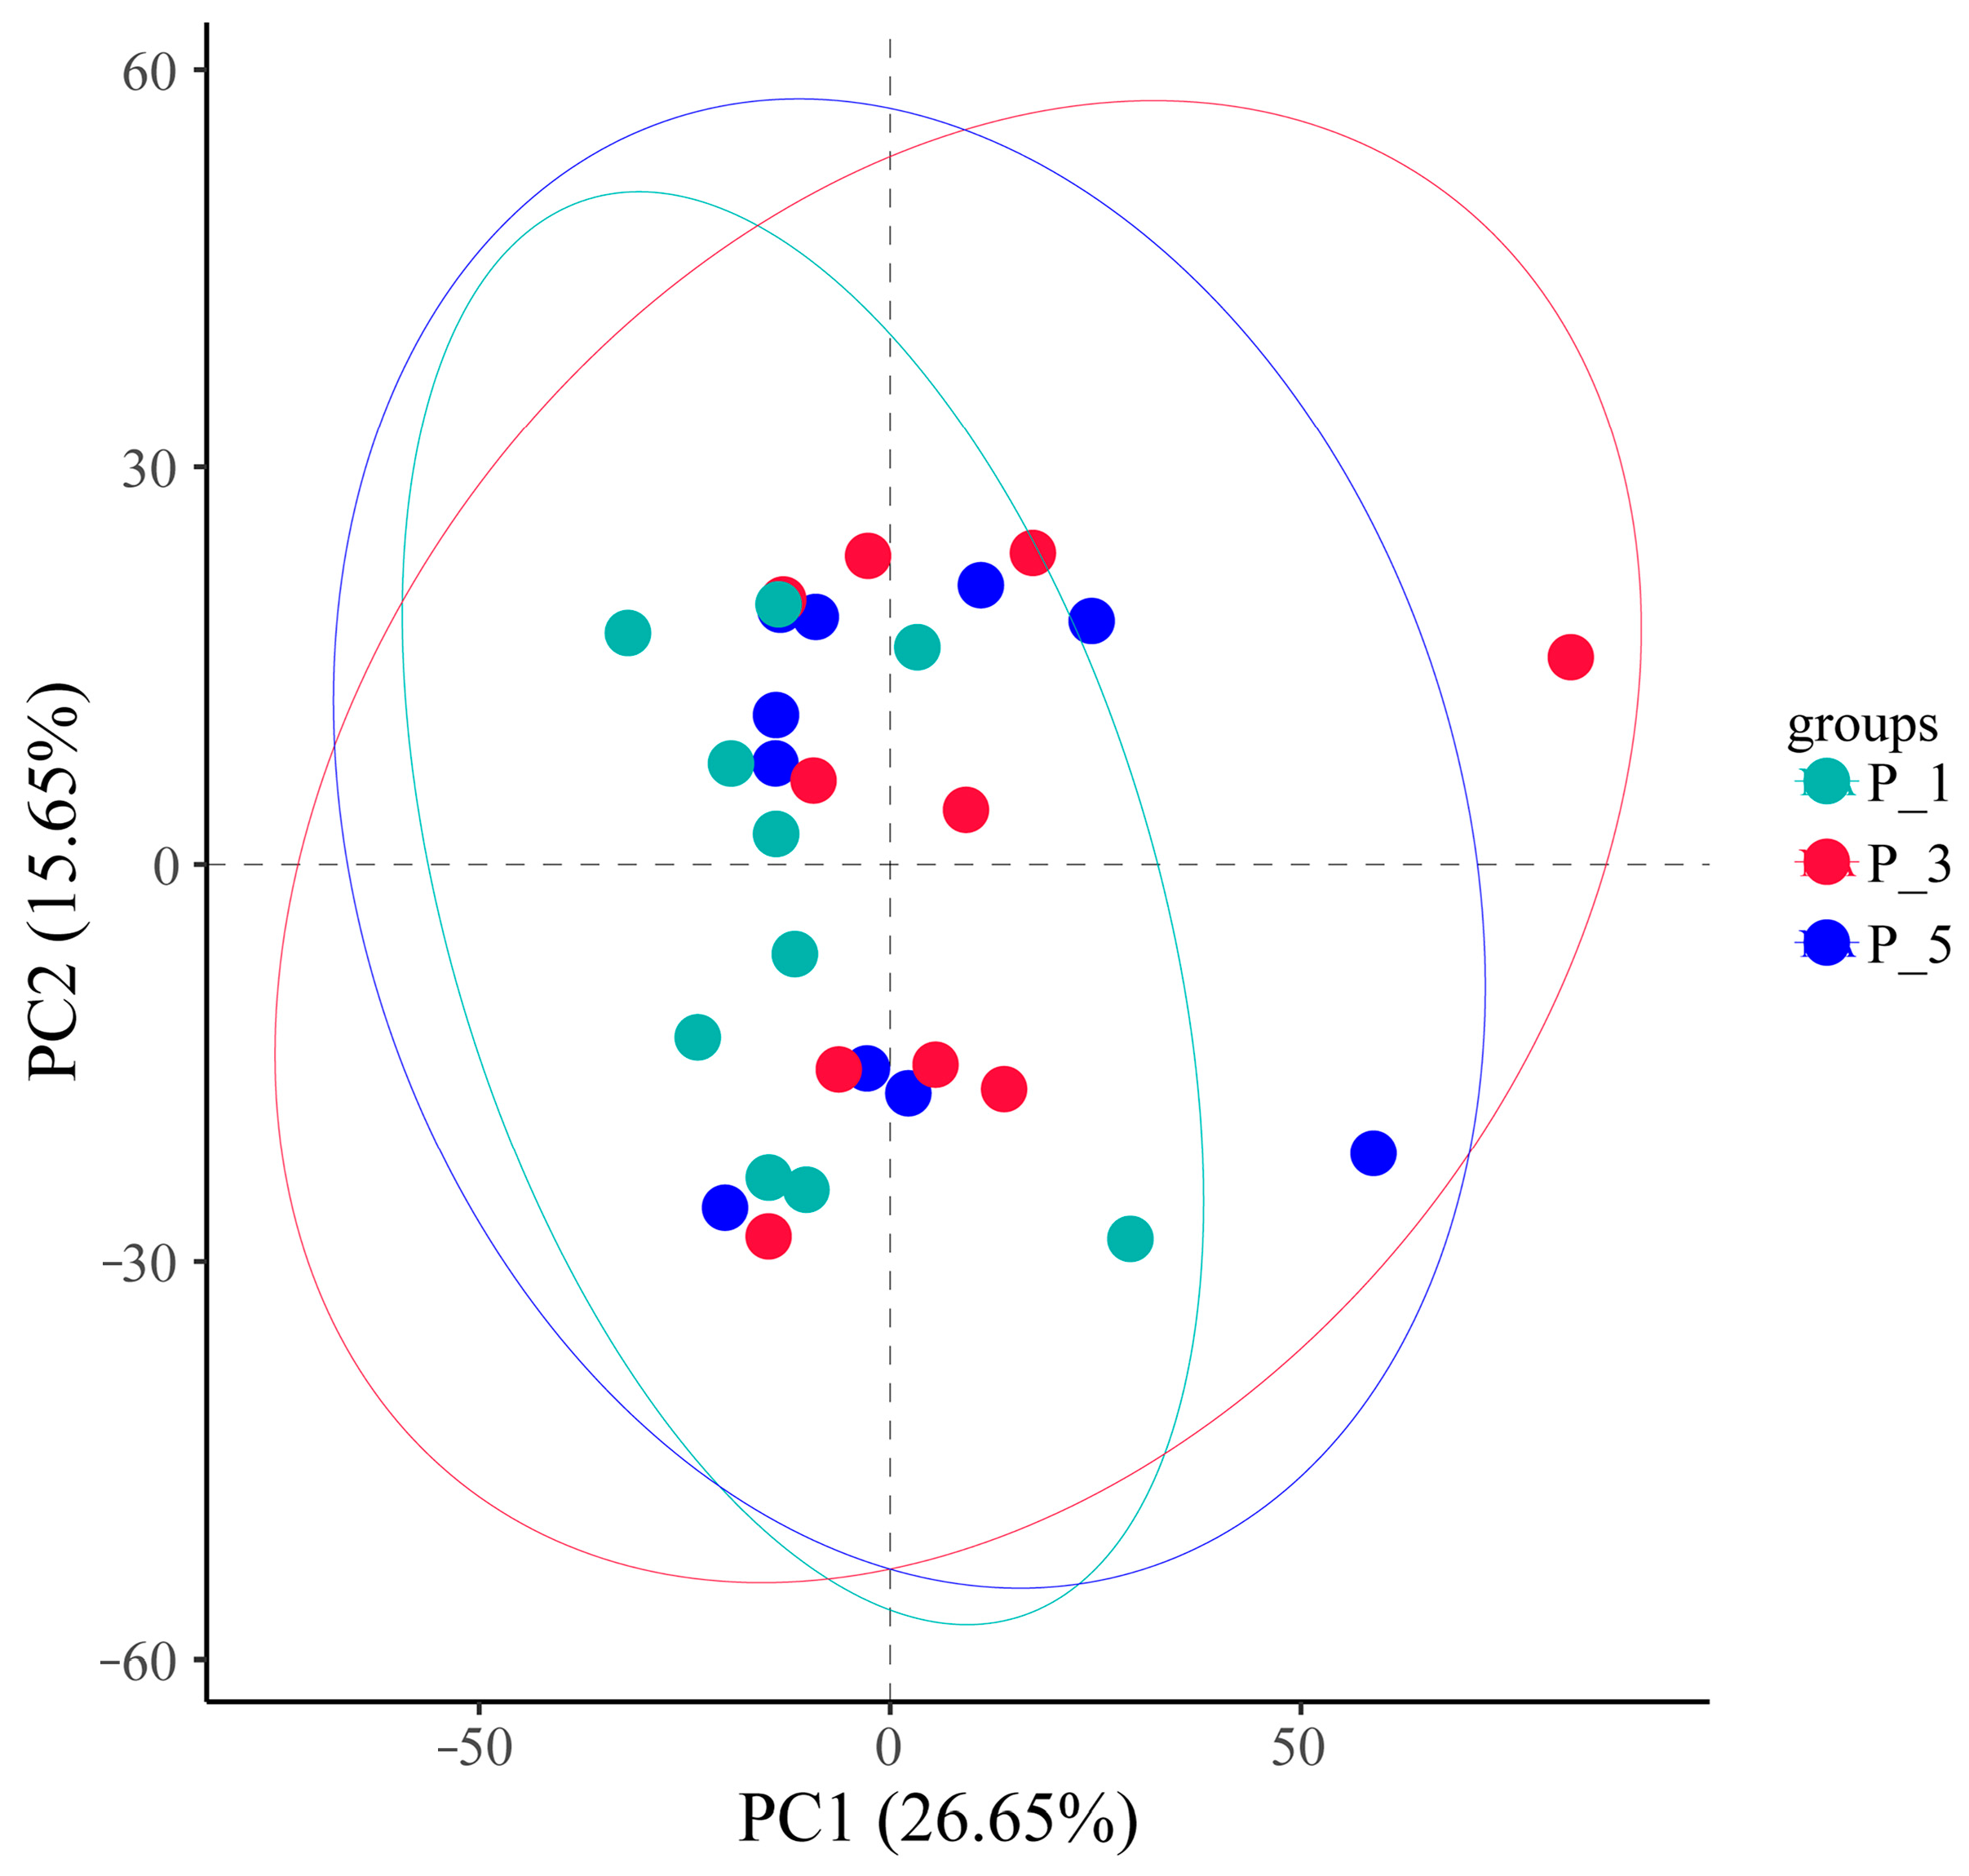
3.2. Dynamics of the Fecal Microbial Community in the Lactating Camel

All the sequences were deposited in the NCBI Sequence Read Archive (SRA) at the accession number PRJNA964482. A total of 2,374,823 reads were obtained through the sequencing of bacterial and archaeal 16S rRNA genes. Of these, 99.42% were assigned to bacteria, and 0.58% were assigned to archaea. In total, 8389 OTUs were identified, with 32 phyla, 98 classes, 148 orders, 187 families, 200 genera, and 59 species.
A Venn diagram (Figure 1) revealed that there were 1882 common observed operational taxonomic units (OTUs) among the three groups. Additionally, 1605, 1873, and 1828 OTUs were observed in groups P_1, P_3, and P_5, respectively.
Figure 2a illustrates the top 20 most abundant phyla. Among them, Firmicutes (46.25%) was the most prevalent, followed by Bacteroidetes (36.84%), Verrucomicrobia (4.92%), Spirochaetes (4.44%), Proteobacteria (3.44%), and Actinobacteria (0.97%). Figure 2b presents the top 20 most abundant genera. In addition to the unclassified genera (64.24%) and other genera (2.64%), the most abundant genus was Akkermansia (Verrucomicrobia), with a relative abundance of 4.77%, followed by Treponema (Spirochaetes), with a relative abundance of 4.38%. Within the Bacteroidetes phylum, 5_7N15 accounted for 4.26% of the relative abundance, CF231 accounted for 3.25%, and Bacteroides accounted for 1.48%. In the Firmicutes phylum, Oscillospira accounted for 3.19% of the relative abundance, Clostridium accounted for 3.02%, and Ruminococcus accounted for 2.04%.
In this study, the notation p__ represents phylum, c__ denotes class, o__ stands for order, f__ signifies family, and g__ indicates genus. LEfSe stands for linear discriminant analysis, and LDA stands for latent Dirichlet allocation. LEfSe analysis (LDA > 4) at the genus level, as shown in Figure 3a and the cladogram shown in Figure 3b, revealed that f_Clostridiaceae (LDA = 4.1010, p = 0.0201) and g_Clostridium (LDA = 4.0865, p = 0.0201) were significantly more abundant in the P_3 group. Clostridium species are often linked to butyrate production, reflecting niche-specific functions in this group.
In the P_1 group, p__Verrucomicrobia (LDA = 4.5658, p = 0.0081), c__Verrucomicrobiae (LDA = 4.5658, p = 0.0093), o__Verrucomicrobiales (LDA = 4.5658, p = 0.0093), f__Verrucomicrobiaceae (LDA = 4.5658, p = 0.0093), and g__Akkermansia (LDA = 4.5658, p = 0.0093) were more abundant than in the other groups. Akkermansia is strongly associated with gut barrier integrity and metabolic health. The dominance here suggests that lactating camels with 1st parity may present enhanced mucosal protection.
In the P_5 group, o__Bacteroidales (LDA = 4.6282, p = 0.0008), f__Bacteroidaceae (LDA = 4.0829, p = 0.0003), and its two genera, g__BF311 (LDA = 4.0829, p = 0.0003) and g_Bacteroides (LDA = 4.0945, p = 0.0006), as well as f__Paraprevotellaceae (LDA = 4.4450, p = 0.0065) and its two genera, g__CF231 (LDA = 4.1776, p = 0.0231) and g__YRC22 (LDA = 4.1146, p = 0.0060), were significantly more abundant than those in the other groups. Bacteroides and Ruminococcaceae are key degraders of dietary fiber, producing short-chain fatty acids (SCFAs). Furthermore, f__Ruminococcaceae (LDA = 4.3818, p = 0.0013) and its two genera, g__Ruminococcus (LDA = 4.0251, p = 0.0159) and g__Oscillospira (LDA = 4.1349, p = 0.0019), were significantly more abundant in the P_5 group than in the other groups. Oscillospira is often linked to lean phenotypes, suggesting potential metabolic benefits in lactating camels with a 5th parity.
As presented in Table 4, there were no significant differences in Faith’s phylogenetic diversity (faith_pd) or OTUs among the P_1, P_3, and P_5 groups. Unlike the Shannon index, faith_pd accounts for the evolutionary history of taxa, for which a higher value indicates greater phylogenetic diversity.
However, the Shannon_entropy index was significantly different between the P_1 group and either the P_3 or P_5 group (p = 0.015). Additionally, Simpson’s diversity index was significantly different between the P_1 group and the P_5 group (p = 0.023).
As shown in Figure 4, 3D principal coordinate analysis (PCoA) based on weighted UniFrac revealed that the overall microbial communities of the P_1, P_3, and P_5 groups were clustered together. PCoA axis 1 accounted for 28.73% of the variation, PCoA axis 2 accounted for 16.28% of the variation, and PCoA axis 3 accounted for 15.63% of the variation.PCoA Axis description confusing: revise “”.

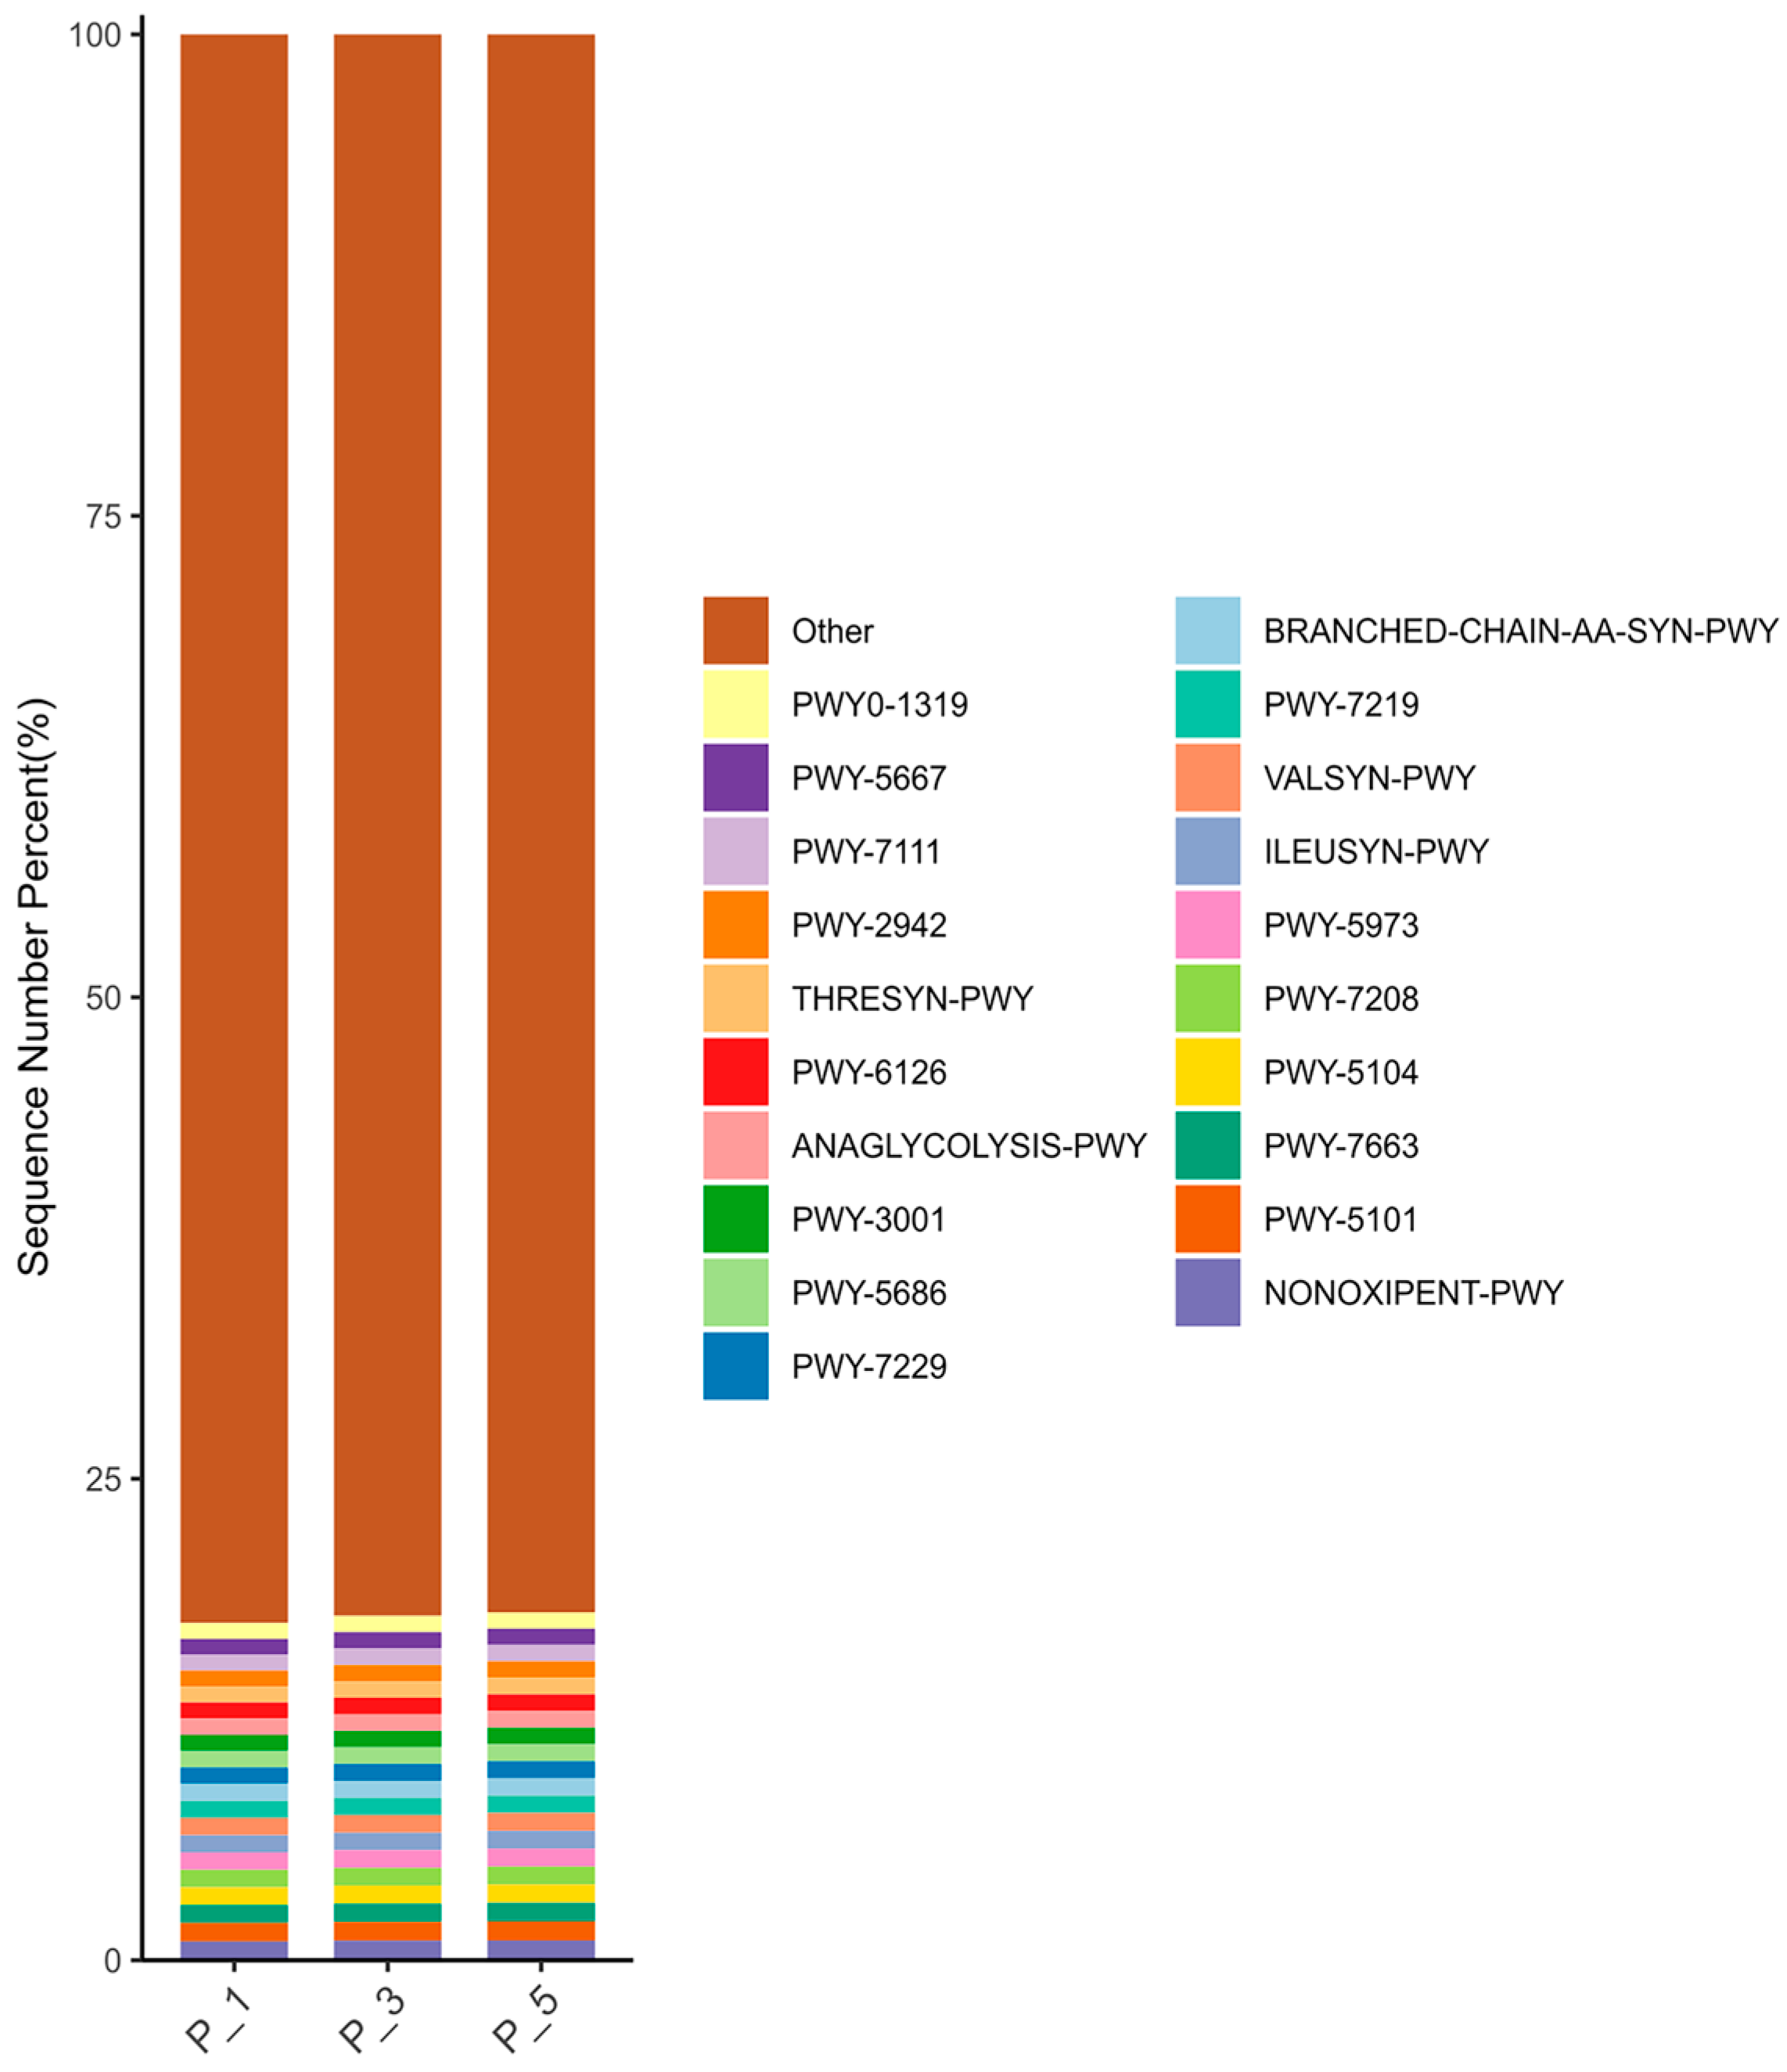
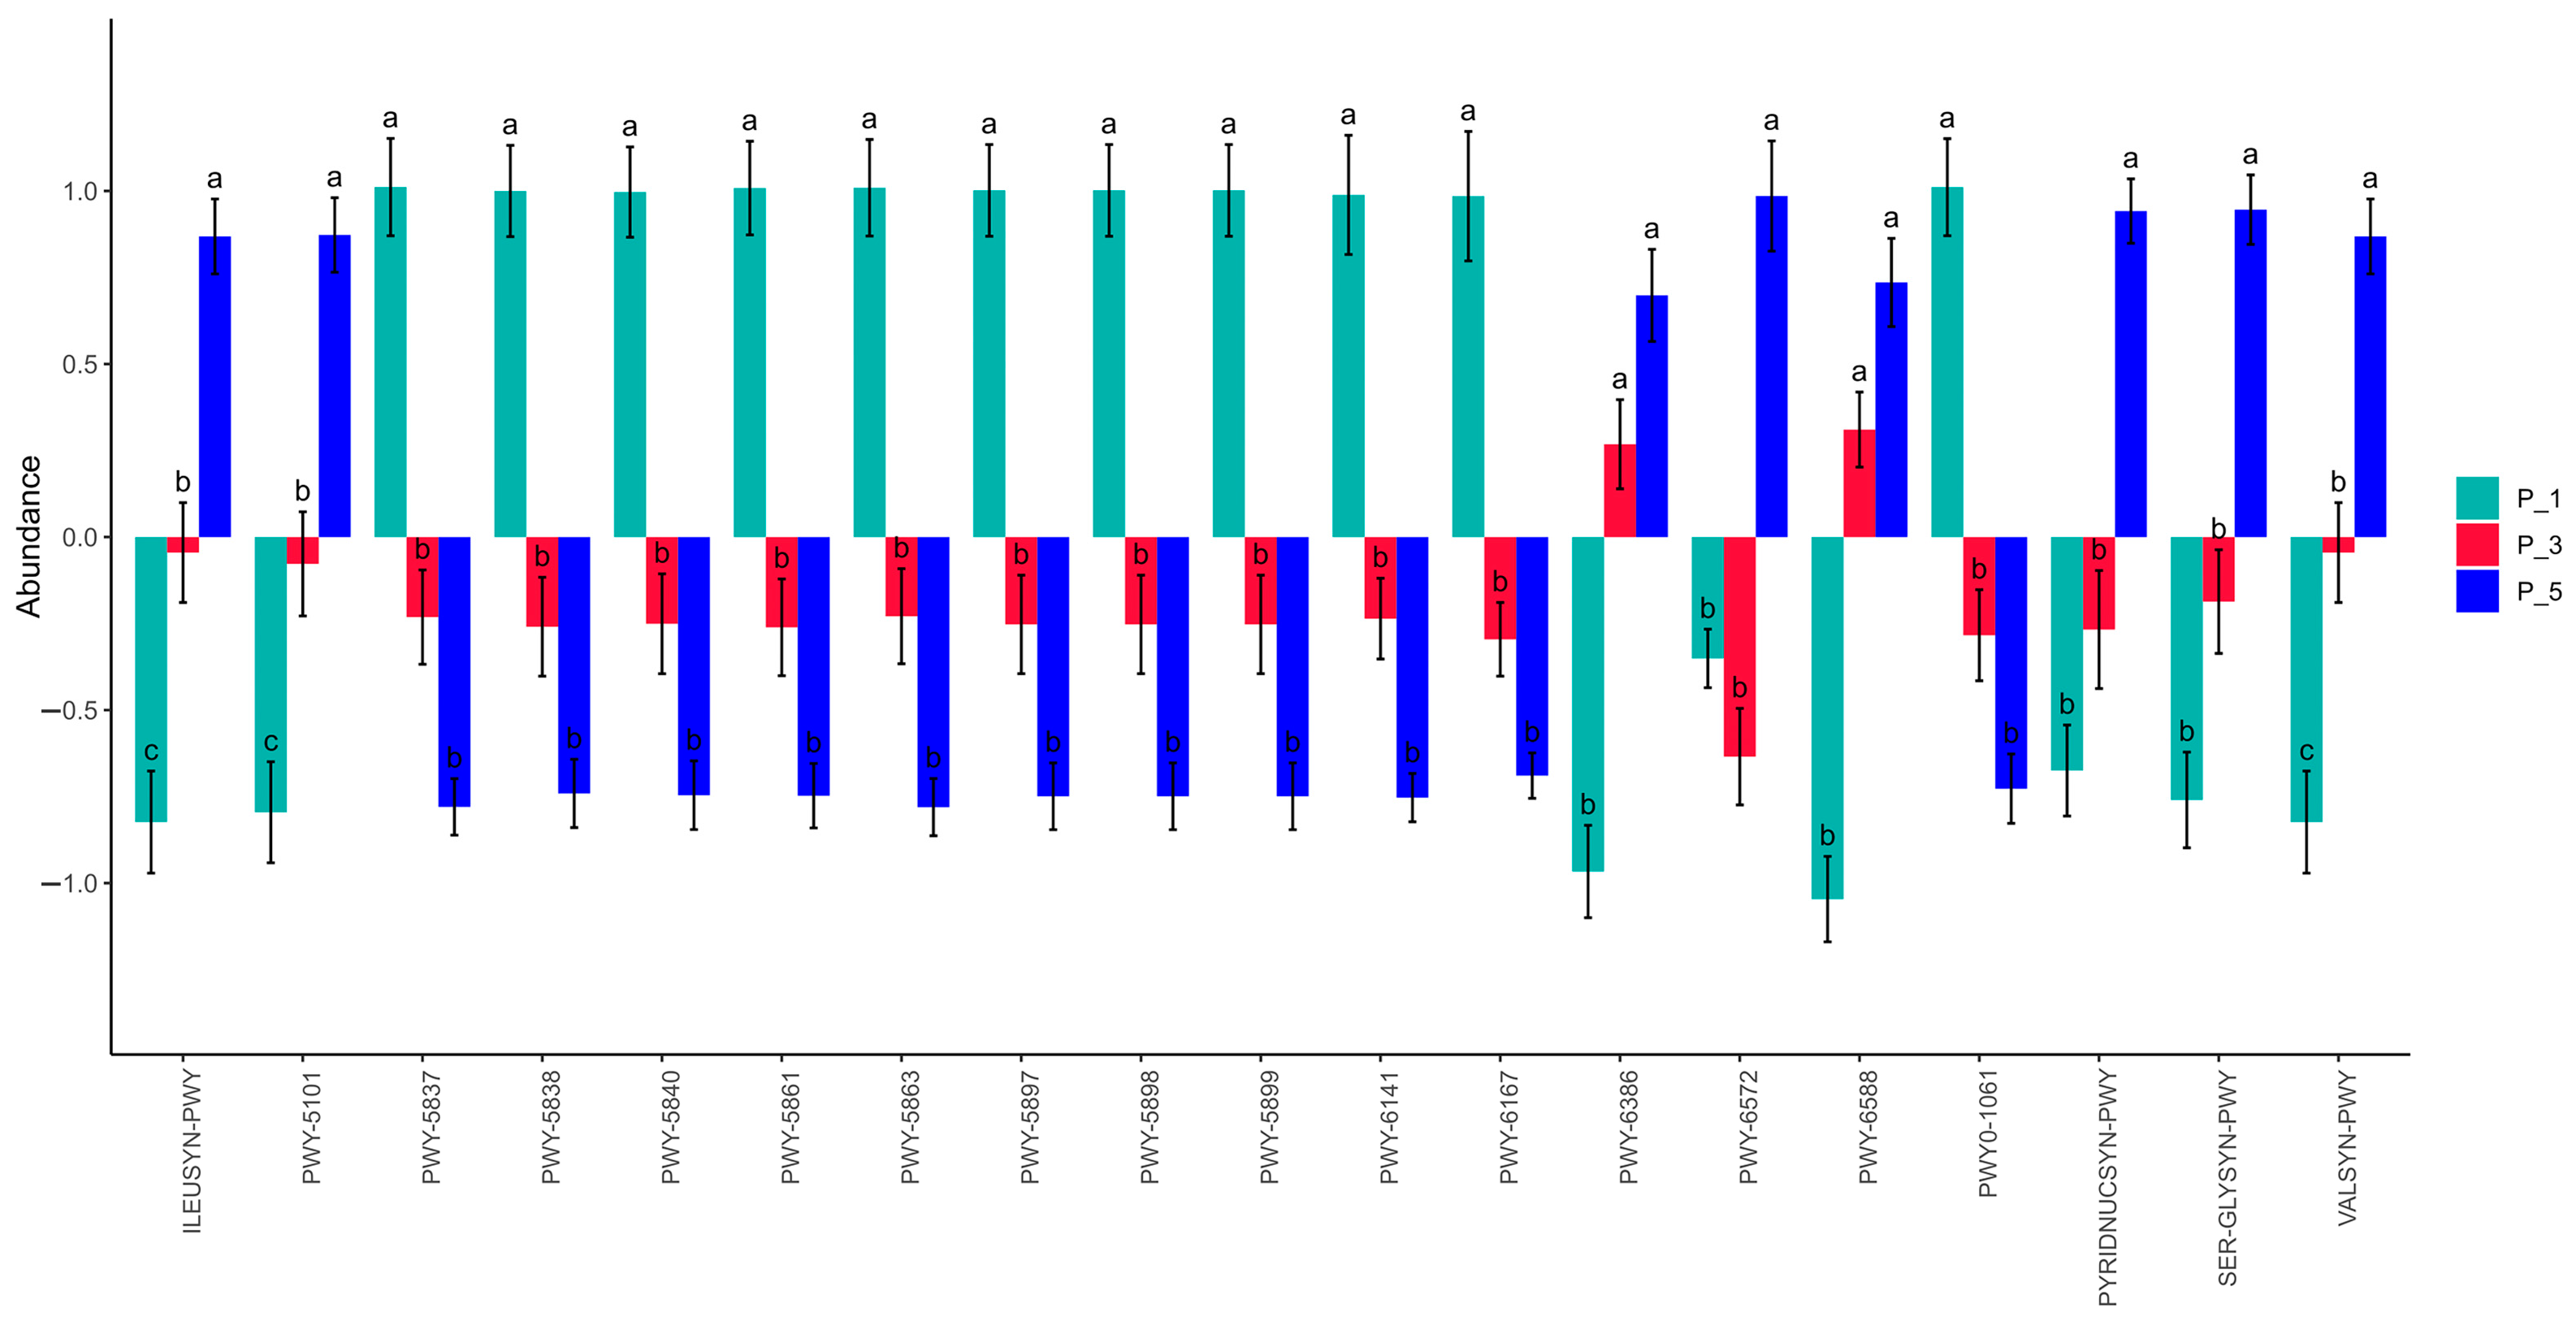
3.3. Dynamics of MetaCyc Pathways in Lactating Camel Feces

As depicted in Figure 5, NONOXIPENT-PWY had the highest relative abundance of metabolic pathways, accounting for 1.01% of the total. The MetaCyc pathways with relative abundances greater than 0.9% were PWY-5101, PWY-7663, PWY-5104, PWY-7208, PWY-5973, ILEUSYN-PWY, VALSYN-PWY, and PWY-7219. The relative abundances of MetaCyc pathways greater than 0.8% were BRANCHED-CHAIN-AA-SYN-PWY, PWY-7229, PWY-5686, PWY-3001, ANAGLYCOLYSIS-PWY, PWY-6126, THRESYN-PWY, PWY-2942, PWY-7111, PWY-5667, and PWY0-1319.
As depicted in Figure 6, the relative abundances of PWY-5837 (p = 0.0003), PWY-5840 (p = 0.0003), PWY-5838 (p = 0.0003), PWY-5863 (p = 0.0003), PWY-5861 (p = 0.0004), PWY-5897 (p = 0.0004), PWY-5898 (p = 0.0004), PWY-5899 (p = 0.0004), PWY-6141 (p = 0.0002), PWY-6167 (p = 0.0002), and PWY0-1061 (p = 0.0007) were significantly greater in the P_1 group than in the other groups. On the other hand, the relative abundances of VALSYN-PWY (p = 0.0013), SER-GLYSYN-PWY (p = 0.0004), PYRIDNUCSYN-PWY (p = 0.0006), PWY-6572 (p = 0.0014), PWY-5104 (p = 0.0014), and ILEUSYN-PWY (p = 0.0013) were significantly greater in the P_5 group than in the other groups.
However, Figure 7 shows that most of the samples clustered within the circle representing the P_1 group, with only two samples scattered outside. PCA 1 accounted for 32.79% of the variation, and PCA 2 accounted for 17.95% of the variation.

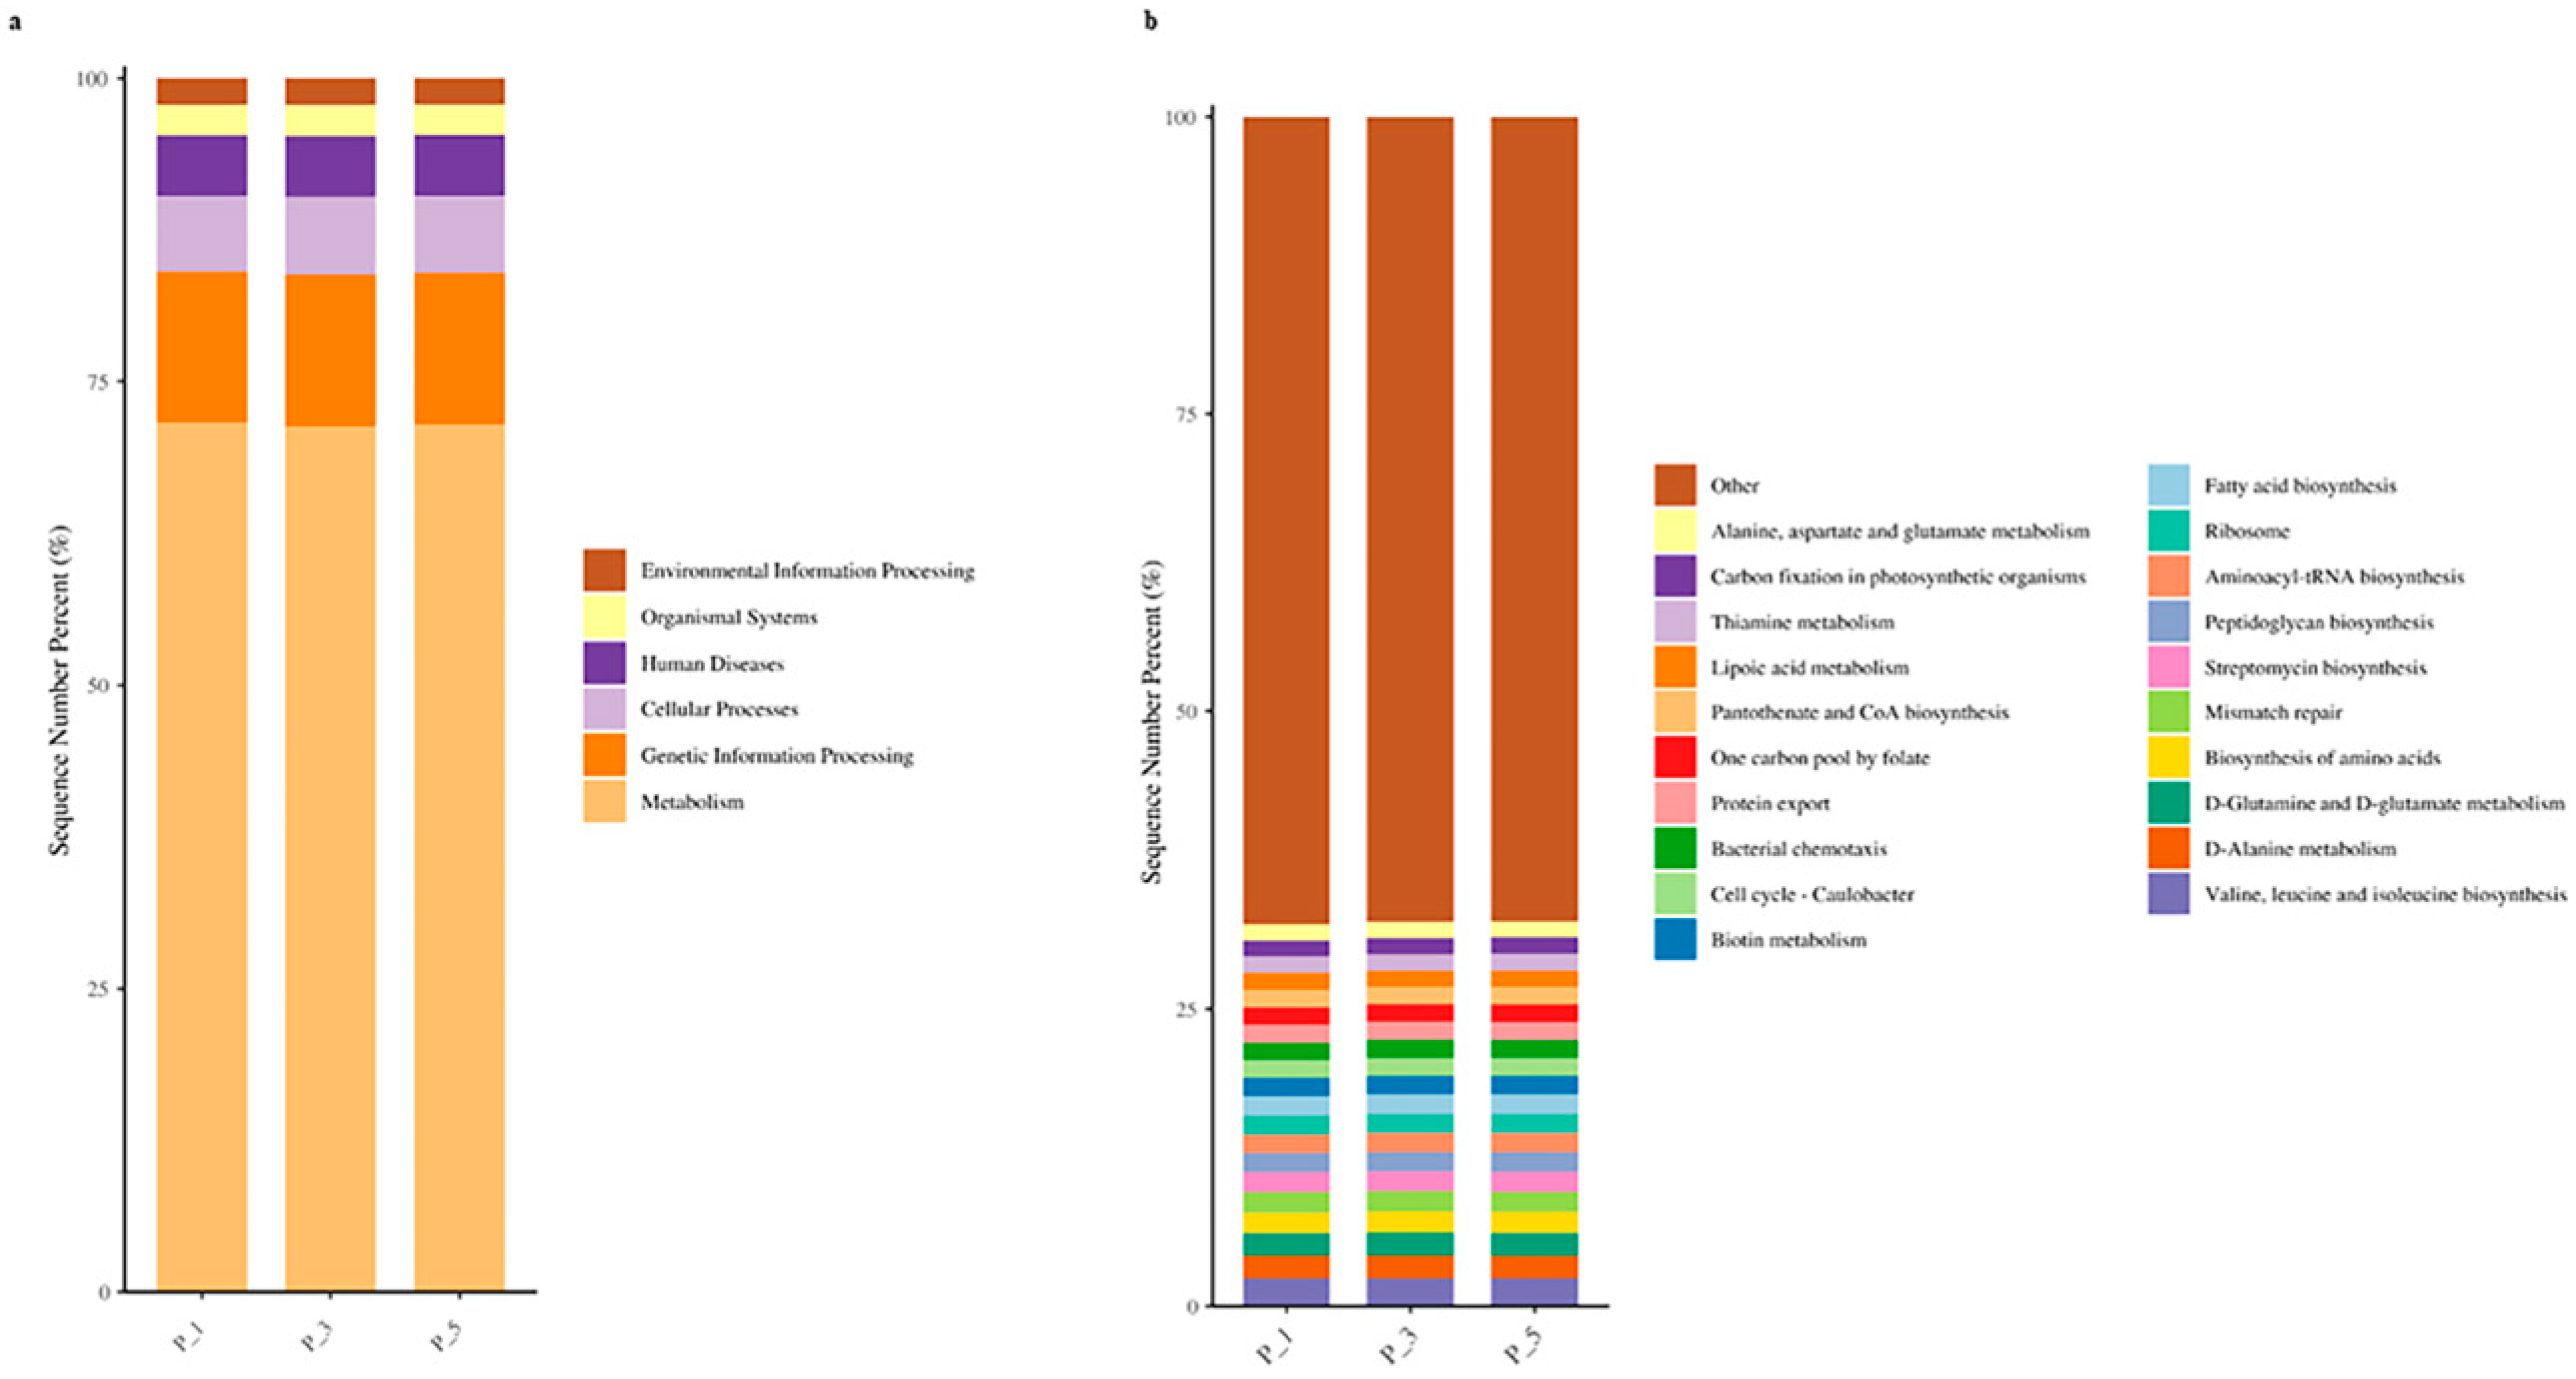
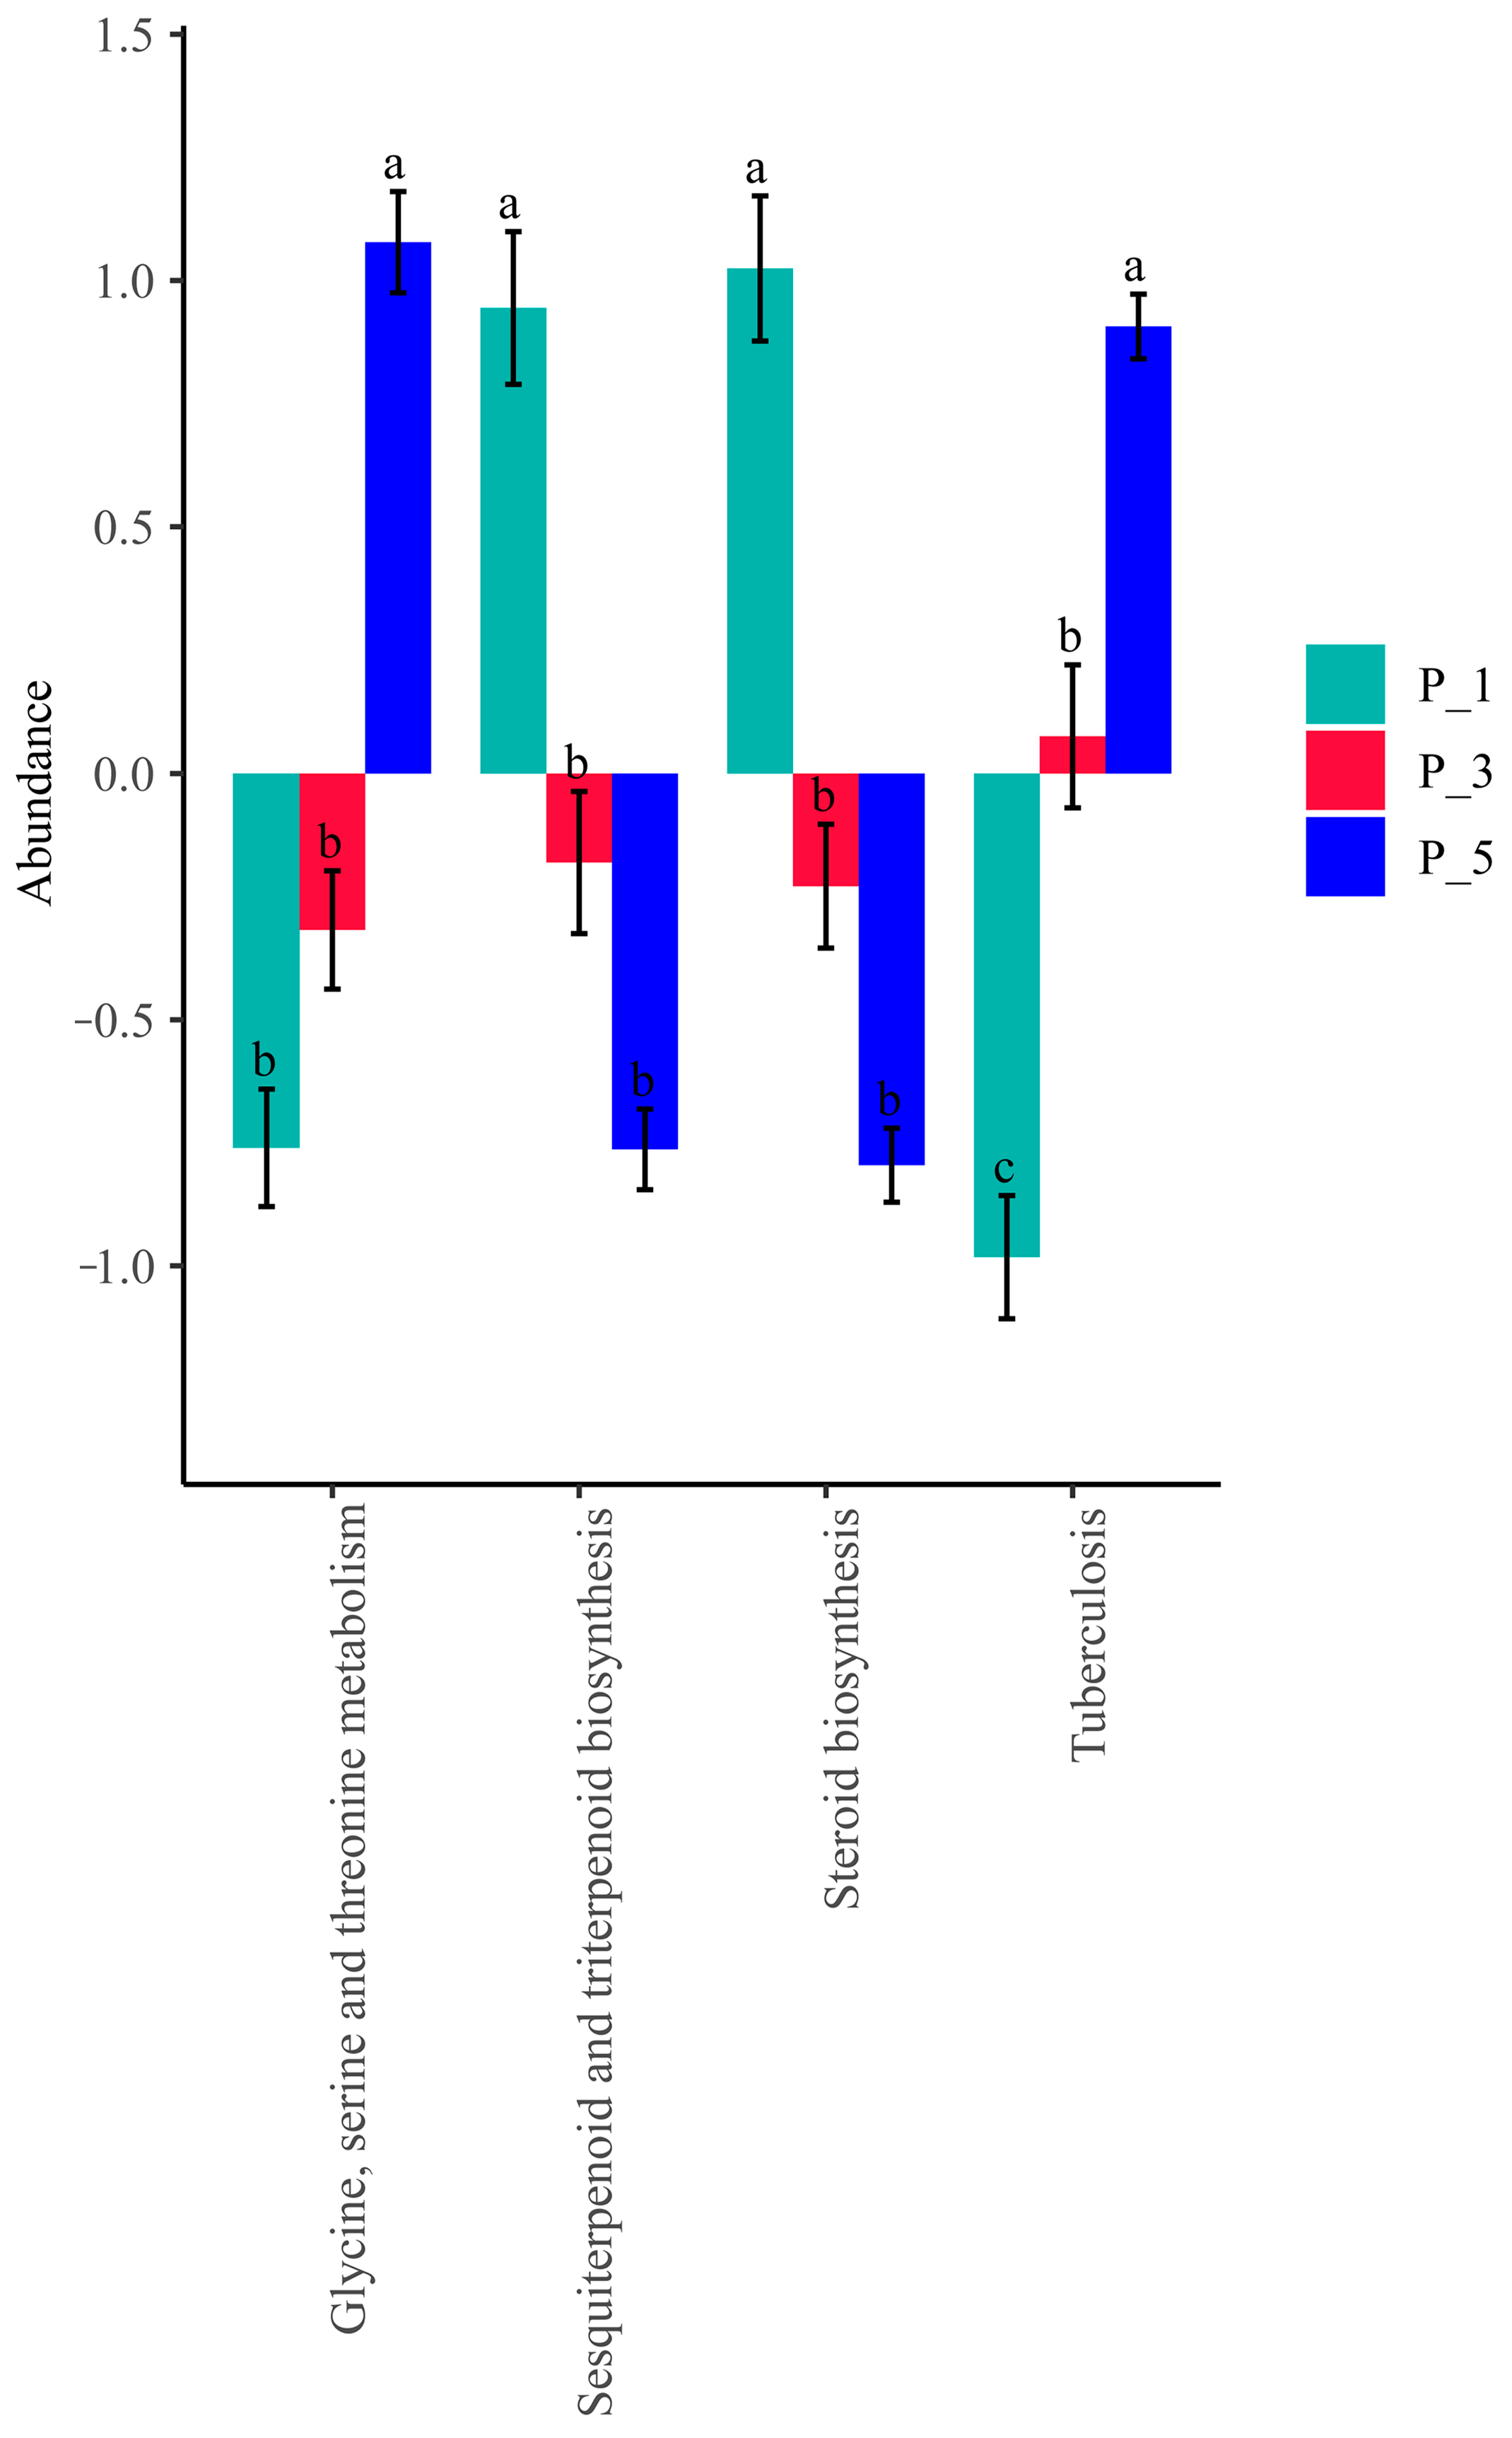
3.4. Dynamics of the KEGG Pathways in the Lactating Camel Feces

As depicted in Figure 8a, at KEGG level 1, the relative abundance of metabolic pathways was highest, accounting for 71.44% of the total. Genetic information processing accounted for 12.46%, cellular processes accounted for 6.40%, human diseases accounted for 5.00%, organismal systems accounted for 2.53%, and environmental information processing accounted for 2.16%. At KEGG level 3, there were a total of 365 pathways. Figure 8b displays the top 20 pathways, with valine, leucine, and isoleucine biosynthesis being the most abundant at 2.34%, followed by D-alanine metabolism at 1.90%, D-glutamine and D-glutamate metabolism at 1.90%, biosynthesis of amino acids at 1.75%, and mismatch repair at 1.72%.
Figure 9 shows that the relative abundance of the steroid biosynthesis pathway was significantly greater in the P_1 group than in the other groups (p = 0.0014). Similarly, the pathway of sesquiterpenoid and triterpenoid biosynthesis was more abundant in the P_1 group (p = 0.016).
On the other hand, the relative abundance of the glycine, serine, and threonine metabolism pathways was significantly greater in the P_5 group than in the other groups (p = 0.0004), as was the tuberculosis pathway (p = 0.00072) in feces.
However, Figure 10 shows that most of the samples clustered within the circle representing the P_1 group, with only four samples scattered outside. The horizontal axis represents PC1 (principal component 1), which explains 46.46% of the differences among samples, whereas the vertical axis represents PC2 (principal component 2), which contributes 15.97% of the differences among samples.

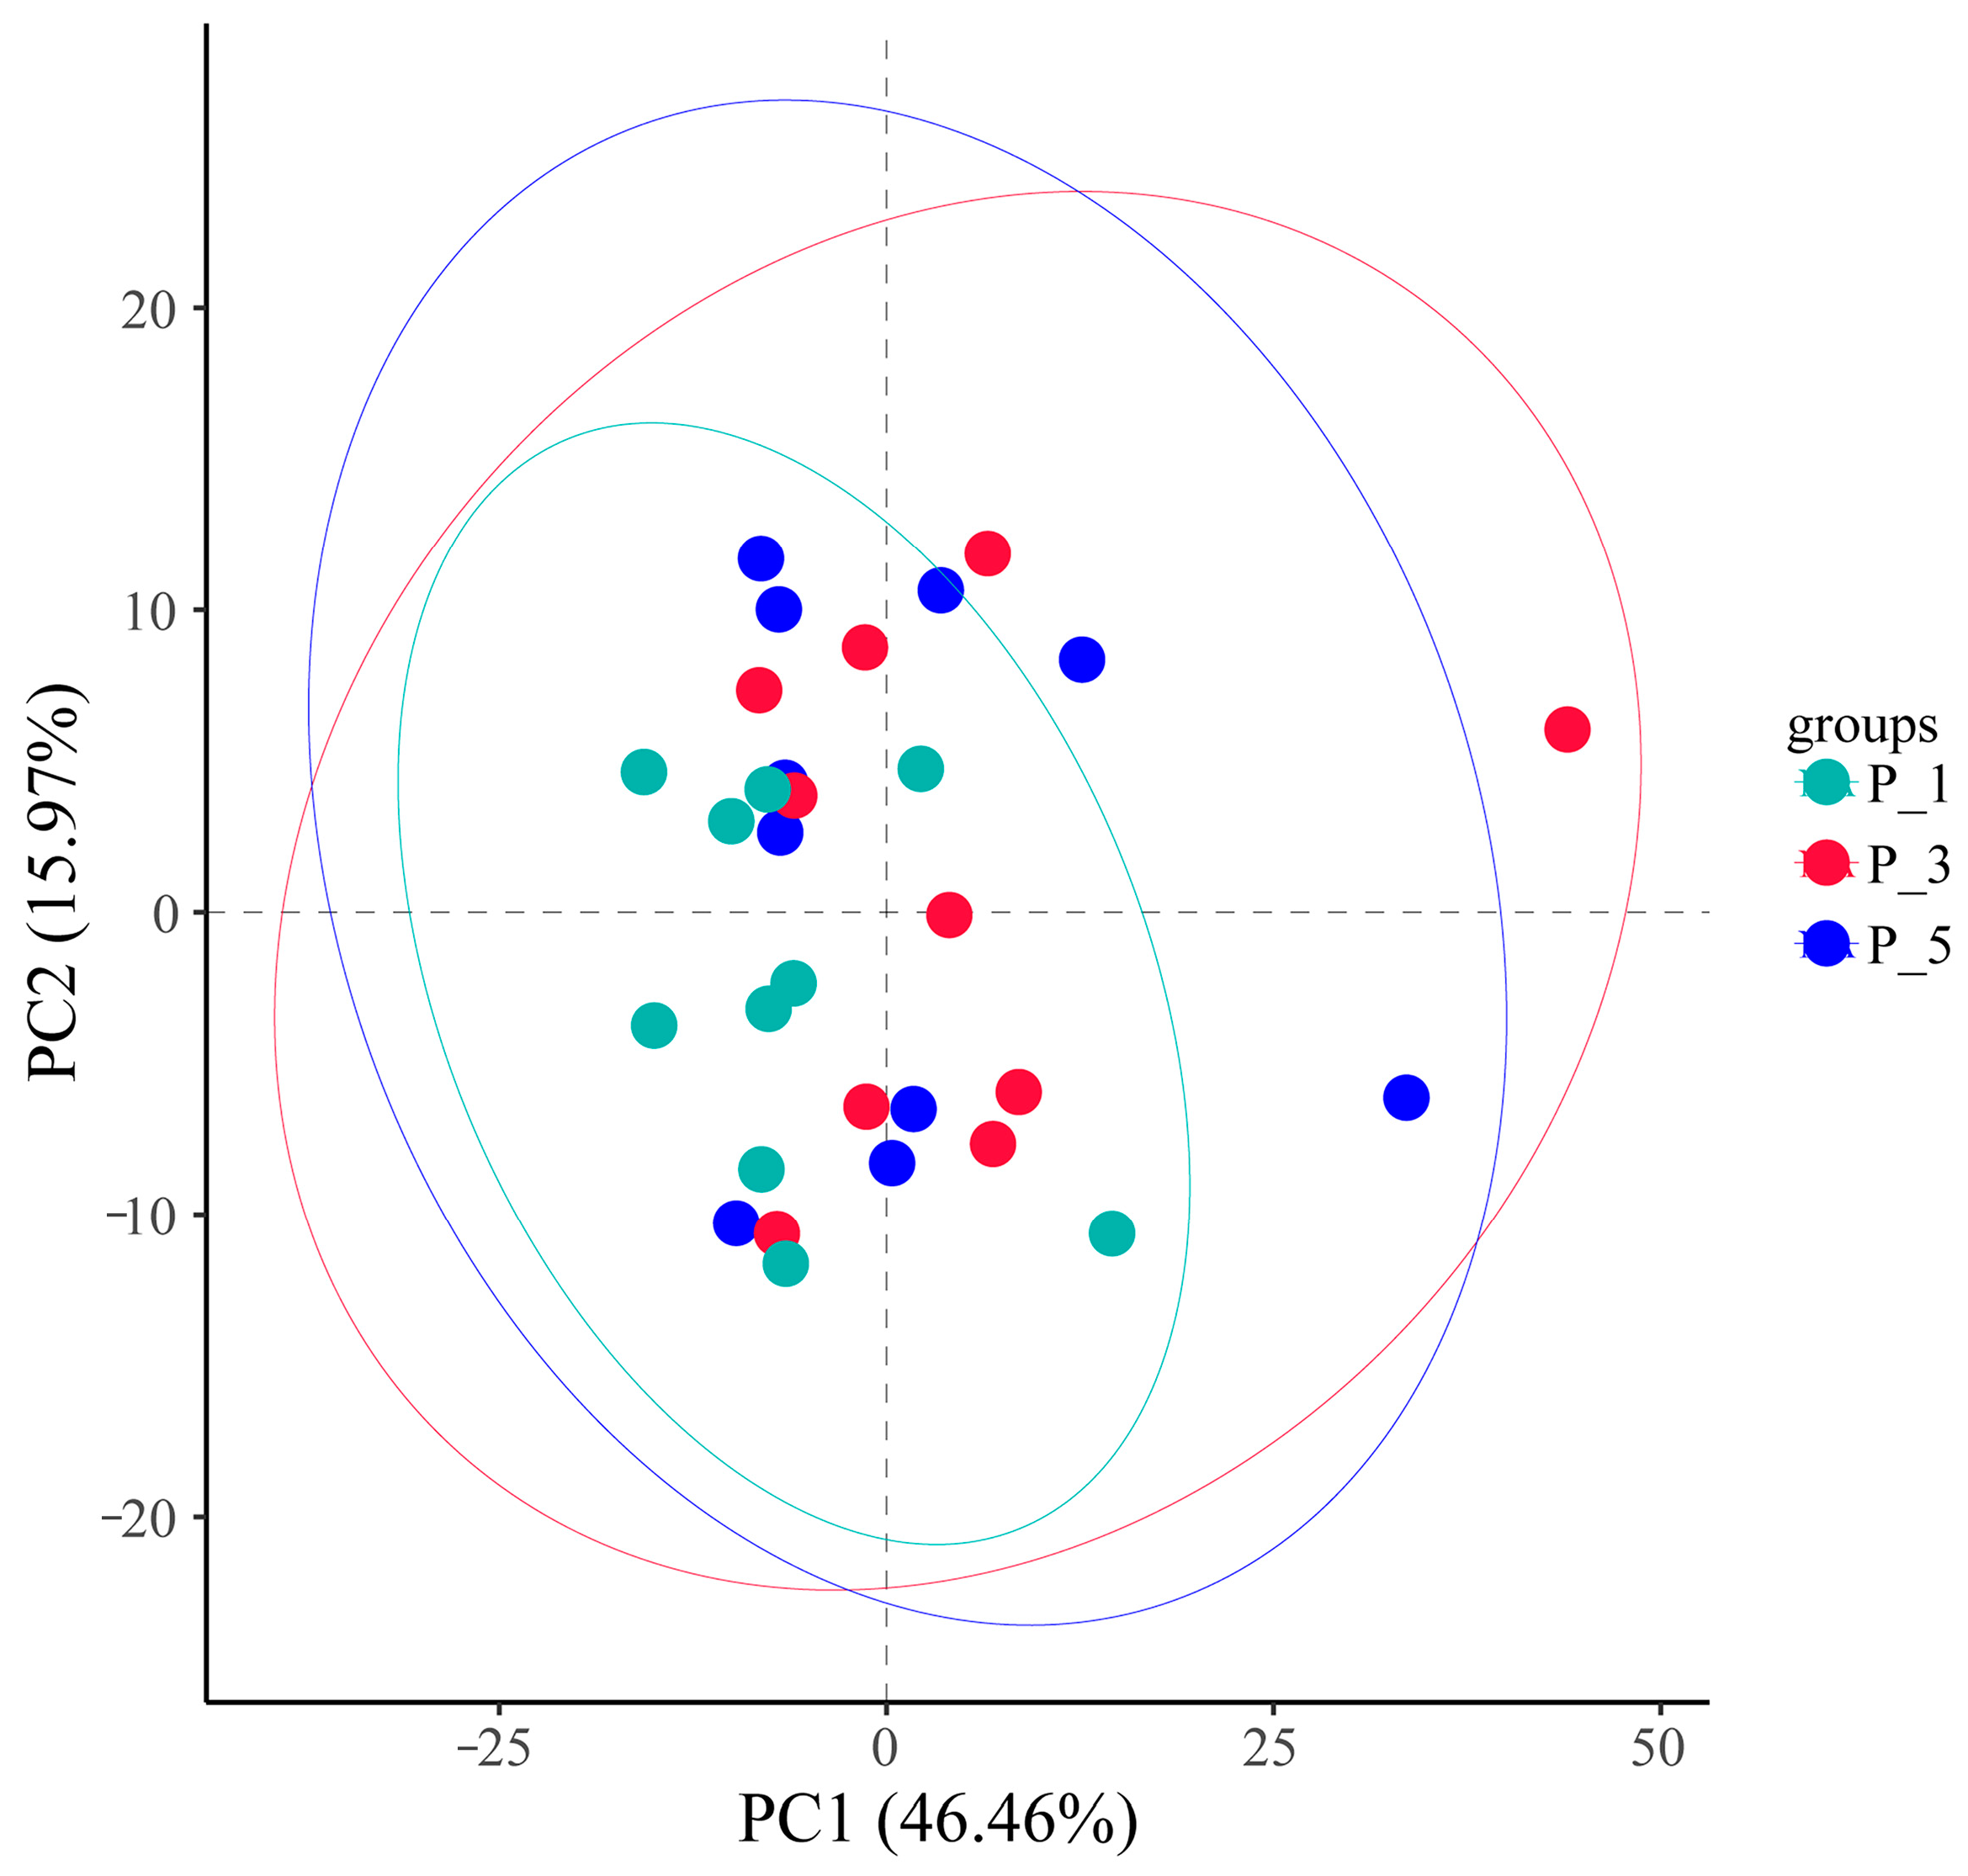
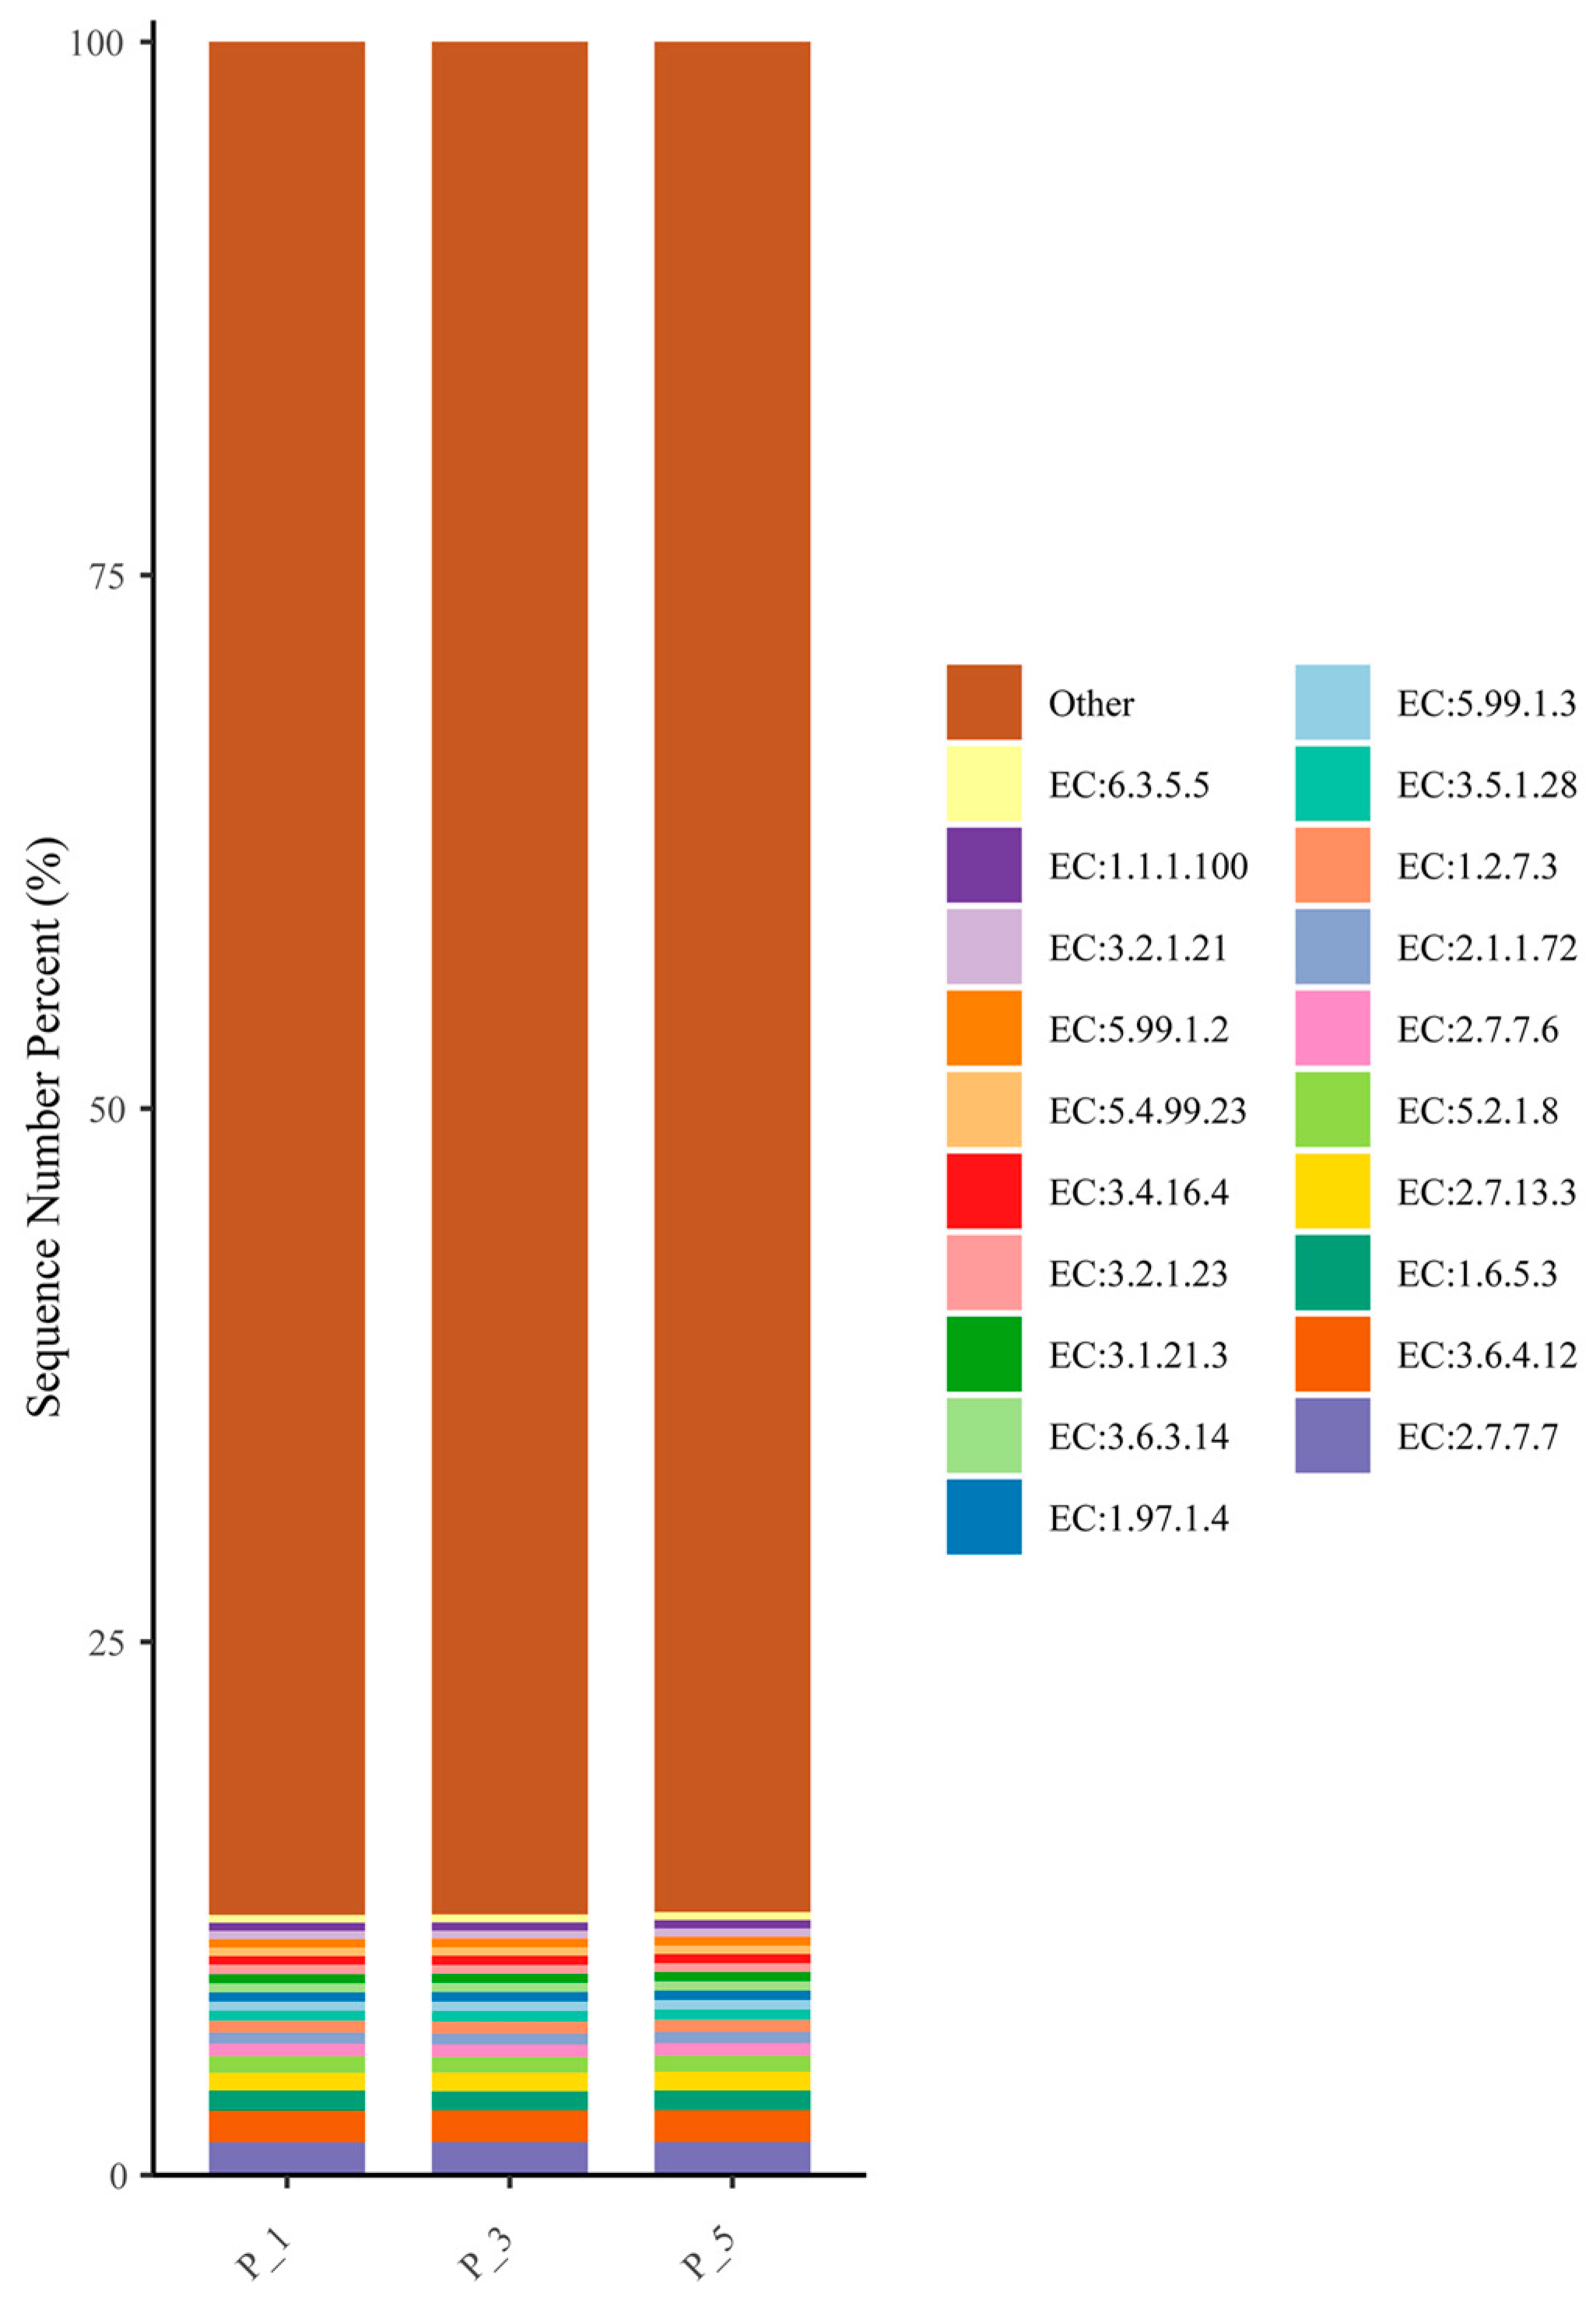
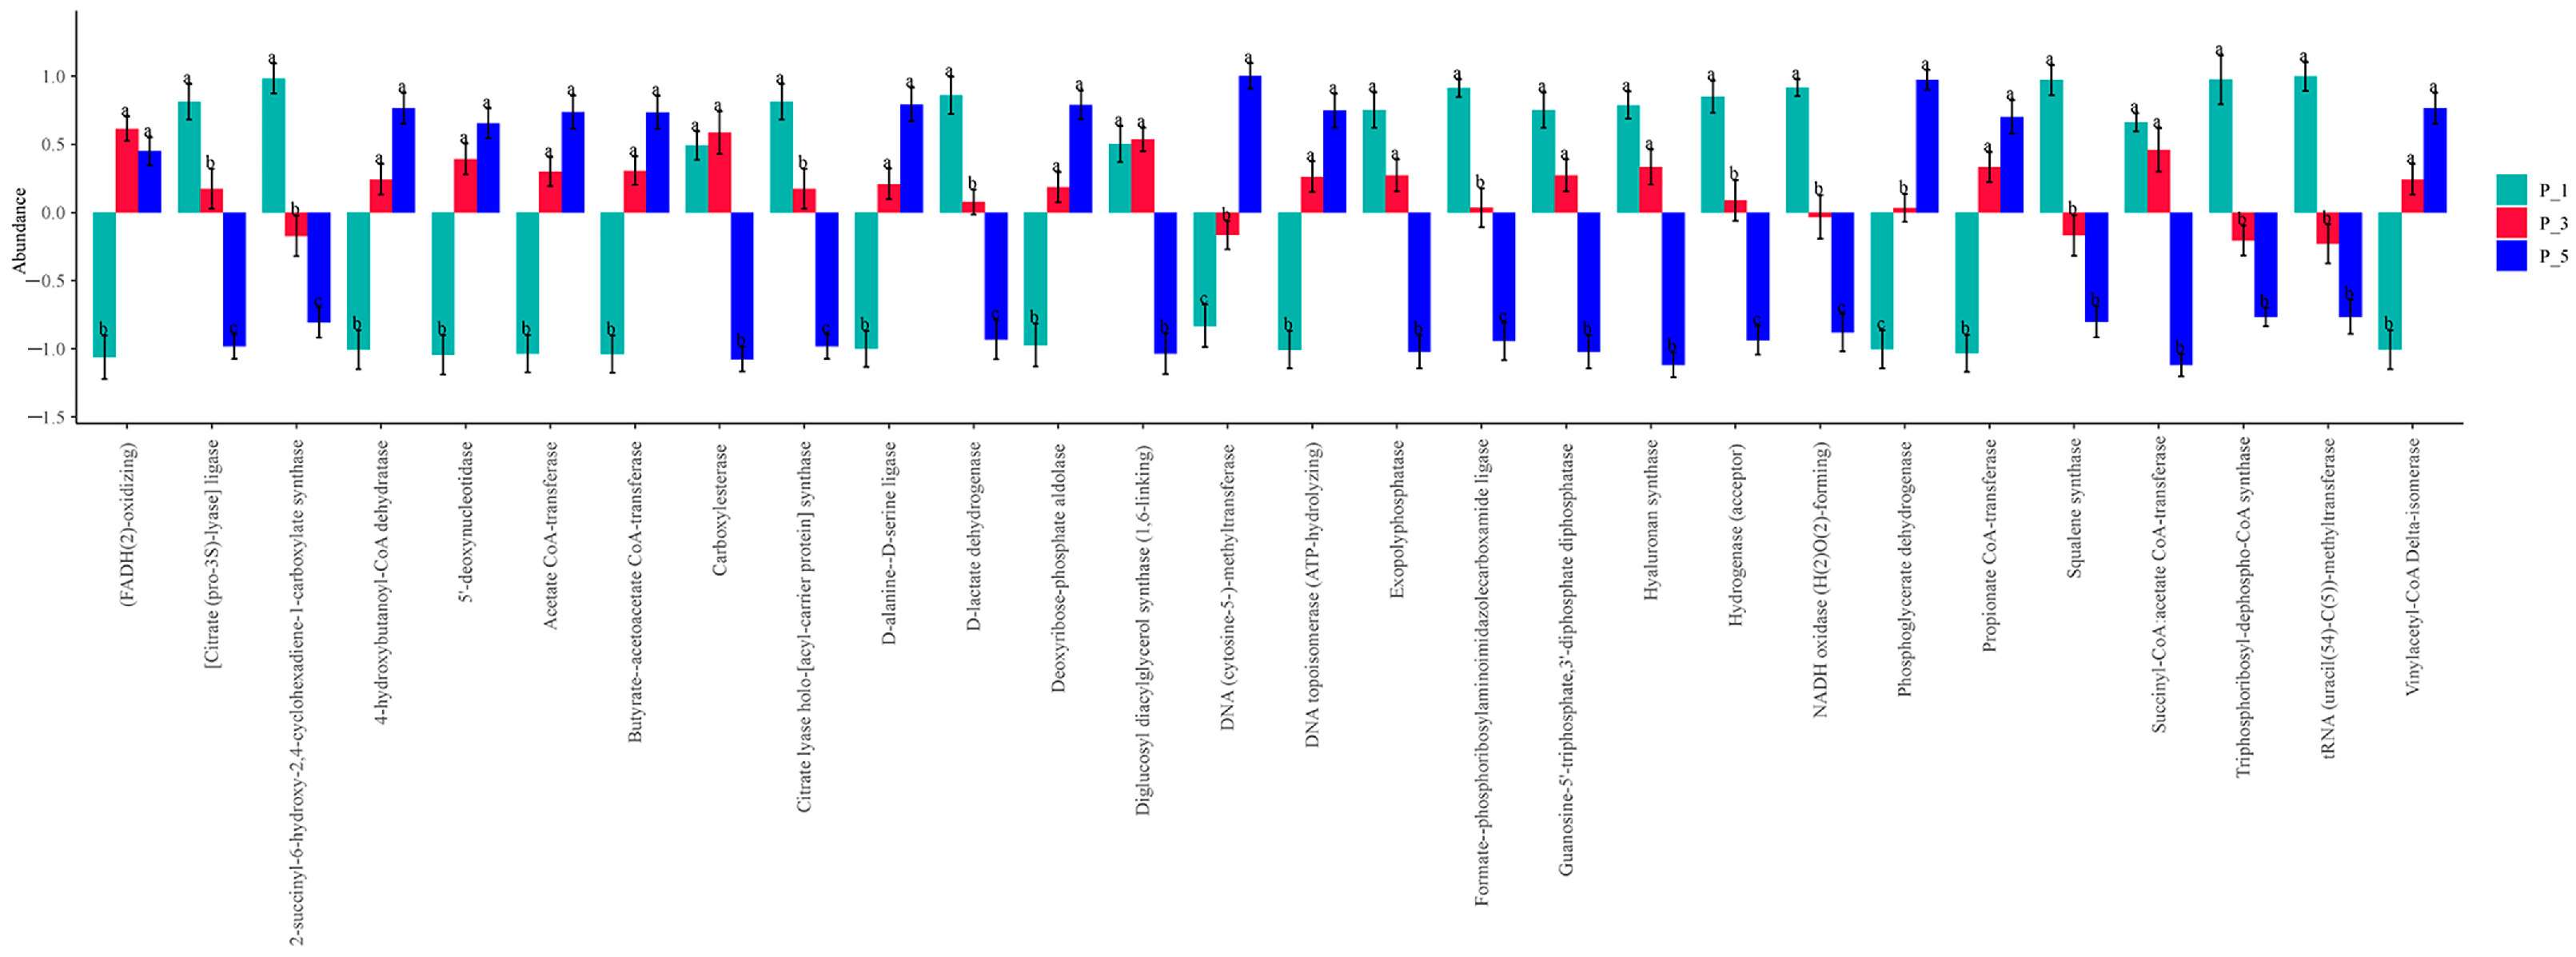
3.5. Dynamics of ECs in Lactating Camel Feces

As depicted in Figure 11, the top 20 relatively abundant ECs were as follows: EC:2.7.7.7 (DNA-directed DNA polymerase) 1.54%, EC:3.6.4.12 (DNA helicase) 1.51%, EC:1.6.5.3 (NADH:ubiquinone reductase (H(+)-translocating)) 0.90%, EC:2.7.13.3 (histidine kinase) 0.87%, and EC:5.2.1.8 (peptidylprolyl isomerase) 0.75%.
As shown in Figure 12, the relative abundances of [citrate (pro-3S)-lyase] ligase (EC:6.2.1.22), 2-succinyl-6-hydroxy-2,4-cyclohexadiene-1-carboxylate synthase (EC:4.2.99.20), citrate lyase holo-[acyl-carrier protein] synthase (EC:2.7.7.61), D-lactate dehydrogenase (EC:1.1.28), formate-phosphoribosylaminoimidazolecarboxamide ligase (EC:6.3.4.23), hydrogenase (acceptor) (EC:1.12.99.6), and NADH oxidase (H2O2-forming) (EC:1.6.3.3) were significantly greater in the feces of P_1 than in those of the other groups. The relative abundances of DNA (cytosine-5-)-methyltransferase (EC:2.1.1.37) and phosphoglycerate dehydrogenase (EC:1.1.95) were significantly greater in the feces of P_5 than in those of the other groups. There were 10 kinds of ECs in the P_3 or P_5 group that were greater than those in the P_1 group, whereas 5 kinds of ECs in the P_3 or P_1 group were greater than those in the P_5 group.
However, Figure 13 shows that most of the samples clustered within the circle representing the P_1 group, with the exception of four samples. The horizontal axis represents PC1 (principal component 1), which contributes 26.65% of the differences among samples, whereas the vertical axis represents PC2 (principal component 2), which contributes 15.65% of the differences among samples.

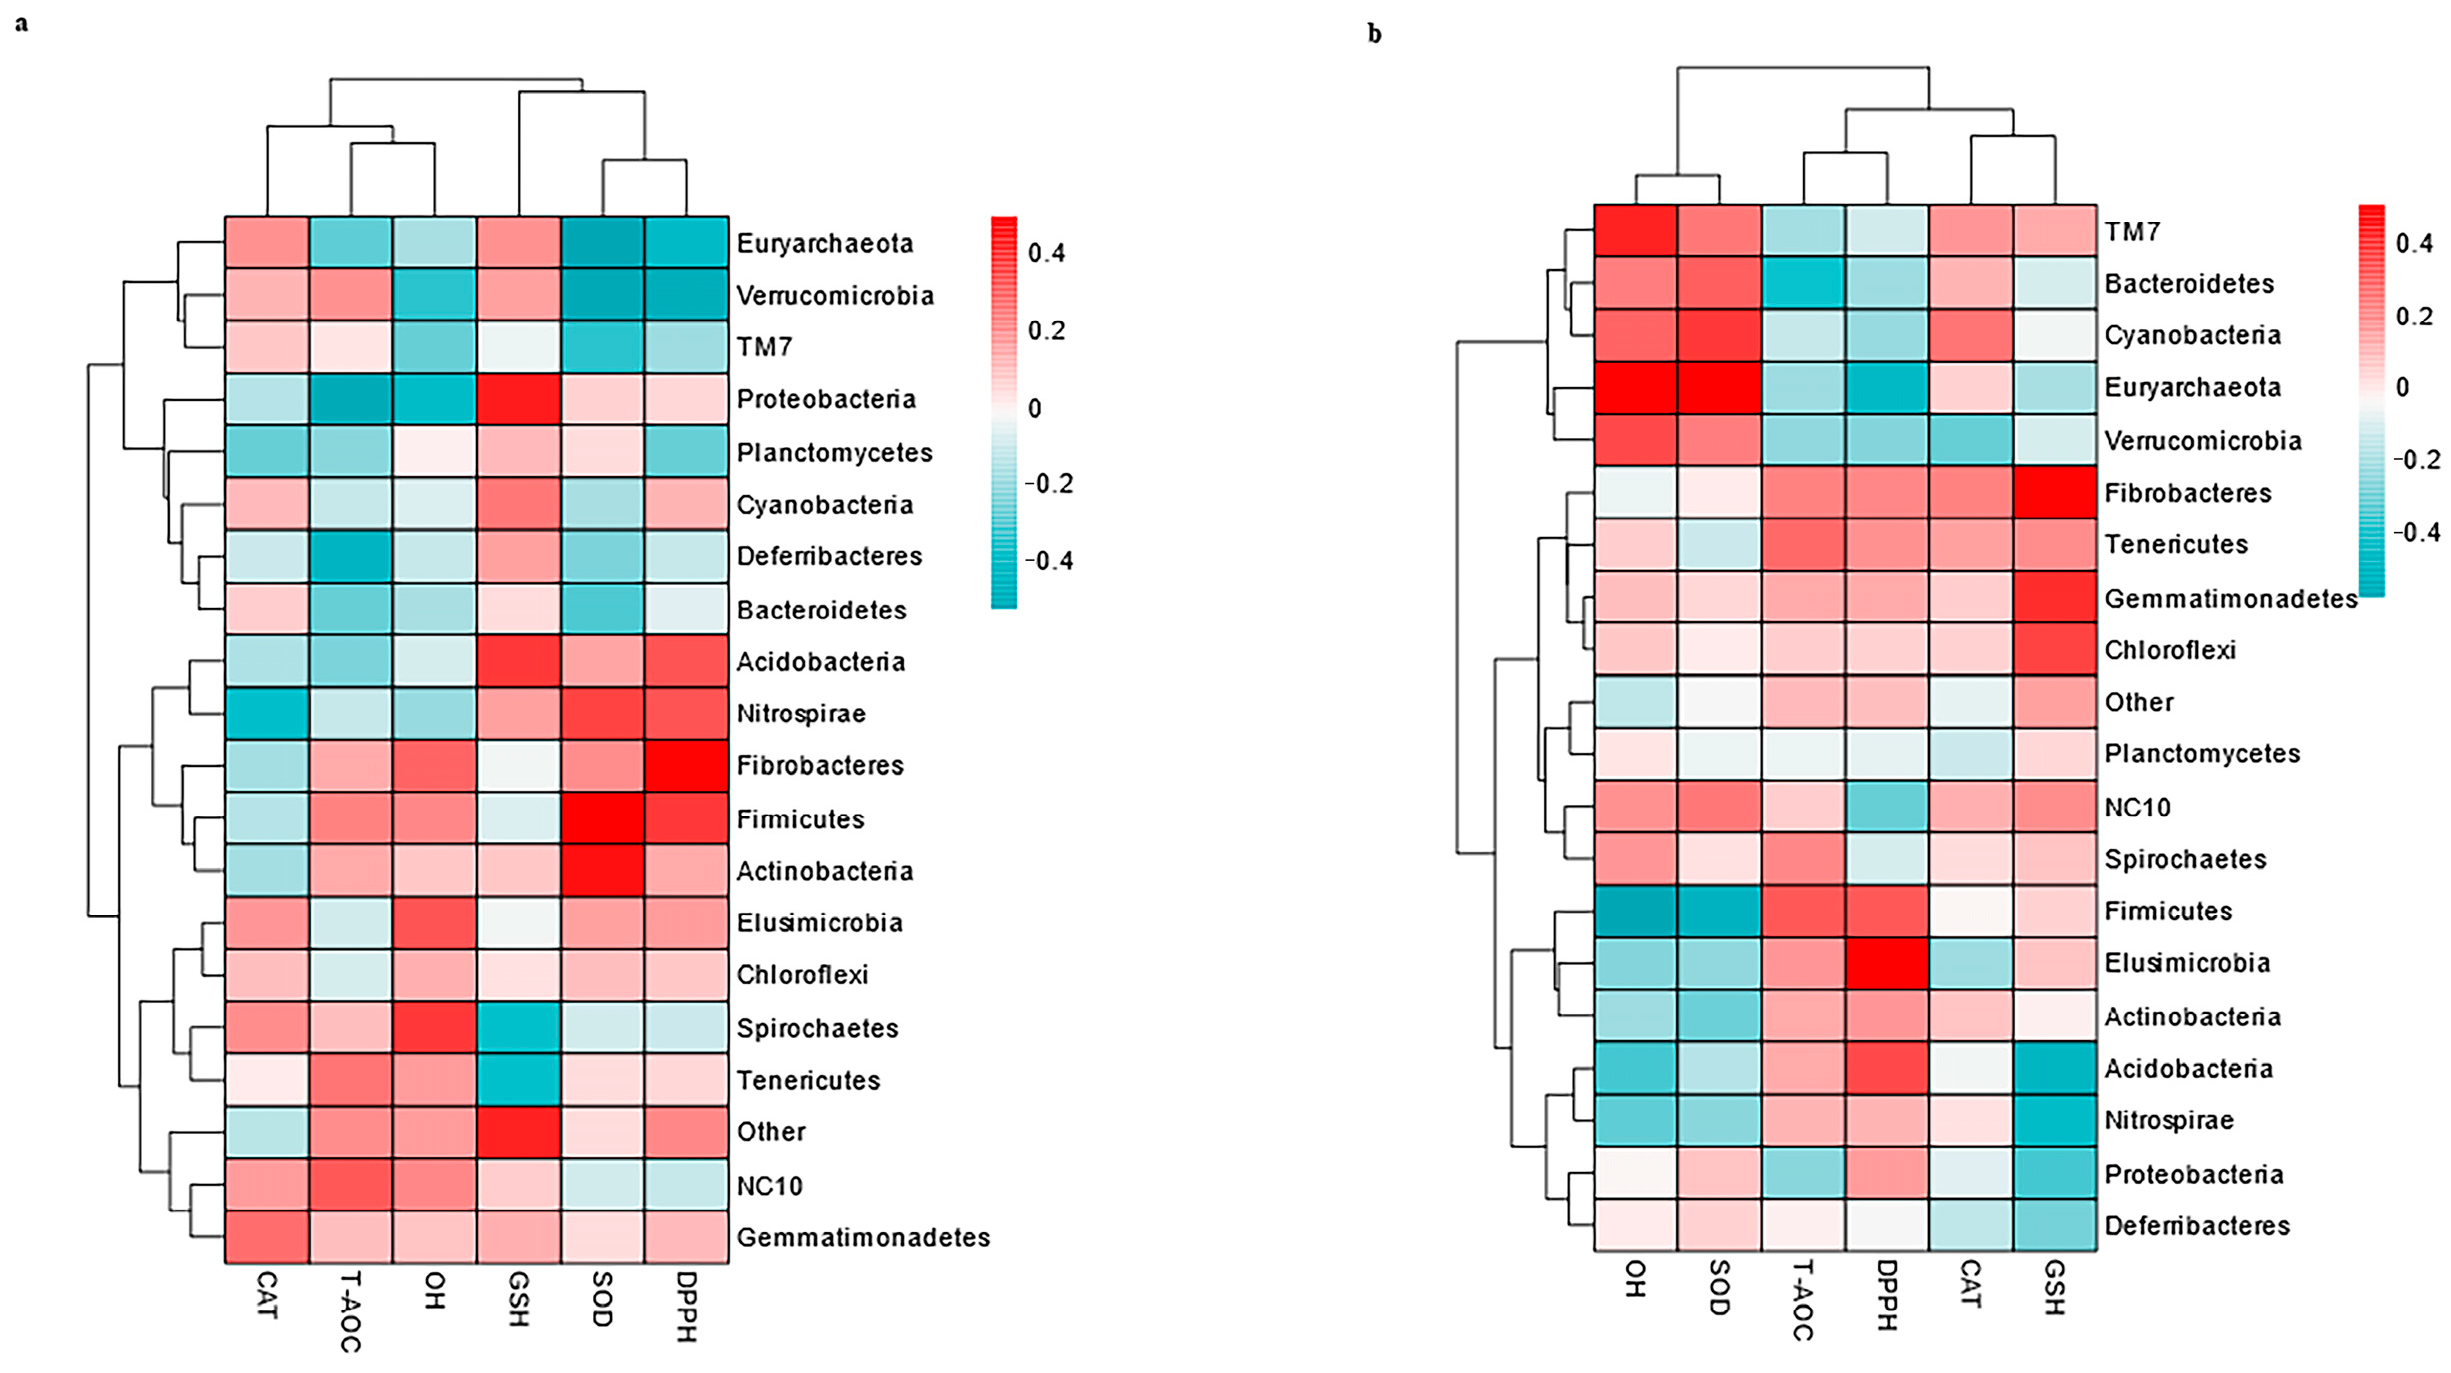
3.6. Correlation Between the Top 20 Genera and Antioxidants in Milk and Serum

As depicted in Figure 14, no genera significantly correlated with the antioxidants in milk and serum.

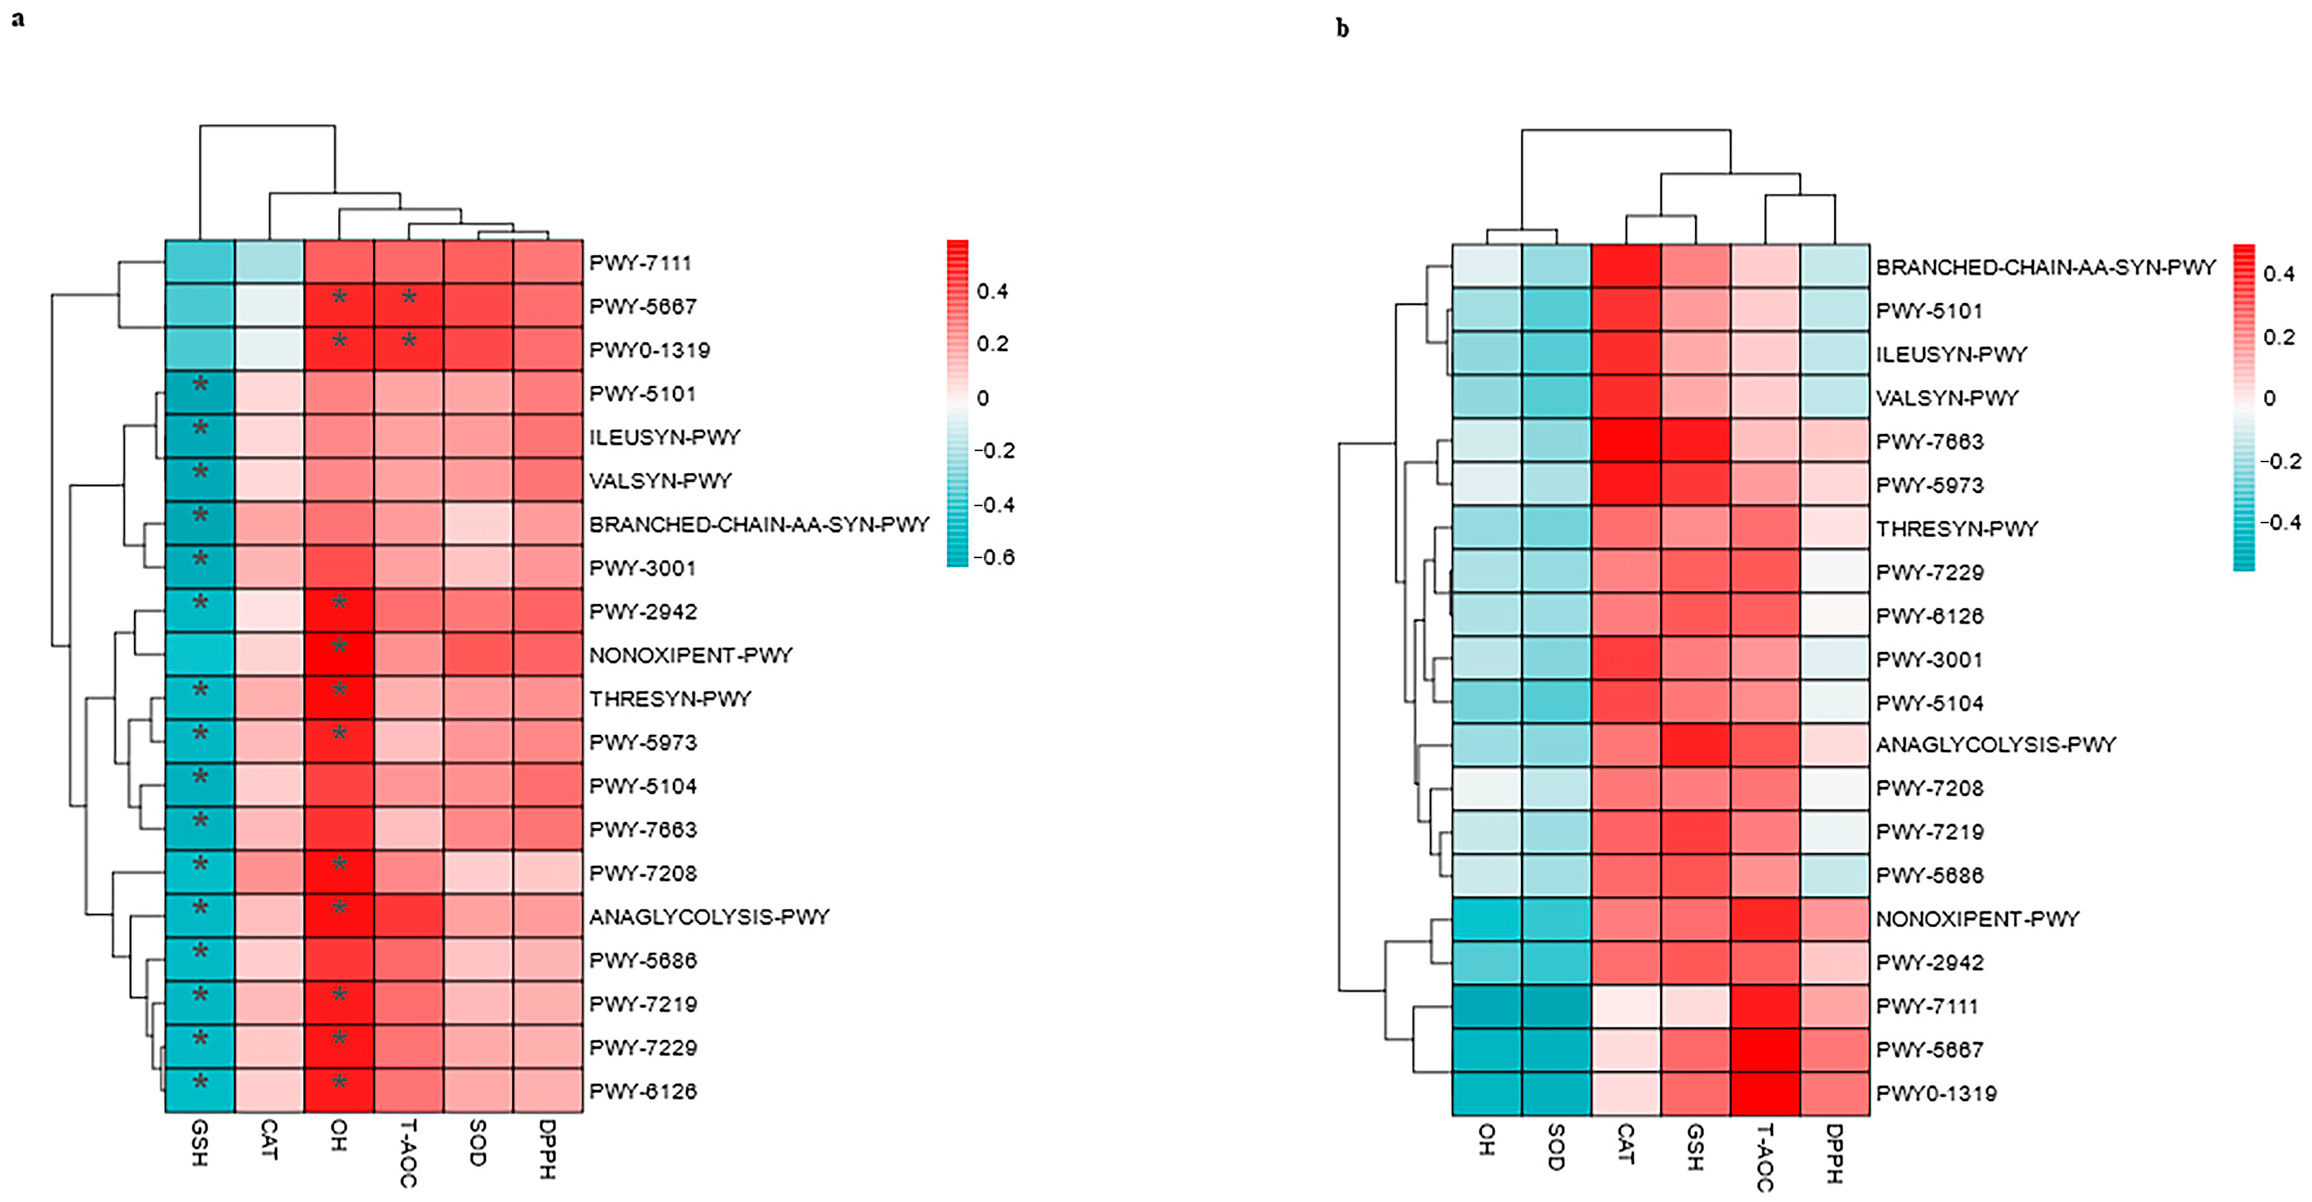
3.7. Correlations Between the Top 20 MetaCyc and Antioxidants in Milk and in Serum

As depicted in Figure 15b, there was no significant correlation with the antioxidants in the serum. As depicted in Figure 15a, OH was significantly correlated with NONOXIPENT-PWY (pentose phosphate pathway (PPP), r = 0.5894, p = 0.0171) and ANAGLYCOLYSIS-PWY (r = 0.5247, p = 0.0339). However, ANALYCOLYSIS-PWY (r = −0.4870, p = 0.0374) was negatively correlated with GSH, as displayed in Figure 15b. The dual role of ANALYCOLYSIS-PWY was positively linked to OH but negatively related to GSH, which may highlight a trade-off between metabolic output and redox balance.
In addition, the OH in milk is related to PWY-7208 (the superpathway of pyrimidine nucleobase salvage, r = 0.5249, p = 0.0339), PWY-7219 (adenosine ribonucleotides de novo biosynthesis, r = 0.4995, p = 0.0349), PWY-7229 (adenosine deoxyribonucleotides de novo biosynthesis I, r = 0.5038, p = 0.0349), and PWY-6126 (adenosine nucleotides de novo biosynthesis, r = 0.4991, p = 0.0349). Nevertheless, PWY-7208 (r = −0.4557, p = 0.0431), PWY-7219 (r = −0.4991, p = 0.0349), PWY-7229 (r = −0.4748, p = 0.0374), and PWY-6126 (r = −0.4619, p = 0.0407) were negatively correlated with GSH. The negative correlation of these compounds with GSH may reflect resource competition for nucleotide synthesis against OH.
Moreover, OH was positively correlated with PWY-2942 (L-lysine biosynthesis III, r = 0.5178, p = 0.0349), THRESYN-PWY (superpathway of L-threonine biosynthesis, r = 0.5321, p = 0.0339), and PWY-5973 (cis-vaccenate biosynthesis, r = 0.4808, p = 0.0374). However, GSH was negatively correlated with PWY-5973 (r = −0.4939, p = 0.0369), PWY-2942 (r = −0.4766, p = 0.0374), and THRESYN-PWY (r = −0.4817, p = 0.0374). Pathways such as L-lysine biosynthesis and L-threonine biosynthesis are likely involved in amino acid synthesis. The negative correlation of these genes with GSH may reflect resource competition between amino acid synthesis and glutathione regeneration.
However, as depicted in Figure 15a, GSH was negatively correlated with PWY-5101 (L-isoleucine biosynthesis II, r = −0.6350, p = 0.0131), ILEUSYN-PWY (L-isoleucine biosynthesis I, r = −0.6072, p = 0.0131), VALSYN-PWY (r = −0.6072, p = 0.0131), branched-chain-AA-SYN-PWY (r = −0.6232, p = 0.0131), PWY-3001 (superpathway of L-isoleucine biosynthesis I, r = −0.5803, p = 0.0181), PWY-7663 (gondoate biosynthesis, r = −0.5269, p = 0.0339), and PWY-5104 (L-isoleucine biosynthesis IV, r = −0.5451, p = 0.0339).
In addition, PWY-5667 (CDP-diacylglycerol biosynthesis I) and PWY0-1319 (CDP-diacylglycerol biosynthesis II) were positively correlated with both T-AOC (r = 0.4608, p = 0.0407; r = 0.4776, p = 0.0374) and OH (r = 0.4608, p = 0.0407; r = 0.4776, p = 0.0374), respectively.

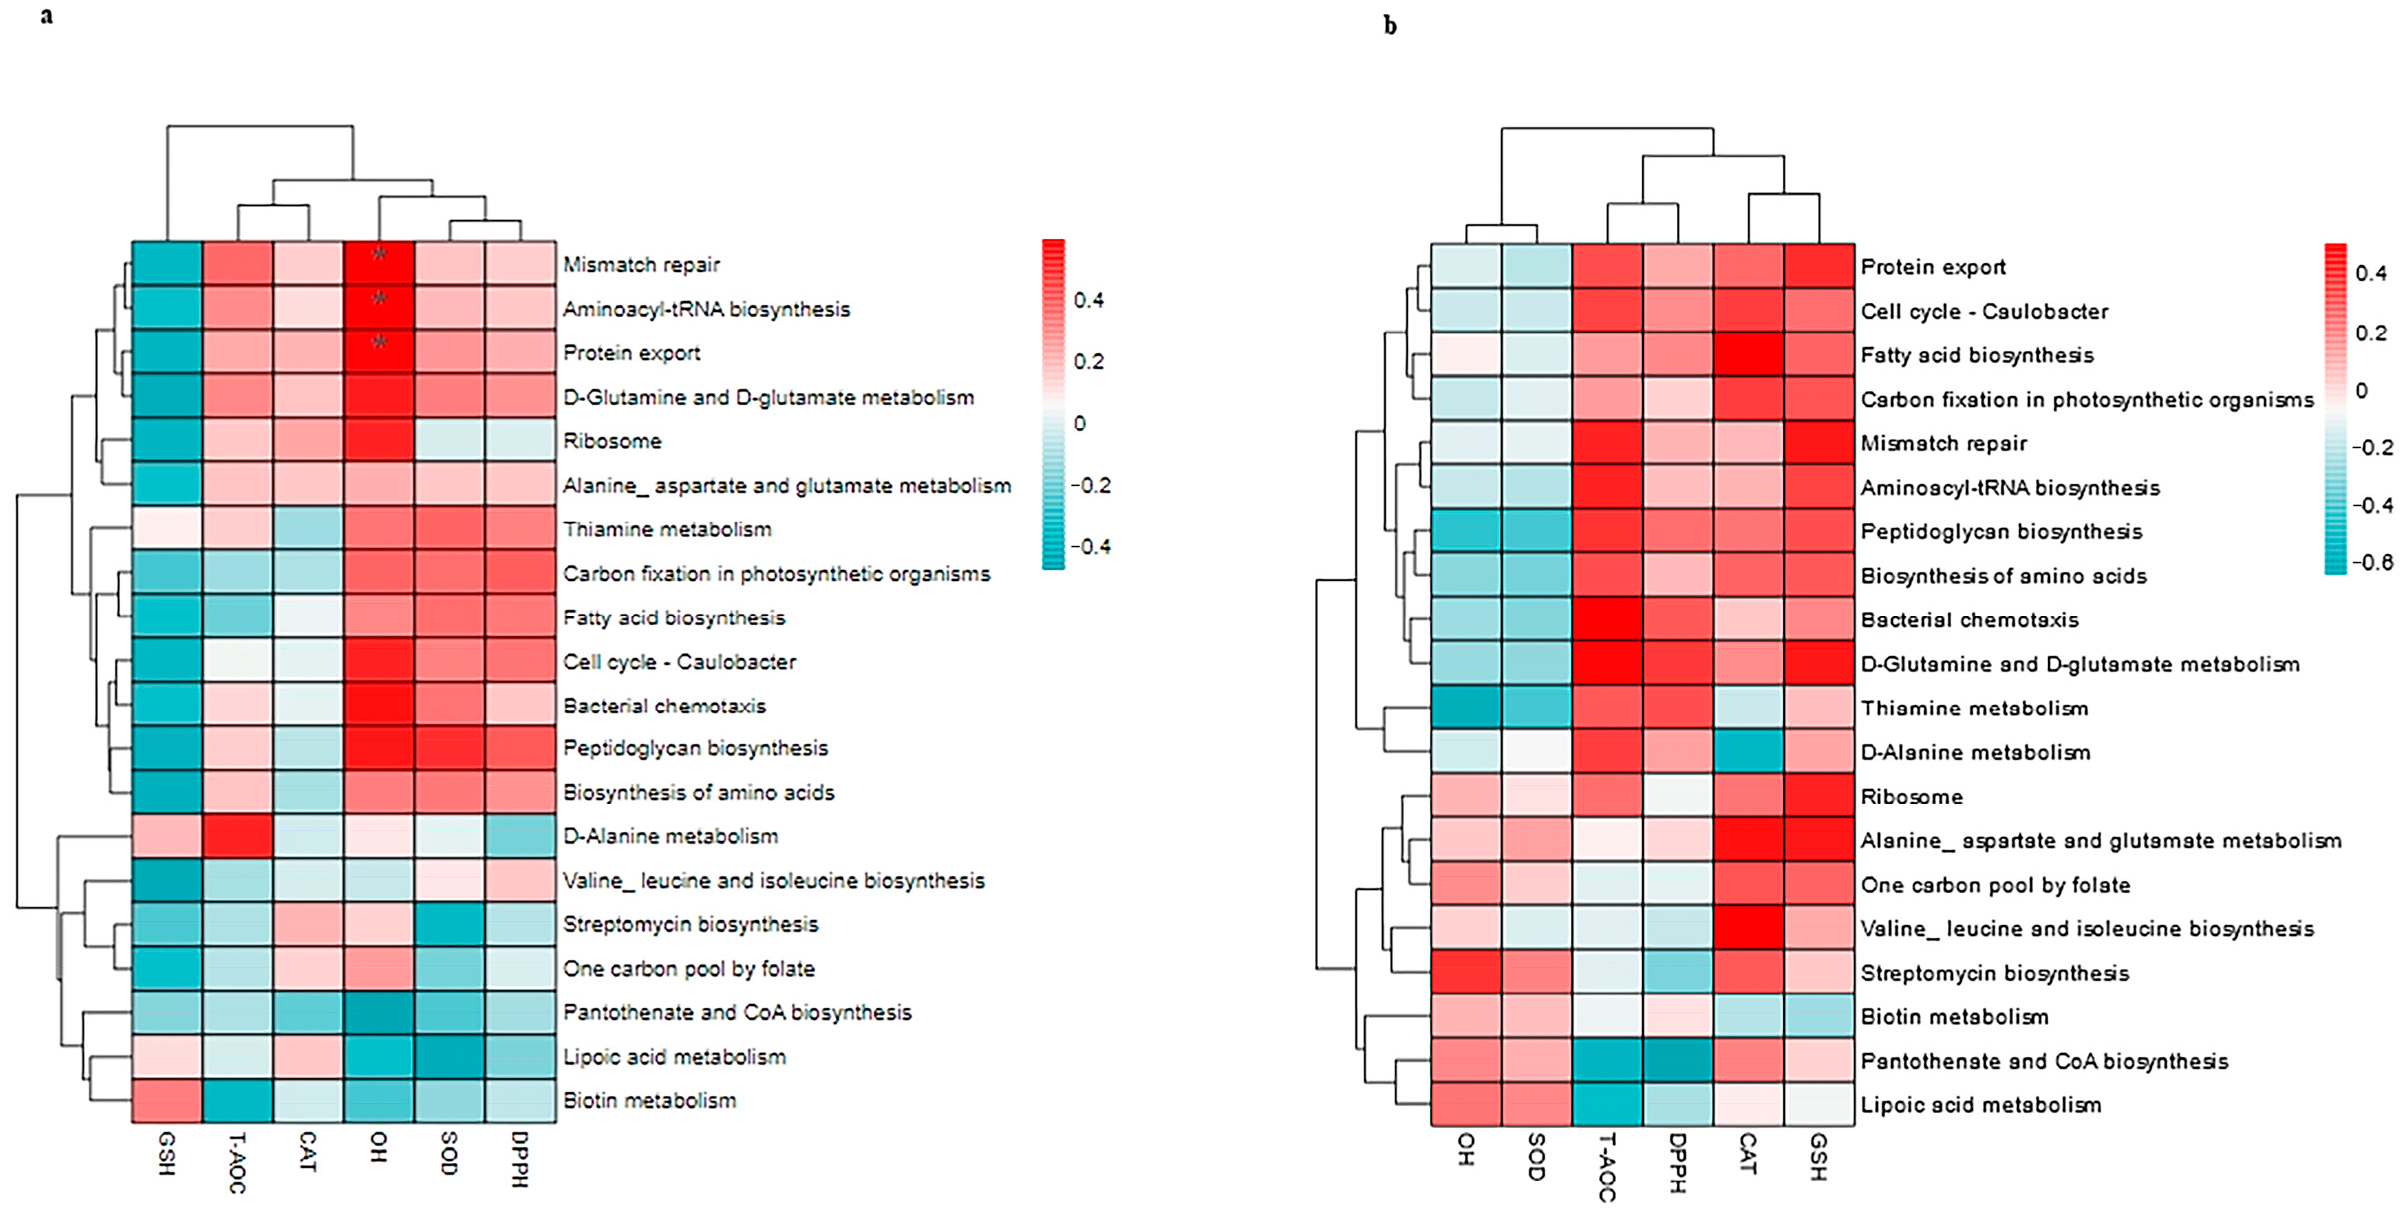
3.8. Correlation Between Top 20 KEGG Pathways and the Antioxidants in Milk and in Serum

As depicted at Figure 16a, OH positively correlated with mismatch repair (r = 0.5961, p = 0.0422), aminoacyl-tRNA biosynthesis (r = 0.5898, p = 0.0422), and protein repair (r = 0.5651, p = 0.04); whereas there was no significant correlation displayed at Figure 16b. Furthermore, T-AOC, SOD, CAT, and DPPH in milk also showed no significant correlation with the 20 KEGG pathways. In milk, OH’s association with specific pathways suggests compartmentalized antioxidant responses, distinct from other antioxidant parameters.

3.9. Correlation Between Top 20 ECs and the Antioxidants in Milk and in Serum

As depicted in Figure 17, no significant correlation was detected between the top 20 ECs and the antioxidants in milk. In addition, no EC was significantly correlated with the antioxidants in the serum. This is a limitation of this study, and further studies involving a larger population are needed to evaluate these results.

4. Discussion

The Camelidae family comprises the Bactrian camel (Camelus bactrianus), the dromedary camel (Camelus dromedarius), and four species of South American camelids: llama (Lama glama), alpaca (Lama pacos) guanaco (Lama guanicoe), and vicuña (Vicugna vicugna) [31]. Camels hold significant cultural significance and have been a vital contributor to arid-land ecologically sustainable development [32], while there has been an increase in the breeding and management of camels for the purpose of milk production [33].
In this study, prior to the first parturition, the camels remained in the traditional rangeland production system, where the main vegetation belongs to Amaranthaceae, Fabaceae, Zygophyllaceae, Poaceae, and Liliaceae. Owing to the palatability of Mongolian rangeland plants, camels can consume 93 plant species year round [34]. In summer, camels mainly graze on herbs, whereas in winter, camels prefer to browse shrubs [35]. After being returned to the extensive system, the camels were provided with the same diet across the different parities.
Camel milk is the key component of the human diet, especially in arid and semi-arid regions, highlighting its nutritional importance, pharmaceutical potential, and medicinal value [36,37]. In addition, camel milk has been found to have antioxidant, anti-inflammatory, and immunomodulatory effects [38,39]. In dromedaries, the malondialdehyde (MDA) level in milk much greater than the MDA level in serum [4]. In the serum, the GSH (mean level of 31.23 mg/dL) during the lactating period higher than the GSH level in pregnant dromedary camels [14]. In Bactrian camels, the average T-AOC (mean level of 28.40 mg/mL) in milk decreases as parity increases in another report [40]. Its antioxidant parameters, such as the T-AOC, were much greater than the corresponding serum parameters in the present study; the T-AOC was 59.74 mg/mL (SEM = 4.1194) in the milk of the primiparous camel and 4.82 mg/mL (SEM = 0.0534) in the serum of the primiparous camel.
Compared with multiparous camels, primiparous camels had lower milk production rates and percentages of bimodal curves [41]. At the fifth parity of camels, the highest levels of protein and lactose are reported in camel milk [42]. Parity influences serum antioxidant [43] and milk antioxidant levels [44]. The number of pregnancies significantly reduces the serum levels of some antioxidants [45]. Among dairy cattle, primiparous cows are more susceptible to oxidant antioxidant imbalance than multiparous postpartum cows are [46]. Multiparous cows also present increased antioxidant transcription factor and expression levels in milk [47]. In goats, higher parity is associated with higher levels of antioxidants in serum [48]. In the present study, the amount of OH and SOD in the serum of first-parity lactating camels was significantly greater than that in the other groups, whereas no antioxidant parameters were significantly greater than those in the other groups. Similarly, the SOD concentration decreases with increasing parity in dairy cattle [49].
In both the fecal and rumen microbial communities of adult Bactrian camels, the dominant phyla are Firmicutes, Verrucomicrobia, and Bacteroidetes [50,51]. Another study demonstrated that the fecal microbiota of Bactrian camels at 1 and 3 years of age dominated by the same phyla [52]. In the present study, these three phyla were also found to be most abundant in Bactrian camel feces. The unique gastrointestinal microbiome of Bactrian camels may be due to their distinct digestive systems, and the fecal microbial communities of both domestic and wild Bactrian camels may cluster together [53]. In gastrointestinal tract samples from yaks, Firmicutes, Bacteroidetes, and Verrucomicrobia were the most abundant phyla [54]. Similarly, in beef cattle, the most common phyla in the fecal microbiota include Firmicutes, Bacteroidetes, and Verrucomicrobia [55,56]. However, the dromedary camel fecal microbes and their enzymes are primarily affiliated with Bacteroidetes, Firmicutes, and Proteobacteria [57,58]. Furthermore, the sheep fecal core microbiome under various feeding systems is dominated by Firmicutes, Bacteroidetes, and Proteobacteria [59,60]. In the feces of dairy cattle, the most abundant phyla are Firmicutes, Proteobacteria, and Actinobacteria [61].
In the present study, the overall structure of the fecal microbial communities (Figure 4) and their functions (Figure 7, Figure 10, and Figure 13) in the P_1, P_3, and P_5 samples were clustered together. In dairy cattle, the ruminal bacterial communities exhibit similar diversity between the first and second lactation cycles [62]. However, in first-lactation dairy cows, Bacteroidetes contribute to the majority of metabolic functions, whereas Firmicutes and Proteobacteria increase in abundance during the second and third lactation cycles [63].
In this study, primiparous camels were enriched in Verrucomicrobiaceae and Akkermansia and involved in steroid biosynthesis. Previous reports suggest that bacterial species possessing critical genes for steroid biosynthesis belong primarily to the phyla Actinobacteria, Deltaproteobacteria, Gammaproteobacteria, and Verrucomicrobia [64]. Another study classified Akkermansia muciniphila as a steroid-producing bacterium that colonizes the mucus layer of the gastrointestinal tract, representing 1 to 4% of the fecal microbiota [65]. This bacterium is known to stimulate mucosal microbial networks and enhance intestinal barrier function, thereby providing essential host immune responses [66].
Furthermore, the abundance of Clostridium was highest in third parity lactating camels in this study, whereas the abundance of Ruminococcus was significantly greater in fifth parity camels than in other lower parity lactating camels. Both the genera Clostridium and Ruminococcus belong to Firmicutes, which suggests that camels rich in lignocellulolytic enzymes could be indicative of a fecal microbial community in multiparous camels that is rich in fiber-degrading microbes [67,68]. Finally, this study revealed that the fecal tuberculosis pathway increased with increasing parity, warranting future validation. Mycobacterium tuberculosis is reported as the etiological agent of tuberculosis [69,70].
Interestingly, OH in camel milk was associated with both the NONOXIPENT-PWY and ANAGLYCOLYSIS-PWY metabolic pathways in this study. NONOXIPENT-PWY and the glycolysis pathway of anaerobes (ANAGLYCOLYSIS-PWY) were highly enriched in wild-living macaques compared with housed ones [71]. In the present study, the relative abundance of NONOXIPENT-PWY (1.01%) was the highest, whereas that of ANAGLYCOLYSIS-PWY was 0.8%. The NONOXIPENT-PWY pathway is the nonoxidative subpathway of the PENTOSE-Phosphate-PWY (PPP), the common glycolysis pathway for the catabolism of glucose, and it regulates Treg cell function, maintaining immune homeostasis and thereby controlling oxidative phosphorylation [72]. Glycolysis was first studied as a pathway for the utilization of glucose, and ANAGLYCOLYSIS-PWY is also described as glycolysis III [73]. The relative abundance of glycolysis and gluconeogenesis in the rumen contents ranges from 4% to 6% in buffalo [74]. Within the category carbohydrate metabolism, glycolysis/gluconeogenesis and PPP were enriched in the rumens of multiparous mid-lactation Holstein dairy cows [75].
In addition, PWY-5667 and PWY0-1319 were positively correlated with both T-AOC values in milk. These pathways describe the biosynthesis of CDP-diacylglycerol in some gram-negative bacteria [76]. Mitochondria are capable of synthesizing several lipids autonomously, such as phosphatidylglycerol, cardiolipin and, in part, phosphatidylethanolamine, phosphatidic acid, and CDP-diacylglycerol [77]. In addition, the OH in milk is related to PWY-7208, nucleotide metabolism, i.e., the superpathway of pyrimidine nucleobase salvage [78]; PWY-7219, adenosine ribonucleotide de novo biosynthesis [79]; PWY-7229, adenosine deoxyribonucleotide de novo biosynthesis I [80]; and PWY-6126, adenosine nucleotide de novo biosynthesis [81].
However, it is important to note that this study establishes associations between microbes and KEGG pathways or EC numbers using a limited sample size of randomly selected lactating camels at different parities. Importantly, correlation does not necessarily imply causation. Therefore, future investigations should focus on controlled experiments to substantiate these correlations. In addition, this study is limited in terms of the ability of qPCR to add further support because of the limited amount of the sampled materials, as well as the metagenomics and metabolomics analysis.
This study demonstrated the effects of parity on the antioxidant parameters and the fecal microbiome of lactating camels. However, the intensification of camels for milk production necessitates a comprehensive assessment by scientists to determine camel health and welfare, considering the complicated factors affecting milk production [82]. To date, the only tools for evaluating the welfare of camels include a combination of individual, diet and management measures to investigate individual camel health status [83,84]. However, there are still insufficient protocols for assessing the health and welfare of camels [85]. Thus, the level of the oxidative state should be taken into consideration when evaluating the health and welfare of lactating camel herds.

5. Conclusions

In the present study, we investigated the influence of parity dynamics on milk antioxidants, serum antioxidants, and the fecal microbial communities of lactating Bactrian camels. The OH, SOD, and DPPHlevels in milk were greater for the fifth parity and third parity groups than for the first parity group. The amount of T-AOC and DPPH was the highest in third-parity camels, in both milk and serum. These differences suggest that parity influences antioxidative resilience, which may affect immune function and camel health. Thus, their antioxidant profiles could inform herd management practices for sustaining welfare in camel breeders.
Furthermore, the amount of hydroxyl radicals in milk was positively associated with the NONOXIPENT-PWY and ANAGLYCOLYSIS-PWY metabolic pathways. In addition, T-AOC was positively associated with CDP-diacylglycerol-related pathways, whereas the OH of camel milk was also related to nucleotide metabolism-related pathways. Primiparous camels were enriched in the Verrucomicrobiaceae and steroid biosynthesis pathways, whereas Clostridiaceae, Bacteroidaceae, Paraprevotellaceae, and Ruminococcaceae were enriched in multiparous camels. Pathways associated with bacterial infection (e.g., KEGG: tuberculosis) were more abundant in multiparous camels, warranting cautious interpretation. Microbial changes might directly or indirectly influence antioxidant capacity, creating a feedback loop between the gut microbiome and oxidative balance. In camels, future research should focus on mechanistic studies to clarify the relationship between the gut microbiota and redox homeostasis in serum and milk.

Author Contributions

Conceptualization, H.D., J.W., H.Z., J.G. and J.X.; methodology, H.D., J.W., H.Z. and J.X.; software, H.D. and J.W.; validation, H.D., J.W., H.Z. and J.X.; formal analysis, H.D. and J.W.; investigation, H.D., J.W., J.L. and F.W.; resources, H.D. and J.W.; data curation, H.D., J.L., F.W. and J.W.; writing—original draft preparation, H.D.; writing—review and editing, H.D., H.L., S.H. and J.W.; visualization, H.D. and J.W.; supervision, J.W.; project administration, H.D., H.L. and J.W.; funding acquisition, H.D. and J.W. All authors have read and agreed to the published version of the manuscript.

Funding

This work was funded by the Inner Mongolian Natural Science Foundation of China (Grant No. 2021MS03028) and Doctorate Job Project by the Bayannur Science and Technology Bureau (Grant No. 202114).

Institutional Review Board Statement

This study was carried out in accordance with the recommendations of the Instructive Notions with Respect to Caring for Experimental Animals of the Ministry of Technology of China. The protocol was approved by the Ethics Committee of the Hetao College (protocol code HTDX2330 and date of approval 7 July 2023).

Informed Consent Statement

Informed consent was obtained from all the subjects involved in this study.

Data Availability Statement

All the sequences were deposited to the NCBI sequence read archive (SRA) at the accession number: PRJNA964482.

Acknowledgments

We thank the workers at Yinggesu Biotechnology Co., Ltd. for the assistance in sampling and storage of fresh feces of individual camels.

Conflicts of Interest

Authors Jianjun Li, Fei Wang, Huan Li were employed by the Inner Mongolia Yinggesu Biotechnology Co., Ltd. The remaining authors declare that the research was conducted in the absence of any commercial or financial relationships that could be construed as a potential conflict of interest.

Abbreviations

The following abbreviations are used in this manuscript:
T-AOCTotal antioxidant capacity
CATCatalase
OHAntioxidant activity for hydroxyl radical
SODSuperoxide dismutase
GSHGlutathione peroxidase
DPPHAntioxidant activity for polypeptides

References

  1. Volpato, G.; Di Nardo, A. The role of Nucularia perrinii Batt. (Chenopodiaceae) in the camel-based Sahrawi social-ecological system. J. Ethnobiol. Ethnomed. 2017, 13, 12. [Google Scholar] [CrossRef]
  2. Ali, A.; Baby, B.; Vijayan, R. From desert to medicine: A review of camel genomics and therapeutic products. Front. Genet. 2019, 10, 17. [Google Scholar] [CrossRef]
  3. Lyu, H.; Na, Q.; Wang, L.; Li, Y.; Zheng, Z.; Wu, Y.; Li, Y.; Hang, G.; Zhu, X.; Ji, R. Effects of muscle type and aging on glycolysis and physicochemical quality properties of bactrian camel (Camelus bactrianus) meat. Animals 2024, 14, 611. [Google Scholar] [CrossRef]
  4. Khalphallah, A.; Almuhanna, A.H.; Al-Daek, T.; Alhaider, A.; Elmeligy, E.; Mohamed, R.H.; Abdulkarim, A.; Khalifa, M.I.; Bazeed, S.M.; Khesruf, K.A. The clinical importance and correlations of post-partum changes in the clinical findings, reproductive cyclicity, serum-milk oxidant/antioxidant parameters as a stress indicator in female dromedary camel (Camelus dromedarius) and their effect on milk palatability. Vet. Res. Commun. 2024, 48, 1595–1610. [Google Scholar]
  5. Khalphallah, A.; Elmeligy, E.; Zakaria, A.M.; Ghallab, R.S.; Abdulkarim, A.; Mohamed, R.H. Comparative study of efficacy of prepartum injection of multivitamins and selenium-vitamin E (ά-tocopherol)-combination on post-partum clinical findings, serum steroids, calf and placental weights, and milk antioxidant biomarkers changes in female dromed. Open Vet. J. 2022, 12, 657–667. [Google Scholar] [CrossRef]
  6. Sies, H. Oxidative eustress: On constant alert for redox homeostasis. Redox Biol. 2021, 41, 101867. [Google Scholar] [CrossRef]
  7. Nagel, C.; Aurich, C.; Aurich, J. Stress effects on the regulation of parturition in different domestic animal species. Anim. Reprod. Sci. 2019, 207, 153–161. [Google Scholar] [CrossRef]
  8. Tufarelli, V.; Colonna, M.A.; Losacco, C.; Puvača, N. Biological health markers associated with oxidative stress in dairy cows during lactation period. Metabolites 2023, 13, 405. [Google Scholar] [CrossRef]
  9. Zheng, S.; Qin, G.; Zhen, Y.; Zhang, X.; Chen, X.; Dong, J.; Li, C.; Aschalew, N.D.; Wang, T.; Sun, Z. Correlation of oxidative stress-related indicators with milk composition and metabolites in early lactating dairy cows. Vet. Med. Sci. 2021, 7, 2250–2259. [Google Scholar] [CrossRef]
  10. Gessner, D.K.; Sandrock, L.M.; Most, E.; Koch, C.; Ringseis, R.; Eder, K. Performance and metabolic, inflammatory, and oxidative stress-related parameters in early lactating dairy cows with high and low hepatic FGF21 expression. Animals 2022, 13, 131. [Google Scholar] [CrossRef]
  11. Urh, C.; Denißen, J.; Gerster, E.; Kraus, N.; Stamer, E.; Heitkönig, B.; Spiekers, H.; Sauerwein, H. Pro-and antioxidative indicators in serum of dairy cows during late pregnancy and early lactation: Testing the effects of parity, different dietary energy levels, and farm. J. Dairy Sci. 2019, 102, 6672–6678. [Google Scholar] [CrossRef] [PubMed]
  12. El-Malky, O.M.; Mostafa, T.H.; Abd El-Salaam, A.M.; Ayyat, M.S. Effect of reproductive disorders on productivity and reproductive efficiency of dromedary she-camels in relation to cytokine concentration. Trop. Anim. Health Prod. 2018, 50, 1079–1087. [Google Scholar] [CrossRef] [PubMed]
  13. Saleh, M.A.; Rateb, M.H.; Mostafa, H.I.; Abou-Khalil, N.S.; Hassan, M.S. Circulating oxidative stress status in Bedouin she-camels (Camelus dromedarius) during the peripartum period. Trop. Anim. Health Prod. 2021, 53, 446. [Google Scholar] [CrossRef]
  14. Mohamed, R.H.; Khalphallah, A.; Nakada, K.; Elmeligy, E.; Hassan, D.; Ebissy, E.A.; Ghandour, R.A.; Mousa, S.A.; Hassaneen, A.S.A. Clinical and correlated responses among steroid hormones and oxidant/antioxidant biomarkers in pregnant, non-pregnant and lactating CIDR-pre-synchronized dromedaries (Camelus dromedarius). Vet. Sci. 2021, 8, 247. [Google Scholar] [CrossRef]
  15. Iliodromiti, Z.; Triantafyllou, A.-R.; Tsaousi, M.; Pouliakis, A.; Petropoulou, C.; Sokou, R.; Volaki, P.; Boutsikou, T.; Iacovidou, N. Gut microbiome and neurodevelopmental disorders: A link yet to be disclosed. Microorganisms 2023, 11, 487. [Google Scholar] [CrossRef]
  16. Siddiqui, R.; Khan, N.A. Microbiome and one health: Potential of novel metabolites from the gut microbiome of unique species for human health. Microorganisms 2023, 11, 481. [Google Scholar] [CrossRef]
  17. Valdes, A.M.; Walter, J.; Segal, E.; Spector, T.D. Role of the gut microbiota in nutrition and health. BMJ 2018, 361, k2179. [Google Scholar] [CrossRef]
  18. Smith, R.P.; Easson, C.; Lyle, S.M.; Kapoor, R.; Donnelly, C.P.; Davidson, E.J.; Parikh, E.; Lopez, J.V.; Tartar, J.L. Gut microbiome diversity is associated with sleep physiology in humans. PLoS ONE 2019, 14, e0222394. [Google Scholar] [CrossRef]
  19. Gharechahi, J.; Zahiri, H.S.; Noghabi, K.A.; Salekdeh, G.H. In-depth diversity analysis of the bacterial community resident in the camel rumen. Syst. Appl. Microbiol. 2015, 38, 67–76. [Google Scholar] [CrossRef]
  20. Gharechahi, J.; Sarikhan, S.; Han, J.L.; Ding, X.Z.; Salekdeh, G.H. Functional and phylogenetic analyses of camel rumen microbiota associated with different lignocellulosic substrates. NPJ Biofilms Microbiomes 2022, 8, 46. [Google Scholar] [CrossRef]
  21. Davis, D.L.; Wu, C.; Brown, W.J.; Nohr, E.A. Parity and mode of birth and their relationships with quality of life: A longitudinal study. PLoS ONE 2022, 17, e0273366. [Google Scholar] [CrossRef] [PubMed]
  22. Kervinen, K.; Holster, T.; Saqib, S.; Virtanen, S.; Stefanovic, V.; Rahkonen, L.; Nieminen, P.; Salonen, A.; Kalliala, I. Parity and gestational age are associated with vaginal microbiota composition in term and late term pregnancies. EBioMedicine 2022, 81, 104107. [Google Scholar] [CrossRef] [PubMed]
  23. Feng, Y.; Yu, D.; Chen, T.; Liu, J.; Tong, X.; Yang, L.; Da, M.; Shen, S.; Fan, C.; Wang, S. Maternal parity and the risk of congenital heart defects in offspring: A dose-response meta-analysis of epidemiological observational studies. PLoS ONE 2014, 9, e108944. [Google Scholar] [CrossRef] [PubMed]
  24. Bogado Pascottini, O.; Spricigo, J.F.W.; Van Schyndel, S.J.; Mion, B.; Rousseau, J.; Weese, J.S.; LeBlanc, S.J. Effects of parity, blood progesterone, and non-steroidal anti-inflammatory treatment on the dynamics of the uterine microbiota of healthy postpartum dairy cows. PLoS ONE 2021, 16, e0233943. [Google Scholar] [CrossRef]
  25. Lean, I.J.; Golder, H.M.; LeBlanc, S.J.; Duffield, T.; Santos, J.E.P. Increased parity is negatively associated with survival and reproduction in different production systems. J. Dairy Sci. 2023, 106, 476–499. [Google Scholar] [CrossRef]
  26. Elbashir, M.H.M.; Elhassan, S.; Abueissa, H.I. Parity effect on camel milk composition under traditional and intensive management systems in Butana area, Sudan. Int. J. Sci. Res. 2018, 6, 1778–1782. [Google Scholar]
  27. Chamekh, L.; Calvo, M.; Khorchani, T.; Hammadi, M.; Fontecha, J.; Habib Yahyaoui, M. Impact of parity on the profile of fatty acids with potential importance for human health in camel (Camelus dromedarius) milk. Mljekarstvo 2023, 73, 263–270. [Google Scholar] [CrossRef]
  28. Callahan, B.J.; McMurdie, P.J.; Rosen, M.J.; Han, A.W.; Johnson, A.J.A.; Holmes, S.P. DADA2: High-resolution sample inference from Illumina amplicon data. Nat. Methods 2016, 13, 581–583. [Google Scholar] [CrossRef]
  29. Bokulich, N.A.; Kaehler, B.D.; Rideout, J.R.; Dillon, M.; Bolyen, E.; Knight, R.; Huttley, G.A.; Gregory Caporaso, J. Optimizing taxonomic classification of marker-gene amplicon sequences with QIIME 2’s q2-feature-classifier plugin. Microbiome 2018, 6, 90. [Google Scholar] [CrossRef]
  30. Langille, M.G.I.; Zaneveld, J.; Caporaso, J.G.; McDonald, D.; Knights, D.; Reyes, J.A.; Clemente, J.C.; Burkepile, D.E.; Vega Thurber, R.L.; Knight, R. Predictive functional profiling of microbial communities using 16S rRNA marker gene sequences. Nat. Biotechnol. 2013, 31, 814–821. [Google Scholar] [CrossRef]
  31. Zarrin, M.; Riveros, J.L.; Ahmadpour, A.; de Almeida, A.M.; Konuspayeva, G.; Vargas-Bello-Pérez, E.; Faye, B.; Hernández-Castellano, L.E. Camelids: New players in the international animal production context. Trop. Anim. Health Prod. 2020, 52, 903–913. [Google Scholar] [CrossRef] [PubMed]
  32. Hamlili, F.Z.; Laroche, M.; Diarra, A.Z.; Lafri, I.; Gassen, B.; Boutefna, B.; Davoust, B.; Bitam, I.; Parola, P. MALDI-TOF MS identification of dromedary camel ticks and detection of associated microorganisms, Southern Algeria. Microorganisms 2022, 10, 2178. [Google Scholar] [CrossRef] [PubMed]
  33. Smits, M.; Joosten, H.; Faye, B.; Burger, P.A. The flourishing camel milk market and concerns about animal welfare and legislation. Animals 2022, 13, 47. [Google Scholar] [CrossRef] [PubMed]
  34. Damiran, D. Palatability of Mongolian rangeland plants. In Circular of Information No. 3; Eastern Oregon Agricultural Research Center, Oregon State University: Union, OR, USA, 2005. [Google Scholar]
  35. Du, H.; Tong, J.; Olonuud, M. Comparison between the sustainably- and unsustainably-managed pastures: The case of urad-middle banner in Inner Mongolia, China. Past. Pastor. 2024, 2, 82–100. [Google Scholar] [CrossRef]
  36. Benmeziane–Derradji, F. Evaluation of camel milk: Gross composition—A scientific overview. Trop. Anim. Health Prod. 2021, 53, 308. [Google Scholar] [CrossRef]
  37. Arain, M.A.; Khaskheli, G.B.; Shah, A.H.; Marghazani, I.B.; Barham, G.S.; Shah, Q.A.; Khand, F.M.; Buzdar, J.A.; Soomro, F.; Fazlani, S.A. Nutritional significance and promising therapeutic/medicinal application of camel milk as a functional food in human and animals: A comprehensive review. Anim. Biotechnol. 2023, 34, 1988–2005. [Google Scholar] [CrossRef]
  38. Khan, M.Z.; Xiao, J.; Ma, Y.; Ma, J.; Liu, S.; Khan, A.; Khan, J.M.; Cao, Z. Research development on anti-microbial and antioxidant properties of camel milk and its role as an anti-cancer and anti-hepatitis agent. Antioxidants 2021, 10, 788. [Google Scholar] [CrossRef]
  39. Behrouz, S.; Saadat, S.; Memarzia, A.; Sarir, H.; Folkerts, G.; Boskabady, M.H. The antioxidant, anti-inflammatory and immunomodulatory effects of camel milk. Front. Immunol. 2022, 13, 855342. [Google Scholar] [CrossRef]
  40. Zhang, H.; Lai, T.; Du, H.; Li, J.; Wu, S.; Xu, J. Basic components, oxidative stress and inflammatory factors of camel milk obtained from different parity of Gobi red camel. Feed Ind. 2025, 46, 82–86. [Google Scholar]
  41. Atigui, M.; Brahmi, M.; Marnet, P.G.; Ben Salem, W.; Campagna, M.C.; Borghese, A.; Todde, G.; Caria, M.; Hammadi, M.; Boselli, C. Study of the milkability of the mediterranean italian buffalo and the tunisian maghrebi camel according to parity and lactation stage. Animals 2024, 14, 1055. [Google Scholar] [CrossRef]
  42. Babiker, W.I.A.; El-Zubeir, I.E.M. Impact of husbandry, stages of lactation and parity number on milk yield and chemical composition of dromedary camel milk. Emir. J. Food Agric. 2014, 26, 333–341. [Google Scholar] [CrossRef]
  43. Mumford, S.L.; Browne, R.W.; Schliep, K.C.; Schmelzer, J.; Plowden, T.C.; Michels, K.A.; Sjaarda, L.A.; Zarek, S.M.; Perkins, N.J.; Messer, L.C. Serum antioxidants are associated with serum reproductive hormones and ovulation among healthy women. J. Nutr. 2016, 146, 98–106. [Google Scholar] [CrossRef] [PubMed]
  44. Stocco, G.; Cipolat-Gotet, C.; Biffani, S.; Ablondi, M.; Negro, A.; Summer, A.; Kyriakaki, P.; Mavrommatis, A.; Tsiplakou, E. Stage of lactation, parity, breed, milk composition, and minerals affect the nonenzymatic antioxidant activity of sheep milk. J. Dairy Sci. 2024, 107, 10361–10372. [Google Scholar] [CrossRef] [PubMed]
  45. Amballi, A.A.; Oyedeji, S.O.; Ogunyemi, E.O.; Adeyemi, A.B.; Anetor, J.I.; Adenaike, F.A. Effects of parity on antioxidant status in pregnant women in a Nigerian population. Ann. Trop. Pathol. 2014, 5, 83–91. [Google Scholar]
  46. Yehia, S.G.; Ramadan, E.S.; Megahed, E.A.; Salem, N.Y. Effect of parity on metabolic and oxidative stress profiles in Holstein dairy cows. Vet. World 2020, 13, 2780–2786. [Google Scholar] [CrossRef]
  47. Corset, A.; Remot, A.; Graulet, B.; Poton, P.; Philau, S.; Ricouleau, J.F.; Dhumez, O.; Germon, P.; Boudon, A.; Boutinaud, M. Effects of parity and week after calving on the metabolic, redox, and immune status of dairy cows. J. Dairy Sci. 2024, 107, 8592–8608. [Google Scholar] [CrossRef]
  48. Radin, L.; Šimpraga, M.; Vince, S.; Kostelić, A.; Milinković-Tur, S. Metabolic and oxidative status of Saanen goats of different parity during the peripartum period. J. Dairy Res. 2015, 82, 426–433. [Google Scholar] [CrossRef]
  49. Wu, X.; Sun, H.; Xue, M.; Wang, D.; Guan, L.; Liu, J. Days-in-milk and parity affected serum biochemical parameters and hormone profiles in mid-lactation holstein cows. Animals 2019, 9, 230. [Google Scholar] [CrossRef]
  50. He, J.; Yi, L.; Hai, L.; Ming, L.; Gao, W.; Ji, R. Characterizing the bacterial microbiota in different gastrointestinal tract segments of the Bactrian camel. Sci. Rep. 2018, 8, 654. [Google Scholar] [CrossRef]
  51. Karnachuk, O.V.; Panova, I.A.; Panov, V.L.; Ikkert, O.P.; Kadnikov, V.V.; Rusanov, I.I.; Avakyan, M.R.; Glukhova, L.B.; Lukina, A.P.; Rakitin, A.V. Active sulfate-reducing bacterial community in the camel gut. Microorganisms 2023, 11, 401. [Google Scholar] [CrossRef]
  52. He, J.; Hai, L.; Orgoldol, K.; Yi, L.; Ming, L.; Guo, F.; Li, G.; Ji, R. High-throughput sequencing reveals the gut microbiome of the Bactrian camel in different ages. Curr. Microbiol. 2019, 76, 810–817. [Google Scholar] [CrossRef] [PubMed]
  53. Ming, L.; Yi, L.; Siriguleng; Hasi, S.; He, J.; Hai, L.; Wang, Z.; Guo, F.; Qiao, X.; Jirimutu. Comparative analysis of fecal microbial communities in cattle and Bactrian camels. PLoS ONE 2017, 12, e0173062. [Google Scholar] [CrossRef] [PubMed]
  54. Han, X.; Liu, H.; Hu, L.; Zhao, N.; Xu, S.; Lin, Z.; Chen, Y. Bacterial community characteristics in the gastrointestinal tract of yak (Bos grunniens) fully grazed on pasture of the Qinghai-Tibetan Plateau of China. Animals 2021, 11, 2243. [Google Scholar] [CrossRef] [PubMed]
  55. Zhang, Z.; Yang, L.; He, Y.; Luo, X.; Zhao, S.; Jia, X. Composition of fecal microbiota in grazing and feedlot angus beef cattle. Animals 2021, 11, 3167. [Google Scholar] [CrossRef]
  56. Weese, J.S.; Jelinski, M. Assessment of the fecal microbiota in beef calves. J. Vet. Intern. Med. 2017, 31, 176–185. [Google Scholar] [CrossRef]
  57. Ameri, R.; Laville, E.; Potocki-Véronèse, G.; Trabelsi, S.; Mezghani, M.; Elgharbi, F.; Bejar, S. Two new gene clusters involved in the degradation of plant cell wall from the fecal microbiota of Tunisian dromedary. PLoS ONE 2018, 13, e0194621. [Google Scholar] [CrossRef]
  58. Hinsu, A.T.; Tulsani, N.J.; Panchal, K.J.; Pandit, R.J.; Jyotsana, B.; Dafale, N.A.; Patil, N.V.; Purohit, H.J.; Joshi, C.G.; Jakhesara, S.J. Characterizing rumen microbiota and CAZyme profile of Indian dromedary camel (Camelus dromedarius) in response to different roughages. Sci. Rep. 2021, 11, 9400. [Google Scholar] [CrossRef]
  59. Minozzi, G.; Biscarini, F.; Dalla Costa, E.; Chincarini, M.; Ferri, N.; Palestrini, C.; Minero, M.; Mazzola, S.; Piccinini, R.; Vignola, G. Analysis of hindgut microbiome of sheep and effect of different husbandry conditions. Animals 2020, 11, 4. [Google Scholar] [CrossRef]
  60. Tanca, A.; Fraumene, C.; Manghina, V.; Palomba, A.; Abbondio, M.; Deligios, M.; Pagnozzi, D.; Addis, M.F.; Uzzau, S. Diversity and functions of the sheep faecal microbiota: A multi-omic characterization. Microb. Biotechnol. 2017, 10, 541–554. [Google Scholar] [CrossRef]
  61. Williamson, J.R.; Callaway, T.R.; Lourenco, J.M.; Ryman, V.E. Characterization of rumen, fecal, and milk microbiota in lactating dairy cows. Front. Microbiol. 2022, 13, 984119. [Google Scholar] [CrossRef]
  62. Jewell, K.A.; McCormick, C.A.; Odt, C.L.; Weimer, P.J.; Suen, G. Ruminal bacterial community composition in dairy cows is dynamic over the course of two lactations and correlates with feed efficiency. Appl. Environ. Microbiol. 2015, 81, 4697–4710. [Google Scholar] [CrossRef] [PubMed]
  63. Pitta, D.W.; Indugu, N.; Kumar, S.; Vecchiarelli, B.; Sinha, R.; Baker, L.D.; Bhukya, B.; Ferguson, J.D. Metagenomic assessment of the functional potential of the rumen microbiome in Holstein dairy cows. Anaerobe 2016, 38, 50–60. [Google Scholar] [CrossRef] [PubMed]
  64. Hoshino, Y.; Gaucher, E.A. Evolution of bacterial steroid biosynthesis and its impact on eukaryogenesis. Proc. Natl. Acad. Sci. USA 2021, 118, e2101276118. [Google Scholar] [CrossRef]
  65. Zhai, Q.; Feng, S.; Arjan, N.; Chen, W. A next generation probiotic, Akkermansia muciniphila. Crit. Rev. Food Sci. Nutr. 2019, 59, 3227–3236. [Google Scholar] [CrossRef]
  66. Macchione, I.G.; Lopetuso, L.R.; Ianiro, G.; Napoli, M.; Gibiino, G.; Rizzatti, G.; Petito, V.; Gasbarrini, A.; Scaldaferri, F. Akkermansia muciniphila: Key player in metabolic and gastrointestinal disorders. Eur. Rev. Med. Pharmacol. Sci. 2019, 23, 8075–8083. [Google Scholar]
  67. Rabee, A.E.; Sayed Alahl, A.A.; Lamara, M.; Ishaq, S.L. Fibrolytic rumen bacteria of camel and sheep and their applications in the bioconversion of barley straw to soluble sugars for biofuel production. PLoS ONE 2022, 17, e0262304. [Google Scholar] [CrossRef]
  68. Rabee, A.E.; Abd El Rahman, T.; Lamara, M. Changes in the bacterial community colonizing extracted and non-extracted tannin-rich plants in the rumen of dromedary camels. PLoS ONE 2023, 18, e0282889. [Google Scholar] [CrossRef]
  69. Koch, A.; Mizrahi, V. Mycobacterium tuberculosis. Trends Microbiol. 2018, 26, 555–556. [Google Scholar] [CrossRef]
  70. Infantes-Lorenzo, J.A.; Romero, B.; Rodríguez-Bertos, A.; Roy, A.; Ortega, J.; de Juan, L.; Moreno, I.; Domínguez, M.; Domínguez, L.; Bezos, J. Tuberculosis caused by Mycobacterium caprae in a camel (Camelus dromedarius). BMC Vet. Res. 2020, 16, 435. [Google Scholar] [CrossRef]
  71. Sawaswong, V.; Chanchaem, P.; Kemthong, T.; Warit, S.; Chaiprasert, A.; Malaivijitnond, S.; Payungporn, S. Alteration of gut microbiota in wild-borne long-tailed macaques after 1-year being housed in hygienic captivity. Sci. Rep. 2023, 13, 5842. [Google Scholar] [CrossRef]
  72. Liu, Q.; Zhu, F.; Liu, X.; Lu, Y.; Yao, K.; Tian, N.; Tong, L.; Figge, D.A.; Wang, X.; Han, Y. Non-oxidative pentose phosphate pathway controls regulatory T cell function by integrating metabolism and epigenetics. Nat. Metab. 2022, 4, 559–574. [Google Scholar] [CrossRef] [PubMed]
  73. National Center for Biotechnology Information. PubChem Pathway Summary for Pathway ANAGLYCOLYSIS-PWY, Glycolysis III (from Glucose). BioCyc. Available online: https://pubchem.ncbi.nlm.nih.gov/pathway/BioCyc:EVA_ANAGLYCOLYSIS-PWY (accessed on 26 January 2025).
  74. Parmar, N.R.; Kumar, J.I.N.; Joshi, C.G. Deep insights into carbohydrate metabolism in the rumen of Mehsani buffalo at different diet treatments. Genomics Data 2015, 6, 59–62. [Google Scholar] [CrossRef]
  75. Xie, Y.; Sun, H.; Xue, M.; Liu, J. Metagenomics reveals differences in microbial composition and metabolic functions in the rumen of dairy cows with different residual feed intake. Anim. Microbiome 2022, 4, 19. [Google Scholar] [CrossRef]
  76. National Center for Biotechnology Information. PubChem Pathway Summary for Pathway PWY-5667, CDP-Diacylglycerol Biosynthesis I. BioCyc. Available online: https://pubchem.ncbi.nlm.nih.gov/pathway/BioCyc:META_PWY-5667 (accessed on 26 January 2025).
  77. Horvath, S.E.; Daum, G. Lipids of mitochondria. Prog. Lipid Res. 2013, 52, 590–614. [Google Scholar] [CrossRef]
  78. National Center for Biotechnology Information. PubChem Pathway Summary for Pathway PWY-7208, Superpathway of Pyrimidine Nucleobases Salvage. BioCyc. Available online: https://pubchem.ncbi.nlm.nih.gov/pathway/BioCyc:META_PWY-7208 (accessed on 13 February 2025).
  79. National Center for Biotechnology Information. PubChem Pathway Summary for Pathway PWY-7219, Adenosine Ribonucleotides de Novo Biosynthesis. BioCyc. Available online: https://pubchem.ncbi.nlm.nih.gov/pathway/BioCyc:HUMAN_PWY-7219 (accessed on 13 February 2025).
  80. National Center for Biotechnology Information. PubChem Pathway Summary for Pathway PWY-7229, Superpathway of Adenosine Nucleotides de Novo Biosynthesis I. BioCyc. Available online: https://pubchem.ncbi.nlm.nih.gov/pathway/BioCyc:META_PWY-7229 (accessed on 13 February 2025).
  81. National Center for Biotechnology Information. PubChem Pathway Summary for Pathway PWY-6126, Adenosine Nucleotides de Novo Biosynthesis. BioCyc. Available online: https://pubchem.ncbi.nlm.nih.gov/pathway/BioCyc:YEAST_PWY-6126 (accessed on 13 February 2025).
  82. Iglesias Pastrana, C.; Navas González, F.J.; Ciani, E.; Barba Capote, C.J.; Delgado Bermejo, J.V. Effect of research impact on emerging camel husbandry, welfare and social-related awareness. Animals 2020, 10, 780. [Google Scholar] [CrossRef]
  83. Padalino, B.; Menchetti, L. The first protocol for assessing welfare of camels. Front. Vet. Sci. 2021, 7, 631876. [Google Scholar] [CrossRef]
  84. Menchetti, L.; Zappaterra, M.; Nanni Costa, L.; Padalino, B. Application of a protocol to assess camel welfare: Scoring system of collected measures, aggregated assessment indices, and criteria to classify a pen. Animals 2021, 11, 494. [Google Scholar] [CrossRef]
  85. Masebo, N.T.; Zappaterra, M.; Felici, M.; Benedetti, B.; Padalino, B. Dromedary camel’s welfare: Literature from 1980 to 2023 with a text mining and topic analysis approach. Front. Vet. Sci. 2023, 10, 1277512. [Google Scholar] [CrossRef]
Figure 1. Venn diagram showing the overlap of OTUs across the groups of the fecal microbial community in lactating Bactrian camels. Green represents P_1 (10 female lactating camels, 1st parity), red represents P_3 (10 female lactating camels, 3rd parity), and blue represents P_5 (10 female lactating camels, 5th parity).
Vetsci 12 00440 g001
Figure 2. Bar graphs showing the top 20 relatively abundant phyla (a) and genera (b) in lactating Bactrian camel feces. The horizontal axis represents the different pairs of lactating camels: P_1 (10 female lactating camels, 1st parity), P_3 (10 female lactating camels, 3rd parity), and P_5 (10 female lactating camels, 5th parity). The vertical axis illustrates the proportion of sequences attributed to the relevant phylum (a) or genus (b). The colors of the bar graphs from top to bottom align with the colors for each taxon on the right, ranging from the lowest to the greatest relative abundances, with the exception of ‘Other’. At the phylum level, sequences that could not be assigned were categorized as ‘unclassified’, whereas ‘Other’ denotes the cumulative percentage of all other phyla that did not make the top 20. Similarly, at the genus level, ‘Other’ represents the cumulative percentage of all other genera that fell outside the top 20.
Vetsci 12 00440 g002
Figure 3. LEfSe analysis of the fecal microbiome (a) and cladogram (b) in lactating Bactrian camels. The horizontal axis represents the different pairs of lactating camels: green, red, and blue correspond to the P_1, P_3, and P_5 groups, respectively. (a) Each horizontal bar represents a specific taxon, with the length of the bar indicating the linear discriminant analysis (LDA) score. (b) Fan-shaped areas of the same color label the related taxon, with each circle ligature representing a distinct taxon. Yellow signifies no significant difference among the groups, whereas other colors denote the biomarkers for the respective group.
Vetsci 12 00440 g003
Figure 4. Principle coordinate analysis (PCoA) 3D analysis of the fecal microbial communities associated with different parities in lactating Bactrian camels. In the color scheme, green denotes P_1 (10 female lactating camels, 1st parity), red signifies P_3 (10 female lactating camels, 3rd parity), and blue represents P_5 (10 female lactating camels, 5th parity). Each plot corresponds to a single sample, and plots of the same color belong to the same group.
Vetsci 12 00440 g004
Figure 5. Bar graphs describing MetaCyc pathways in lactating Bactrian camel feces. The horizontal axis represents parities P_1 (10 female lactating camels, 1st parity), P_3 (10 female lactating camels, 3rd parity), and P_5 (10 female lactating camels, 5th parity). The vertical axis, or Sequence Number Percent, visualizes the percentage of sequences attributed to the corresponding MetaCyc pathways. The color scheme for the bar graphs, moving from top to bottom, corresponds to the colors for each MetaCyc pathway displayed on the right, ranging from the least to the most relative abundances, with ‘Other’ being an exception that did not make the top 20.
Vetsci 12 00440 g005
Figure 6. The significantly altered MetaCyc pathways of the fecal microbial community among lactating Bactrian camels. The colors green, red, and blue correspond to P_1 (10 female lactating camels, 1st parity), P_3 (10 female lactating camels, 3rd parity), and P_5 (10 female lactating camels, 5th parity), respectively. The horizontal axis denotes the MetaCyc pathways that display significant changes, each differentiated by color. The vertical axis represents the values for the MetaCyc pathways. If the letters on the bars between two groups differ, they denote significant disparity (p < 0.05); otherwise, the difference is considered insignificant.
Vetsci 12 00440 g006
Figure 7. Principal component analysis (PCA) of the MetaCyc pathways in the feces of lactating Bactrian camels. The colors green, red, and blue represent P_1 (10 female lactating camels, 1st parity), P_3 (10 female lactating camels, 3rd parity), and P_5 (10 female lactating camels, 5th parity), respectively. Each plot corresponds to a unique sample, and plots bearing the same color are representative of identical groups.
Vetsci 12 00440 g007
Figure 8. Bar graphs describing KEGG pathways at level 1 (a) and level 3 (b) in lactating Bactrian camel feces. The horizontal axis represents parities P_1 (10 female lactating camels, 1st parity), P_3 (10 female lactating camels, 3rd parity), and P_5 (10 female lactating camels, 5th parity). The vertical axis, or sequence number percentage, visualizes the percentage of sequences attributed to the corresponding Kyoto Encyclopedia of Genes and Genomes (KEGG) pathway. The color scheme for the bar graphs, moving from top to bottom, corresponds to the colors for each KEGG pathway displayed on the right, ranging from the lowest to the highest relative abundances, with ‘Other’ being an exception. At level 3, ‘Other’ signifies the cumulative percentage of all other KEGG pathways that did not constitute the top 20.
Vetsci 12 00440 g008
Figure 9. Significantly enriched KEGG pathways associated with the fecal microbial community among lactating Bactrian camels. The colors green, red, and blue correspond to P_1 (10 female lactating camels, 1st parity), P_3 (10 female lactating camels, 3rd parity), and P_5 (10 female lactating camels, 5th parity), respectively. The horizontal axis denotes the KEGG pathways that display significant changes, each differentiated by color. The vertical axis represents the values for the KEGG pathways. If the letters on the bars between two groups differ, they denote significant disparity (p < 0.05); otherwise, the difference is considered insignificant.
Vetsci 12 00440 g009
Figure 10. Principal component analysis (PCA) of the KEGG pathways in the feces of lactating Bactrian camels. The colors green, red, and blue represent P_1 (10 female lactating camels, 1st parity), P_3 (10 female lactating camels, 3rd parity), and P_5 (10 female lactating camels, 5th parity), respectively. Each plot corresponds to a unique sample, and plots bearing the same color are representative of identical groups.
Vetsci 12 00440 g010
Figure 11. Bar graphs showing the top 20 relatively abundant ECs in lactating Bactrian camel feces. The horizontal axis denotes the parities P_1 (10 female lactating camels, 1st parity), P_3 (10 female lactating camels, 3rd parity), and P_5 (10 female lactating camels, 5th parity). The vertical axis, referred to as the sequence number percentage, illustrates the percentage of sequences allocated to the associated Enzyme Commission numbers (ECs). The colors of the bar graphs, arranged from top to bottom, correspond to the colors of each EC on the right, organized from the lowest to the highest relative abundances, with ‘Other’ being an exception. ‘Other’ represents the aggregate percentage of other KEGG pathways that did not make the top 20.
Vetsci 12 00440 g011
Figure 12. ECs of the fecal microbial community significantly changed among the lactating Bactrian camels in the different groups. In this depiction, green symbolizes P_1 (10 female lactating camels in their 1st parity), red stands for P_3 (10 female lactating camels in their 3rd parity), and blue signifies P_5 (10 female lactating camels in their 5th parity). The horizontal axis denotes the ECs that exhibit substantial changes, whereas the vertical axis signifies their values for ECs. If the lettering on the bar between two groups differs, it indicates a significant variation (p < 0.05); if not, the difference is considered statistically insignificant.
Vetsci 12 00440 g012
Figure 13. Principal component analysis (PCA) of ECs in the feces of lactating Bactrian camels. In this representation, brown denotes P_1 (10 female lactating camels, first parity), Red corresponds to P_3 (10 female lactating camels, third parity), and Green signifies P_5 (10 female lactating camels, fifth parity). Each plotted point denotes a single sample, and points with identical colors are part of the same group.
Vetsci 12 00440 g013
Figure 14. Spearman’s correlation between the top 20 genera associated with the antioxidants in milk (a) and the antioxidants in serum (b) in lactating Bactrian camels. In the vertical direction, the figures represent the values for the top 20 genera in the feces, whereas the horizontal direction represents the values for the antioxidant parameters. Positive correlation coefficients are depicted in red, with darker shades indicating stronger positive correlations. Negative correlation coefficients are represented in green, with deeper shades indicating stronger negative correlations. The bar on the right displays the correlation coefficient values (r).
Vetsci 12 00440 g014
Figure 15. Spearman’s correlation between the fecal top 20 MetaCyc and the antioxidants in milk (a) and the antioxidants in serum (b) in lactating Bactrian camels. In the vertical direction, the figures represent the values for the top 20 MetaCyc in the feces, whereas the horizontal direction represents the values for the antioxidant parameters. Significant correlations (p < 0.05) are denoted by *. Positive correlation coefficients are depicted in red, with darker shades indicating stronger positive correlations. Negative correlation coefficients are rep-resented in green, with deeper shades indicating stronger negative correlations. The bar on the right displays the correlation coefficient values (r).
Vetsci 12 00440 g015
Figure 16. Spearman’ correlation between the fecal top 20 KEGG pathways and the antioxidant in milk (a), and the antioxidant in serum (b) in lactating Bactrian camel. In the vertical direction, the figures represent the values for the fecal top 20 KEGG pathways, while the horizontal direction represents the values for the antioxidant parameters. Significant correlations (p < 0.05) are denoted by *. Positive correlation coefficients are depicted in red, with darker shades indicating stronger positive correlations. Negative correlation coefficients are represented in green, with deeper shades indicating stronger negative correlations. The bar on the right displays the correlation coefficient values (r).
Vetsci 12 00440 g016
Figure 17. Spearman’s correlation between the fecal Top 20 ECs and the antioxidants in milk (a) and the antioxidants in serum (b) in lactating Bactrian camels. In the vertical direction, the figures represent the values for the top 20 ECs in the feces, whereas the horizontal direction represents the values for the antioxidant parameters. Positive correlation coefficients are depicted in red, with darker shades indicating stronger positive correlations. Negative correlation coefficients are represented in green, with deeper shades indicating stronger negative correlations. The bar on the right displays the correlation coefficient values (r).
Vetsci 12 00440 g017
Table 1. Composition and nutrient levels of the diets of lactating Bactrian camels (dry matter basis, %).
IngredientsPercentages
Corn straw34.56
Oat grass12.76
Alfalfa grass12.32
Whole-plant corn silage24.9
Concentrate14.38
NaCl0.7
Sodium bicarbonate0.38
CP9.63
ADF38
NDF54.41
Non-fiber carbohydrate24.09
Starch10.73
EE2.27
TDN56
Ca0.45
P0.31
The concentrate (flaked maize, bean cake, calcium perphosphate, and premix) was provided by Yinggesu Biotechnology Co., Ltd. (Bayannur, China). CP, crude protein. ADF, acid detergent fiber. NDF, neutral detergent fiber. EE, ether extract. Total digestible nutrients (TDN).
Table 2. Comparison of milk production and antioxidant parameters of milk from lactating Bactrian camels with different parities (n = 10).
ParametersP_1P_3P_5SEMp Value
T-AOC (mg/mL)59.74 b86.09 a56.60 b4.11940.0051
CAT (U/mL)2.87 a2.17 b2.09 b0.13630.0246
OH (U/mL)10.27 b16.75 a16.08 a0.7475<0.0001
SOD (U/mL)43.62 b68.17 a64.49 a3.61730.0084
GSH (U/mL)90.0576.8885.245.93900.6726
DPPH (μg Trolox/mL)192.28 b205.43 a203.25 a1.86100.0071
P_1 (10 female lactating camels, 1st parity); P_3 (10 female lactating camels, 3rd parity), and P_5 (10 female lactating camels, 5th parity). a, b Within a row, means with different superscripts differ significantly (p < 0.05).
Table 3. Comparison of the antioxidant parameters of the serum of lactating Bactrian camels with different parities (n = 10).
ParametersP_1P_3P_5SEMp Value
T-AOC (mg/mL)4.82 b5.30 a4.93 b0.0535<0.0001
CAT (U/mL)6.636.157.640.26000.0609
OH (U/mL)9.62 a6.02 b6.50 b0.49500.0017
SOD (U/mL)13.64 a7.97 c11.50 b0.5144<0.0001
GSH (U/mL)26.0524.4924.580.68040.6000
DPPH (μg Trolox/mL)116.59 b126.04 a121.05 b16.1090.0019
P_1 (10 female lactating camels, 1st parity); P_3 (10 female lactating camels, 3rd parity), and P_5 (10 female lactating camels, 5th parity). a, b, c Within a row, means with different superscripts differ significantly (p < 0.05).
Table 4. Comparison of alpha diversity indices among groups of the fecal microbial community in lactating Bactrian camels with different parities (n = 10).
VariableGroup 1Group 2p Value
faith_pd *P_5P_31.000
P_5P_10.796
P_3P_10.853
Observed OTUsP_5P_30.143
P_5P_10.089
P_3P_10.247
shannon_entropyP_5P_30.393
P_5 aP_1 b0.015
P_3 aP_1 b0.015
SimpsonP_5P_30.481
P_5 aP_1 b0.023
P_3P_10.089
* faith_pd represents Faith’s phylogenetic diversity index. P_1 (10 female lactating camels, 1st parity); P_3 (10 female lactating camels, 3rd parity), and P_5 (10 female lactating camels, 5th parity). a, b Within a row, means with different superscripts differ significantly (p < 0.05).
Disclaimer/Publisher’s Note: The statements, opinions and data contained in all publications are solely those of the individual author(s) and contributor(s) and not of MDPI and/or the editor(s). MDPI and/or the editor(s) disclaim responsibility for any injury to people or property resulting from any ideas, methods, instructions or products referred to in the content.

