
Effect of the Season on Blood Changes of Oxidative Stress Index in the Italian Mediterranean Buffalo (Bubalis bubalis)
 , , , and
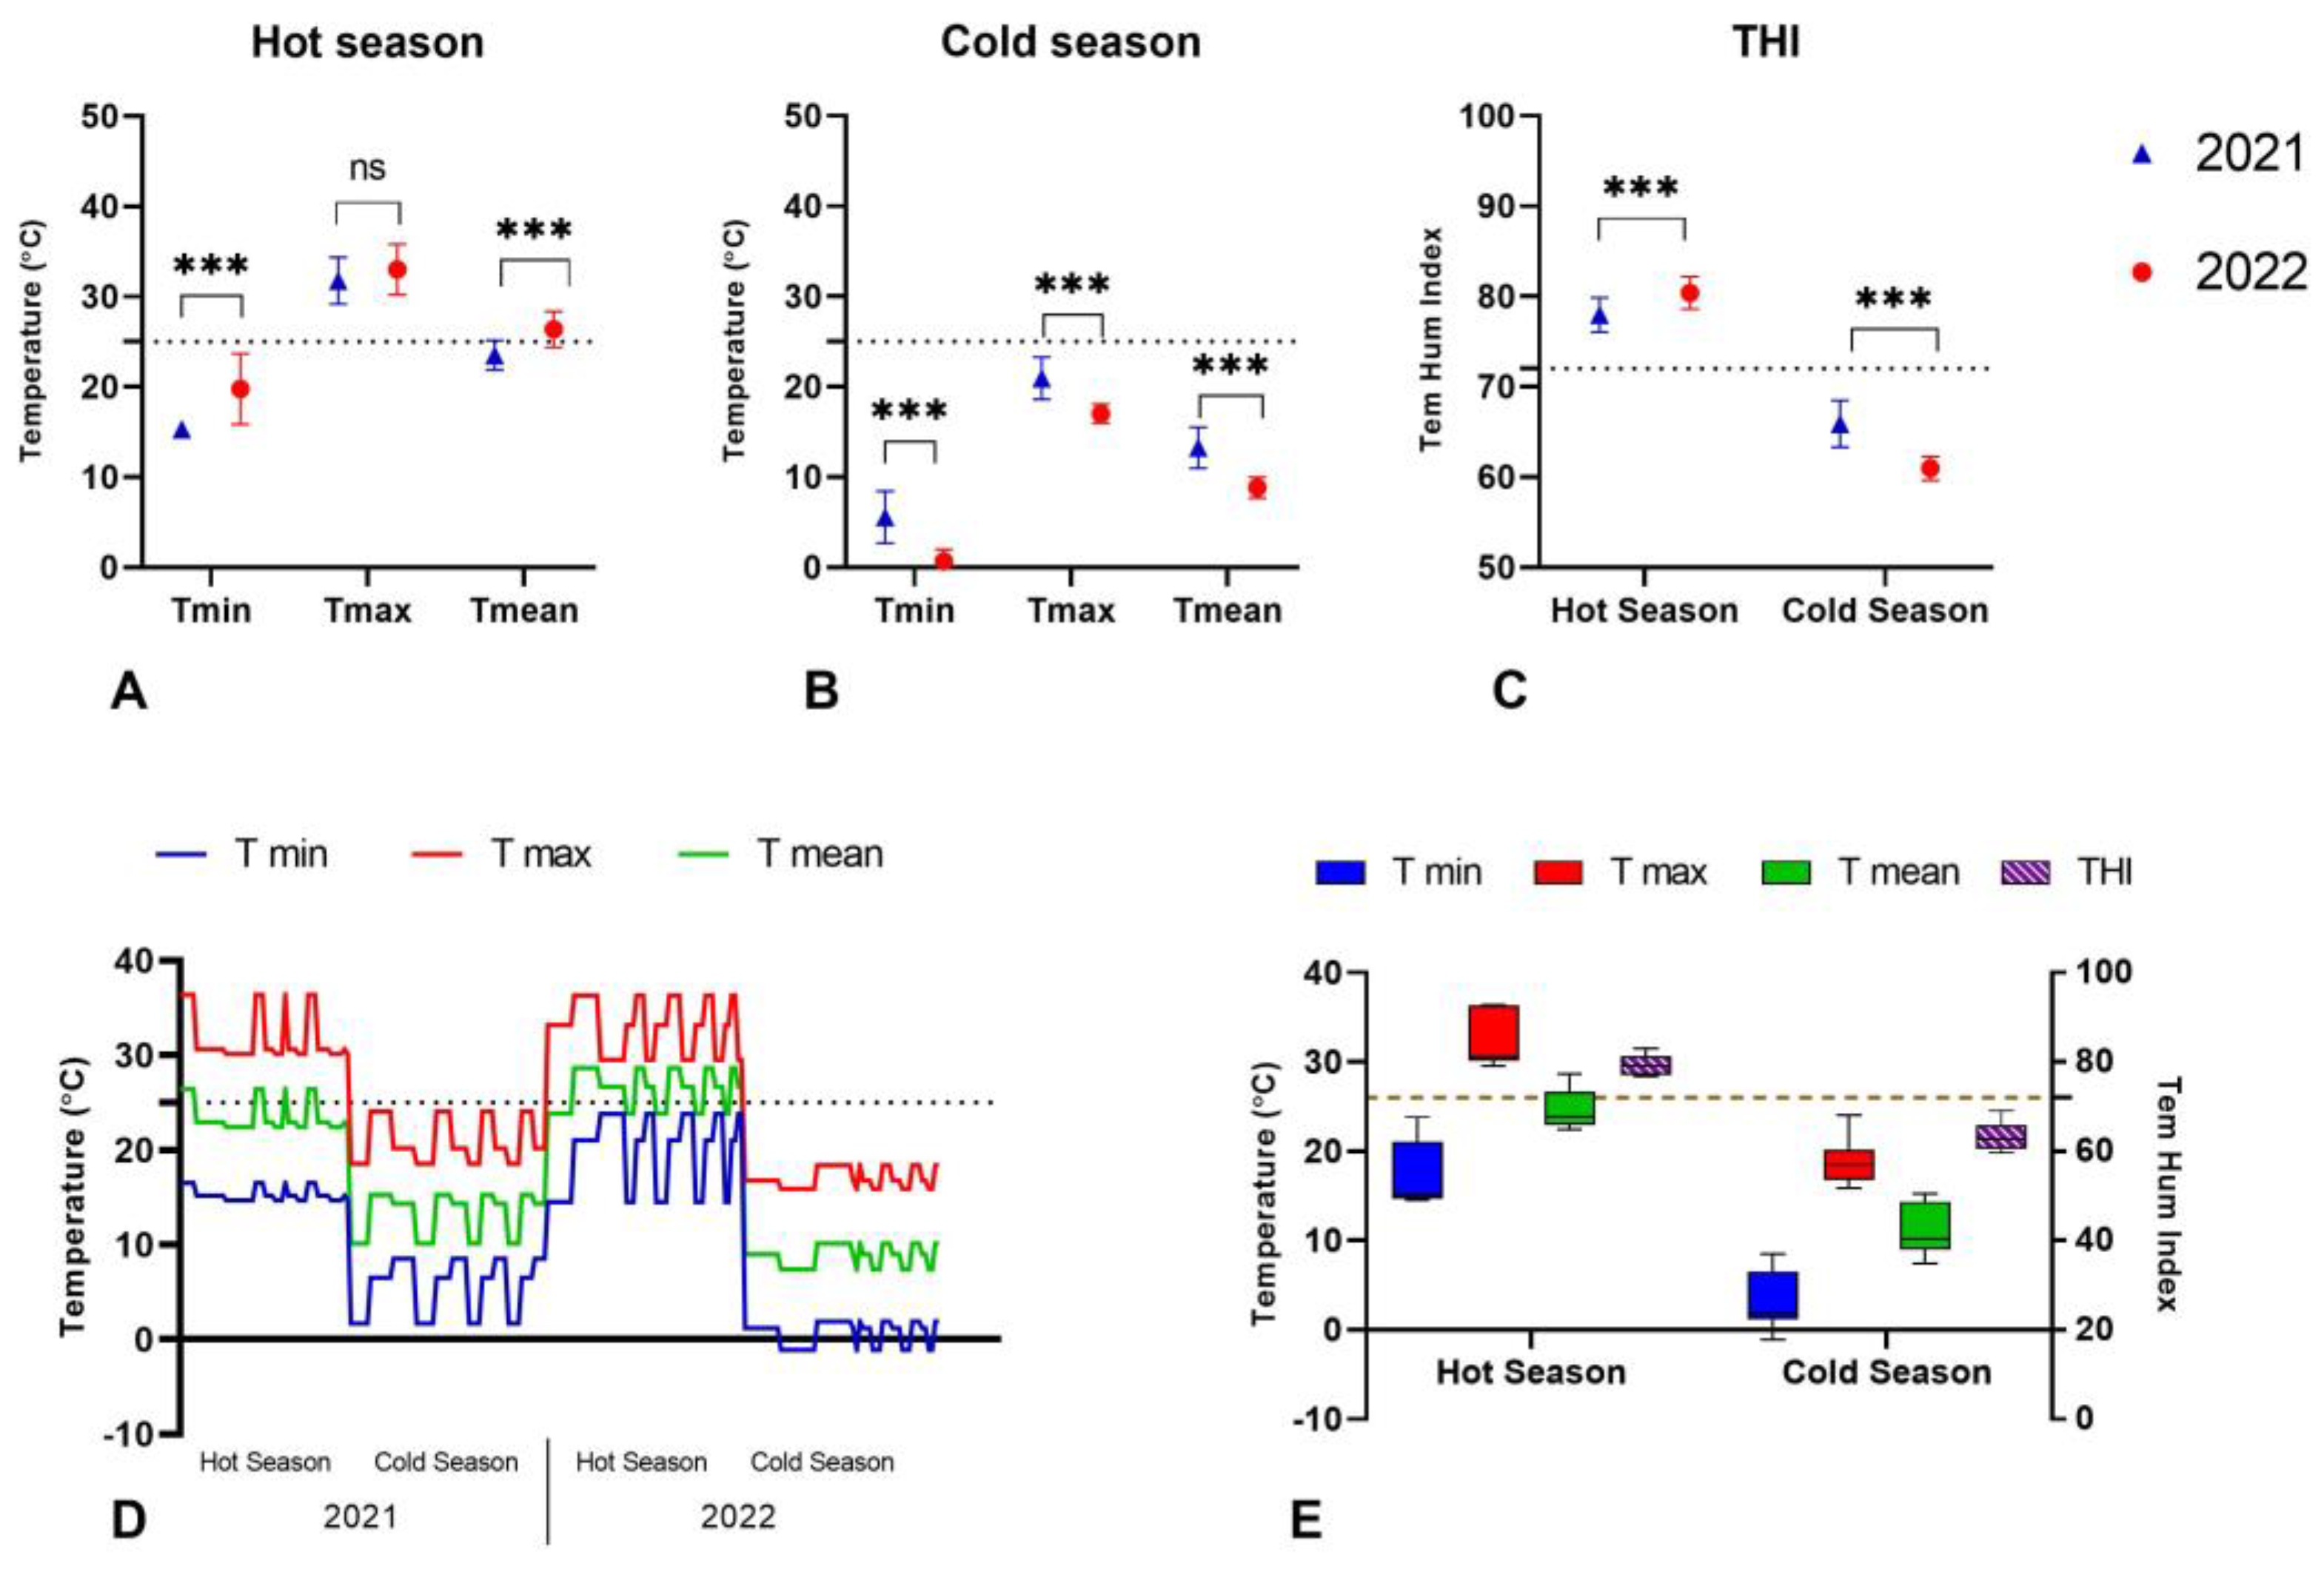
Abstract
Simple Summary
Abstract
1. Introduction
2. Materials and Methods
2.1. Animals and Housing
2.2. Measurement of Physiological Variables
2.3. Enviromental Conditions
2.4. Analysis of Oxidants and Antioxidants
2.5. Analysis of Circulating Levels of Vitamin D
2.6. Statistical Analysis
3. Results
3.1. Temperatures Recorded in the Hot and Cold Weather Seasons in 2021 and 2022
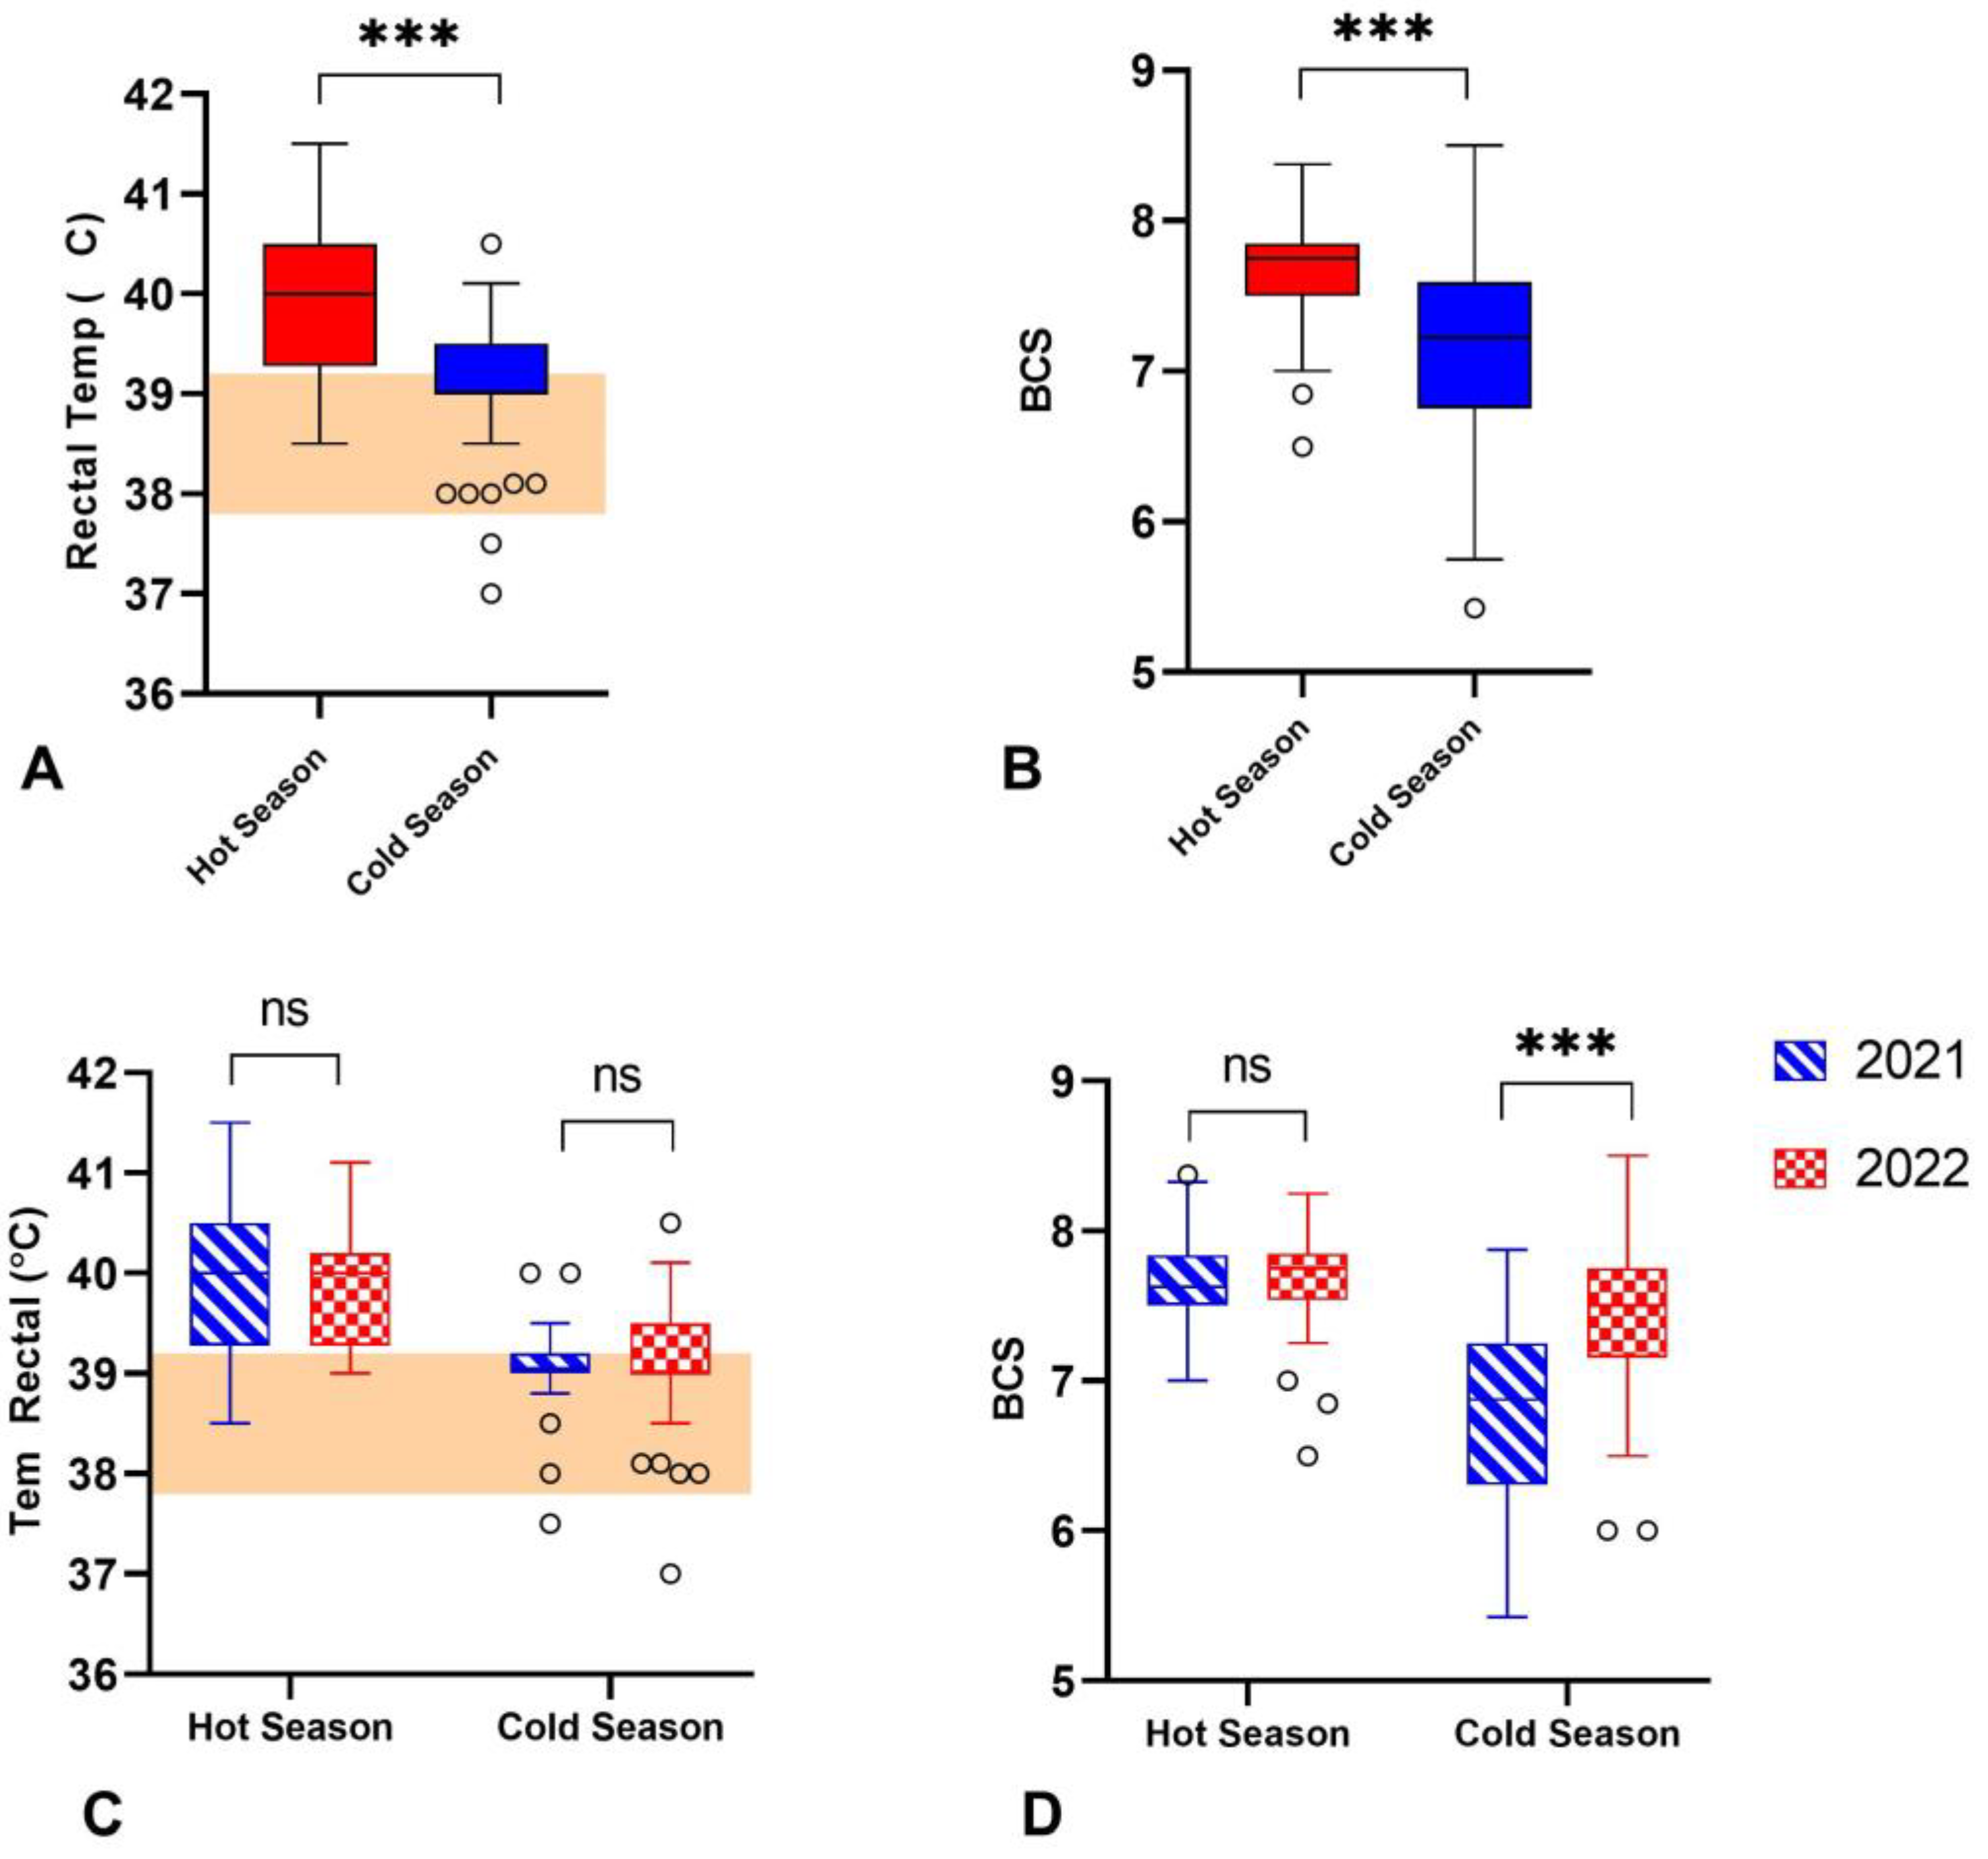
3.2. Physiological Variables of Buffaloes during Hot and Cold Weather
3.3. Effect of Heat Stress on the Oxidative Stress Response
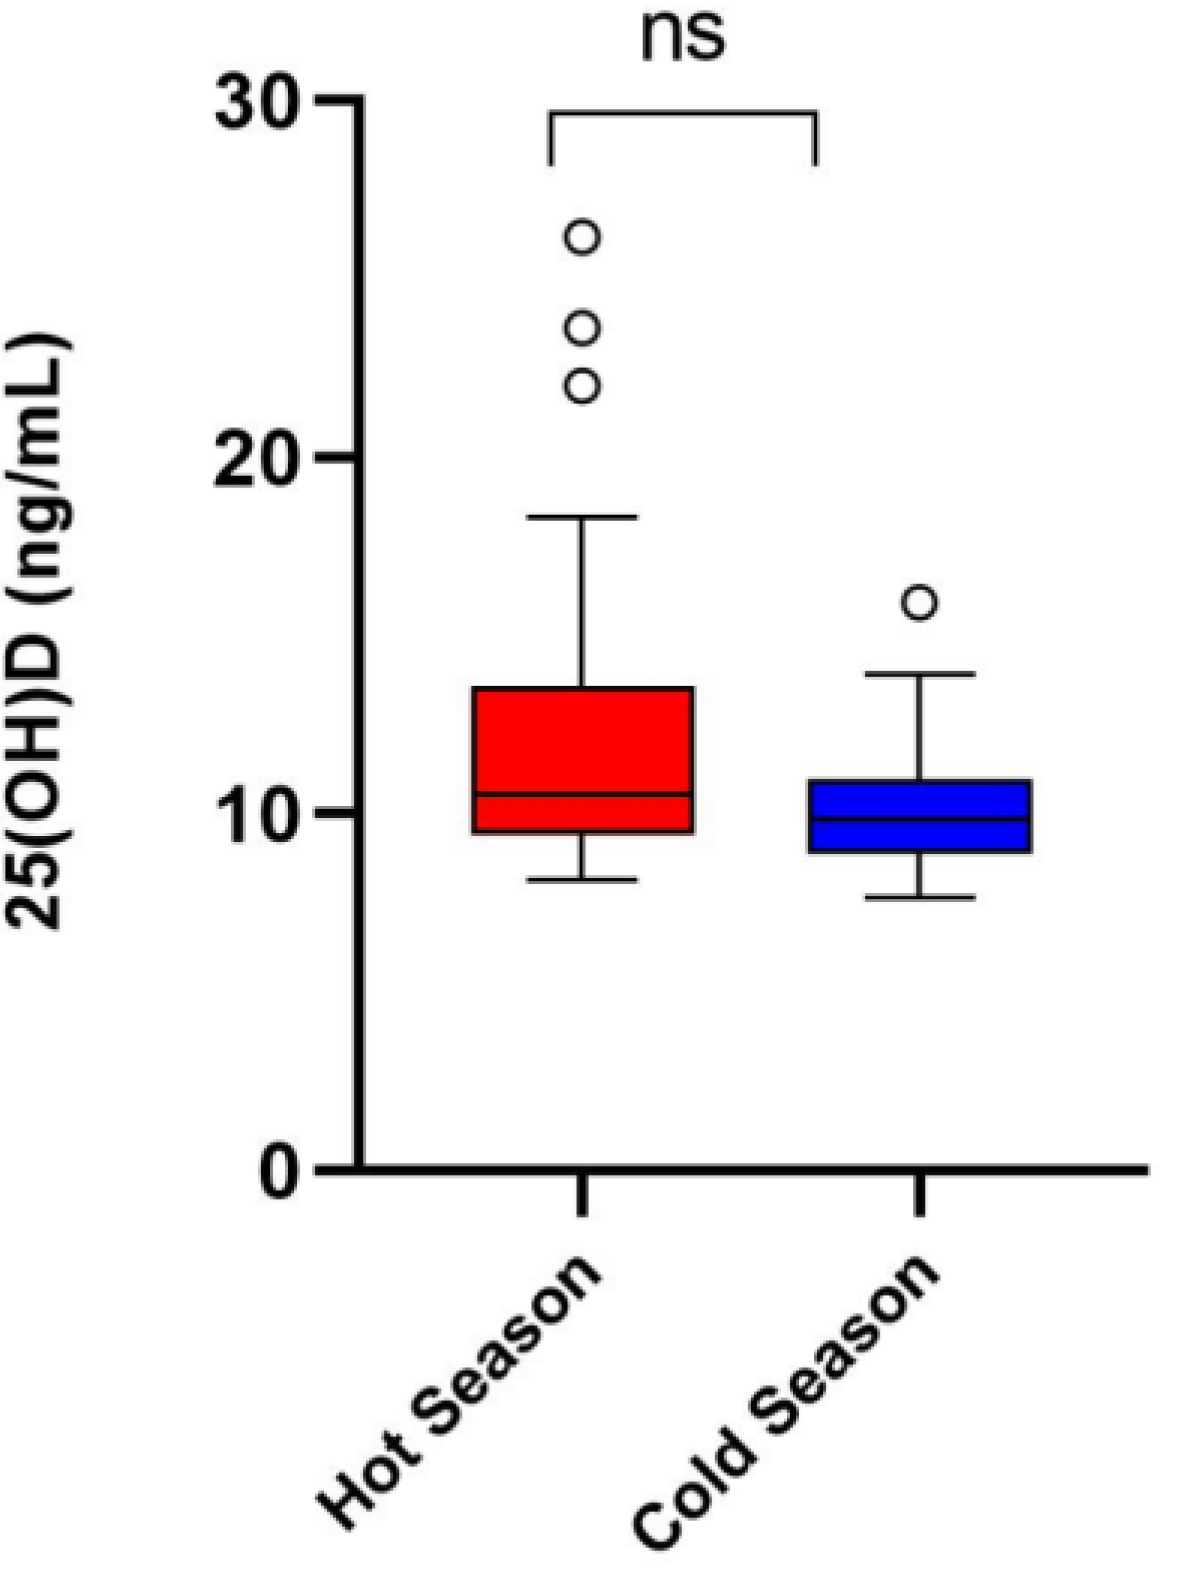
3.4. Vitamin D (25OHD) Levels Observed during the Hot and Cold Weather Seasons
3.5. Correlation Analysis for All the Variables
4. Discussion
5. Conclusions
Author Contributions
Funding
Institutional Review Board Statement
Informed Consent Statement
Data Availability Statement
Acknowledgments
Conflicts of Interest
References
- IPCC. AR6 Synthesis Report: Climate Change 2023; IPCC: Geneva, Switzerland, 2023. [Google Scholar]
- Ummenhofer, C.C.; Meehl, G.A. Extreme weather and climate events with ecological relevance: A review. Philos. Trans. R. Soc. Lond. Ser. B Biol. Sci. 2017, 372, 20160135. [Google Scholar] [CrossRef] [PubMed]
- Napolitano, F.; De Rosa, G.; Chay-Canul, A.; Álvarez-Macías, A.; Pereira, A.M.F.; Bragaglio, A.; Mora-Medina, P.; Rodríguez-González, D.; García-Herrera, R.; Hernández-Ávalos, I.; et al. The Challenge of Global Warming in Water Buffalo Farming: Physiological and Behavioral Aspects and Strategies to Face Heat Stress. Animals 2023, 13, 3103. [Google Scholar] [CrossRef] [PubMed]
- Rojas-Downing, M.M.; Nejadhashemi, A.P.; Harrigan, T.; Woznicki, S.A. Climate change and livestock: Impacts, adaptation, and mitigation. Clim. Risk Manag. 2017, 16, 145–163. [Google Scholar] [CrossRef]
- Henry, B.K.; Eckard, R.J.; Beauchemin, K.A. Review: Adaptation of ruminant livestock production systems to climate changes. Animal 2018, 12, s445–s456. [Google Scholar] [CrossRef] [PubMed]
- Marai, I.F.M.; Haeeb, A.A.M. Buffalo’s biological functions as affected by heat stress—A review. Livest. Sci. 2010, 127, 89–109. [Google Scholar] [CrossRef]
- Hussain, S.I.; Ahmad, N.; Ahmed, S.; Akhter, M.; Shahid, M.Q. Heat Stress Mitigation: Impact of Increased Cooling Sessions on Milk Yield and Welfare of Dairy Buffaloes in a Semiarid Summer. Animals 2023, 13, 3315. [Google Scholar] [CrossRef]
- Sejian, V.; Bhatta, R.; Gaughan, J.B.; Dunshea, F.R.; Lacetera, N. Review: Adaptation of animals to heat stress. Animal 2018, 12, s431–s444. [Google Scholar] [CrossRef]
- Mishra, S.R. Thermoregulatory responses in riverine buffaloes against heat stress: An updated review. J. Therm. Biol. 2021, 96, 102844. [Google Scholar] [CrossRef]
- Borghese, A.; Chiariotti, A.; Barile, V.L. Buffalo in the World: Situation and Perspectives. In Biotechnological Applications in Buffalo Research; Chauhan, M.S., Selokar, N., Eds.; Springer: Singapore, 2022; pp. 3–31. [Google Scholar]
- Guo, M.; Hendricks, G. 14—Improving buffalo milk. In Improving the Safety and Quality of Milk; Griffiths, M.W., Ed.; Woodhead Publishing: Sawston, UK, 2010; pp. 402–416. [Google Scholar]
- Minervino, A.H.H.; Zava, M.; Vecchio, D.; Borghese, A. Bubalus bubalis: A Short Story. Front. Vet. Sci. 2020, 7, 570413. [Google Scholar] [CrossRef]
- Failla, S. Buffalo meat quality, processing, and marketing: Harnessing its benefits and nutriceutical potential. Rev. Cient. Fac. Vet. 2023, 33, 105. [Google Scholar]
- Slimen, I.B.; Najar, T.; Ghram, A.; Dabbebi, H.; Ben Mrad, M.; Abdrabbah, M. Reactive oxygen species, heat stress and oxidative-induced mitochondrial damage. A review. Int. J. Hyperth. 2014, 30, 513–523. [Google Scholar] [CrossRef] [PubMed]
- Son, A.R.; Kim, S.H.; Islam, M.; Miguel, M.; Naing, Y.P.; Lee, S.S. Effect of organic mineral supplementation in reducing oxidative stress in Holstein calves during short-term heat stress and recovery conditions. J. Anim. Sci. Biotechnol. 2023, 14, 156. [Google Scholar] [CrossRef] [PubMed]
- Ashrafi, H.; Sadeghi, A.A.; Chamani, M. Effect of Organic Selenium Supplementation on the Antioxidant Status, Immune Response, and the Relative Expression of IL-2 and IFN-γ Genes in Ewes During the Hot Season. Biol. Trace Elem. Res. 2023. Available online: https://link.springer.com/article/10.1007/s12011-023-03798-7 (accessed on 20 December 2023). [CrossRef]
- Montilla, S.I.; Johnson, T.P.; Pearce, S.C.; Gardan-Salmon, D.; Gabler, N.K.; Ross, J.W.; Rhoads, R.P.; Baumgard, L.H.; Lonergan, S.M.; Selsby, J.T. Heat stress causes oxidative stress but not inflammatory signaling in porcine skeletal muscle. Temperature 2014, 1, 42–50. [Google Scholar] [CrossRef]
- Lan, Q.; Cao, Z.; Yang, X.; Gu, Z. Physiological and Proteomic Responses of Dairy Buffalo to Heat Stress Induced by Different Altitudes. Metabolites 2022, 12, 909. [Google Scholar] [CrossRef] [PubMed]
- Kıran, T.R.; Otlu, O.; Karabulut, A.B. Oxidative stress and antioxidants in health and disease. J. Lab. Med. 2023, 47, 1–11. [Google Scholar] [CrossRef]
- Sordillo, L.M.; Aitken, S.L. Impact of oxidative stress on the health and immune function of dairy cattle. Vet. Immunol. Immunopathol. 2009, 128, 104–109. [Google Scholar] [CrossRef]
- Lykkesfeldt, J.; Svendsen, O. Oxidants and antioxidants in disease: Oxidative stress in farm animals. Vet. J. 2007, 173, 502–511. [Google Scholar] [CrossRef]
- Gonzalez-Rivas, P.A.; Chauhan, S.S.; Ha, M.; Fegan, N.; Dunshea, F.R.; Warner, R.D. Effects of heat stress on animal physiology, metabolism, and meat quality: A review. Meat Sci. 2020, 162, 108025. [Google Scholar] [CrossRef]
- Halliwell, B.; Whiteman, M. Measuring reactive species and oxidative damage in vivo and in cell culture: How should you do it and what do the results mean? Br. J. Pharmacol. 2004, 142, 231–255. [Google Scholar] [CrossRef]
- Palmieri, B.; Sblendorio, V. Oxidative stress tests: Overview on reliability and use. Part II. Eur. Rev. Med. Pharmacol. Sci. 2007, 11, 383–399. [Google Scholar]
- Sharma, R.K.; Pasqualotto, F.F.; Nelson, D.R.; Thomas, A.J., Jr.; Agarwal, A. The reactive oxygen species-total antioxidant capacity score is a new measure of oxidative stress to predict male infertility. Hum. Reprod. 1999, 14, 2801–2807. [Google Scholar] [CrossRef]
- Abuelo, A.; Hernández, J.; Benedito, J.L.; Castillo, C. Oxidative stress index (OSi) as a new tool to assess redox status in dairy cattle during the transition period. Animal 2013, 7, 1374–1378. [Google Scholar] [CrossRef]
- Oikonomidis, I.L.; Kiosis, E.A.; Brozos, C.N.; Kritsepi-Konstantinou, M.G. Reference intervals for serum reactive oxygen metabolites, biological antioxidant potential, and oxidative stress index in adult rams. Am. J. Vet. Res. 2017, 78, 274–278. [Google Scholar] [CrossRef]
- Shono, S.; Gin, A.; Minowa, F.; Okubo, K.; Mochizuki, M. The Oxidative Stress Markers of Horses-the Comparison with Other Animals and the Influence of Exercise and Disease. Animals 2020, 10, 617. [Google Scholar] [CrossRef]
- Hady, M.M.; Melegy, T.M.; Anwar, S.R. Impact of the Egyptian summer season on oxidative stress biomarkers and some physiological parameters in crossbred cows and Egyptian buffaloes. Vet. World 2018, 11, 771–778. [Google Scholar] [CrossRef]
- Yousif, H.M.; El Mahdy, A.M.; Hassan, M.F.; Mansour, M.K. Overview on Antioxidant and Oxidative Stress Markers after Garlic Oil Supplement in Suckling Buffalo Calves. Kafkas Univ. Vet. Fak. Derg. 2024, 30, 73–80. [Google Scholar] [CrossRef]
- Kibler, H.H. Thermal Effects of Various Temperature-Humidity Combinations on Holstein Cattle as Measured by Eight Physiological Responses. Univ. Mo. Agric. Exp. Stn. Res. Bull. Mo. Agric. Exp. Stn. 1964, 862, 1–42. [Google Scholar]
- Rushdi, M.; Hamed, M.I.; Ibrahim, D.R.; Rateb, H.Z. Reference Intervals for Rectal Temperature in Water Buffalo (Bubalus bubalis) Heifers. J. Adv. Vet. Res. 2021, 11, 180–182. [Google Scholar]
- Sciorsci, R.L.; Galgano, M.; Mutinati, M.; Rizzo, A. Oxidative state in the estrus cycle of the buffaloes: A preliminary study. Trop. Anim. Health Prod. 2020, 52, 1331–1334. [Google Scholar] [CrossRef]
- Megahed, G.A.; Anwar, M.M.; Wasfy, S.I.; Hammadeh, M.E. Influence of heat stress on the cortisol and oxidant-antioxidants balance during oestrous phase in buffalo-cows (Bubalus bubalis): Thermo-protective role of antioxidant treatment. Reprod. Domest. Anim. Zuchthyg. 2008, 43, 672–677. [Google Scholar] [CrossRef]
- Sauerwein, H.; Blees, T.; Zamarian, V.; Catozzi, C.; Müller, U.; Sadri, H.; Dänicke, S.; Frahm, J.; Ceciliani, F. Acute phase proteins and markers of oxidative status in water buffalos during the transition from late pregnancy to early lactation. Vet. Immunol. Immunopathol. 2020, 228, 110113. [Google Scholar] [CrossRef] [PubMed]
- Petrocchi Jasinski, F.; Evangelista, C.; Basiricò, L.; Bernabucci, U. Responses of Dairy Buffalo to Heat Stress Conditions and Mitigation Strategies: A Review. Animals 2023, 13, 1260. [Google Scholar] [CrossRef] [PubMed]
- Rejeb, M.; Sadraoui, R.; Najar, T.; Ben M’rad, M. A Complex Interrelationship between Rectal Temperature and Dairy Cows’ Performance under Heat Stress Conditions. Open J. Anim. Sci. 2016, 6, 24–30. [Google Scholar] [CrossRef]
- Li, M.; Hassan, F.U.; Tang, Z.; Guo, Y.; Liang, X.; Peng, L.; Xie, H.; Yang, C. Physiological, oxidative and metabolic responses of lactating water buffaloes to tropical climate of South China. Vet. Med. Sci. 2021, 7, 1696–1706. [Google Scholar] [CrossRef] [PubMed]
- Li, M.; Hassan, F.U.; Guo, Y.; Tang, Z.; Liang, X.; Xie, F.; Peng, L.; Yang, C. Seasonal Dynamics of Physiological, Oxidative and Metabolic Responses in Non-lactating Nili-Ravi Buffaloes Under Hot and Humid Climate. Front. Vet. Sci. 2020, 7, 622. [Google Scholar] [CrossRef] [PubMed]
- Wang, J.; Li, J.; Wang, F.; Xiao, J.; Wang, Y.; Yang, H.; Li, S.; Cao, Z. Heat stress on calves and heifers: A review. J. Anim. Sci. Biotechnol. 2020, 11, 79. [Google Scholar] [CrossRef] [PubMed]
- Shenhe, L.; Jun, L.; Zipeng, L.; Tingxian, D.; Rehman, Z.U.; Zichao, Z.; Liguo, Y. Effect of season and breed on physiological and blood parameters in buffaloes. J. Dairy Res. 2018, 85, 181–184. [Google Scholar] [CrossRef] [PubMed]
- Tufarelli, V.; Colonna, M.A.; Losacco, C.; Puvača, N. Biological Health Markers Associated with Oxidative Stress in Dairy Cows during Lactation Period. Metabolites 2023, 13, 405. [Google Scholar] [CrossRef]
- Celi, P. Biomarkers of oxidative stress in ruminant medicine. Immunopharmacol. Immunotoxicol. 2011, 33, 233–240. [Google Scholar] [CrossRef]
- Halliwell, B.; Chirico, S. Lipid peroxidation: Its mechanism, measurement, and significance. Am. J. Clin. Nutr. 1993, 57, 715S–724S, discussion 724S–725S. [Google Scholar] [CrossRef] [PubMed]
- De Rosa, G.; Barile, V.L.; Barone, C.; Lambiase, C.; Serrapica, F.; De Matteis, G.; Rossi, E.; Pacelli, C. Effect of Arthrospira platensis (Spirulina) as a dietary supplement during transition period in dairy buffaloes. Rev. Cient. Fac. Vet. 2023, 33, 186. [Google Scholar]
- Tudisco, R.; Morittu, V.M.; Musco, N.; Grossi, M.; Iommelli, P.; D’Aniello, B.; Ferrara, M.; Infascelli, F.; Lombardi, P. Effects of Sorghum Silage in Lactating Buffalo Cow Diet: Biochemical Profile, Milk Yield, and Quality. Agriculture 2021, 11, 57. [Google Scholar] [CrossRef]
- Santillo, A.; Ciliberti, M.G.; Ciampi, F.; Luciano, G.; Natalello, A.; Menci, R.; Caccamo, M.; Sevi, A.; Albenzio, M. Feeding tannins to dairy cows in different seasons improves the oxidative status of blood plasma and the antioxidant capacity of cheese. J. Dairy Sci. 2022, 105, 8609–8620. [Google Scholar] [CrossRef]
- Ozarda, Y. Establishing and using reference intervals. Turk. J. Biochem. 2020, 45, 1–10. [Google Scholar] [CrossRef]
- Ruiz-González, A.; Suissi, W.; Baumgard, L.H.; Martel-Kennes, Y.; Chouinard, P.Y.; Gervais, R.; Rico, D.E. Increased dietary vitamin D(3) and calcium partially alleviate heat stress symptoms and inflammation in lactating Holstein cows independent of dietary concentrations of vitamin E and selenium. J. Dairy Sci. 2023, 106, 3984–4001. [Google Scholar] [CrossRef]
- Nelson, C.D.; Reinhardt, T.A.; Lippolis, J.D.; Sacco, R.E.; Nonnecke, B.J. Vitamin D signaling in the bovine immune system: A model for understanding human vitamin D requirements. Nutrients 2012, 4, 181–196. [Google Scholar] [CrossRef] [PubMed]
- Chen, T.C.; Chimeh, F.; Lu, Z.; Mathieu, J.; Person, K.S.; Zhang, A.; Kohn, N.; Martinello, S.; Berkowitz, R.; Holick, M.F. Factors that influence the cutaneous synthesis and dietary sources of vitamin D. Arch. Biochem. Biophys. 2007, 460, 213–217. [Google Scholar] [CrossRef] [PubMed]


Disclaimer/Publisher’s Note: The statements, opinions and data contained in all publications are solely those of the individual author(s) and contributor(s) and not of MDPI and/or the editor(s). MDPI and/or the editor(s) disclaim responsibility for any injury to people or property resulting from any ideas, methods, instructions or products referred to in the content. |
© 2024 by the authors. Licensee MDPI, Basel, Switzerland. This article is an open access article distributed under the terms and conditions of the Creative Commons Attribution (CC BY) license (https://creativecommons.org/licenses/by/4.0/).
Share and Cite
De Matteis, G.; Flores-Villalva, S.; Rossi, E.; La Mantia, M.C.; Steri, R.; Barile, V.L.; Meo Zilio, D. Effect of the Season on Blood Changes of Oxidative Stress Index in the Italian Mediterranean Buffalo (Bubalis bubalis). Vet. Sci. 2024, 11, 116. https://doi.org/10.3390/vetsci11030116
De Matteis G, Flores-Villalva S, Rossi E, La Mantia MC, Steri R, Barile VL, Meo Zilio D. Effect of the Season on Blood Changes of Oxidative Stress Index in the Italian Mediterranean Buffalo (Bubalis bubalis). Veterinary Sciences. 2024; 11(3):116. https://doi.org/10.3390/vetsci11030116
Chicago/Turabian StyleDe Matteis, Giovanna, Susana Flores-Villalva, Emanuela Rossi, Maria Chiara La Mantia, Roberto Steri, Vittoria Lucia Barile, and David Meo Zilio. 2024. "Effect of the Season on Blood Changes of Oxidative Stress Index in the Italian Mediterranean Buffalo (Bubalis bubalis)" Veterinary Sciences 11, no. 3: 116. https://doi.org/10.3390/vetsci11030116
APA StyleDe Matteis, G., Flores-Villalva, S., Rossi, E., La Mantia, M. C., Steri, R., Barile, V. L., & Meo Zilio, D. (2024). Effect of the Season on Blood Changes of Oxidative Stress Index in the Italian Mediterranean Buffalo (Bubalis bubalis). Veterinary Sciences, 11(3), 116. https://doi.org/10.3390/vetsci11030116