

Effects of Caffeic Acid Phenethyl Ester on Embryonic Development Through Regulation of Mitochondria and Endoplasmic Reticulum

Simple Summary
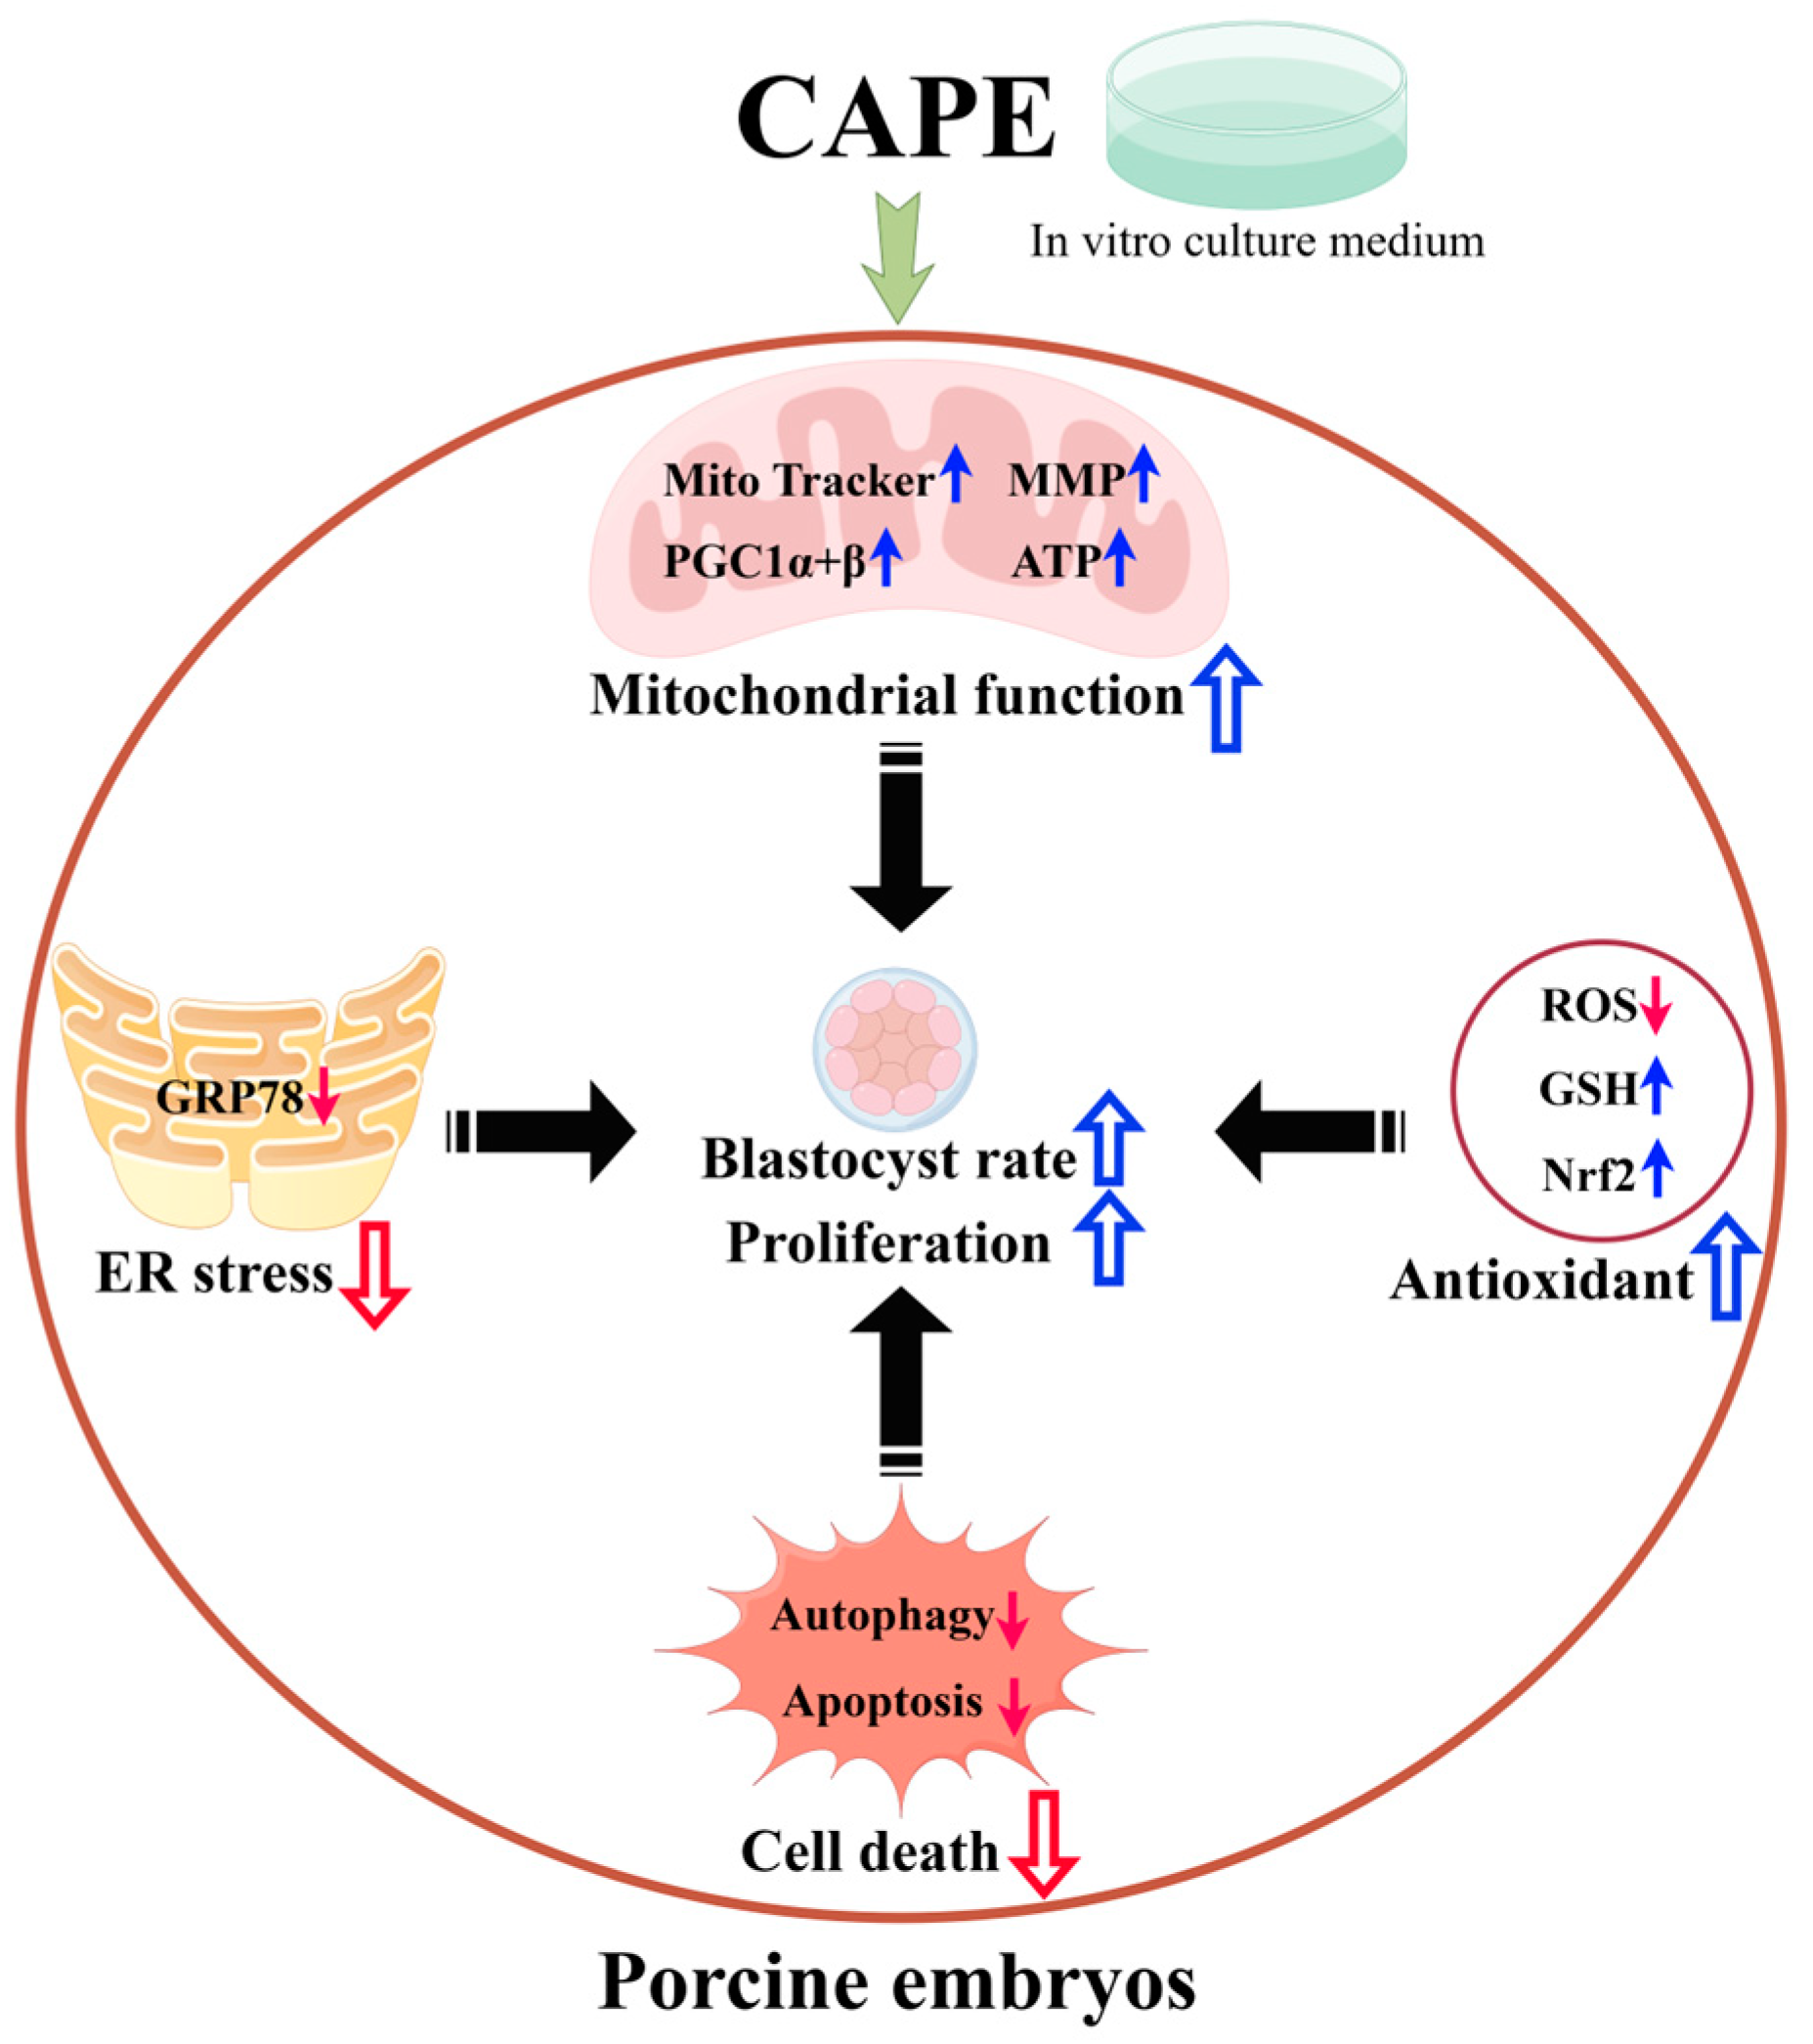
Abstract
1. Introduction
2. Materials and Methods
2.1. Oocyte Collection and In Vitro Maturation (IVM)
2.2. Parthenogenetic Activation and In Vitro Embryo Production
2.3. Determination of Changes for Glutathione (GSH) and ROS Levels
2.4. Mitochondrial Distribution and Membrane Potential Assays
2.5. Determination of ATP Content
2.6. Proliferation Assay
2.7. TUNEL Assay
2.8. Immunofluorescence Staining
2.9. Quantitative Reverse Transcription-Polymerase Chain Reaction (RT-qPCR)
2.10. Statistical Analysis
3. Results
3.1. Effects of Different CAPE Concentrations on the Formation of Early Embryonic Blasto-Cysts In Vitro
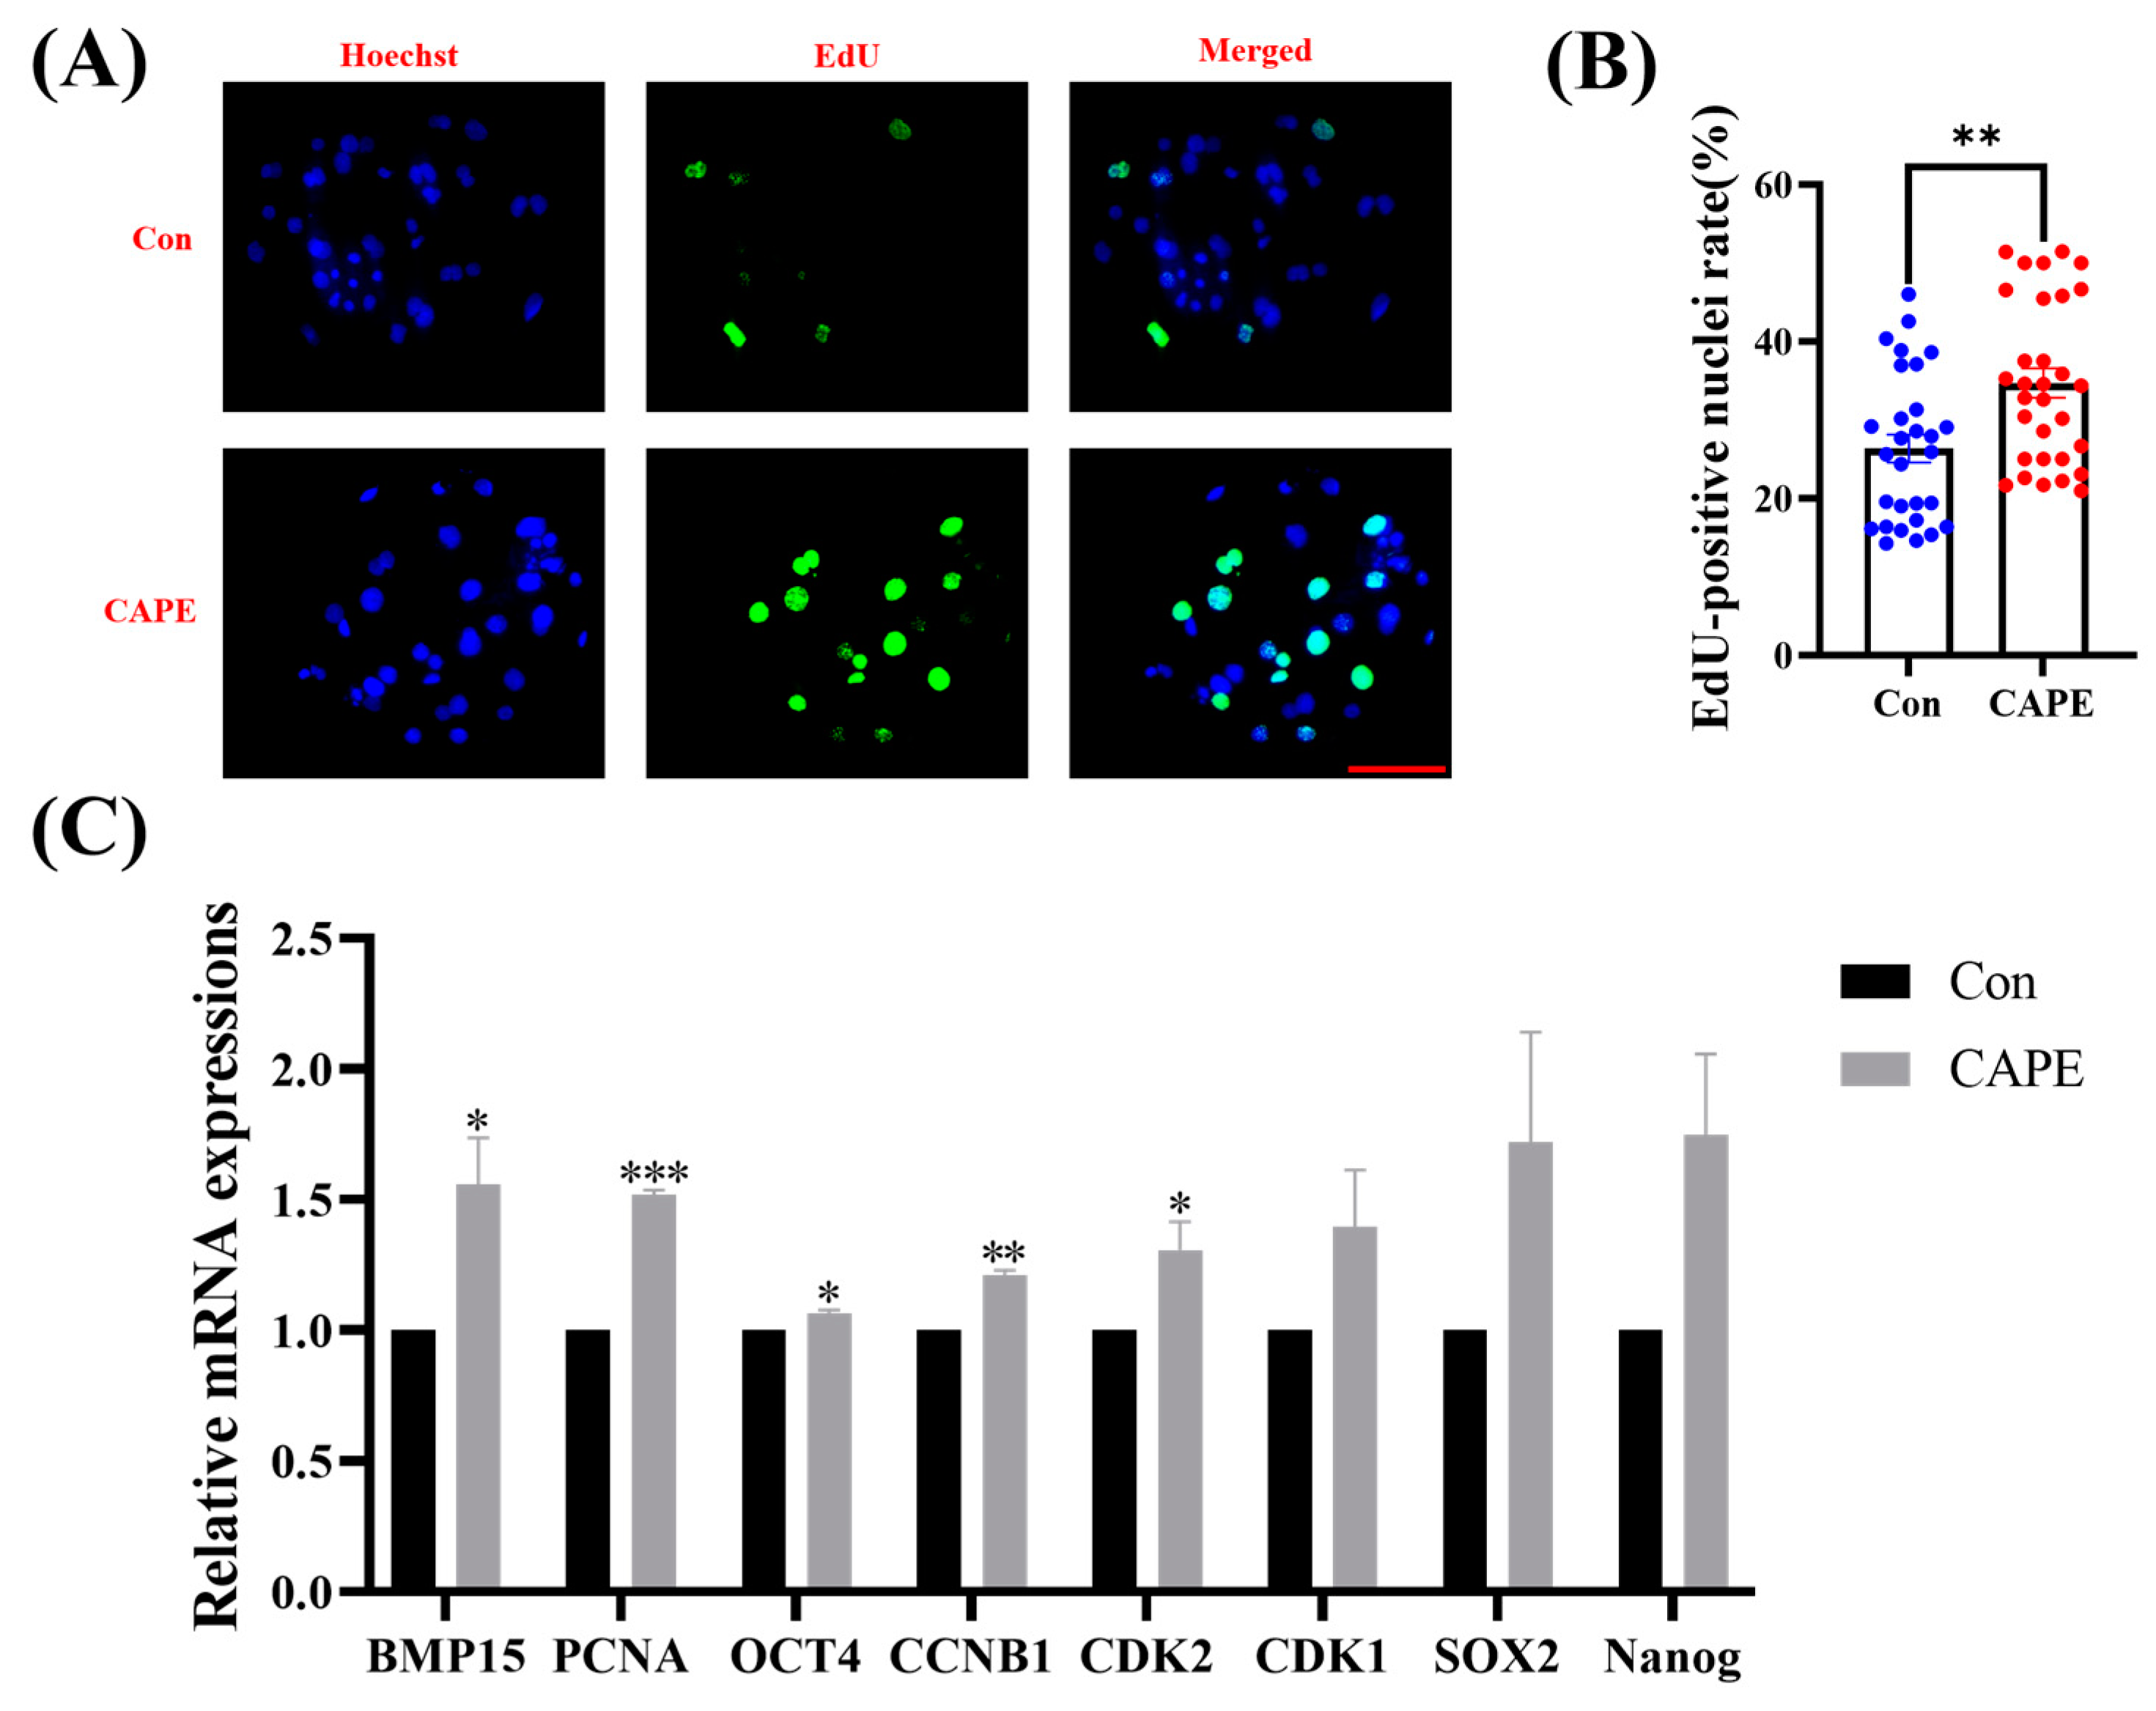
3.2. CAPE Improves Early Embryo Proliferation
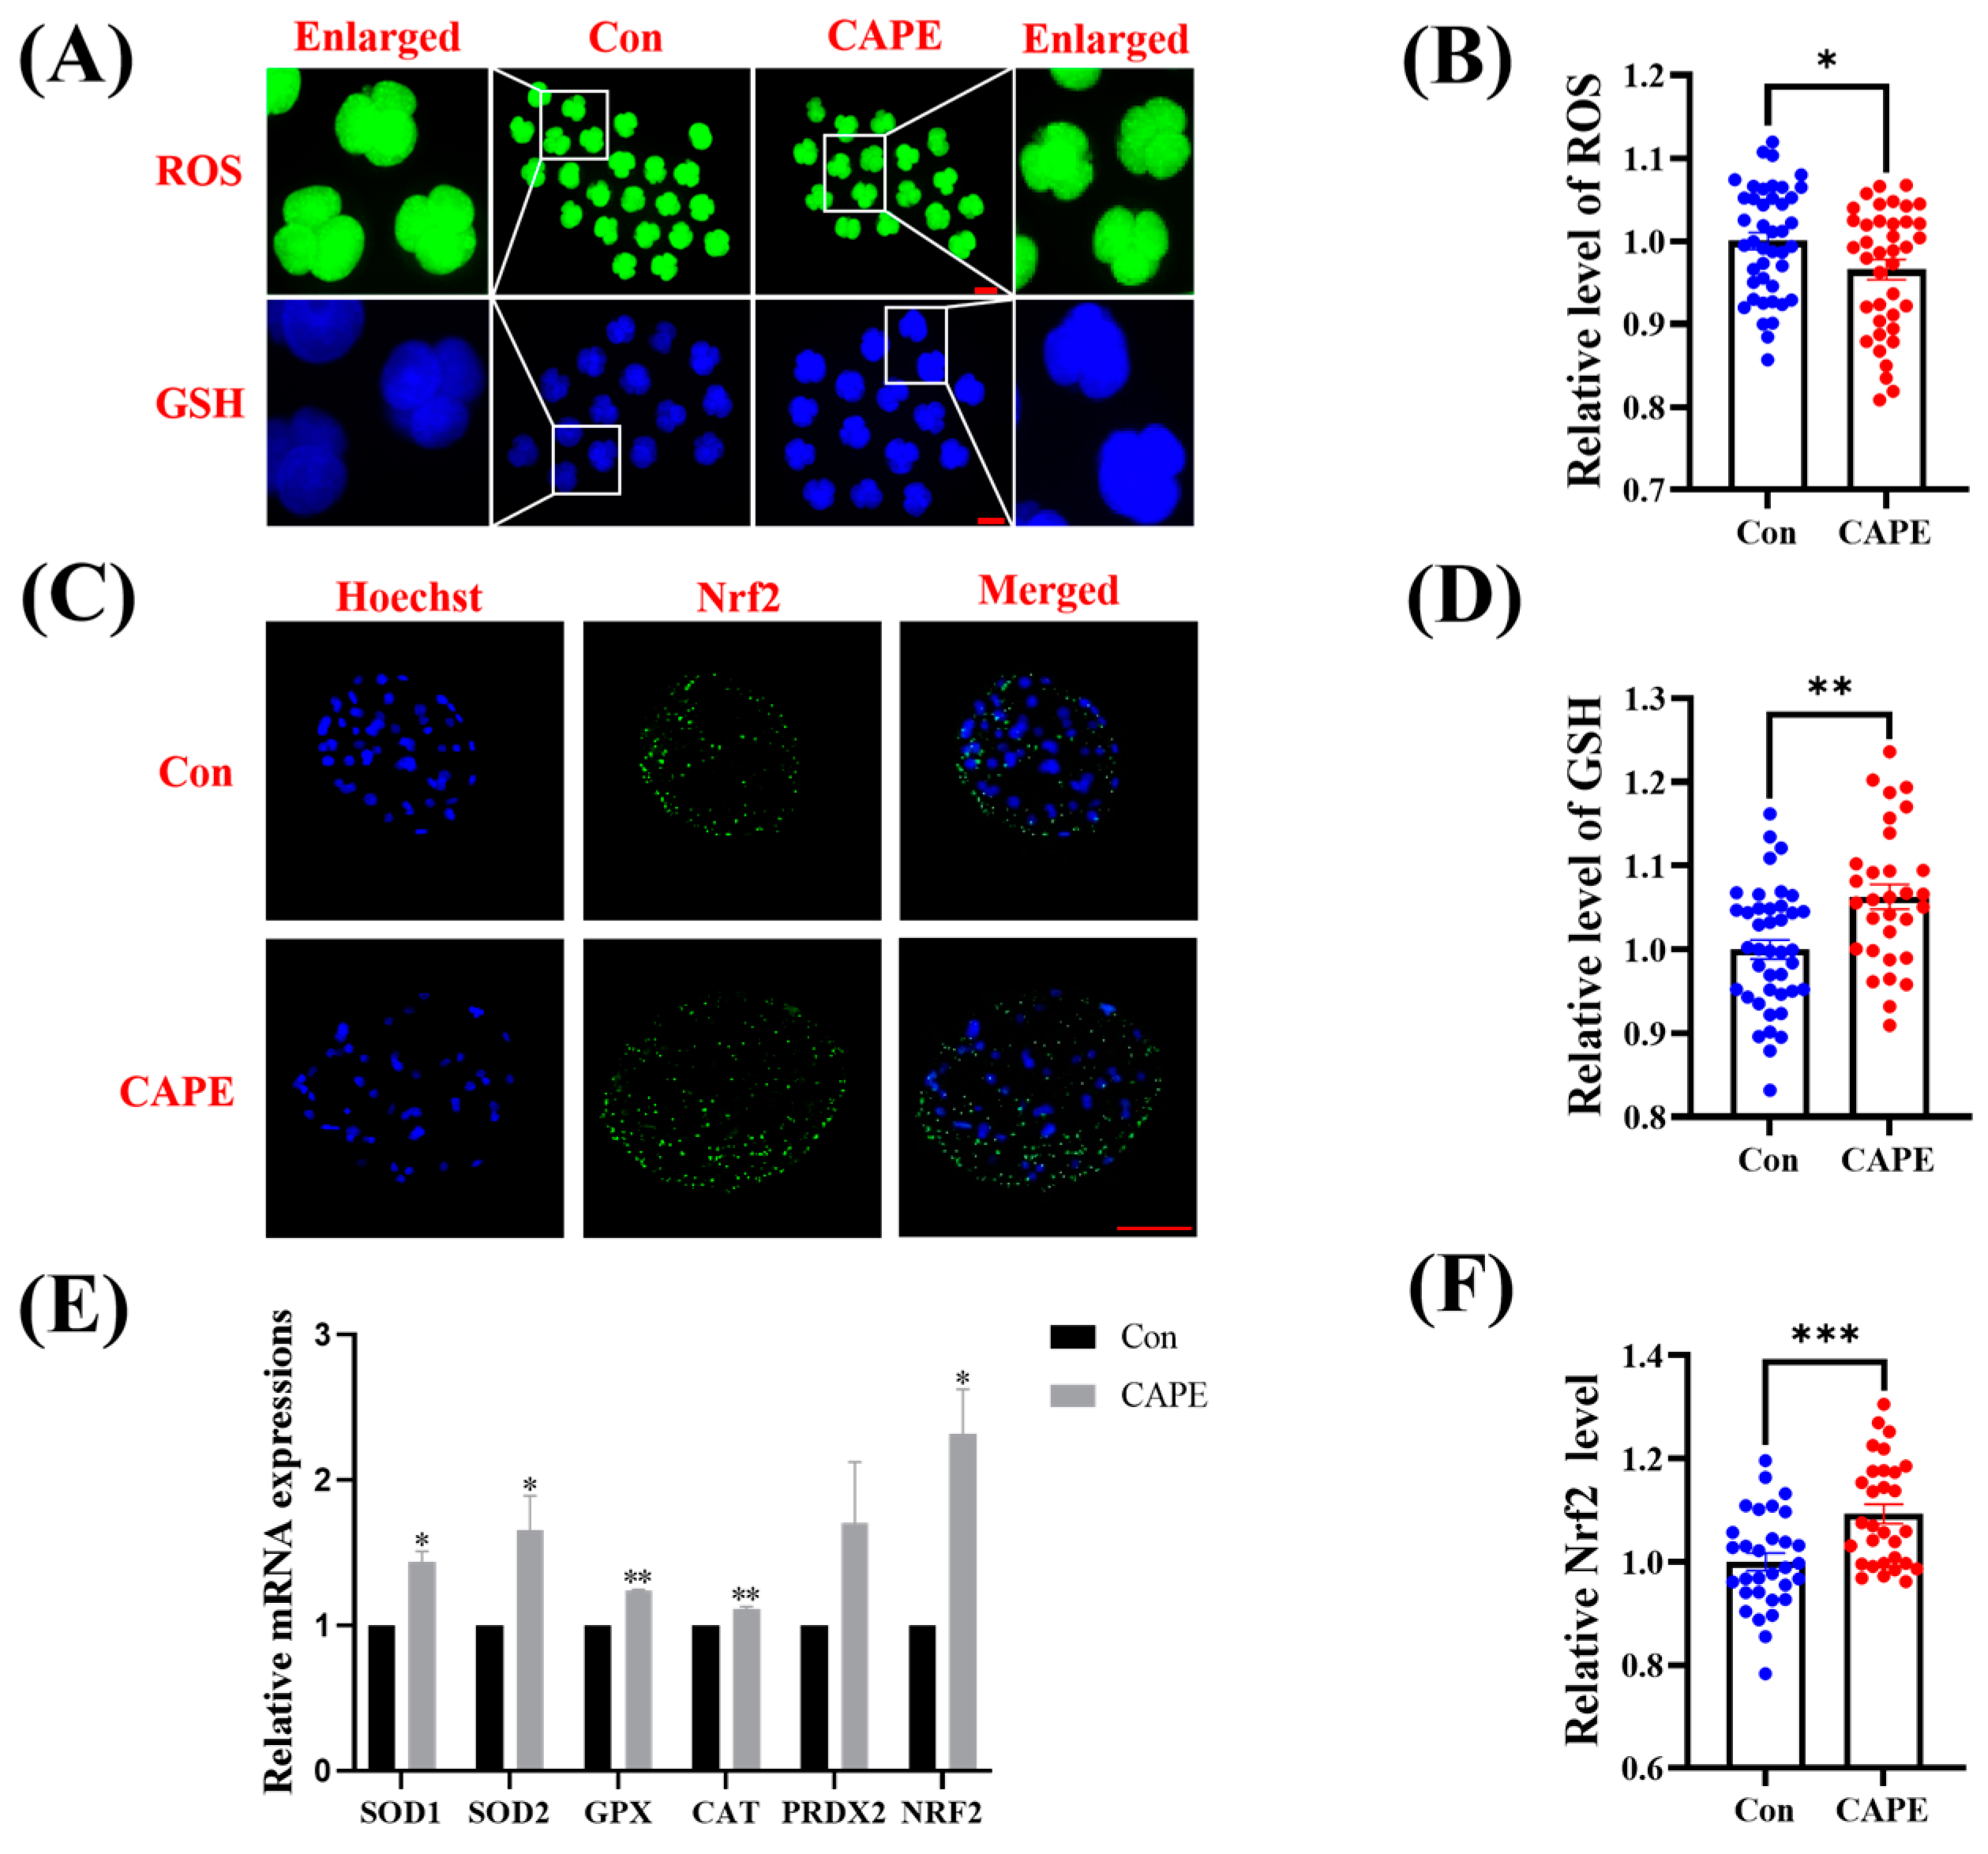
3.3. CAPE Enhances the Capacity of the Early Embryo Antioxidant System
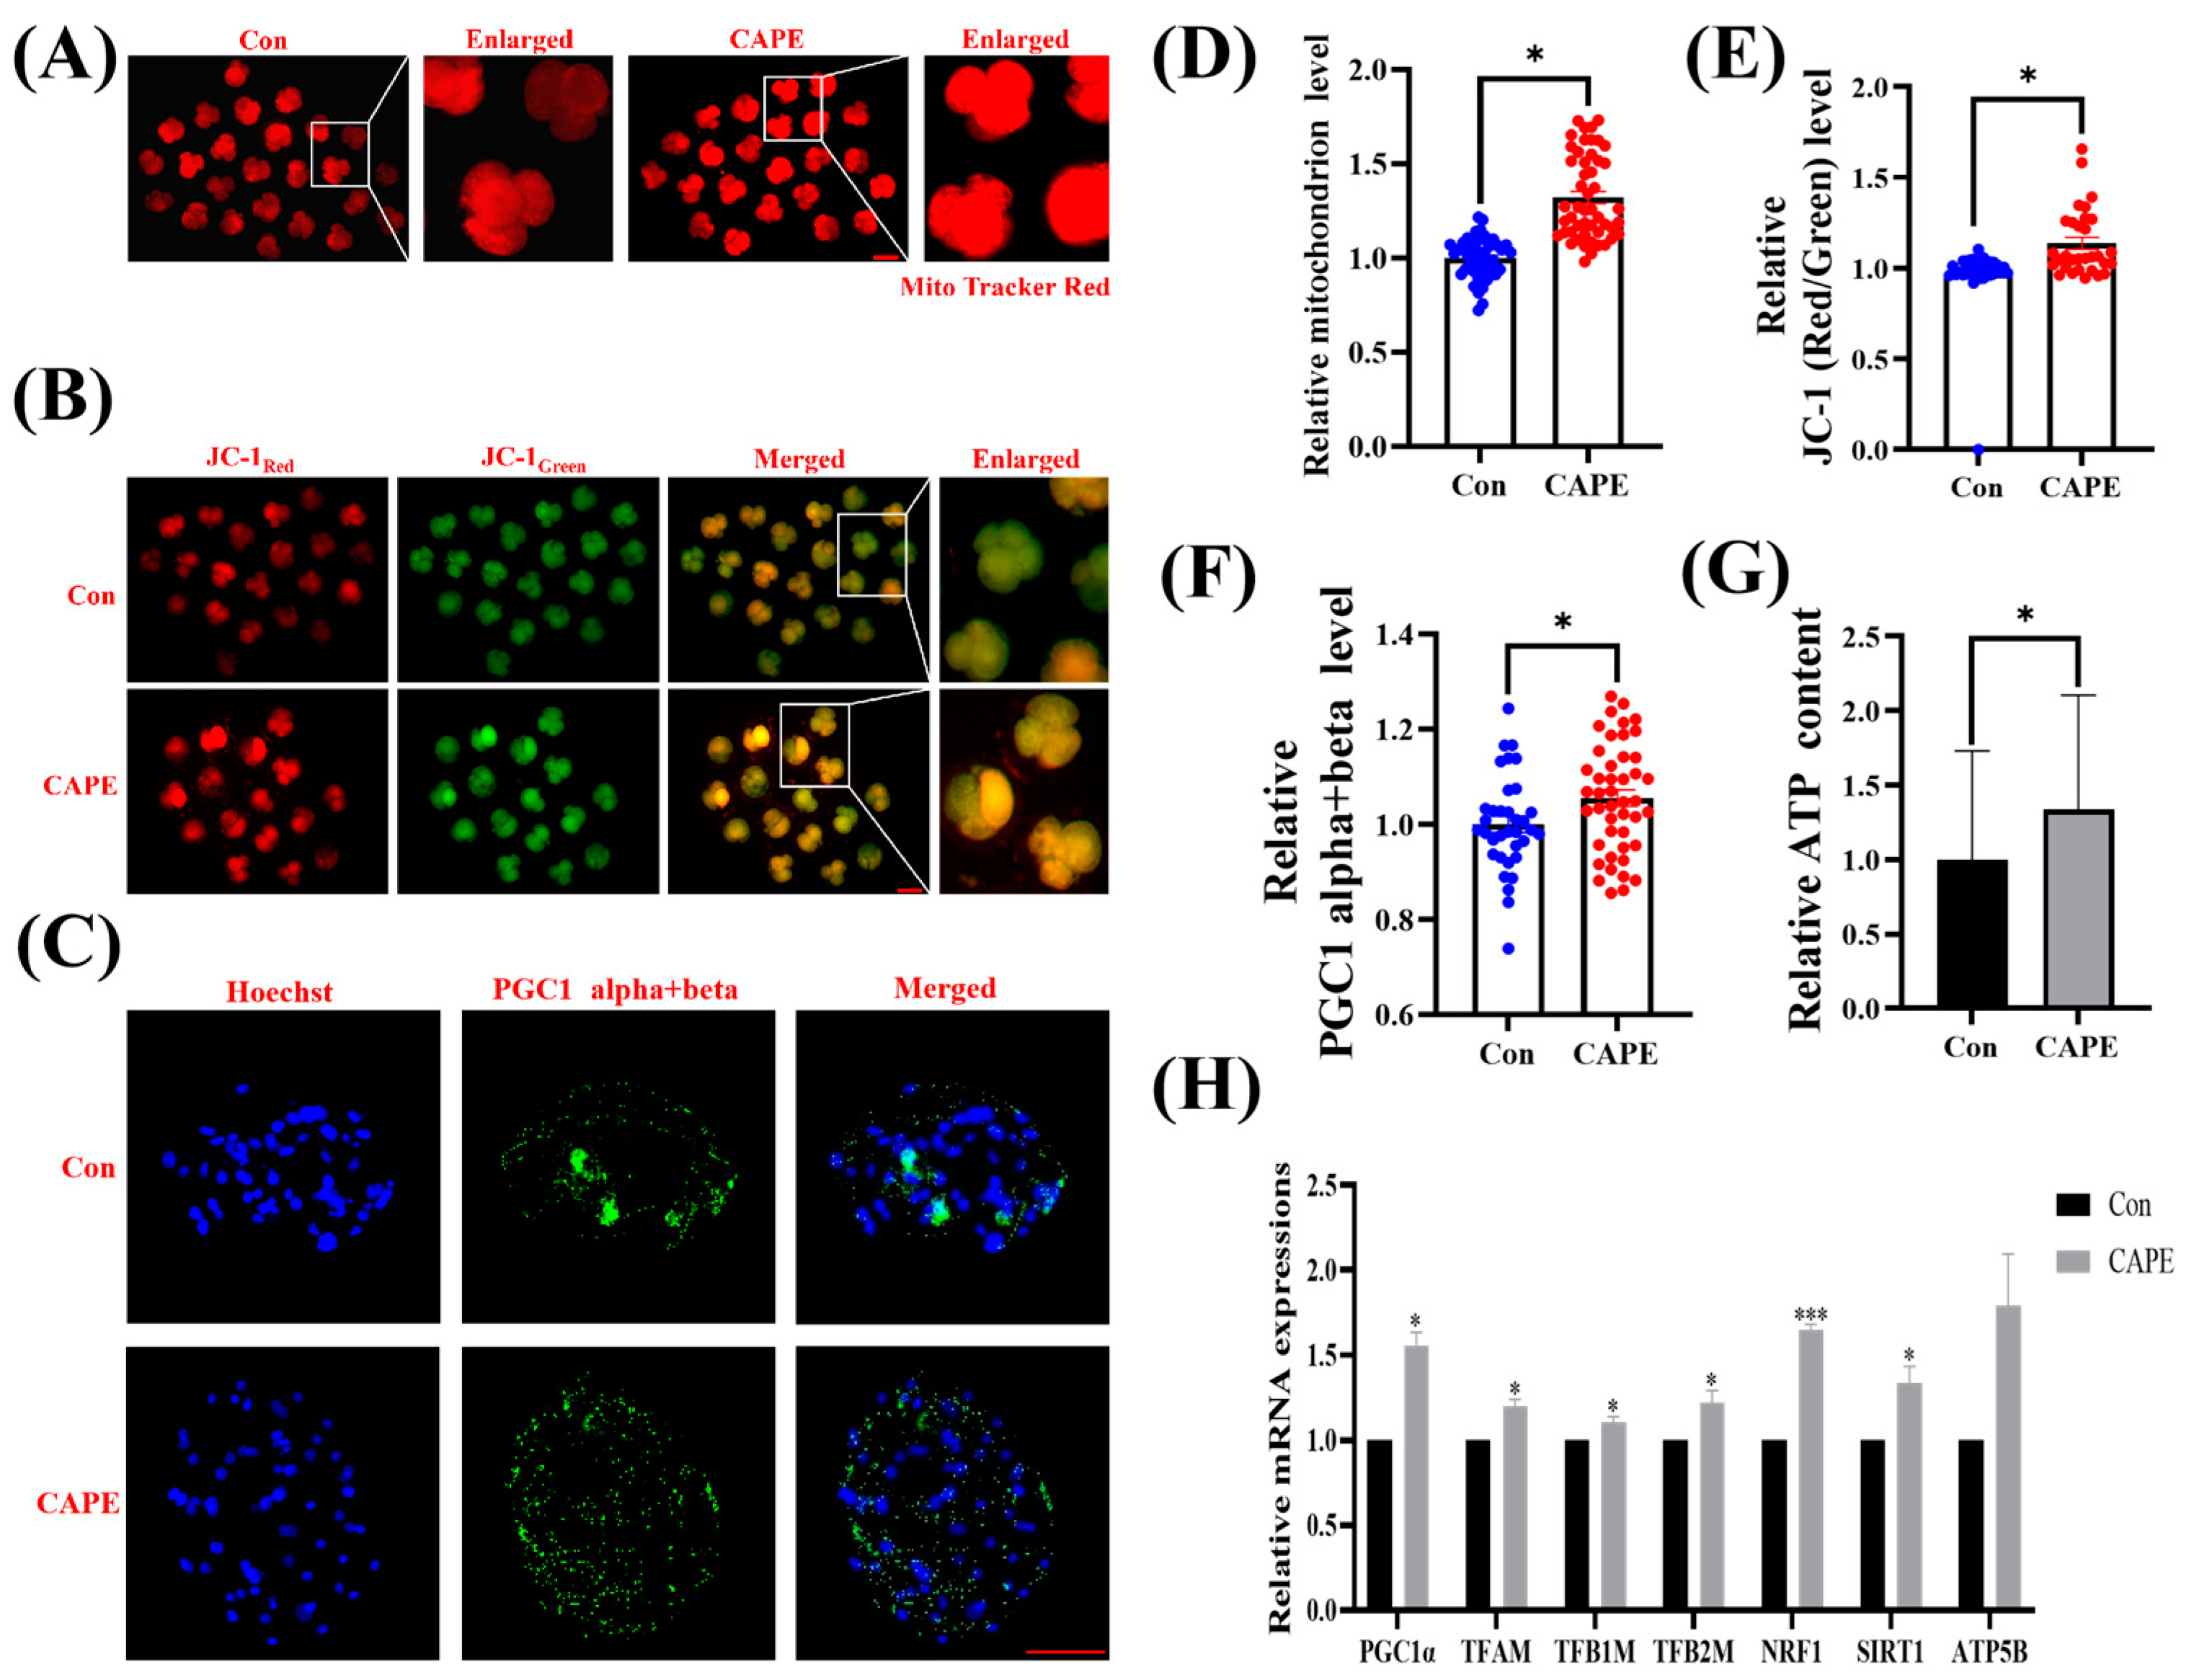
3.4. CAPE Effectively Improves Mitochondrial Function in Early Embryos
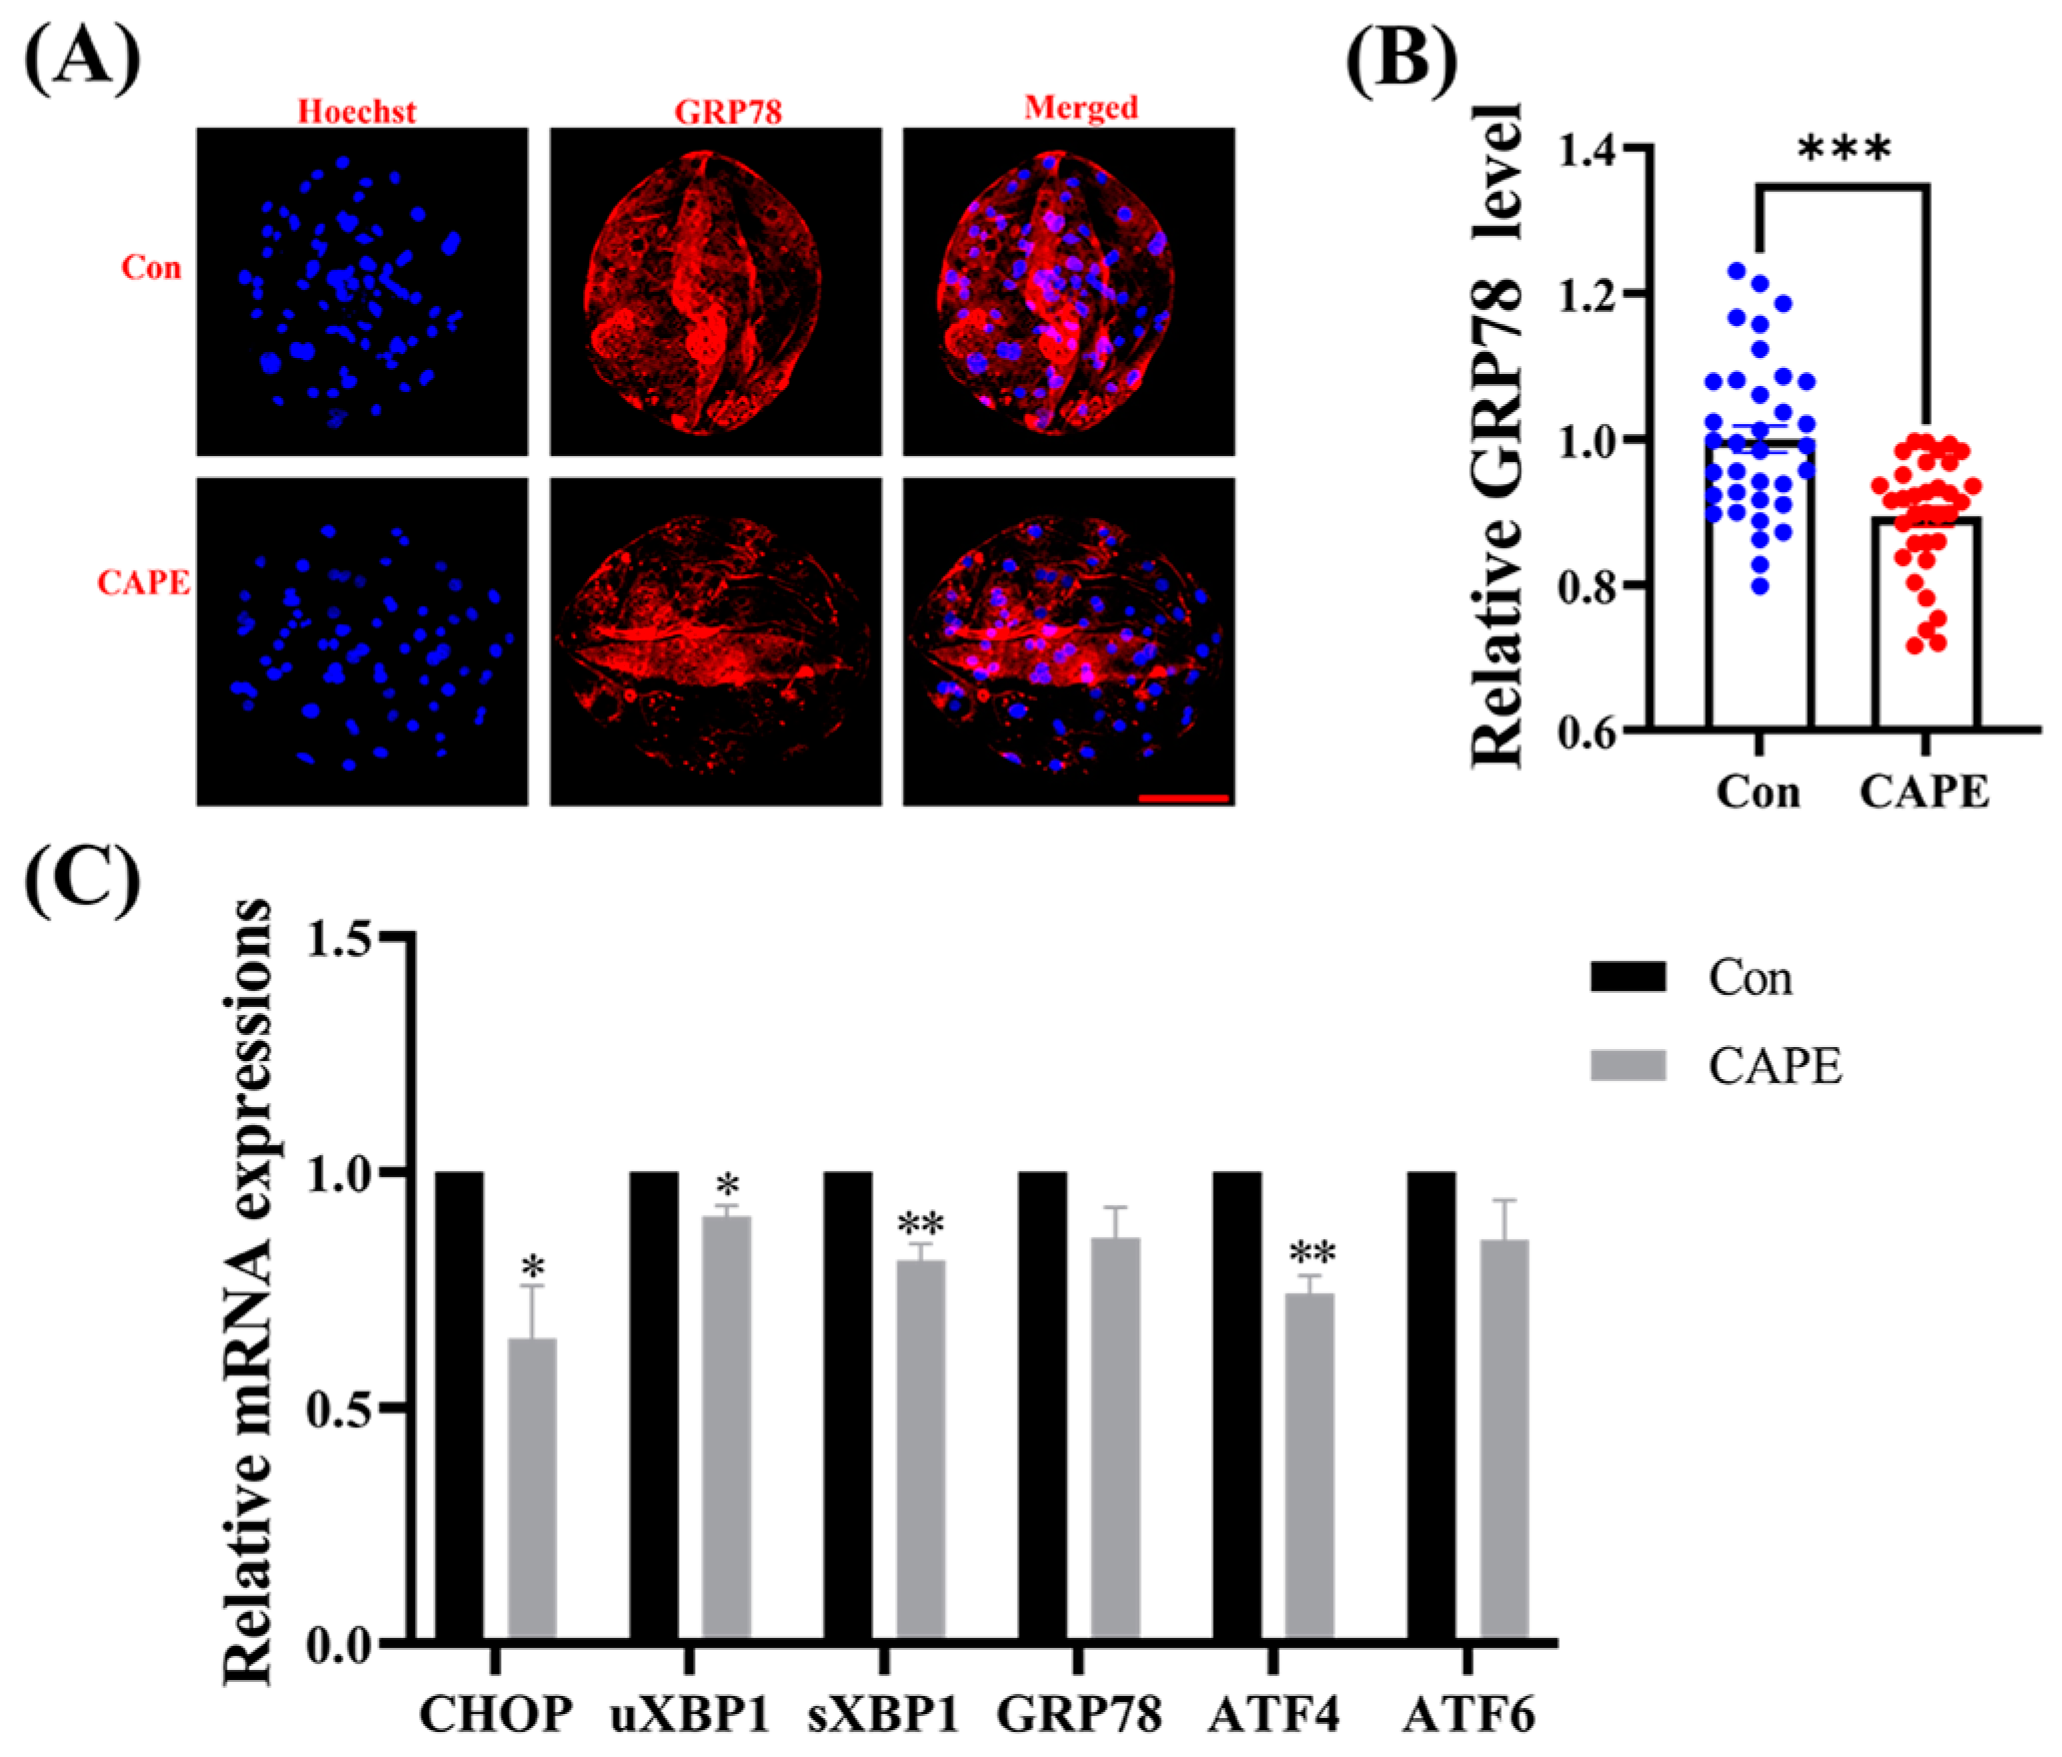
3.5. CAPE Alleviates ER Stress in Early Embryos
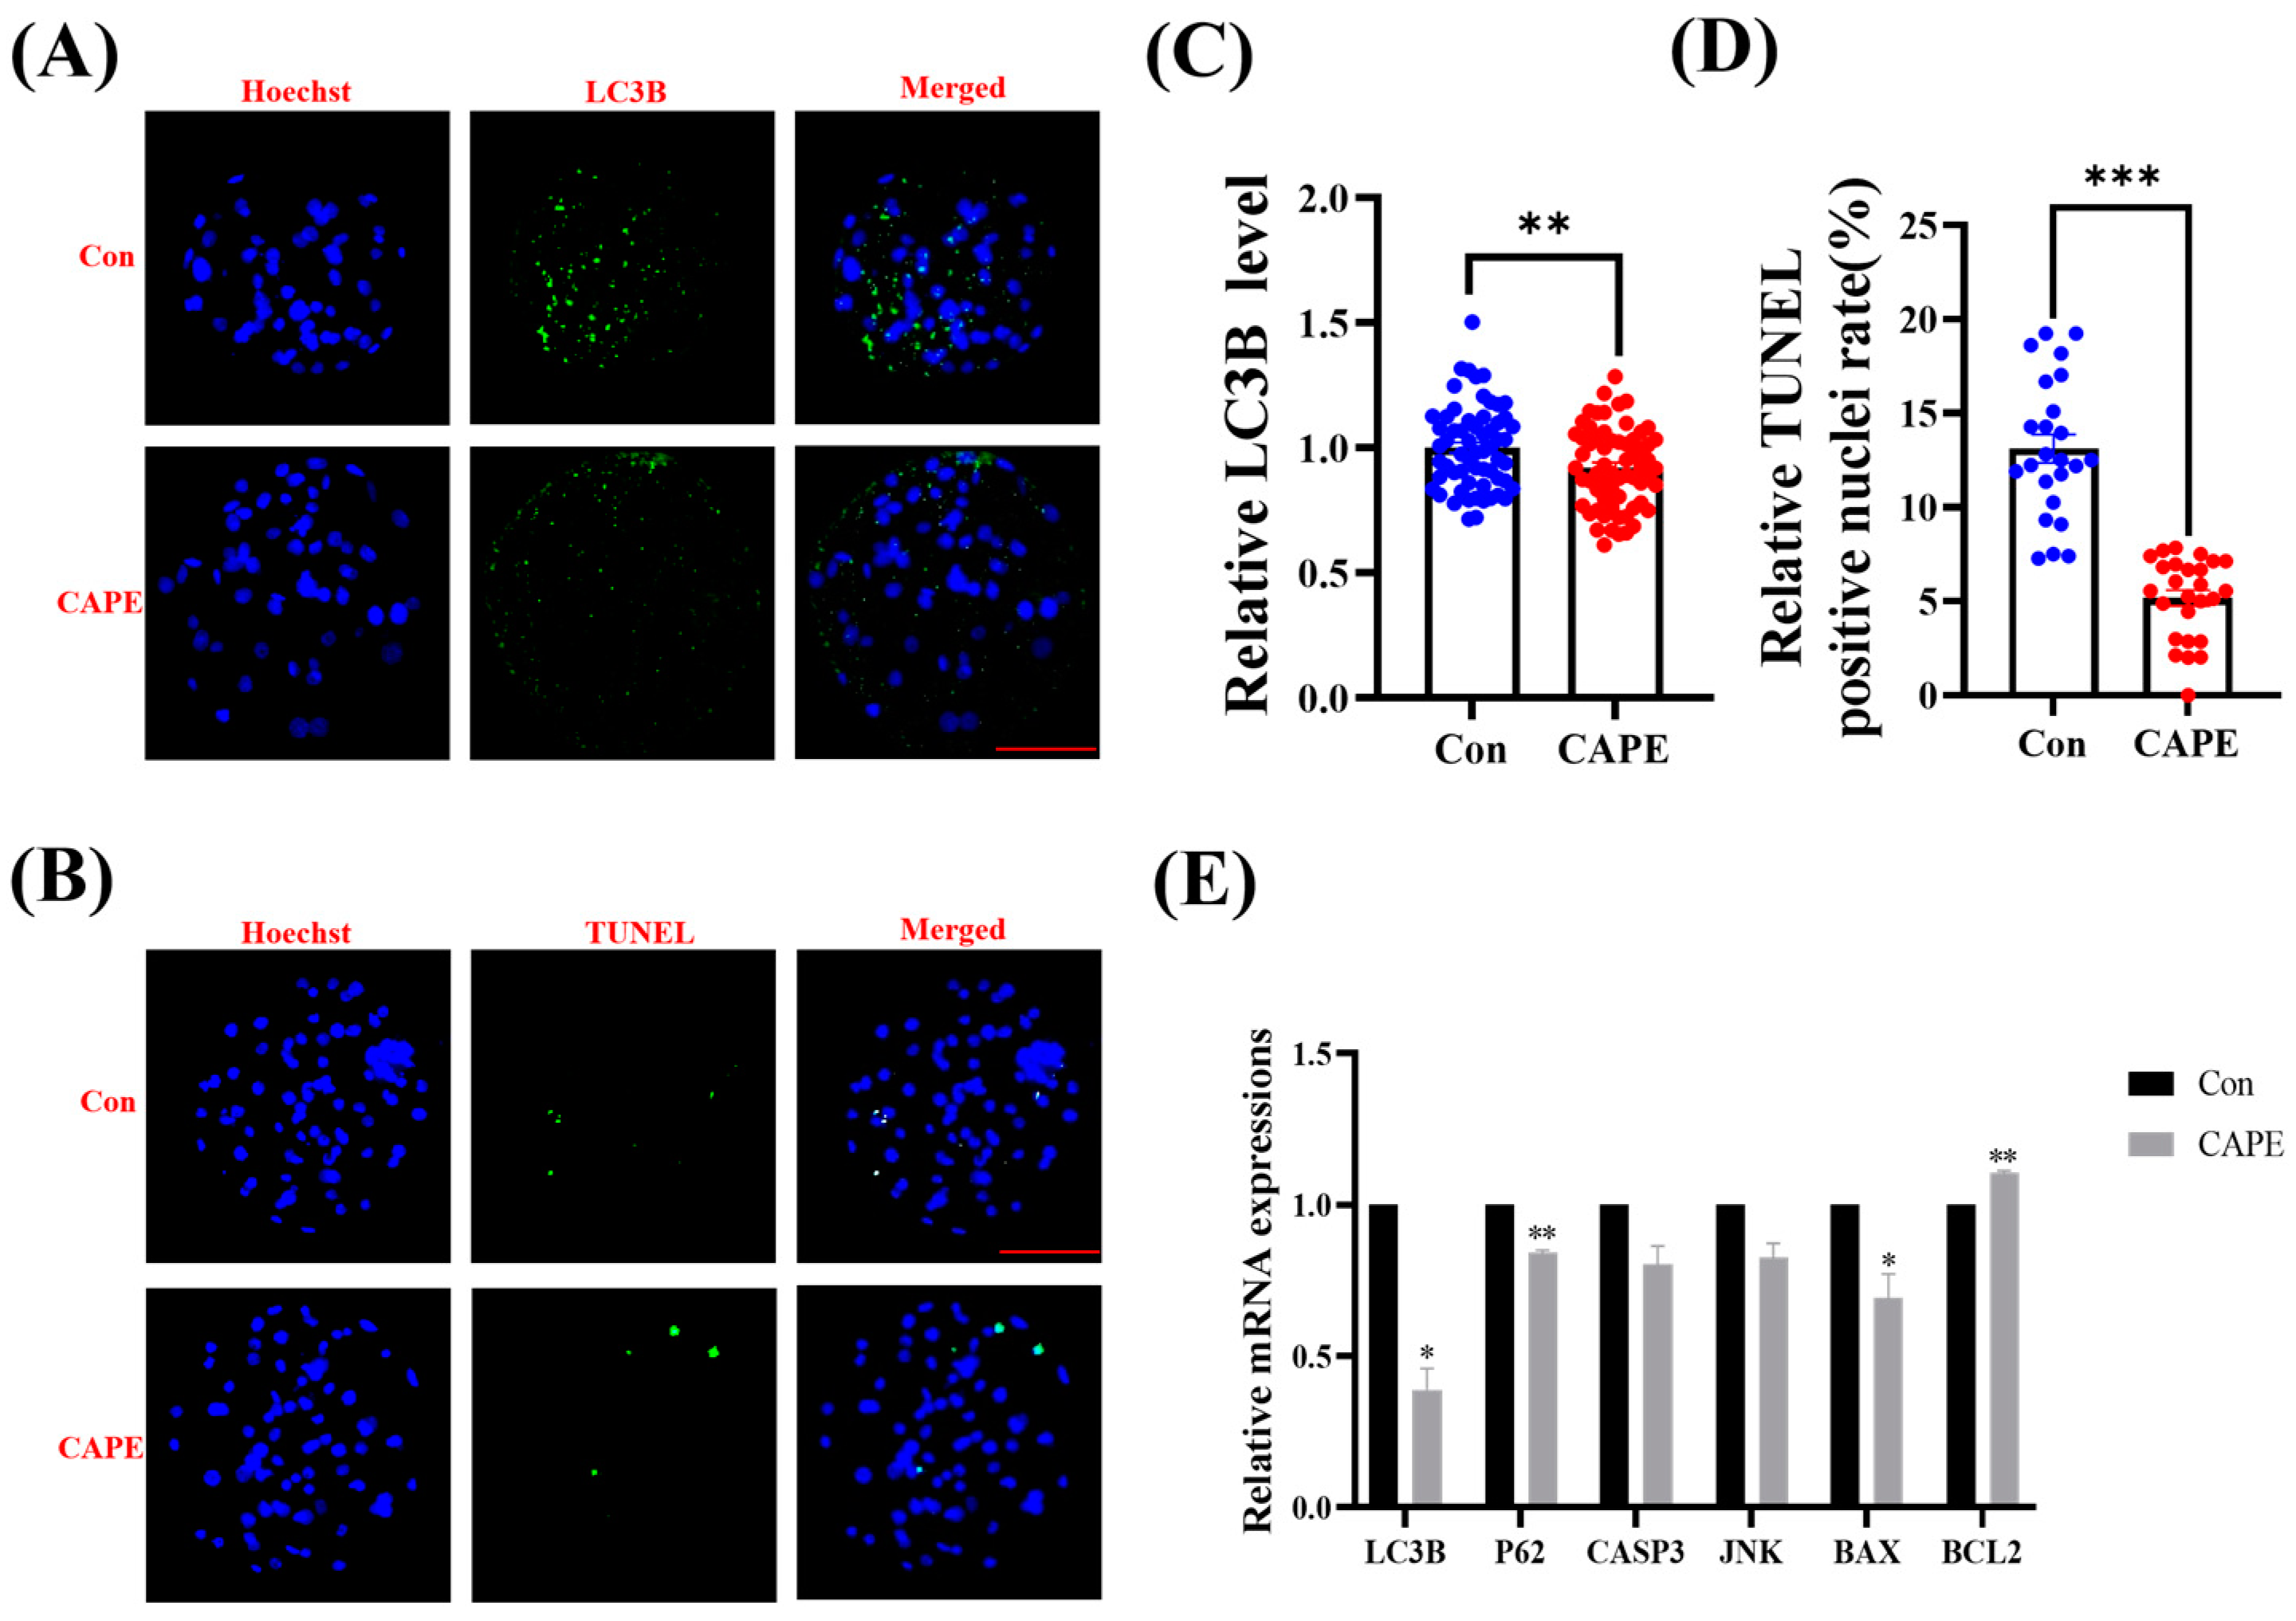
3.6. CAPE Reduces Autophagy and Apoptosis in Embryos
4. Discussion
5. Conclusions
Author Contributions
Funding
Institutional Review Board Statement
Informed Consent Statement
Data Availability Statement
Conflicts of Interest
References
- Galli, C.; Duchi, R.; Crotti, G.; Turini, P.; Ponderato, N.; Colleoni, S.; Lagutina, I.; Lazzari, G. Bovine embryo technologies. Theriogenology 2003, 59, 599–616. [Google Scholar] [CrossRef] [PubMed]
- Babayev, E.; Seli, E. Oocyte mitochondrial function and reproduction. Curr. Opin. Obstet. Gynecol. 2015, 27, 175–181. [Google Scholar] [CrossRef] [PubMed]
- Morgan, M.J.; Liu, Z.G. Crosstalk of reactive oxygen species and NF-κB signaling. Cell Res. 2011, 21, 103–115. [Google Scholar] [CrossRef] [PubMed]
- Ramalho-Santos, J.; Varum, S.; Amaral, S.; Mota, P.C.; Sousa, A.P.; Amaral, A. Mitochondrial functionality in reproduction: From gonads and gametes to embryos and embryonic stem cells. Hum. Reprod. Update 2009, 15, 553–572. [Google Scholar] [CrossRef] [PubMed]
- Spinelli, J.B.; Haigis, M.C. The multifaceted contributions of mitochondria to cellular metabolism. Nat. Cell Biol. 2018, 20, 745–754. [Google Scholar] [CrossRef]
- Cilleros-Holgado, P.; Gómez-Fernández, D.; Piñero-Pérez, R.; Reche-López, D.; Álvarez-Córdoba, M.; Munuera-Cabeza, M.; Talaverón-Rey, M.; Povea-Cabello, S.; Suárez-Carrillo, A.; Romero-González, A.; et al. mtUPR Modulation as a Therapeutic Target for Primary and Secondary Mitochondrial Diseases. Int. J. Mol. Sci. 2023, 24, 1482. [Google Scholar] [CrossRef]
- Li, Q.; Gao, Z.; Chen, Y.; Guan, M.X. The role of mitochondria in osteogenic, adipogenic and chondrogenic differentiation of mesenchymal stem cells. Protein Cell 2017, 8, 439–445. [Google Scholar] [CrossRef]
- Sies, H. Oxidative stress: A concept in redox biology and medicine. Redox Biol. 2015, 4, 180–183. [Google Scholar] [CrossRef]
- Filomeni, G.; De Zio, D.; Cecconi, F. Oxidative stress and autophagy: The clash between damage and metabolic needs. Cell Death Differ. 2015, 22, 377–388. [Google Scholar] [CrossRef]
- Iqbal, M.; Fan, T.P.; Watson, D.; Alenezi, S.; Saleh, K.; Sahlan, M. Preliminary studies: The potential anti-angiogenic activities of two Sulawesi Island (Indonesia) propolis and their chemical characterization. Heliyon 2019, 5, e01978. [Google Scholar] [CrossRef]
- Alday, E.; Valencia, D.; Garibay-Escobar, A.; Domínguez-Esquivel, Z.; Piccinelli, A.L.; Rastrelli, L.; Monribot-Villanueva, J.; Guerrero-Analco, J.A.; Robles-Zepeda, R.E.; Hernandez, J.; et al. Plant origin authentication of Sonoran Desert propolis: An antiproliferative propolis from a semi-arid region. Sci. Nat. 2019, 106, 25. [Google Scholar] [CrossRef] [PubMed]
- Mohamadin, A.M.; Hammad, L.N.; El-Bab, M.F.; Abdel Gawad, H.S. Attenuation of oxidative stress in plasma and tissues of rats with experimentally induced hyperthyroidism by caffeic acid phenylethyl ester. Basic Clin. Pharmacol. Toxicol. 2007, 100, 84–90. [Google Scholar] [CrossRef]
- Forma, E.; Bryś, M. Anticancer Activity of Propolis and Its Compounds. Nutrients 2021, 13, 2594. [Google Scholar] [CrossRef] [PubMed]
- Lan, Q.; Xue, L.; Cao, J.; Xie, Y.; Xiao, T.; Fang, S. Caffeic Acid Phenethyl Ester (CAPE) Improves Boar Sperm Quality and Antioxidant Capacity in Liquid Preservation (17 °C) Linked to AMPK Activity Maintenance. Front. Vet. Sci. 2022, 9, 904886. [Google Scholar] [CrossRef] [PubMed]
- Trumbeckaite, S.; Pauziene, N.; Trumbeckas, D.; Jievaltas, M.; Baniene, R. Caffeic Acid Phenethyl Ester Reduces Ischemia-Induced Kidney Mitochondrial Injury in Rats. Oxidative Med. Cell. Longev. 2017, 2017, 1697018. [Google Scholar] [CrossRef]
- Zhang, Y.; Kong, D.; Han, H.; Cao, Y.; Zhu, H.; Cui, G. Caffeic acid phenethyl ester protects against doxorubicin-induced cardiotoxicity and increases chemotherapeutic efficacy by regulating the unfolded protein response. Food Chem. Toxicol. 2022, 159, 112770. [Google Scholar] [CrossRef]
- McCurley, A.T.; Callard, G.V. Characterization of housekeeping genes in zebrafish: Male-female differences and effects of tissue type, developmental stage and chemical treatment. BMC Mol. Biol. 2008, 9, 102. [Google Scholar] [CrossRef]
- Dekebo, A.; Geba, C.; Bisrat, D.; Jeong, J.B.; Jung, C. Wound Healing, Anti-Inflammatory and Anti-Oxidant Activities, and Chemical Composition of Korean Propolis from Different Sources. Int. J. Mol. Sci. 2024, 25, 11352. [Google Scholar] [CrossRef]
- Lin, H.P.; Jiang, S.S.; Chuu, C.P. Caffeic acid phenethyl ester causes p21Cip1 induction, Akt signaling reduction, and growth inhibition in PC-3 human prostate cancer cells. PLoS ONE 2012, 7, e31286. [Google Scholar] [CrossRef]
- He, Y.J.; Liu, B.H.; Xiang, D.B.; Qiao, Z.Y.; Fu, T.; He, Y.H. Inhibitory effect of caffeic acid phenethyl ester on the growth of SW480 colorectal tumor cells involves beta-catenin associated signaling pathway down-regulation. World J. Gastroenterol. 2006, 12, 4981–4985. [Google Scholar] [CrossRef]
- Xing, F.; Liu, N.; Wang, C.; Wang, X.D. Caffeic acid phenethyl ester promotes oxaliplatin sensitization in colon cancer by inhibiting autophagy. Sci. Rep. 2024, 14, 14624. [Google Scholar] [CrossRef] [PubMed]
- Matsunaga, T.; Tsuchimura, S.; Azuma, N.; Endo, S.; Ichihara, K.; Ikari, A. Caffeic acid phenethyl ester potentiates gastric cancer cell sensitivity to doxorubicin and cisplatin by decreasing proteasome function. Anti-Cancer Drugs 2019, 30, 251–259. [Google Scholar] [CrossRef] [PubMed]
- Li, Y.; Li, R.Q.; Ou, S.B.; Zhang, N.F.; Ren, L.; Wei, L.N.; Zhang, Q.X.; Yang, D.Z. Increased GDF9 and BMP15 mRNA levels in cumulus granulosa cells correlate with oocyte maturation, fertilization, and embryo quality in humans. Reprod. Biol. Endocrinol. 2014, 12, 81. [Google Scholar] [CrossRef] [PubMed]
- Hisey, E.; Ross, P.J.; Meyers, S.A. A Review of OCT4 Functions and Applications to Equine Embryos. J. Equine Vet. Sci. 2021, 98, 103364. [Google Scholar] [CrossRef] [PubMed]
- Xu, B.; Hua, J.; Zhang, Y.; Jiang, X.; Zhang, H.; Ma, T.; Zheng, W.; Sun, R.; Shen, W.; Sha, J.; et al. Proliferating cell nuclear antigen (PCNA) regulates primordial follicle assembly by promoting apoptosis of oocytes in fetal and neonatal mouse ovaries. PLoS ONE 2011, 6, e16046. [Google Scholar] [CrossRef]
- Luo, L.; Dang, Y.; Shi, Y.; Zhao, P.; Zhang, Y.; Zhang, K. SIN3A Regulates Porcine Early Embryonic Development by Modulating CCNB1 Expression. Front. Cell Dev. Biol. 2021, 9, 604232. [Google Scholar] [CrossRef]
- Wang, H.; Kim, N.H. CDK2 Is Required for the DNA Damage Response During Porcine Early Embryonic Development. Biol. Reprod. 2016, 95, 31. [Google Scholar] [CrossRef]
- Sawicka, D.; Car, H.; Borawska, M.H.; Nikliński, J. The anticancer activity of propolis. Folia Histochem. Cytobiol. 2012, 50, 25–37. [Google Scholar] [CrossRef]
- Halliwell, B.; Cross, C.E. Oxygen-derived species: Their relation to human disease and environmental stress. Environ. Health Perspect. 1994, 102 (Suppl. 10), 5–12. [Google Scholar] [CrossRef]
- Wang, Y.; Wu, Y.; Wang, Y.; Xu, H.; Mei, X.; Yu, D.; Wang, Y.; Li, W. Antioxidant Properties of Probiotic Bacteria. Nutrients 2017, 9, 521. [Google Scholar] [CrossRef]
- Schreck, R.; Rieber, P.; Baeuerle, P.A. Reactive oxygen intermediates as apparently widely used messengers in the activation of the NF-kappa B transcription factor and HIV-1. EMBO J. 1991, 10, 2247–2258. [Google Scholar] [CrossRef] [PubMed]
- Ali, M.A.; Menze, E.T.; Tadros, M.G.; Tolba, M.F. Caffeic acid phenethyl ester counteracts doxorubicin-induced chemobrain in Sprague-Dawley rats: Emphasis on the modulation of oxidative stress and neuroinflammation. Neuropharmacology 2020, 181, 108334. [Google Scholar] [CrossRef]
- Barlas, F.B.; Erdoğan, S. Caffeic acid phenethyl ester protects lung alveolar epithelial cells from cigarette smoke-induced damage. Turk. J. Med. Sci. 2015, 45, 534–541. [Google Scholar] [CrossRef]
- Stähli, A.; Maheen, C.U.; Strauss, F.J.; Eick, S.; Sculean, A.; Gruber, R. Caffeic acid phenethyl ester protects against oxidative stress and dampens inflammation via heme oxygenase 1. Int. J. Oral Sci. 2019, 11, 6. [Google Scholar] [CrossRef]
- Tian, B.; Lu, Z.N.; Guo, X.L. Regulation and role of nuclear factor-E2-related factor 2 (Nrf2) in multidrug resistance of hepatocellular carcinoma. Chem. Biol. Interact. 2018, 280, 70–76. [Google Scholar] [CrossRef] [PubMed]
- Chauhan, W.; Zennadi, R. Keap1-Nrf2 Heterodimer: A Therapeutic Target to Ameliorate Sickle Cell Disease. Antioxidants 2023, 12, 740. [Google Scholar] [CrossRef]
- Leyens, G.; Knoops, B.; Donnay, I. Expression of peroxiredoxins in bovine oocytes and embryos produced in vitro. Mol. Reprod. Dev. 2004, 69, 243–251. [Google Scholar] [CrossRef] [PubMed]
- Coffman, J.A. Mitochondria and metazoan epigenesis. Semin. Cell Dev. Biol. 2009, 20, 321–329. [Google Scholar] [CrossRef]
- Van Blerkom, J. Mitochondria in early mammalian development. Semin. Cell Dev. Biol. 2009, 20, 354–364. [Google Scholar] [CrossRef]
- Majdi, S.; Larsson, A.; Najafinobar, N.; Borges, R.; Ewing, A.G. Extracellular ATP Regulates the Vesicular Pore Opening in Chromaffin Cells and Increases the Fraction Released During Individual Exocytosis Events. ACS Chem. Neurosci. 2019, 10, 2459–2466. [Google Scholar] [CrossRef]
- Rius-Pérez, S.; Torres-Cuevas, I.; Millán, I.; Ortega, Á.L.; Pérez, S. PGC-1α, Inflammation, and Oxidative Stress: An Integrative View in Metabolism. Oxidative Med. Cell. Longev. 2020, 2020, 1452696. [Google Scholar] [CrossRef]
- Idrees, M.; Kumar, V.; Khan, A.M.; Joo, M.D.; Uddin, Z.; Lee, K.W.; Kong, I.K. Hesperetin activated SIRT1 neutralizes cadmium effects on the early bovine embryo development. Theriogenology 2022, 189, 209–221. [Google Scholar] [CrossRef] [PubMed]
- Taylor, D.F.; Bishop, D.J. Transcription Factor Movement and Exercise-Induced Mitochondrial Biogenesis in Human Skeletal Muscle: Current Knowledge and Future Perspectives. Int. J. Mol. Sci. 2022, 23, 1517. [Google Scholar] [CrossRef] [PubMed]
- Filosto, M.; Scarpelli, M.; Cotelli, M.S.; Vielmi, V.; Todeschini, A.; Gregorelli, V.; Tonin, P.; Tomelleri, G.; Padovani, A. The role of mitochondria in neurodegenerative diseases. J. Neurol. 2011, 258, 1763–1774. [Google Scholar] [CrossRef] [PubMed]
- Jiang, R.Q.; Li, Q.Q.; Sheng, R. Mitochondria associated ER membranes and cerebral ischemia: Molecular mechanisms and therapeutic strategies. Pharmacol. Res. 2023, 191, 106761. [Google Scholar] [CrossRef]
- Stacchiotti, A.; Favero, G.; Lavazza, A.; Garcia-Gomez, R.; Monsalve, M.; Rezzani, R. Perspective: Mitochondria-ER Contacts in Metabolic Cellular Stress Assessed by Microscopy. Cells 2018, 8, 5. [Google Scholar] [CrossRef]
- Chen, X.; Cubillos-Ruiz, J.R. Endoplasmic reticulum stress signals in the tumour and its microenvironment. Nat. Rev. Cancer 2021, 21, 71–88. [Google Scholar] [CrossRef]
- Iwawaki, T.; Oikawa, D. The role of the unfolded protein response in diabetes mellitus. Semin. Immunopathol. 2013, 35, 333–350. [Google Scholar] [CrossRef]
- Shahzad, K.; Fatima, S.; Al-Dabet, M.M.; Gadi, I.; Khawaja, H.; Ambreen, S.; Elwakiel, A.; Klöting, N.; Blüher, M.; Nawroth, P.P.; et al. CHOP-ASO Ameliorates Glomerular and Tubular Damage on Top of ACE Inhibition in Diabetic Kidney Disease. J. Am. Soc. Nephrol. 2021, 32, 3066–3079. [Google Scholar] [CrossRef]
- Ibrahim, I.M.; Abdelmalek, D.H.; Elfiky, A.A. GRP78: A cell’s response to stress. Life Sci. 2019, 226, 156–163. [Google Scholar] [CrossRef]
- Yoon, S.B.; Park, Y.H.; Choi, S.A.; Yang, H.J.; Jeong, P.S.; Cha, J.J.; Lee, S.; Lee, S.H.; Lee, J.H.; Sim, B.W.; et al. Real-time PCR quantification of spliced X-box binding protein 1 (XBP1) using a universal primer method. PLoS ONE 2019, 14, e0219978. [Google Scholar] [CrossRef] [PubMed]
- Hosoi, T.; Nakashima, M.; Ozawa, K. Incorporation of the Endoplasmic Reticulum Stress-Induced Spliced Form of XBP1 mRNA in the Exosomes. Front. Physiol. 2018, 9, 1357. [Google Scholar] [CrossRef]
- Penaloza, C.; Lin, L.; Lockshin, R.A.; Zakeri, Z. Cell death in development: Shaping the embryo. Histochem. Cell Biol. 2006, 126, 149–158. [Google Scholar] [CrossRef]
- Jeong, S.Y.; Seol, D.W. The role of mitochondria in apoptosis. BMB Rep. 2008, 41, 11–22. [Google Scholar] [CrossRef] [PubMed]
- Yang, Z.; Klionsky, D.J. An overview of the molecular mechanism of autophagy. Curr. Top. Microbiol. Immunol. 2009, 335, 1–32. [Google Scholar] [CrossRef]
- Devis-Jauregui, L.; Eritja, N.; Davis, M.L.; Matias-Guiu, X.; Llobet-Navàs, D. Autophagy in the physiological endometrium and cancer. Autophagy 2020, 17, 1077–1095. [Google Scholar] [CrossRef]
- Yorimitsu, T.; Nair, U.; Yang, Z.; Klionsky, D.J. Endoplasmic reticulum stress triggers autophagy. J. Biol. Chem. 2006, 281, 30299–30304. [Google Scholar] [CrossRef] [PubMed]
- Hwang, H.J.; Kim, Y.K. The role of LC3B in autophagy as an RNA-binding protein. Autophagy 2023, 19, 1028–1030. [Google Scholar] [CrossRef]
- Sánchez-Martín, P.; Saito, T.; Komatsu, M. p62/SQSTM1: “Jack of all trades” in health and cancer. FEBS J. 2019, 286, 8–23. [Google Scholar] [CrossRef]
- Walsh, J.G.; Cullen, S.P.; Sheridan, C.; Lüthi, A.U.; Gerner, C.; Martin, S.J. Executioner caspase-3 and caspase-7 are functionally distinct proteases. Proc. Natl. Acad. Sci. USA 2008, 105, 12815–12819. [Google Scholar] [CrossRef]
- Wu, Q.; Wu, W.; Fu, B.; Shi, L.; Wang, X.; Kuca, K. JNK signaling in cancer cell survival. Med. Res. Rev. 2019, 39, 2082–2104. [Google Scholar] [CrossRef] [PubMed]


| No. | Genes * | Primer Sequences (5′-3′) | Base |
|---|---|---|---|
| 1 | RN18S | F: TCCAATGGATCCTCGCGGAA R: GGCTACCACATCCAAGGAAG | 20 20 |
| 2 | BAX | F: TGCCTCAGGATGCATCTACC R: AAGTAGAAAAGCGCGACCAC | 20 20 |
| 3 | BCL2 | F: AGGGCATTCAGTGACCTGAC R: CGATCCGACTCACCAATACC | 20 20 |
| 4 | BMP15 | F: CCTCCATCCTTTCCAAGTCA R: GTGTAGTACCCGAGGGCAGA | 20 20 |
| 5 | CDK1 | F: GGGCACTCCCAATAATGAAGT R: GTTCTTGATACAACGTGTGGGAA | 21 23 |
| 6 | CDK2 | F: TGTGCGAGTGGATGCGGAAG R: CCGAATGGTGATGTAGCGAC | 20 20 |
| 7 | NANOG | F: GGTTTATGGGCCTGAAGAAA R: GATCCATGGAGGAAGGAAGA | 20 20 |
| 8 | SOX2 | F: ATGCACAACTCGGAGATCAG R: TATAATCCGGGTGCTCCTTC | 20 20 |
| 9 | TFAM | F: CCTCTGTGCGGTTTGTGGAAGTC R: TACACCTGCCAGTCTGCCCTATAAG | 23 25 |
| 10 | NRF1 | F: GCCGATGCTTCAGAATTGCCAAC R: TCCACCTCTCCATCAGCCACAG | 23 22 |
| 11 | NRF2 | F: AGCGGATTGCTCGTAGACAG R: TTCAGTCGCTTCACGTCGG | 20 19 |
| 12 | TFB1M | F: CCCAAGATAGAGCAGCCGTTCAAG R: CCAAGCCCTCGATAGCAGTATTTCC | 24 25 |
| 13 | TFB2M | F: GCGGCAAGGAGGAAGGATGTTC R: GCACCAAGTTCTCAGCCACTCTC | 22 23 |
| 14 | PGC1α | F: AGGGAGAGGCAGAGGCAGAAG R: TGTCCGTGTTGTGTCAGGTCTG | 21 22 |
| 15 | ATF4 | F: AGTCCTTTTCTGCGAGTGGG R: CTGCTGCCTCTAATACGCCA | 20 20 |
| 16 | uXBP1 | F: CATGGATTCTGACGGTGTTG R: GTCTGGGGAAGGACATCTGA | 20 20 |
| 17 | sXBP1 | F: GGAGTTAAGACAGCGCTTGG R: GAGATGTTCTGGAGGGGTGA | 20 20 |
| 18 | ATF6 | F: TACTTCCAGCAGCACCCAAG R: GCACCACCGTCTGACCTTTA | 20 20 |
| 19 | CHOP | F: CCCCTGGAAATGAGGAGGAG R: CTCTGGGAGGTGTGTGTGAC | 20 20 |
| 20 | GRP78 | F: GCTCTACTCGCATCCCCAAAG R: TACACCAGCCTGAACAGCAG | 21 20 |
| 21 | JNK | F: CTCGCTACTACAGAGCACCTG R: TTCTCCCATAATGCACCCCAC | 21 21 |
| 22 | CCNB1 | F: CCAACTGGTTGGTGTCACTG R: GCTCTCCGAAGAAAATGCAG | 20 20 |
| 23 | SOD1 | F: CTCTCGGGAGACCATTCCATCATTG R: TCCACCTCTGCCCAAGTCATCTG | 25 23 |
| 24 | SOD2 | F: TGTATCCGTCGGCGTCCAAGG R: TCCTGGTTAGAACAAGCGGCAATC | 21 24 |
| 25 | SIRT1 | F: CGGCAGGAGAAGGAAACAATGGG R: TCGTCGTCGTCGTCGTCGTAG | 23 21 |
| 26 | CAT | F: AGCCAGTGACCAGATGAAGCATTG R: ATGTCGTGTGTGACCTCAAAGTAGC | 24 25 |
| 27 | GPX | F: CTGGTCGTGCTCGGCTTCC R: GCCTGGTCGGACGTACTTGAG | 19 21 |
| 28 | CASP3 | F: CGTGCTTCTAAGCCATGGTG R: GTCCCACTGTCCGTCTCAAT | 20 20 |
| 29 | LC3B | F: TTCAAACAGCGCCGAACCTT R: TTTGGTAGGATGCTGCTCTCG | 20 21 |
| 30 | P62 | F: GACAACTGTTCAGGAGGAGACGATG R: AGAGACTGGAGTTCACCTGTAGACG | 25 25 |
| 31 | OCT4 | F: GTGAGAGGCAACCTGGAGAG R: TCGTTGCGAATAGTCACTGC | 20 20 |
| 32 | PCNA | F: CCTGTGCAAAAGATGGAGTG R: GGAGAGAGTGGAGTGGCTTTT | 20 21 |
| 33 | PRDX2 | F: TGTCCTTCGCCAGATCACT R: TCCACGTTGGGCTTGATT | 19 18 |
| 34 | ATP5B | F: TTGTTGGCAGTGAGCATT R: AACCTGGAATGGCTGAGA | 18 18 |
Disclaimer/Publisher’s Note: The statements, opinions and data contained in all publications are solely those of the individual author(s) and contributor(s) and not of MDPI and/or the editor(s). MDPI and/or the editor(s) disclaim responsibility for any injury to people or property resulting from any ideas, methods, instructions or products referred to in the content. |
© 2024 by the authors. Licensee MDPI, Basel, Switzerland. This article is an open access article distributed under the terms and conditions of the Creative Commons Attribution (CC BY) license (https://creativecommons.org/licenses/by/4.0/).
Share and Cite
Huang, C.-M.; Huang, H.-M.; Li, Y.-H.; Liang, X.-W.; Kim, N.-H.; Xu, Y.-N. Effects of Caffeic Acid Phenethyl Ester on Embryonic Development Through Regulation of Mitochondria and Endoplasmic Reticulum. Vet. Sci. 2024, 11, 625. https://doi.org/10.3390/vetsci11120625
Huang C-M, Huang H-M, Li Y-H, Liang X-W, Kim N-H, Xu Y-N. Effects of Caffeic Acid Phenethyl Ester on Embryonic Development Through Regulation of Mitochondria and Endoplasmic Reticulum. Veterinary Sciences. 2024; 11(12):625. https://doi.org/10.3390/vetsci11120625
Chicago/Turabian StyleHuang, Chu-Man, Hui-Mei Huang, Ying-Hua Li, Xing-Wei Liang, Nam-Hyung Kim, and Yong-Nan Xu. 2024. "Effects of Caffeic Acid Phenethyl Ester on Embryonic Development Through Regulation of Mitochondria and Endoplasmic Reticulum" Veterinary Sciences 11, no. 12: 625. https://doi.org/10.3390/vetsci11120625
APA StyleHuang, C.-M., Huang, H.-M., Li, Y.-H., Liang, X.-W., Kim, N.-H., & Xu, Y.-N. (2024). Effects of Caffeic Acid Phenethyl Ester on Embryonic Development Through Regulation of Mitochondria and Endoplasmic Reticulum. Veterinary Sciences, 11(12), 625. https://doi.org/10.3390/vetsci11120625