

The Clinical Application of Dynamic Contrast-Enhanced MRI in Canine Masses of Mesenchymal and Epithelial Origin: A Preliminary Case Series


Simple Summary
Abstract
1. Introduction
2. Material and Methods
2.1. Study Design
2.2. MRI and CT Examination Protocol
2.3. DCE-MRI Data Analysis
3. Results
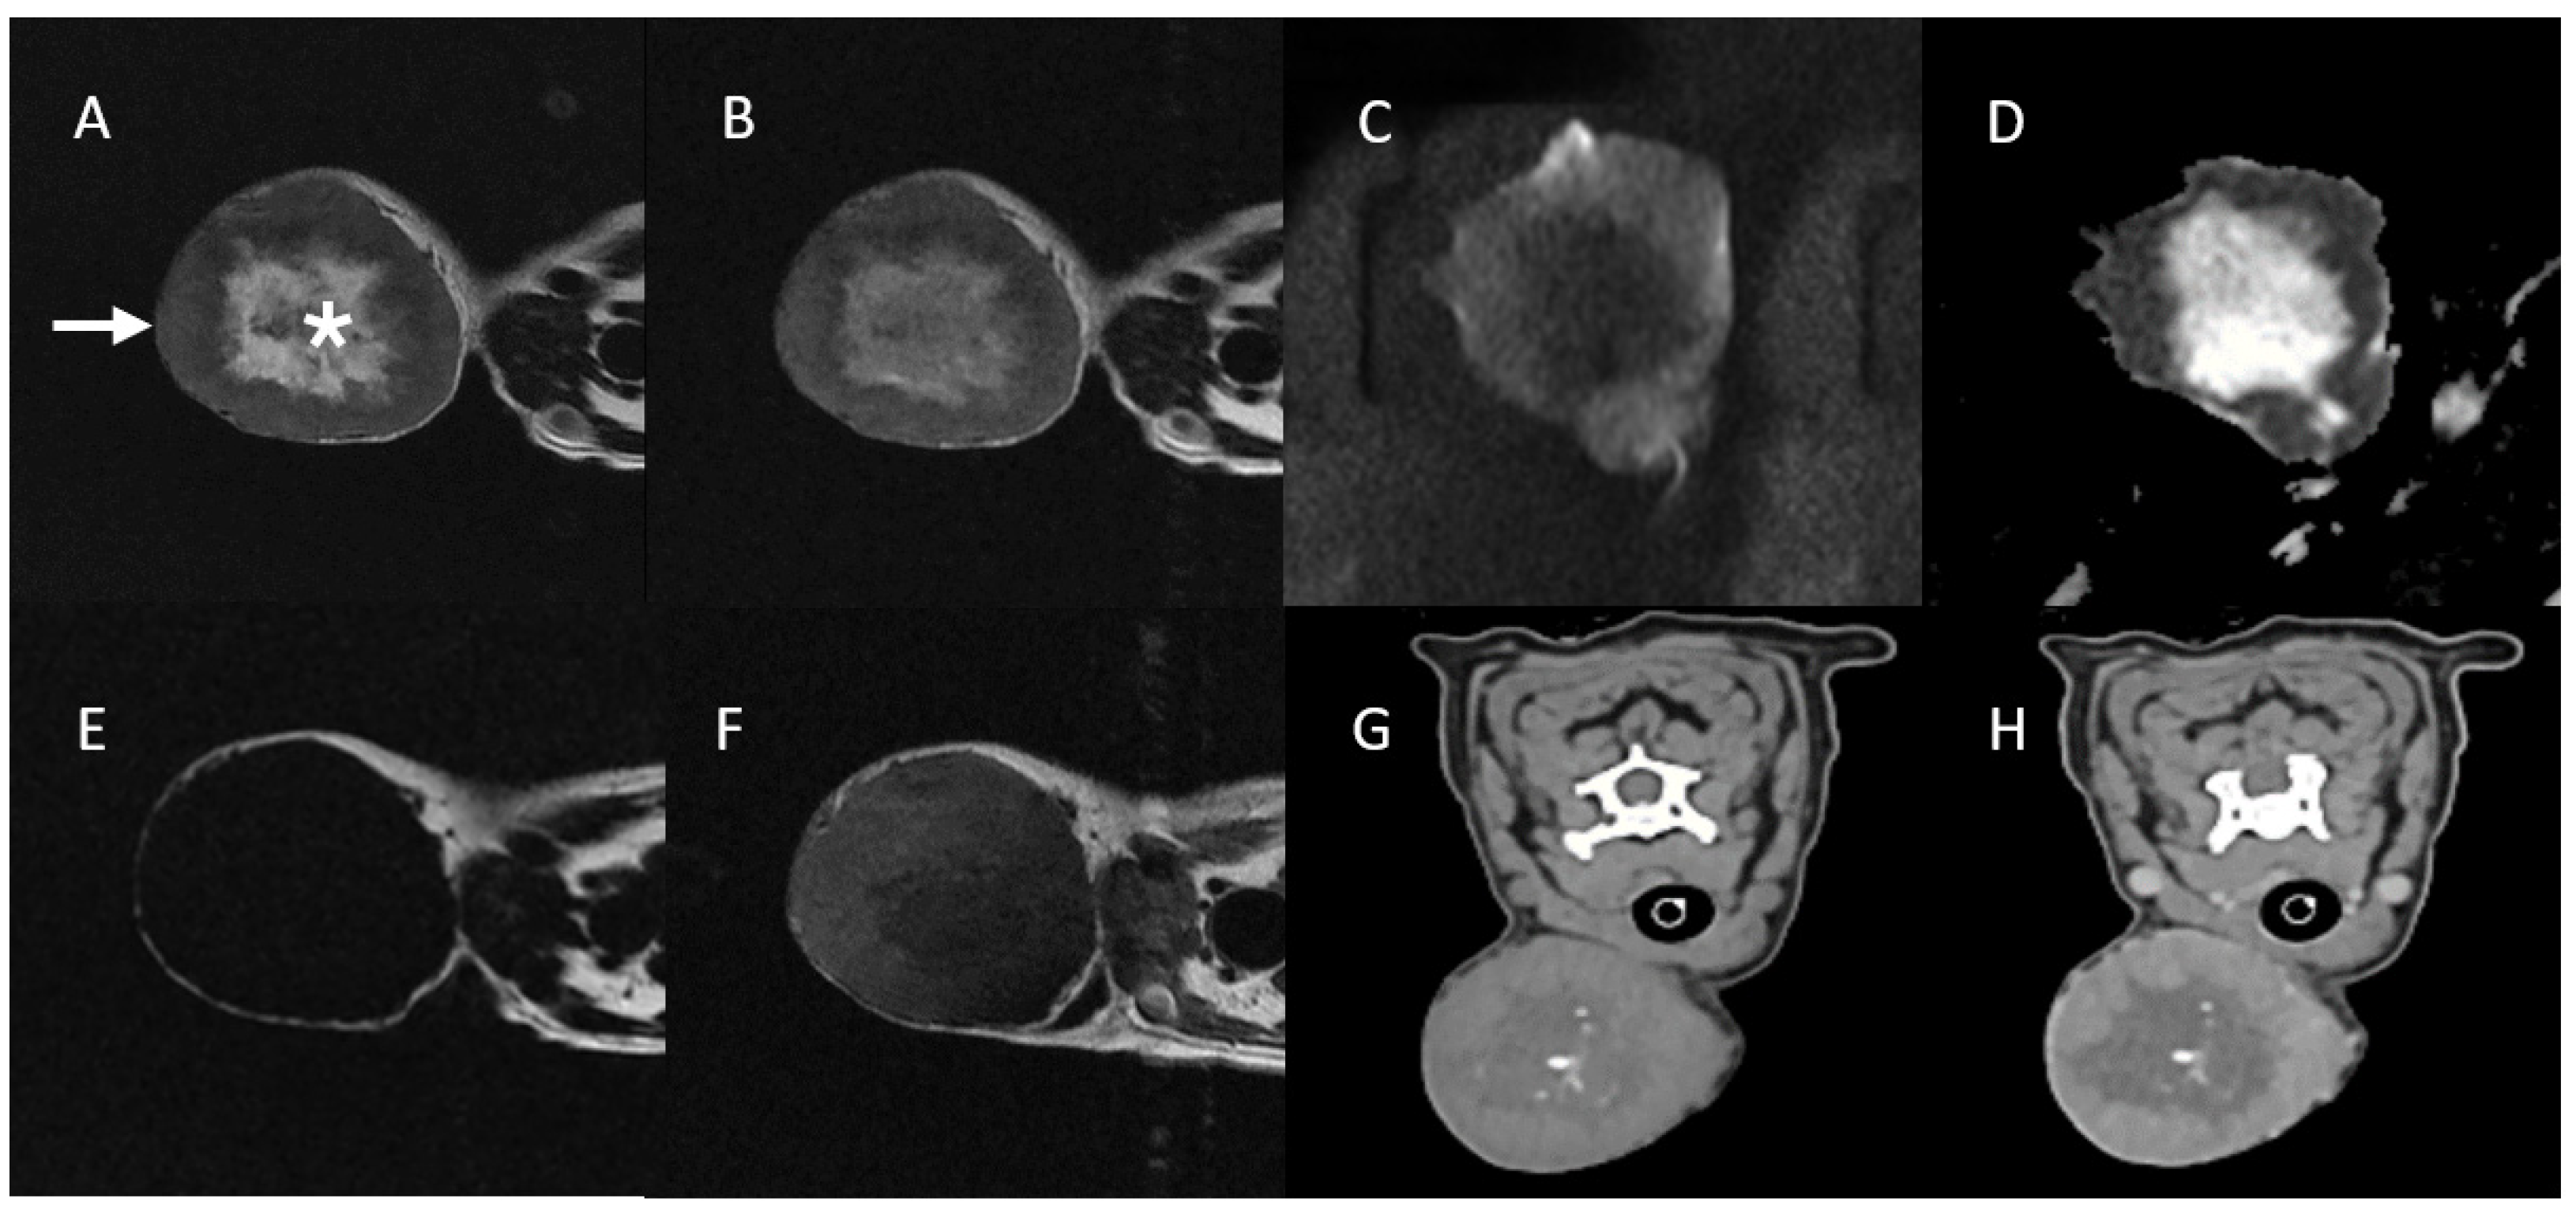
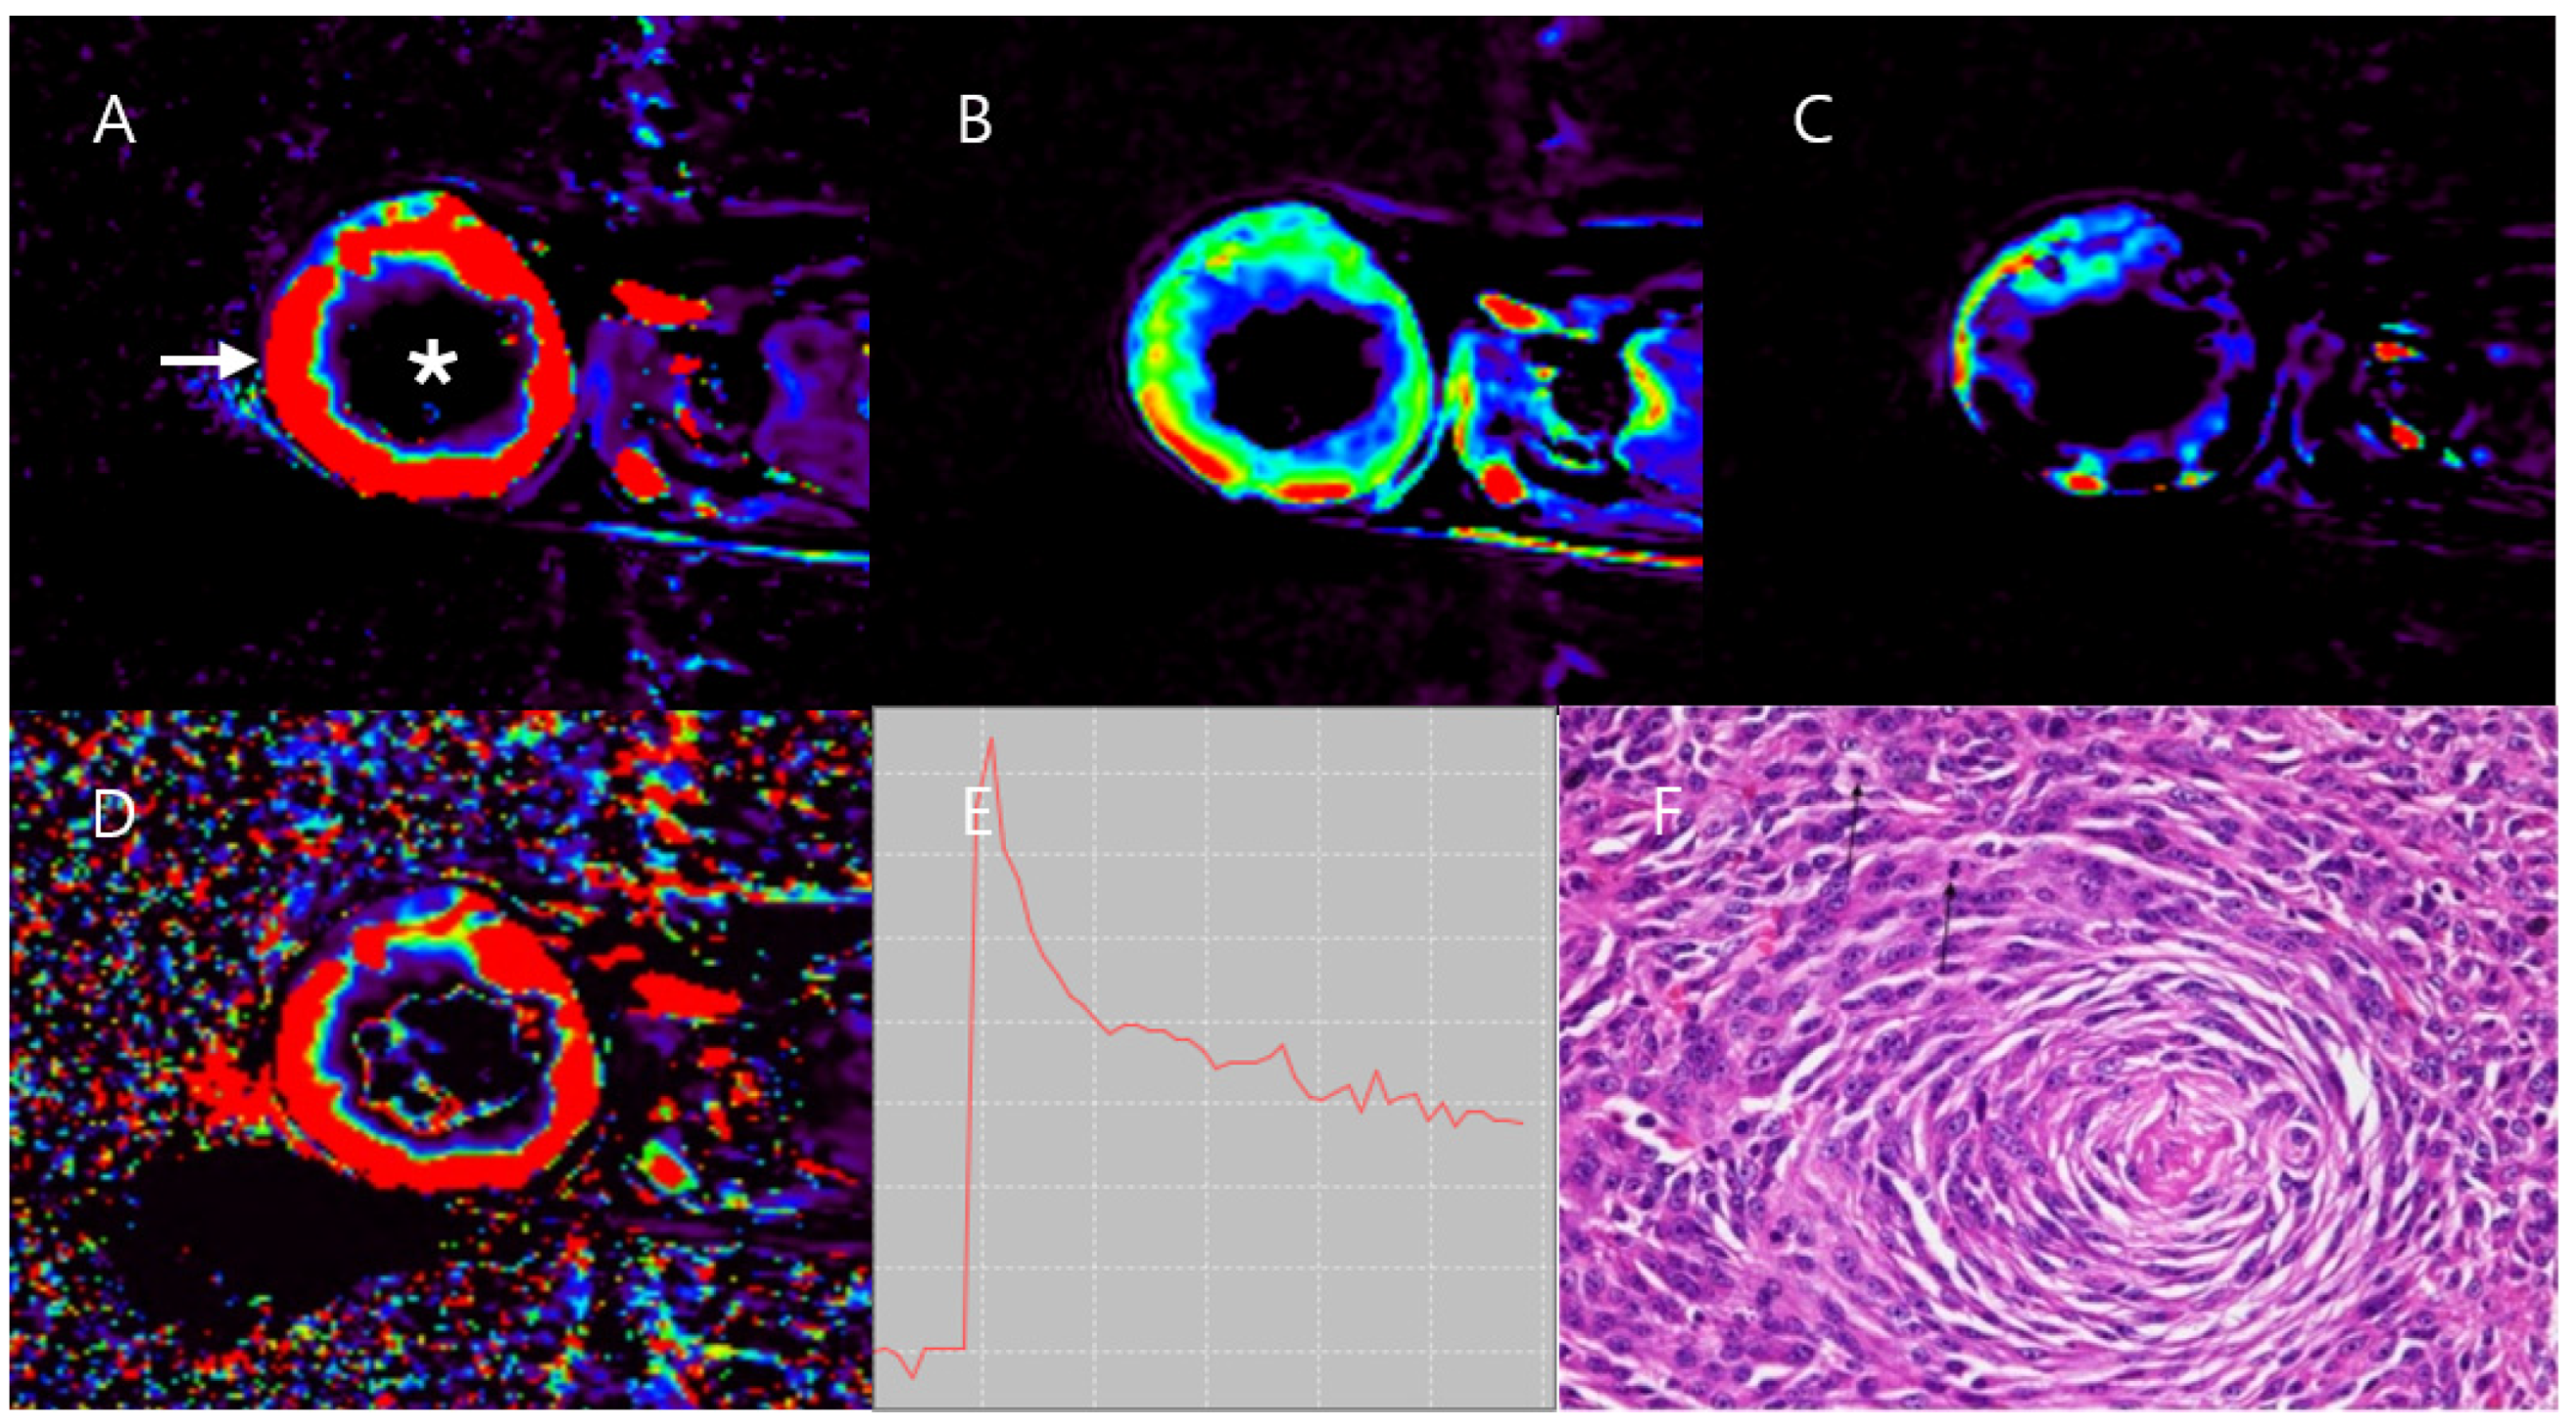
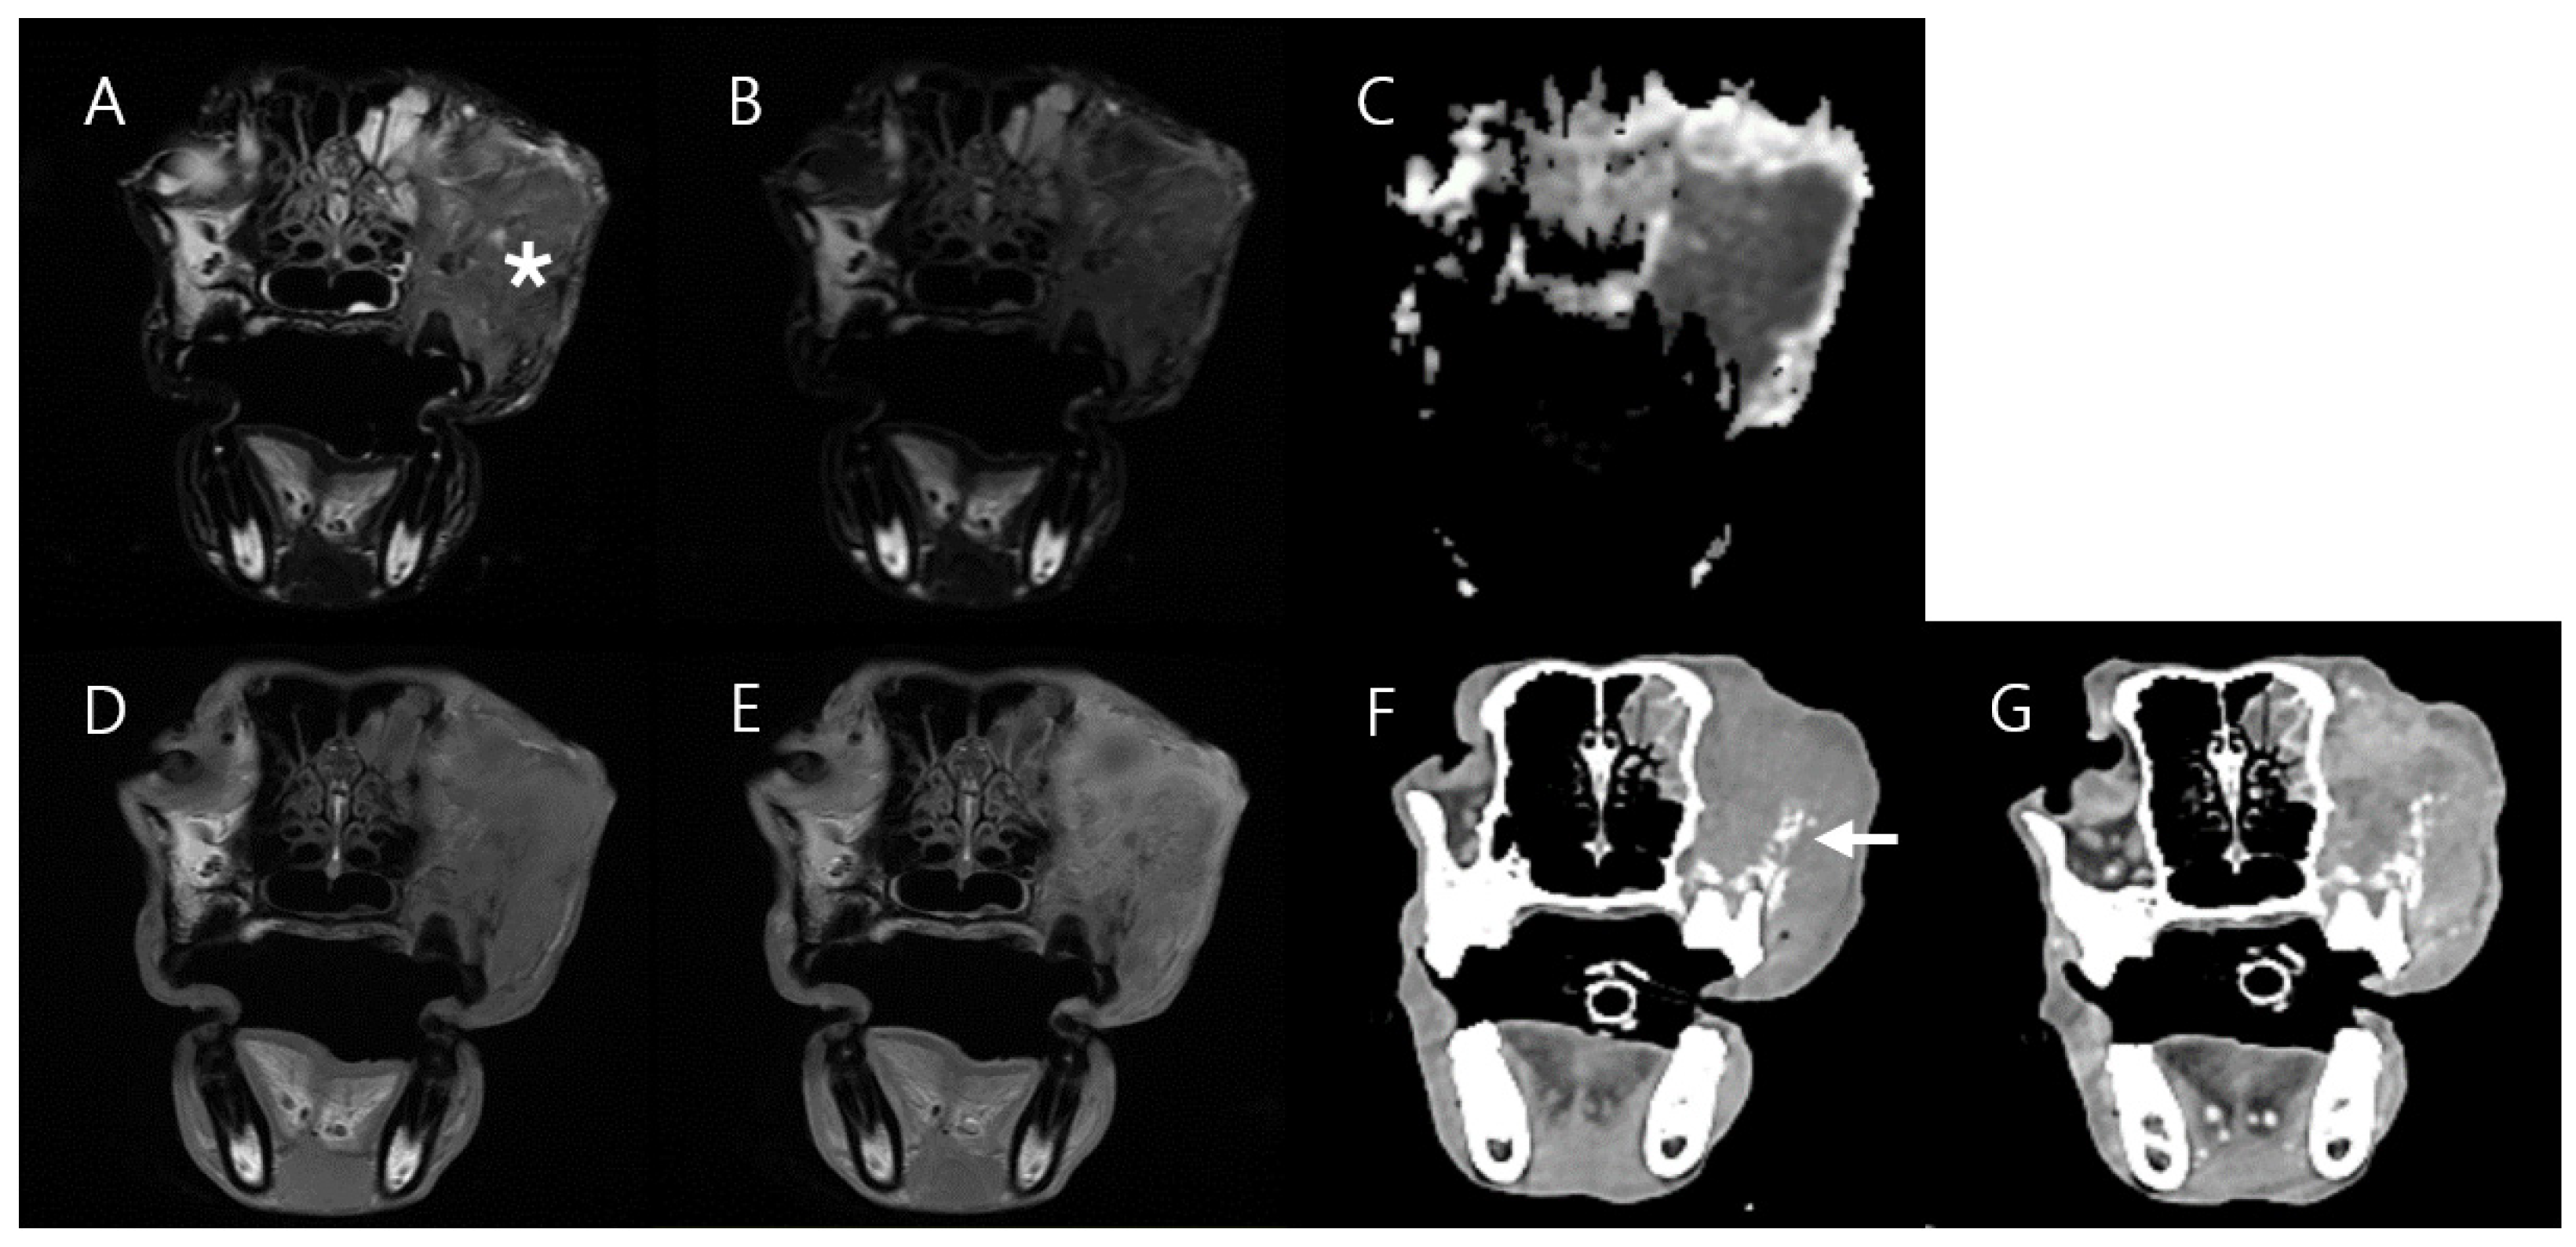
3.1. Case 1
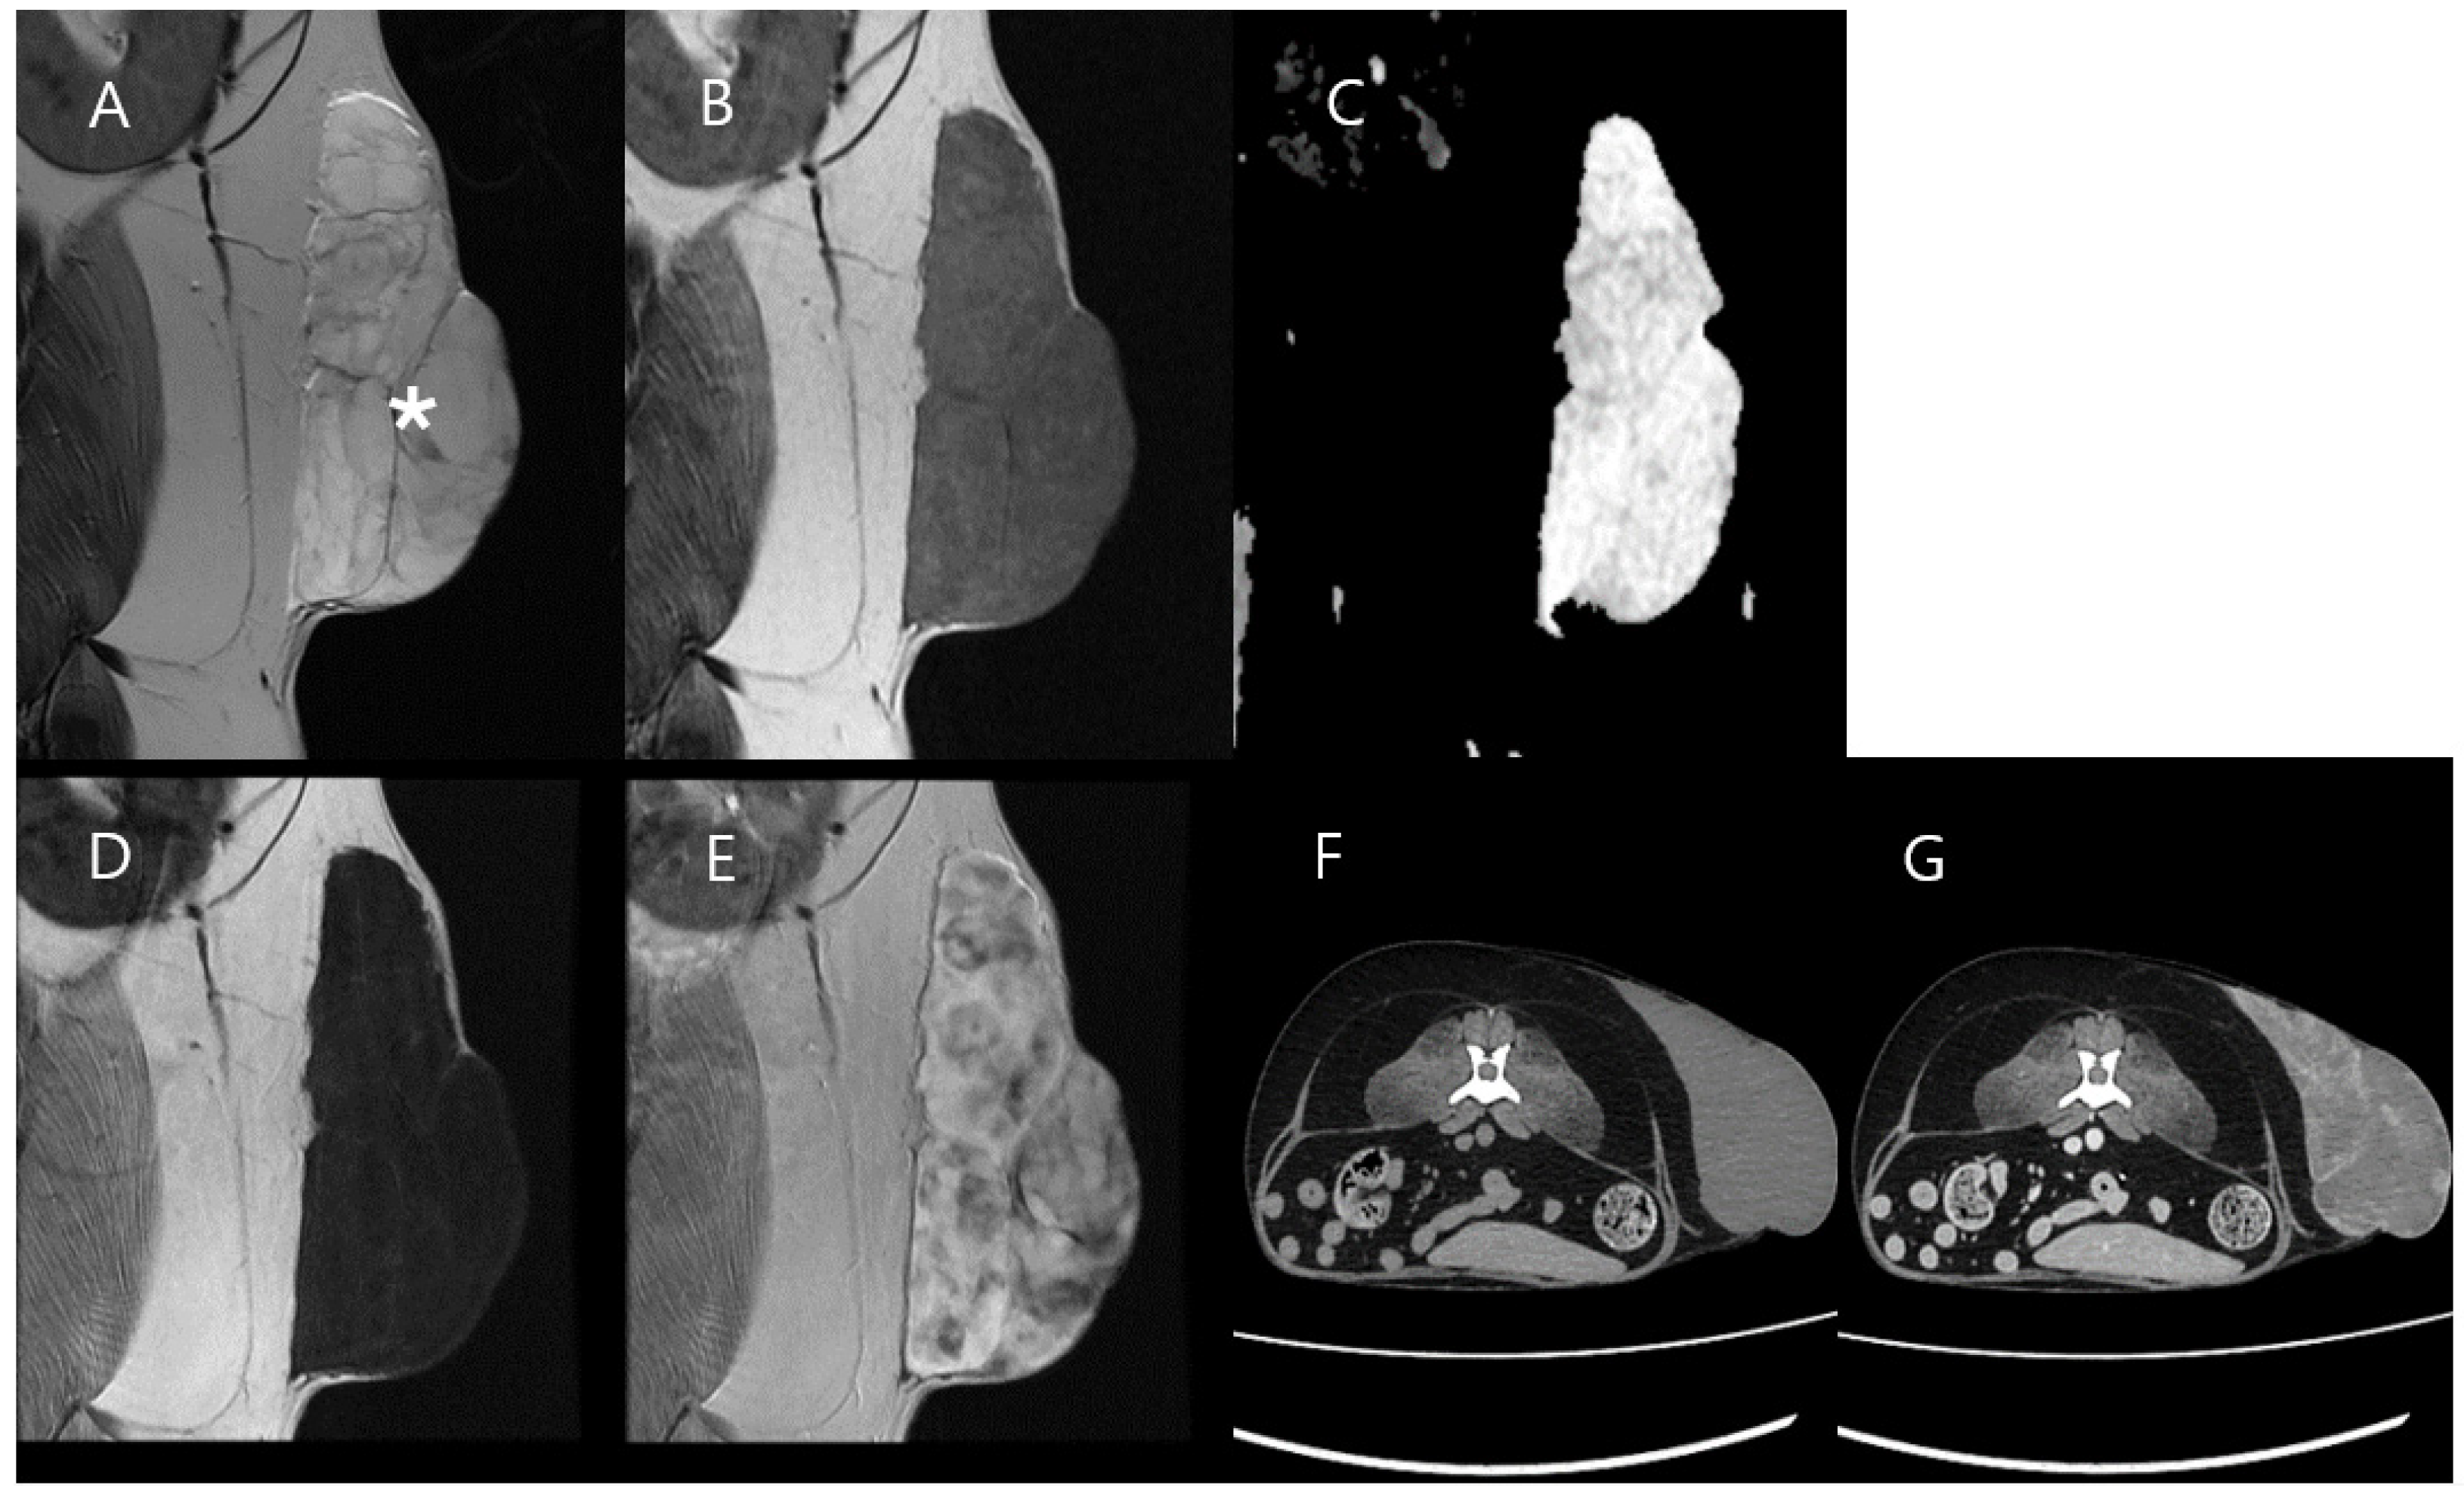
3.2. Case 2
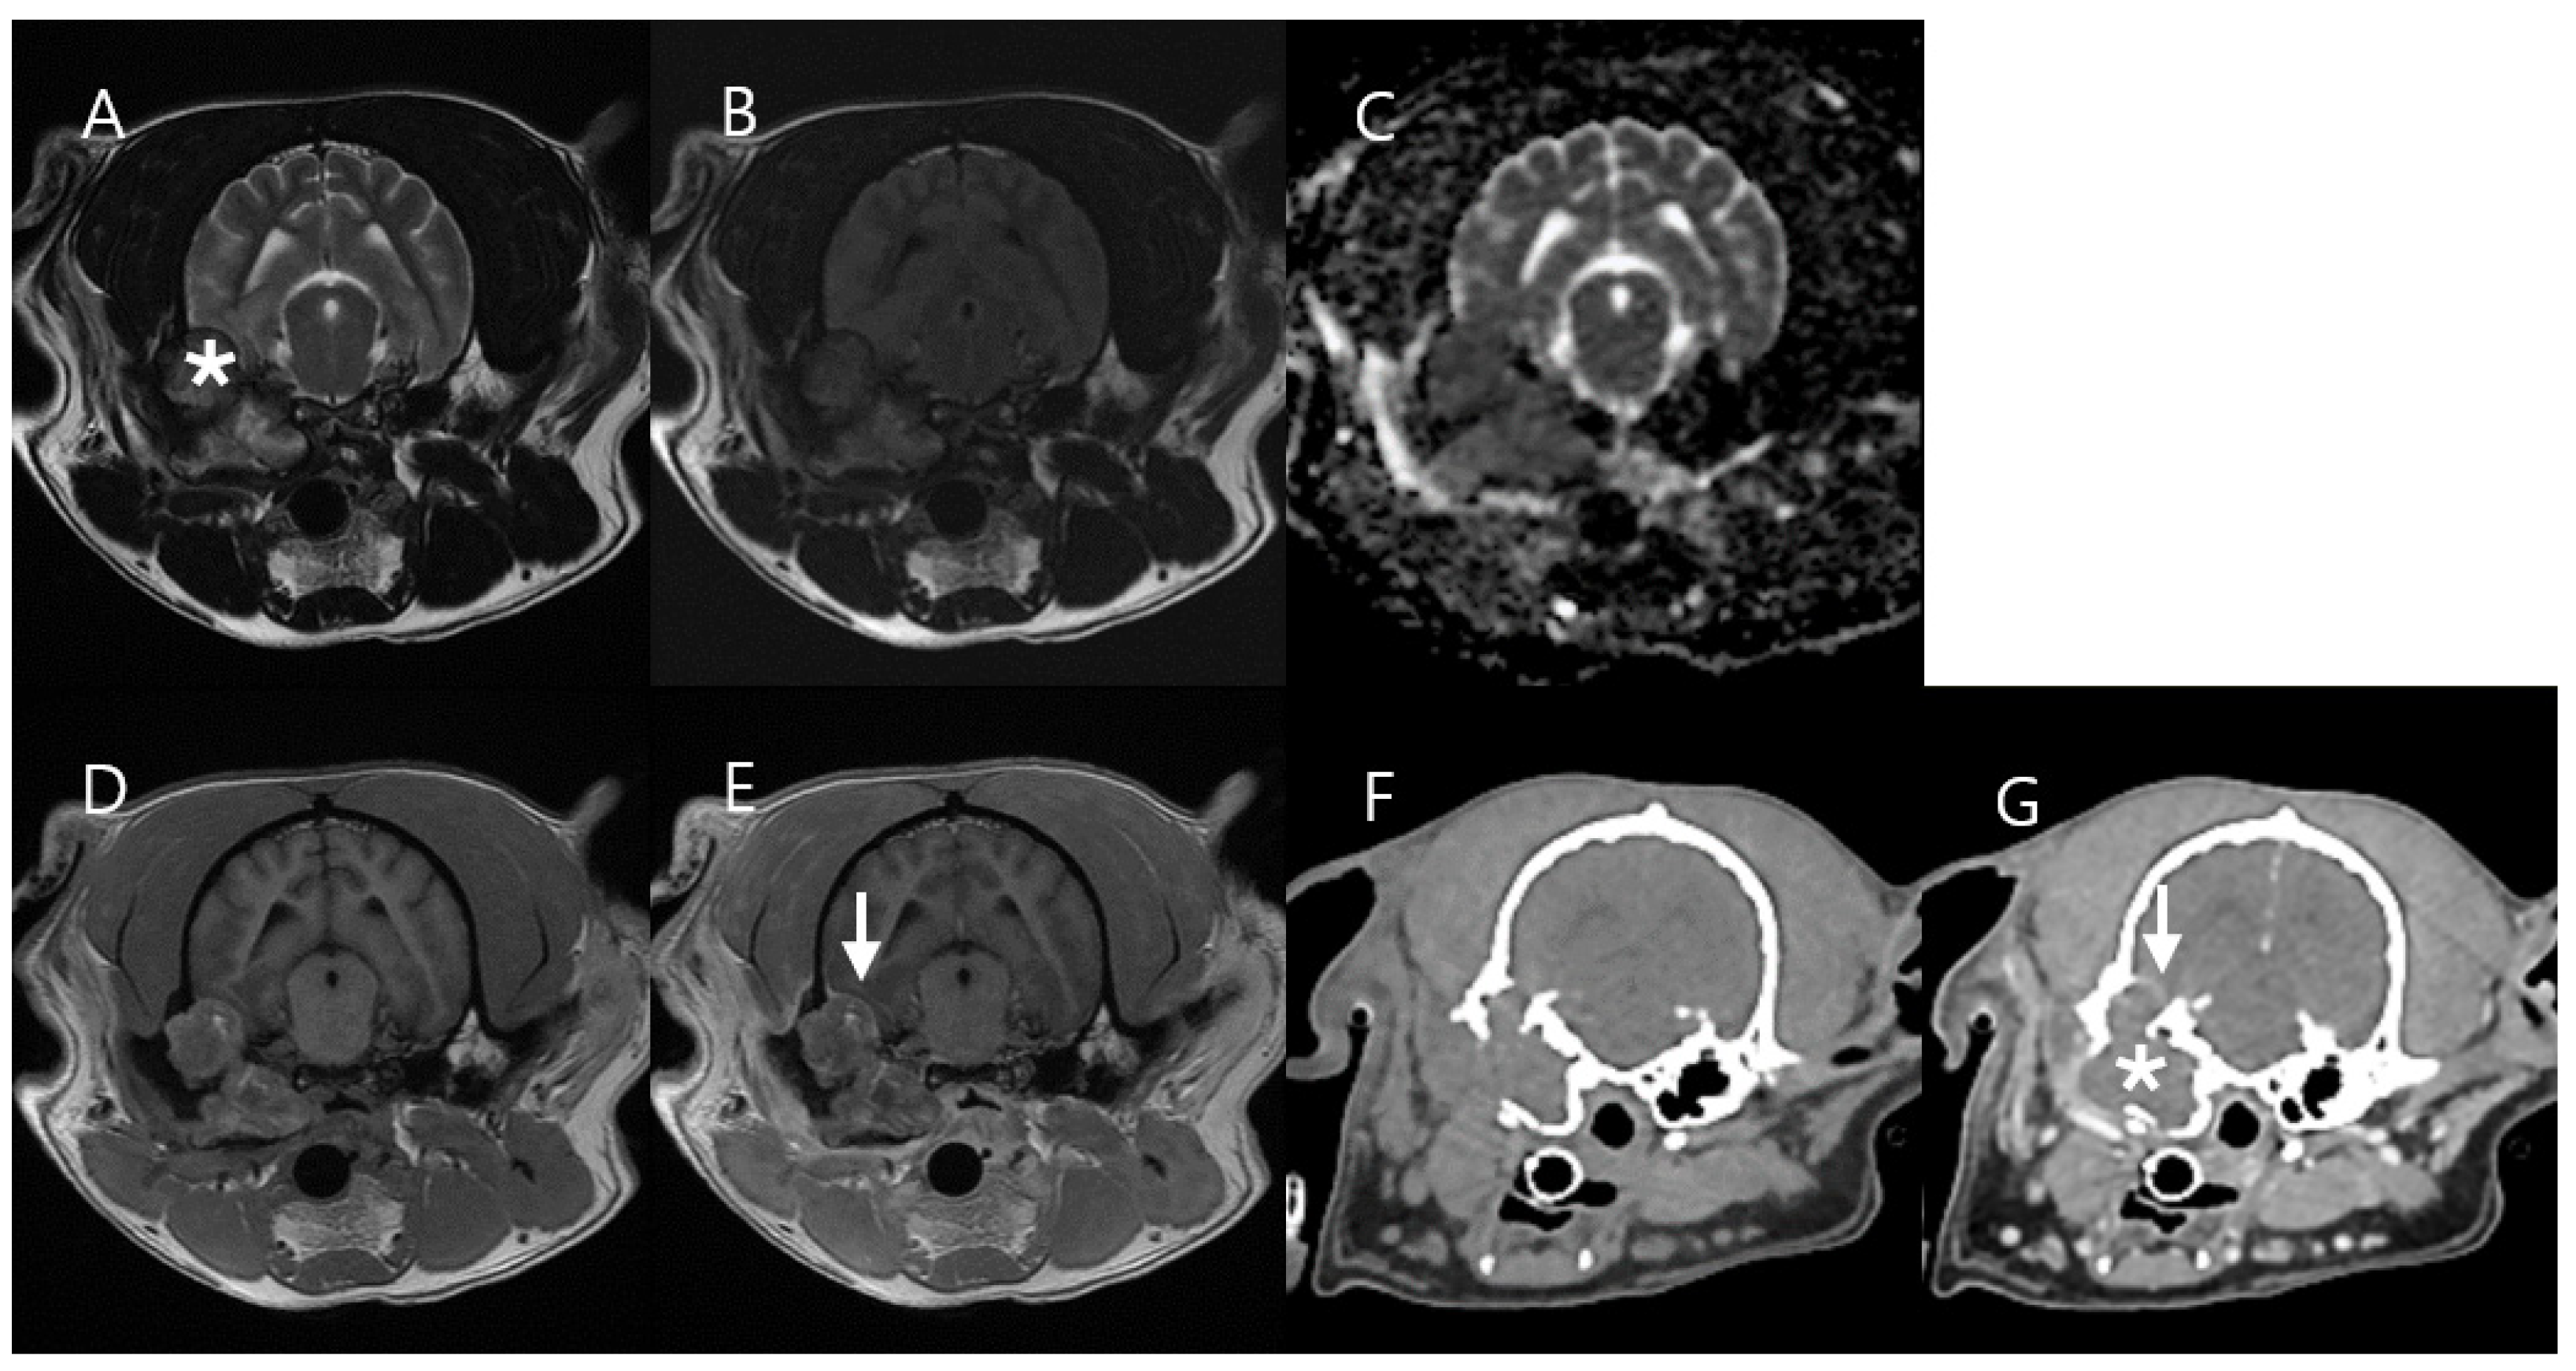
3.3. Case 3
3.4. Case 4
4. Discussion
5. Conclusions
Author Contributions
Funding
Institutional Review Board Statement
Informed Consent Statement
Data Availability Statement
Conflicts of Interest
References
- Vail, D.M.; Thamm, D.H.; Liptak, J.M. (Eds.) Withrow and MacEwen’s Small Animal Clinical Oncology-E-Book; Elsevier Health Sciences: Amsterdam, The Netherlands, 2019; pp. 352–353, 404–405. [Google Scholar]
- Tariq, M.U.; Din, N.U.; Abdul-Ghafar, J.; Park, Y.K. The many faces of solitary fibrous tumor; diversity of histological features, differential diagnosis and role of molecular studies and surrogate markers in avoiding misdiagnosis and predicting the behavior. Diagn. Pathol. 2021, 16, 32. [Google Scholar] [CrossRef] [PubMed]
- Namazi, F.; Abbaszadeh Hasiri, M.; Oryan, A.; Moshiri, A. Hemangiopericytoma in a young dog: Evaluation of histopathological and immunohistochemical features. In Vet Res Forum; Faculty of Veterinary Medicine, Urmia University: Urmia, Iran, 2014; Volume 5, pp. 157–160. [Google Scholar]
- Cohn-Urbach, M.; Chen, A.; Haldorson, G.; Thomovsky, S. Perivascular wall tumor in the brain of a dog. Case Rep. Vet. Med. 2015, 2015, 725985. [Google Scholar] [CrossRef]
- Iwaki, Y.; Lindley, S.; Smith, A.; Curran, K.M.; Looper, J. Canine myxosarcomas, a retrospective analysis of 32 dogs (2003–2018). BMC Vet. Res. 2019, 15, 217. [Google Scholar] [CrossRef] [PubMed]
- Parslow, A.; Taylor, D.P.; Simpson, D.J. Clinical, computed tomographic, magnetic resonance imaging, and histologic findings associated with myxomatous neoplasia of the temporomandibular joint in two dogs. J. Am. Vet. Med. Assoc. 2016, 249, 1301–1307. [Google Scholar] [CrossRef]
- Willcox, J.L.; Marks, S.L.; Ueda, Y.; Skorupski, K.A. Clinical features and outcome of dermal squamous cell carcinoma in 193 dogs (1987–2017). Vet. Comp. Oncol. 2019, 17, 130–138. [Google Scholar] [CrossRef]
- Pitzorno, I.; Carrozza, M.; Destrero, G. MRI findings of middle ear cholesteatoma in dogs: 6 cases and literature review. Veterinaria 2018, 32, 177–192. [Google Scholar]
- Yung, M.; Tono, T.; Olszewska, E.; Yamamoto, Y.; Sudhoff, H.; Sakagami, M.; Mulder, J.; Kojima, H.; İncesulu, A.; Trabalzini, F.; et al. EAONO/JOS joint consensus statements on the definitions, classification and staging of middle ear cholesteatoma. J. Int. Adv. Otol. 2017, 13, 1–8. [Google Scholar] [CrossRef]
- Wu, J.S.; Hochman, M.G. Soft-tissue tumors and tumorlike lesions: A systematic imaging approach. Radiology 2009, 253, 297–316. [Google Scholar] [CrossRef]
- Crombé, A.; Marcellin, P.J.; Buy, X.; Stoeckle, E.; Brouste, V.; Italiano, A.; Le Loarer, F.; Kind, M. Soft-tissue sarcomas: Assessment of MRI features correlating with histologic grade and patient outcome. Radiology 2019, 291, 710–721. [Google Scholar] [CrossRef]
- Wippold, F.J.; Franz, J. Head and neck imaging: The role of CT and MRI. J. Magn. Reson. Imaging 2007, 25, 453–465. [Google Scholar] [CrossRef]
- Van Vliet, M.; Kliffen, M.; Krestin, G.P.; van Dijke, C.F. Soft tissue sarcomas at a glance: Clinical, histological, and MR imaging features of malignant extremity soft tissue tumors. Eur. Radiol. 2009, 19, 1499–1511. [Google Scholar] [CrossRef] [PubMed]
- Baba, A.; Kurokawa, R.; Rawie, E.; Kurokawa, M.; Ota, Y.; Srinivasan, A. Normalized parameters of dynamic contrast-enhanced perfusion MRI and DWI-ADC for differentiation between posttreatment changes and recurrence in head and neck cancer. AJNR Am. J. Neuroradiol. 2022, 43, 1184–1189. [Google Scholar] [CrossRef] [PubMed]
- Hansen, K.S.; Kent, M.S. Imaging in non-neurologic oncologic treatment planning of the head and neck. Front. Vet. Sci. 2019, 6, 90. [Google Scholar] [CrossRef] [PubMed]
- Lee, S.; Jang, Y.; Lee, G.; Jeon, S.; Kim, D.; Choi, J. CT features of malignant and benign oral tumors in 28 dogs. Vet. Radiol. Ultrasound 2021, 62, 549–556. [Google Scholar] [CrossRef] [PubMed]
- Smirniotopoulos, J.G.; Murphy, F.M.; Rushing, E.J.; Rees, J.H.; Schroeder, J.W. Patterns of contrast enhancement in the brain and meninges. RadioGraphics 2007, 27, 525–551. [Google Scholar] [CrossRef]
- Walker, A.J.; Ruzevick, J.; Malayeri, A.A.; Rigamonti, D.; Lim, M.; Redmond, K.J.; Kleinberg, L. Postradiation imaging changes in the CNS: How can we differentiate between treatment effect and disease progression? Future Oncol. 2014, 10, 1277–1297. [Google Scholar] [CrossRef]
- Allam, T.; Sweis, R.; Sander, P.S. MRI spot sign: Gadolinium contrast extravasation in an expanding intracerebral hematoma on MRI. Radiol. Case Rep. 2019, 14, 535–537. [Google Scholar] [CrossRef]
- Barnes, S.L.; Whisenant, J.G.; Loveless, M.E.; Yankeelov, T.E. Practical dynamic contrast enhanced MRI in small animal models of cancer: Data acquisition, data analysis, and interpretation. Pharmaceutics 2012, 4, 442–478. [Google Scholar] [CrossRef]
- Gaddikeri, S.; Gaddikeri, R.S.; Tailor, T.; Anzai, Y. Dynamic contrast-enhanced MR imaging in head and neck cancer: Techniques and clinical applications. AJNR Am. J. Neuroradiol. 2016, 37, 588–595. [Google Scholar] [CrossRef]
- Chawla, S.; Kim, S.; Dougherty, L.; Wang, S.; Loevner, L.A.; Quon, H.; Poptani, H. Pretreatment diffusion-weighted and dynamic contrast-enhanced MRI for prediction of local treatment response in squamous cell carcinomas of the head and neck. AJR Am. J. Roentgenol. 2013, 200, 35–43. [Google Scholar] [CrossRef]
- Stumpo, V.; Guida, L.; Bellomo, J.; Van Niftrik, C.H.B.; Sebök, M.; Berhouma, M.; Bink, A.; Weller, M.; Kulcsar, Z.; Regli, L.; et al. Hemodynamic imaging in cerebral diffuse glioma—Part B: Molecular correlates, treatment effect monitoring, prognosis, and future directions. Cancers 2022, 14, 1342. [Google Scholar] [CrossRef] [PubMed]
- Furukawa, M.; Parvathaneni, U.; Maravilla, K.; Richards, T.L.; Anzai, Y. Dynamic contrast-enhanced MR perfusion imaging of head and neck tumors at 3 Tesla. Head Neck 2013, 35, 923–929. [Google Scholar] [CrossRef] [PubMed]
- El Backry, M.; Shady, M.; Mousa, A.E.; Zaky, M.M. Role of dynamic contrast enhanced MR perfusion in differentiation between benign and malignant tumors. Egypt J. Rad. Nucl. Med. 2015, 46, 715–726. [Google Scholar] [CrossRef]
- Albano, D.; Bruno, F.; Agostini, A.; Angileri, S.A.; Benenati, M.; Bicchierai, G.; Cellina, M.; Chianca, V.; Cozzi, D.; Danti, G.; et al. Dynamic contrast-enhanced (DCE) imaging: State of the art and applications in whole-body imaging. Jpn. J. Rad. 2022, 40, 341–366. [Google Scholar] [CrossRef] [PubMed]
- Boss, M.K.; Muradyan, N.; Thrall, D.E. DCE-MRI: A review and applications in veterinary oncology. Vet. Comp. Oncol. 2013, 11, 87–100. [Google Scholar] [CrossRef] [PubMed]
- Hanael, E.; Baruch, S.; Chai, O.; Nir, Z.; Rapoport, K.; Ruggeri, M.; Eizenberg, I.; Peery, D.; Friedman, A.; Shamir, M.H. Detection of blood-brain barrier dysfunction using advanced imaging methods to predict seizures in dogs with meningoencephalitis of unknown origin. J. Vet. Intern. Med. 2022, 36, 702–712. [Google Scholar] [CrossRef]
- Hanael, E.; Baruch, S.; Chai, O.; Lishitsky, L.; Blum, T.; Rapoport, K.; Ruggeri, M.; Aizenberg, Z.; Peery, D.; Meyerhoff, N.; et al. Quantitative analysis of magnetic resonance images for characterization of blood-brain barrier dysfunction in dogs with brain tumors. J. Vet. Intern. Med. 2023, 37, 606–617. [Google Scholar] [CrossRef]
- Shukla-Dave, A.; Obuchowski, N.A.; Chenevert, T.L.; Jambawalikar, S.; Schwartz, L.H.; Malyarenko, D.; Huang, W.; Noworolski, S.M.; Young, R.J.; Shiroishi, M.S.; et al. Quantitative imaging biomarkers alliance (QIBA) recommendations for improved precision of DWI and DCE-MRI derived biomarkers in multicenter oncology trials. J. Magn. Reson. Imaging 2019, 49, e101–e121. [Google Scholar] [CrossRef]
- Zhang, Y.; Yue, B.; Zhao, X.; Chen, H.; Sun, L.; Zhang, X.; Hao, D. Benign or malignant characterization of soft-tissue tumors by using semiquantitative and quantitative parameters of dynamic contrast-enhanced magnetic resonance imaging. Can. Assoc. Radiol. J. 2020, 71, 92–99. [Google Scholar] [CrossRef]
- Li, X.; Wang, Q.; Dou, Y.; Zhang, Y.; Tao, J.; Yang, L.; Wang, S. Soft tissue sarcoma: Can dynamic contrast-enhanced (DCE) MRI be used to predict the histological grade? Skelet. Radiol. 2020, 49, 1829–1838. [Google Scholar] [CrossRef]
- Macagno, N.; Vogels, R.; Appay, R.; Colin, C.; Mokhtari, K.; French CNS SFT/HPC Consortium; Dutch CNS SFT/HPC Consortium; Küsters, B.; Wesseling, P.; Figarella-Branger, D. 0 Grading of meningeal solitary fibrous tumors/hemangiopericytomas: Analysis of the prognostic value of the marseille grading system in a cohort of 132 patients. Brain Pathol. 2019, 29, 18–27. [Google Scholar] [CrossRef] [PubMed]
- Lorigan, J.G.; David, C.L.; Evans, H.L.; Wallace, S. The clinical and radiologic manifestations of hemangiopericytoma. AJR Am. J. Roentgenol. 1989, 153, 345–349. [Google Scholar] [CrossRef] [PubMed]
- Durur-Subasi, I.; Durur-Karakaya, A.; Karaman, A.; Seker, M.; Demirci, E.; Alper, F. Is the necrosis/wall ADC ratio useful for the differentiation of benign and malignant breast lesions? Bri. J. Radiol. 2017, 90, 20160803. [Google Scholar] [CrossRef] [PubMed]
- Yuan, Z.; Li, W.T.; Ye, X.D.; Peng, W.J.; Xiao, X.S. Utility of diffusion-weighted imaging to assess hepatocellular carcinoma viability following transarterial chemoembolization. Oncol. Lett. 2014, 8, 831–836. [Google Scholar] [CrossRef] [PubMed]
- Singer, A.D.; Pattany, P.M.; Fayad, L.M.; Tresley, J.; Subhawong, T.K. Volumetric segmentation of ADC maps and utility of standard deviation as measure of tumor heterogeneity in soft tissue tumors. Clin. Imaging 2016, 40, 386–391. [Google Scholar] [CrossRef]
- Hwang, Z.A.; Suh, K.J.; Chen, D.; Chan, W.P.; Wu, J.S. Imaging features of soft-tissue calcifications and related diseases: A systematic approach. Korean J. Radiol. 2018, 19, 1147–1160. [Google Scholar] [CrossRef]
- Chuma, M.; Yokoo, H.; Hiraoka, A.; Ueda, K.; Yokoyama, T.; Tsuji, K.; Shimada, N.; Uojima, H.; Kobayashi, S.; Hattori, N.; et al. Identification of CT values that could be predictive of necrosis (N-CTav) in hepatocellular carcinoma after lenvatinib treatment. Curr. Oncol. 2022, 29, 3259–3271. [Google Scholar] [CrossRef]
- Adams, H.J.A.; de Klerk, J.M.H.; Fijnheer, R.; Dubois, S.V.; Nievelstein, R.A.J.; Kwee, T.C. Prognostic value of tumor necrosis at CT in diffuse large B-cell lymphoma. Eur. J. Radiol. 2015, 84, 372–377. [Google Scholar] [CrossRef]
- Ratzka, M.; Haubitz, I. Brain tumor CT attenuation coefficients: Semiquantitative analysis of histograms. Am. J. Neuroradiol. 1983, 4, 505–508. [Google Scholar]
- Egeland, T.A.M.; Gaustad, J.V.; Galappathi, K.; Rofstad, E.K. Magnetic resonance imaging of tumor necrosis. Acta Oncol. 2011, 50, 427–434. [Google Scholar] [CrossRef]
- Yee, P.P.; Li, W. Tumor necrosis: A synergistic consequence of metabolic stress and inflammation. BioEssays 2021, 43, e2100029. [Google Scholar] [CrossRef] [PubMed]
- Gaustad, J.V.; Hauge, A.; Wegner, C.S.; Simonsen, T.G.; Lund, K.V.; Hansem, L.M.K.; Rofstad, E.K. DCE-MRI of tumor hypoxia and hypoxia-associated aggressiveness. Cancers 2020, 12, 1979. [Google Scholar] [CrossRef] [PubMed]
- Lim, W.H.; Park, J.S.; Park, J.; Choi, S.H. Assessing the reproducibility of high temporal and spatial resolution dynamic contrast-enhanced magnetic resonance imaging in patients with gliomas. Sci. Rep. 2021, 11, 23217. [Google Scholar] [CrossRef] [PubMed]


| Case | Breed | Age (year) | Sex | Weight (kg) | Imaging Modality | Lesion Location |
|---|---|---|---|---|---|---|
| 1 | Yorkshire Terrier | 13 | Castrated male | 4.6 | Conventional MRI, DCE-MRI, CT | Neck (Subcutaneous) |
| 2 | Spitz | 12 | Castrated male | 11.3 | Conventional MRI, DCE-MRI, CT | Lt. flank (Subcutaneous) |
| 3 | Jindo mix | 6 | Sprayed female | 12.3 | Conventional MRI, DCE-MRI, CT | Rt. middle ear |
| 4 | Belgian Malinois | 9 | Female | 17.2 | Conventional MRI, DCE-MRI, CT | Lt. facial region |
| Case | Pre-T1 Map | Flip Angle | TR (ms) | TE (ms) | Voxel Size (mm3) | Temporal Resolution (s) |
|---|---|---|---|---|---|---|
| 1 | X * | 35° | 7 | 2 | 1.6 × 1.6 × 10 | 5 |
| 2 | O | 25° | 4 | 1 | 1.2 × 1.2 × 4 | 5 |
| 3 | O | 15° | 5 | 2 | 1.2 × 1.2 × 4 | 5 |
| 4 | O | 15° | 4 | 1 | 1.2 × 1.2 × 4 | 5 |
| Case 1 * | Case 2 * | |||
|---|---|---|---|---|
| Mass Type | Soft Tissue Sarcoma (Hemangiopericytoma, Grade II) | Normal Region (Adjacent Muscle) | Soft Tissue Sarcoma (Myxosarcoma, Grade I) | Normal Region (Adjacent Muscle) |
| Ktrans (min−1), mean ± SD | 1.393 ± 0.026 (Peripheral mass region) 0.013 ± 0.079 (Central mass region) | 0.089 ± 0.042 | 0.176 ± 0.064 | 0.059 ± 0.141 |
| kep (min−1) mean ± SD | 5.137 ± 0.643 (Peripheral mass region) 0.992 ± 1.409 (Central mass region) | 0.381 ± 0.118 | 0.305 ± 0.108 | 0.699 ± 0.883 |
| Ve mean ± SD | 0.499 ± 0.107 (Peripheral mass region) 0.014 ± 0.043 (Central mass region) | 0.239 ± 0.089 | 0.585 ± 0.209 | 0.088 ± 0.115 |
| Vp mean ± SD | 0.241 ± 0.099 (Peripheral mass region) 0.011 ± 0.00006 (Central mass region) | 0.001 ± 0.00006 | 0.003 ± 0.00006 | 0.019 ± 0.045 |
| TIC Type | Fast wash-in, Fast wash-out (Peripheral mass region) Plateau (Central mass region) | Progressive | Progressive | Plateau |
| Case 3 * | Case 4 ** | |||
|---|---|---|---|---|
| Mass Type | Cholesteatoma | Normal Region (Contralateral Bulla) | Squamous Cell Carcinoma | Normal Region (Contralateral Muscle) |
| Ktrans (min−1), mean ± SD | 0.043 ± 0.1 | 0 | 0.24 ± 0.136 (Central mass region) 0.667 ± 0.143 (Peripheral mass region) | 0.058 ± 0.074 |
| kep (min−1) mean ± SD | 1.812 ± 2.318 | 0 | 0.83 ± 0.561 (Central mass region) 2.866 ± 0.568 (Peripheral mass region) | 0.57 ± 1.911 |
| Ve mean ± SD | 0.023 ± 0.052 | 0 | 0.296 ± 0.064 (Central mass region) 0.236 ± 0.038 (Peripheral mass region) | 0.144 ± 0.041 |
| Vp mean ± SD | 0.001 ± 0.014 | 0 | 0.103 ± 0.046 (Central mass region) 0.188 ± 0.048 (Peripheral mass region) | 0.065 ± 0.055 |
| TIC Type | Plateau | Absent | Progressive (Central mass region) Rapid wash-in, Slow wash-out (Peripheral mass region) | Progressive |
Disclaimer/Publisher’s Note: The statements, opinions and data contained in all publications are solely those of the individual author(s) and contributor(s) and not of MDPI and/or the editor(s). MDPI and/or the editor(s) disclaim responsibility for any injury to people or property resulting from any ideas, methods, instructions or products referred to in the content. |
© 2024 by the authors. Licensee MDPI, Basel, Switzerland. This article is an open access article distributed under the terms and conditions of the Creative Commons Attribution (CC BY) license (https://creativecommons.org/licenses/by/4.0/).
Share and Cite
Cho, C.-H.; Kim, J.; Eom, K. The Clinical Application of Dynamic Contrast-Enhanced MRI in Canine Masses of Mesenchymal and Epithelial Origin: A Preliminary Case Series. Vet. Sci. 2024, 11, 539. https://doi.org/10.3390/vetsci11110539
Cho C-H, Kim J, Eom K. The Clinical Application of Dynamic Contrast-Enhanced MRI in Canine Masses of Mesenchymal and Epithelial Origin: A Preliminary Case Series. Veterinary Sciences. 2024; 11(11):539. https://doi.org/10.3390/vetsci11110539
Chicago/Turabian StyleCho, Chang-Hyeon, Jaehwan Kim, and Kidong Eom. 2024. "The Clinical Application of Dynamic Contrast-Enhanced MRI in Canine Masses of Mesenchymal and Epithelial Origin: A Preliminary Case Series" Veterinary Sciences 11, no. 11: 539. https://doi.org/10.3390/vetsci11110539
APA StyleCho, C.-H., Kim, J., & Eom, K. (2024). The Clinical Application of Dynamic Contrast-Enhanced MRI in Canine Masses of Mesenchymal and Epithelial Origin: A Preliminary Case Series. Veterinary Sciences, 11(11), 539. https://doi.org/10.3390/vetsci11110539