Metabolic Markers Associated with Progression of Type 2 Diabetes Induced by High-Fat Diet and Single Low Dose Streptozotocin in Rats
Abstract
Simple Summary
Abstract
1. Introduction
2. Materials and Methods
2.1. Animals
2.2. Diets
2.3. Diabetes Induction
2.4. Dynamics of Sampling
- Insulin—by Rat Insulin ELISA Kit (Cat No: RTFI00920, AssayGenie, Dublin, Ireland);
- Blood glucose—by enzymatic colorimetric test for glucose method without deproteinisation (Human GmbH, Wiesbaden, Germany);
- Total cholesterol (TC), triglycerides (TG), LDL, HDL—biochemical analyzer IDEXX Vet Test, USA;
- VLDL—level was calculated from Friedewald’s formula: VLDL = TG/5 [38];
- Uric acid—biochemical analyzer IDEXX Vet Test, USA;
- Advanced oxidation protein products (AOPP)—spectrophotometric method [39].
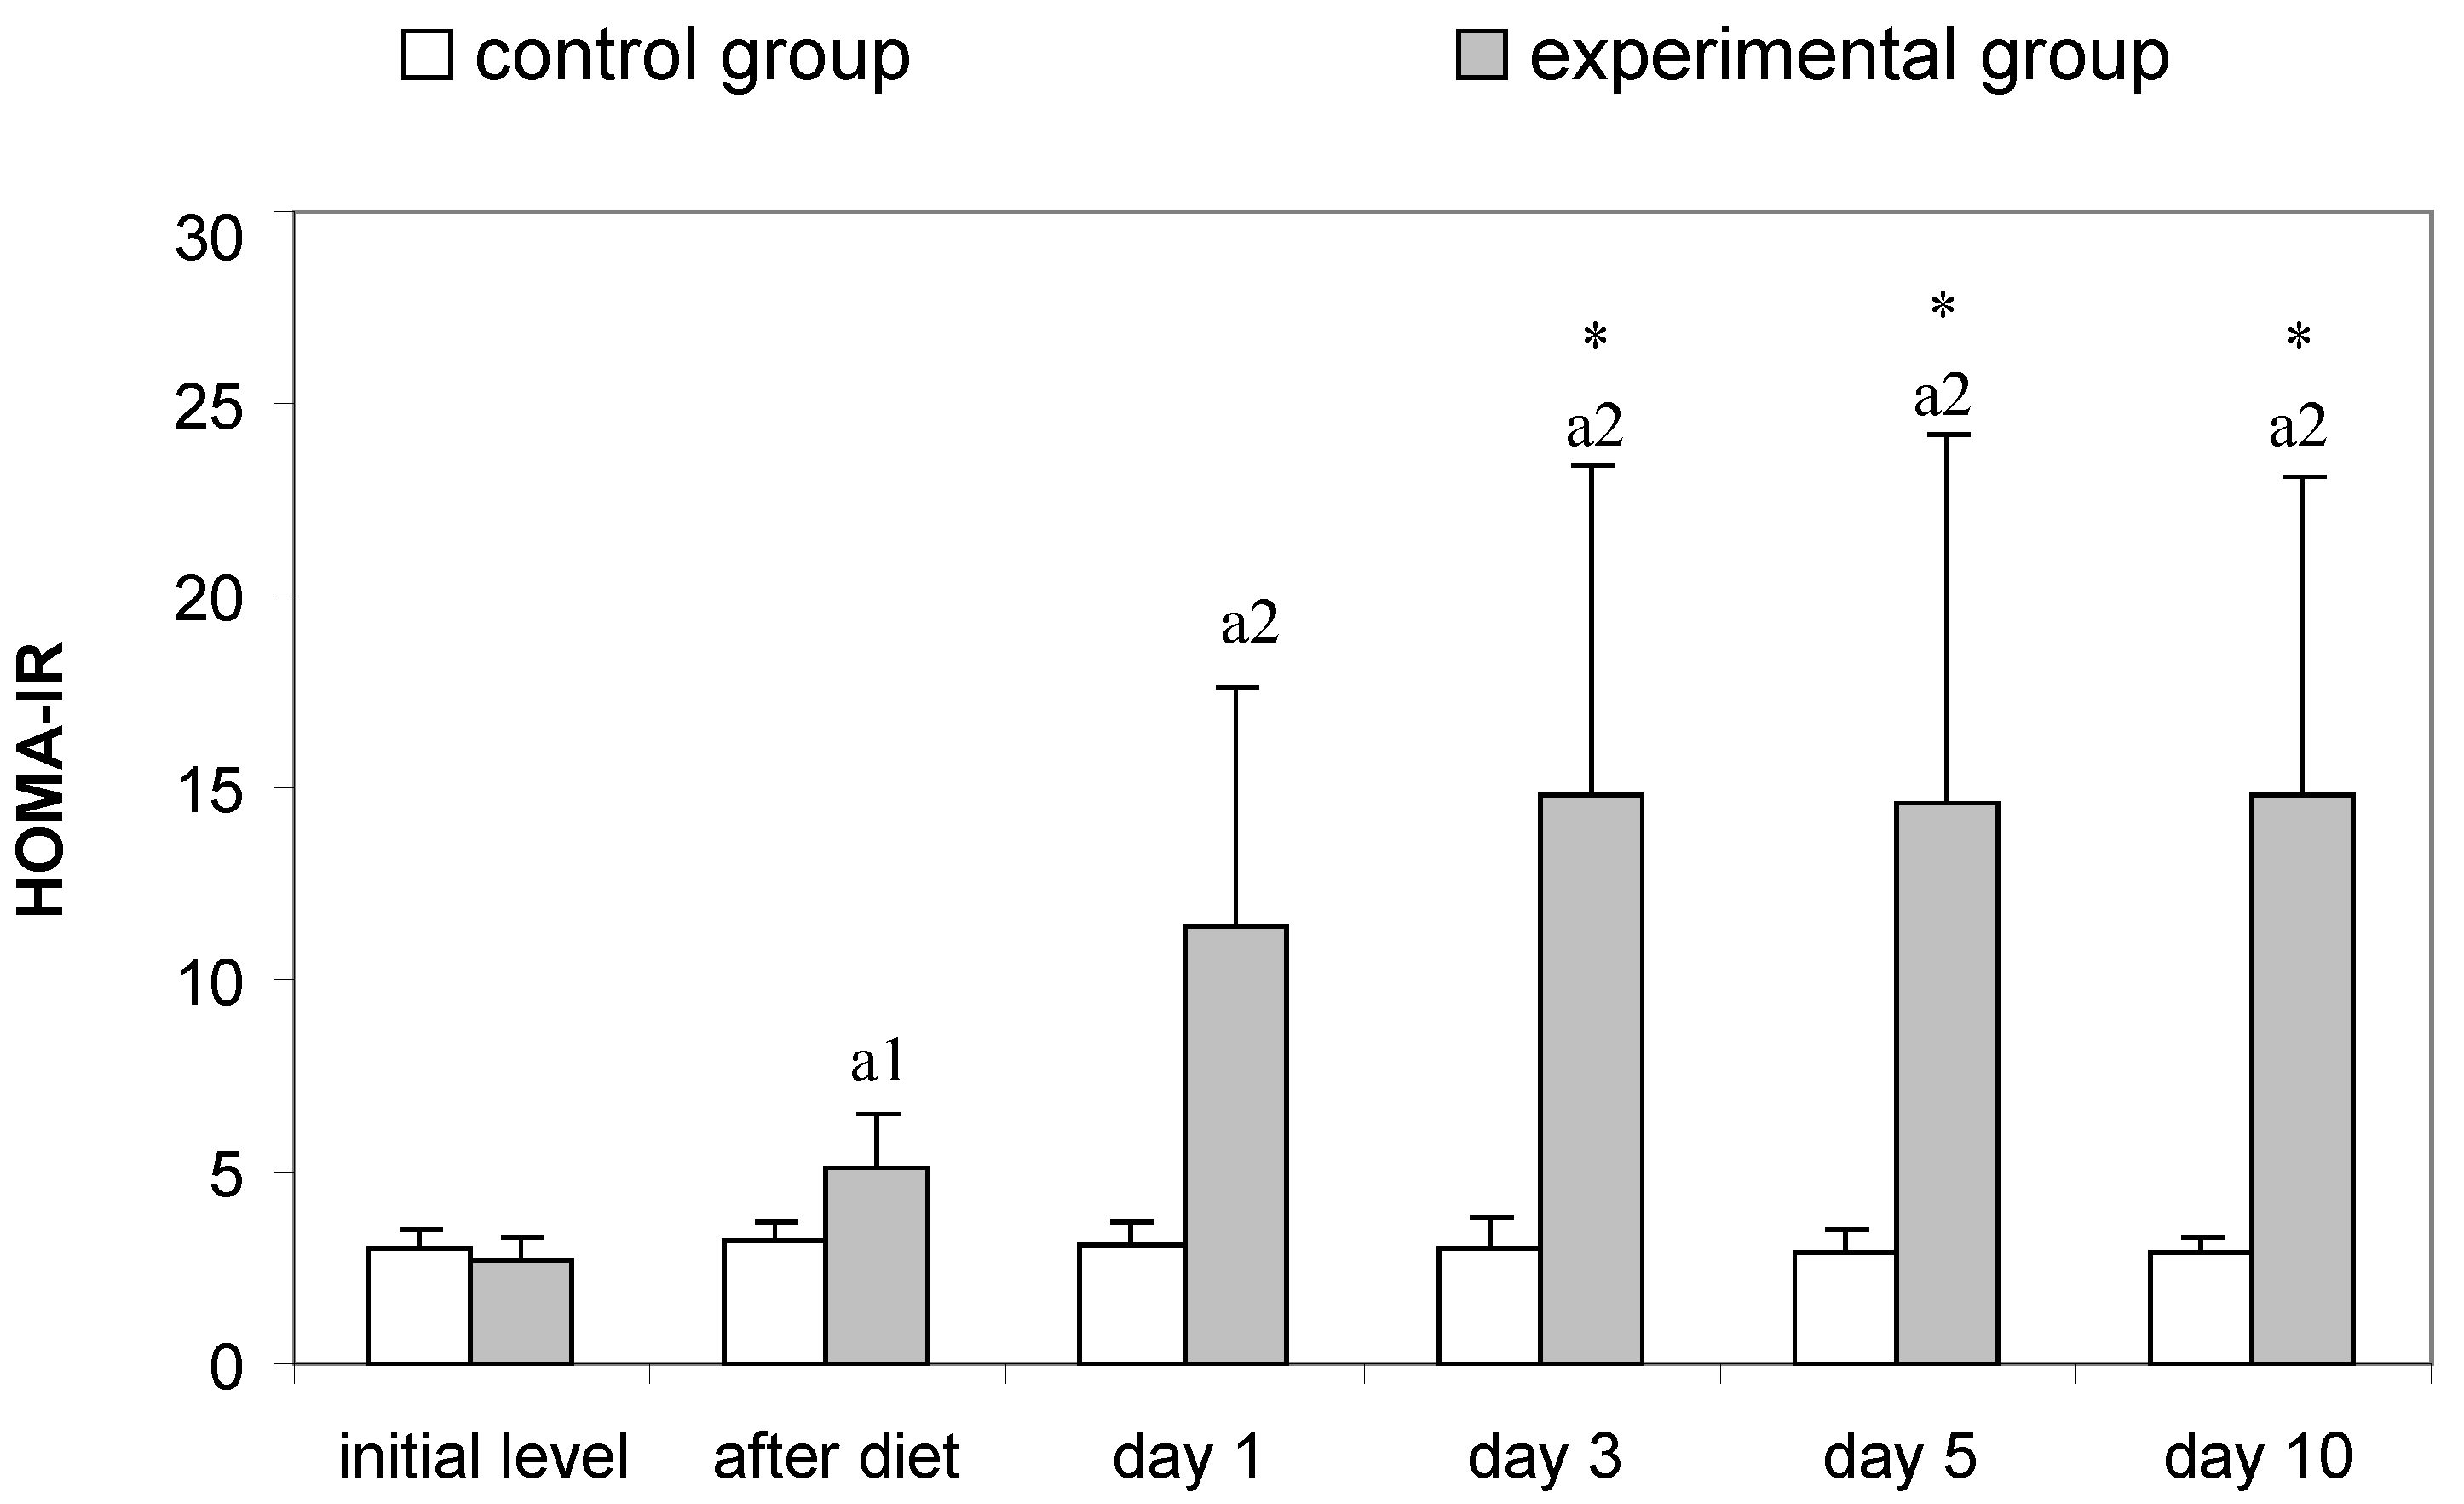
- HOMA-IR was determined on the basis of the obtained results from the measurement of insulin and fasting blood sugar using the formula HOMA-IR = glucose × insulin/22.5 [40];
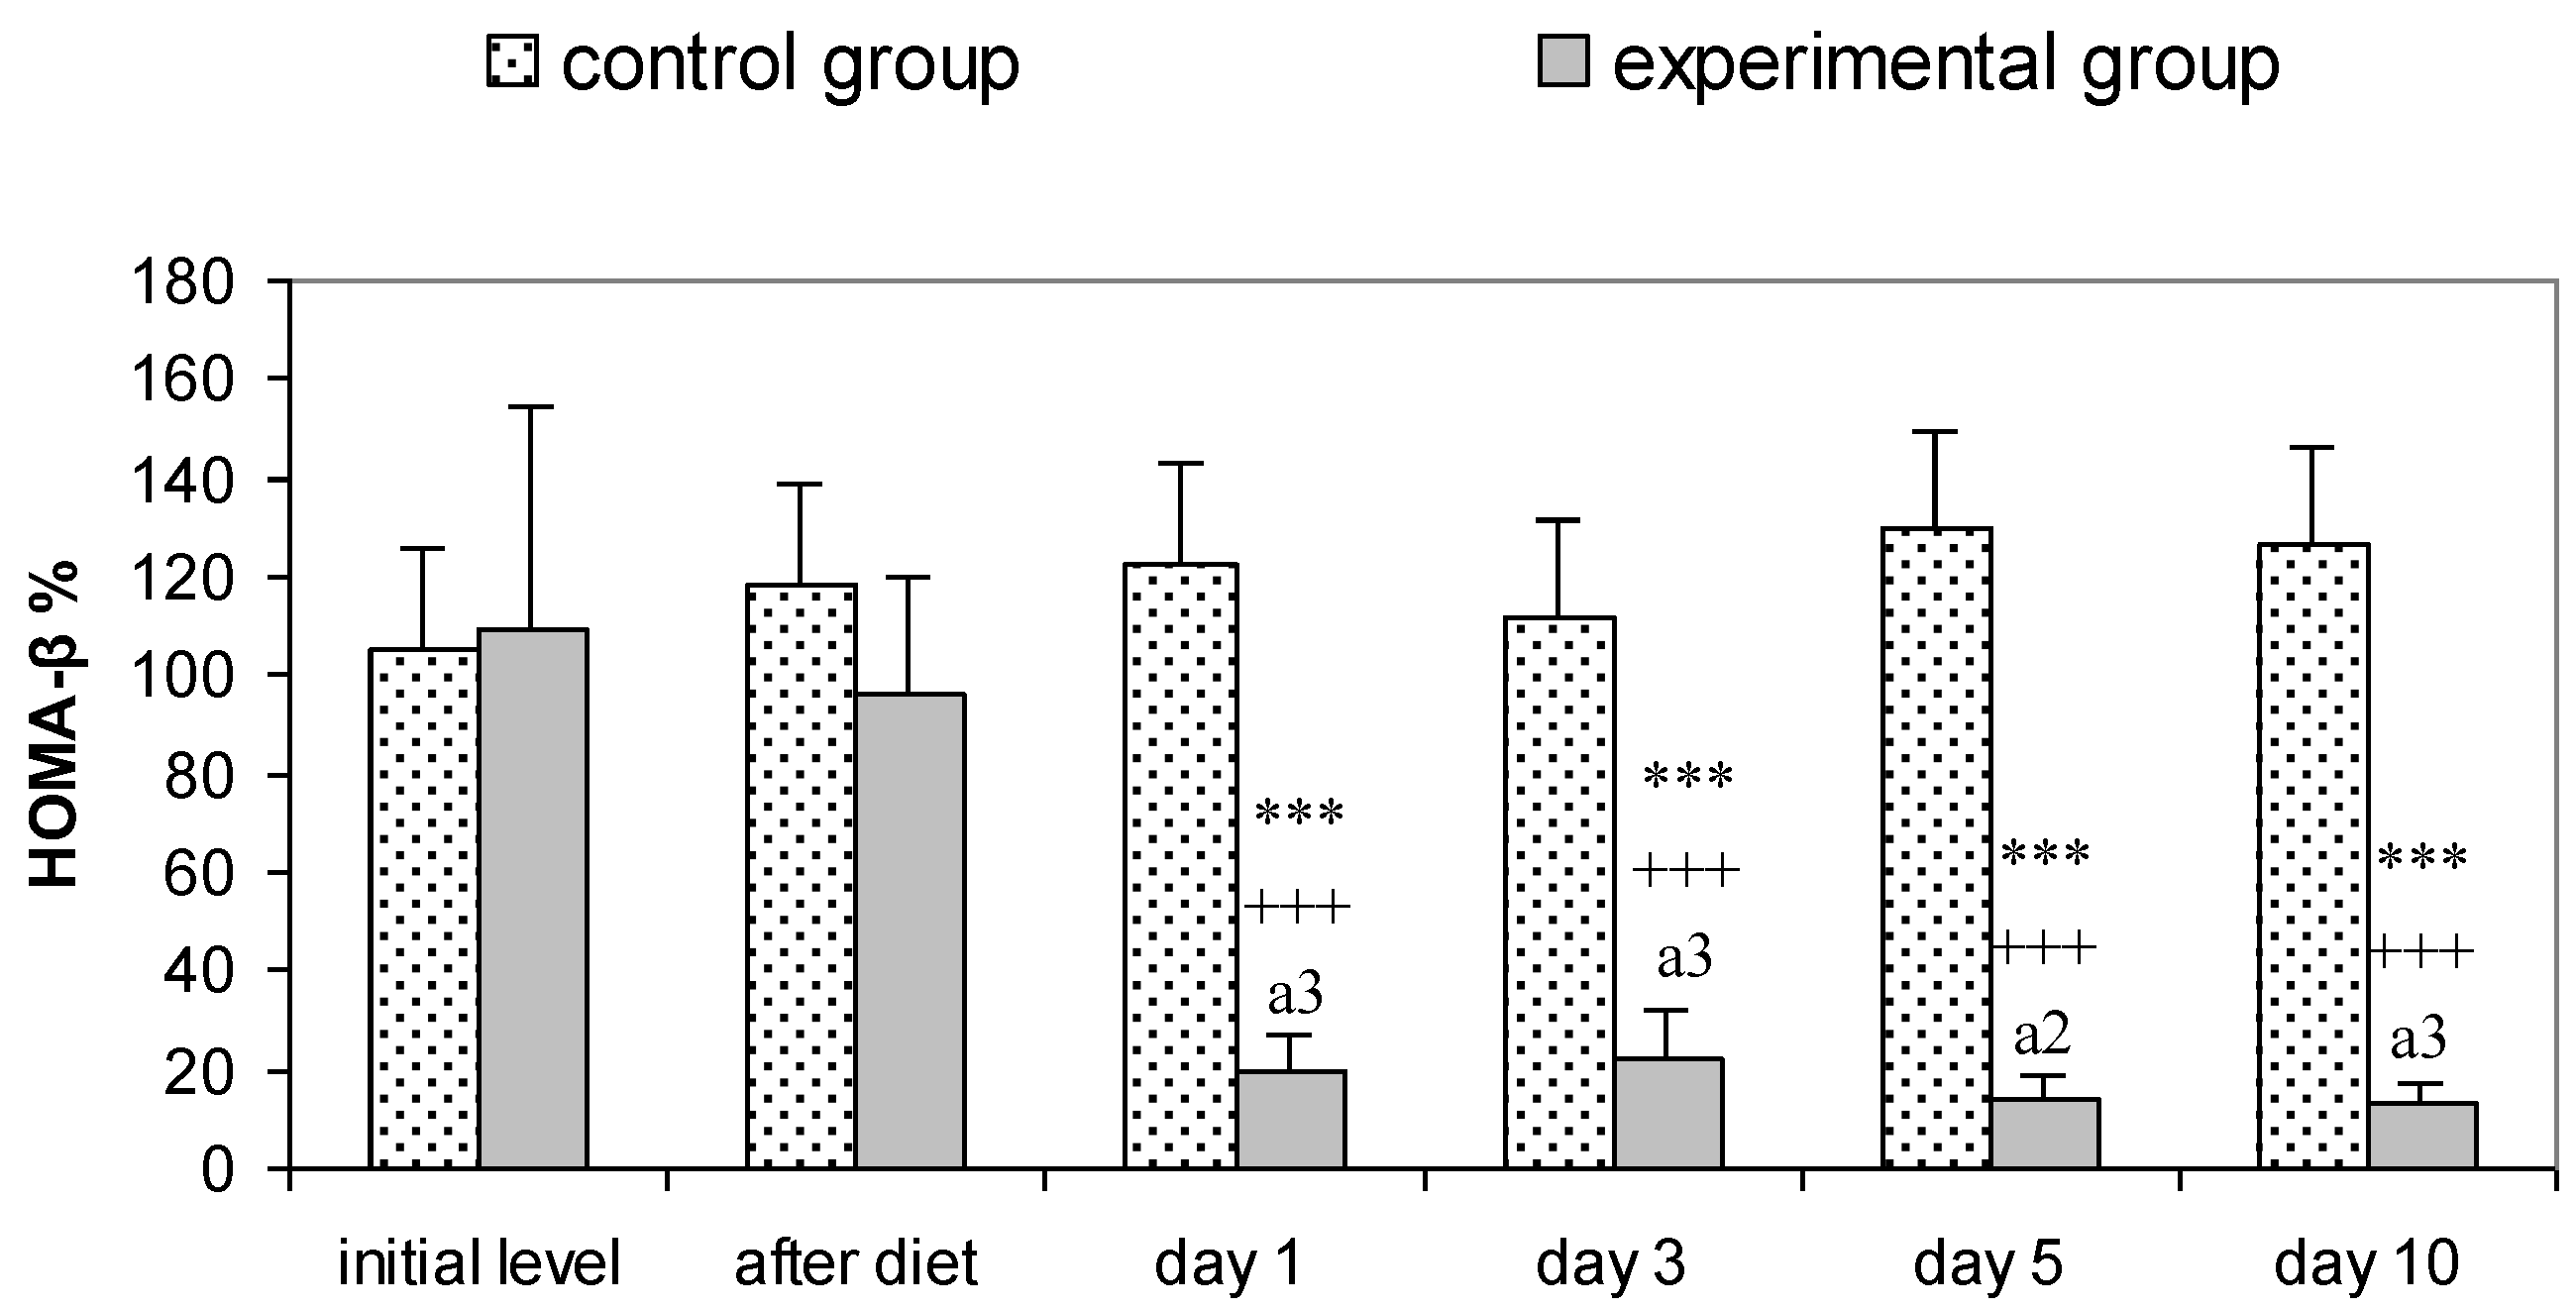
- HOMA-β was determined by the formula 20 × insulin/glucose − 3.5.
- Body weight (BW)—the body weight of each animal was measured using an electronic scale (OHAUS™ Scout™ STX, Ohaus Corporation, Northglenn, CO, USA);
- Body length—the length of the animals was determined by measuring the distance from the nose to the anus;
- Body mass index (BMI)—was determined using the formula body weight (g)/body length (cm)2 [41];
- Abdominal circumference—the circumference of the abdomen at its widest part was measured using a measuring tape;
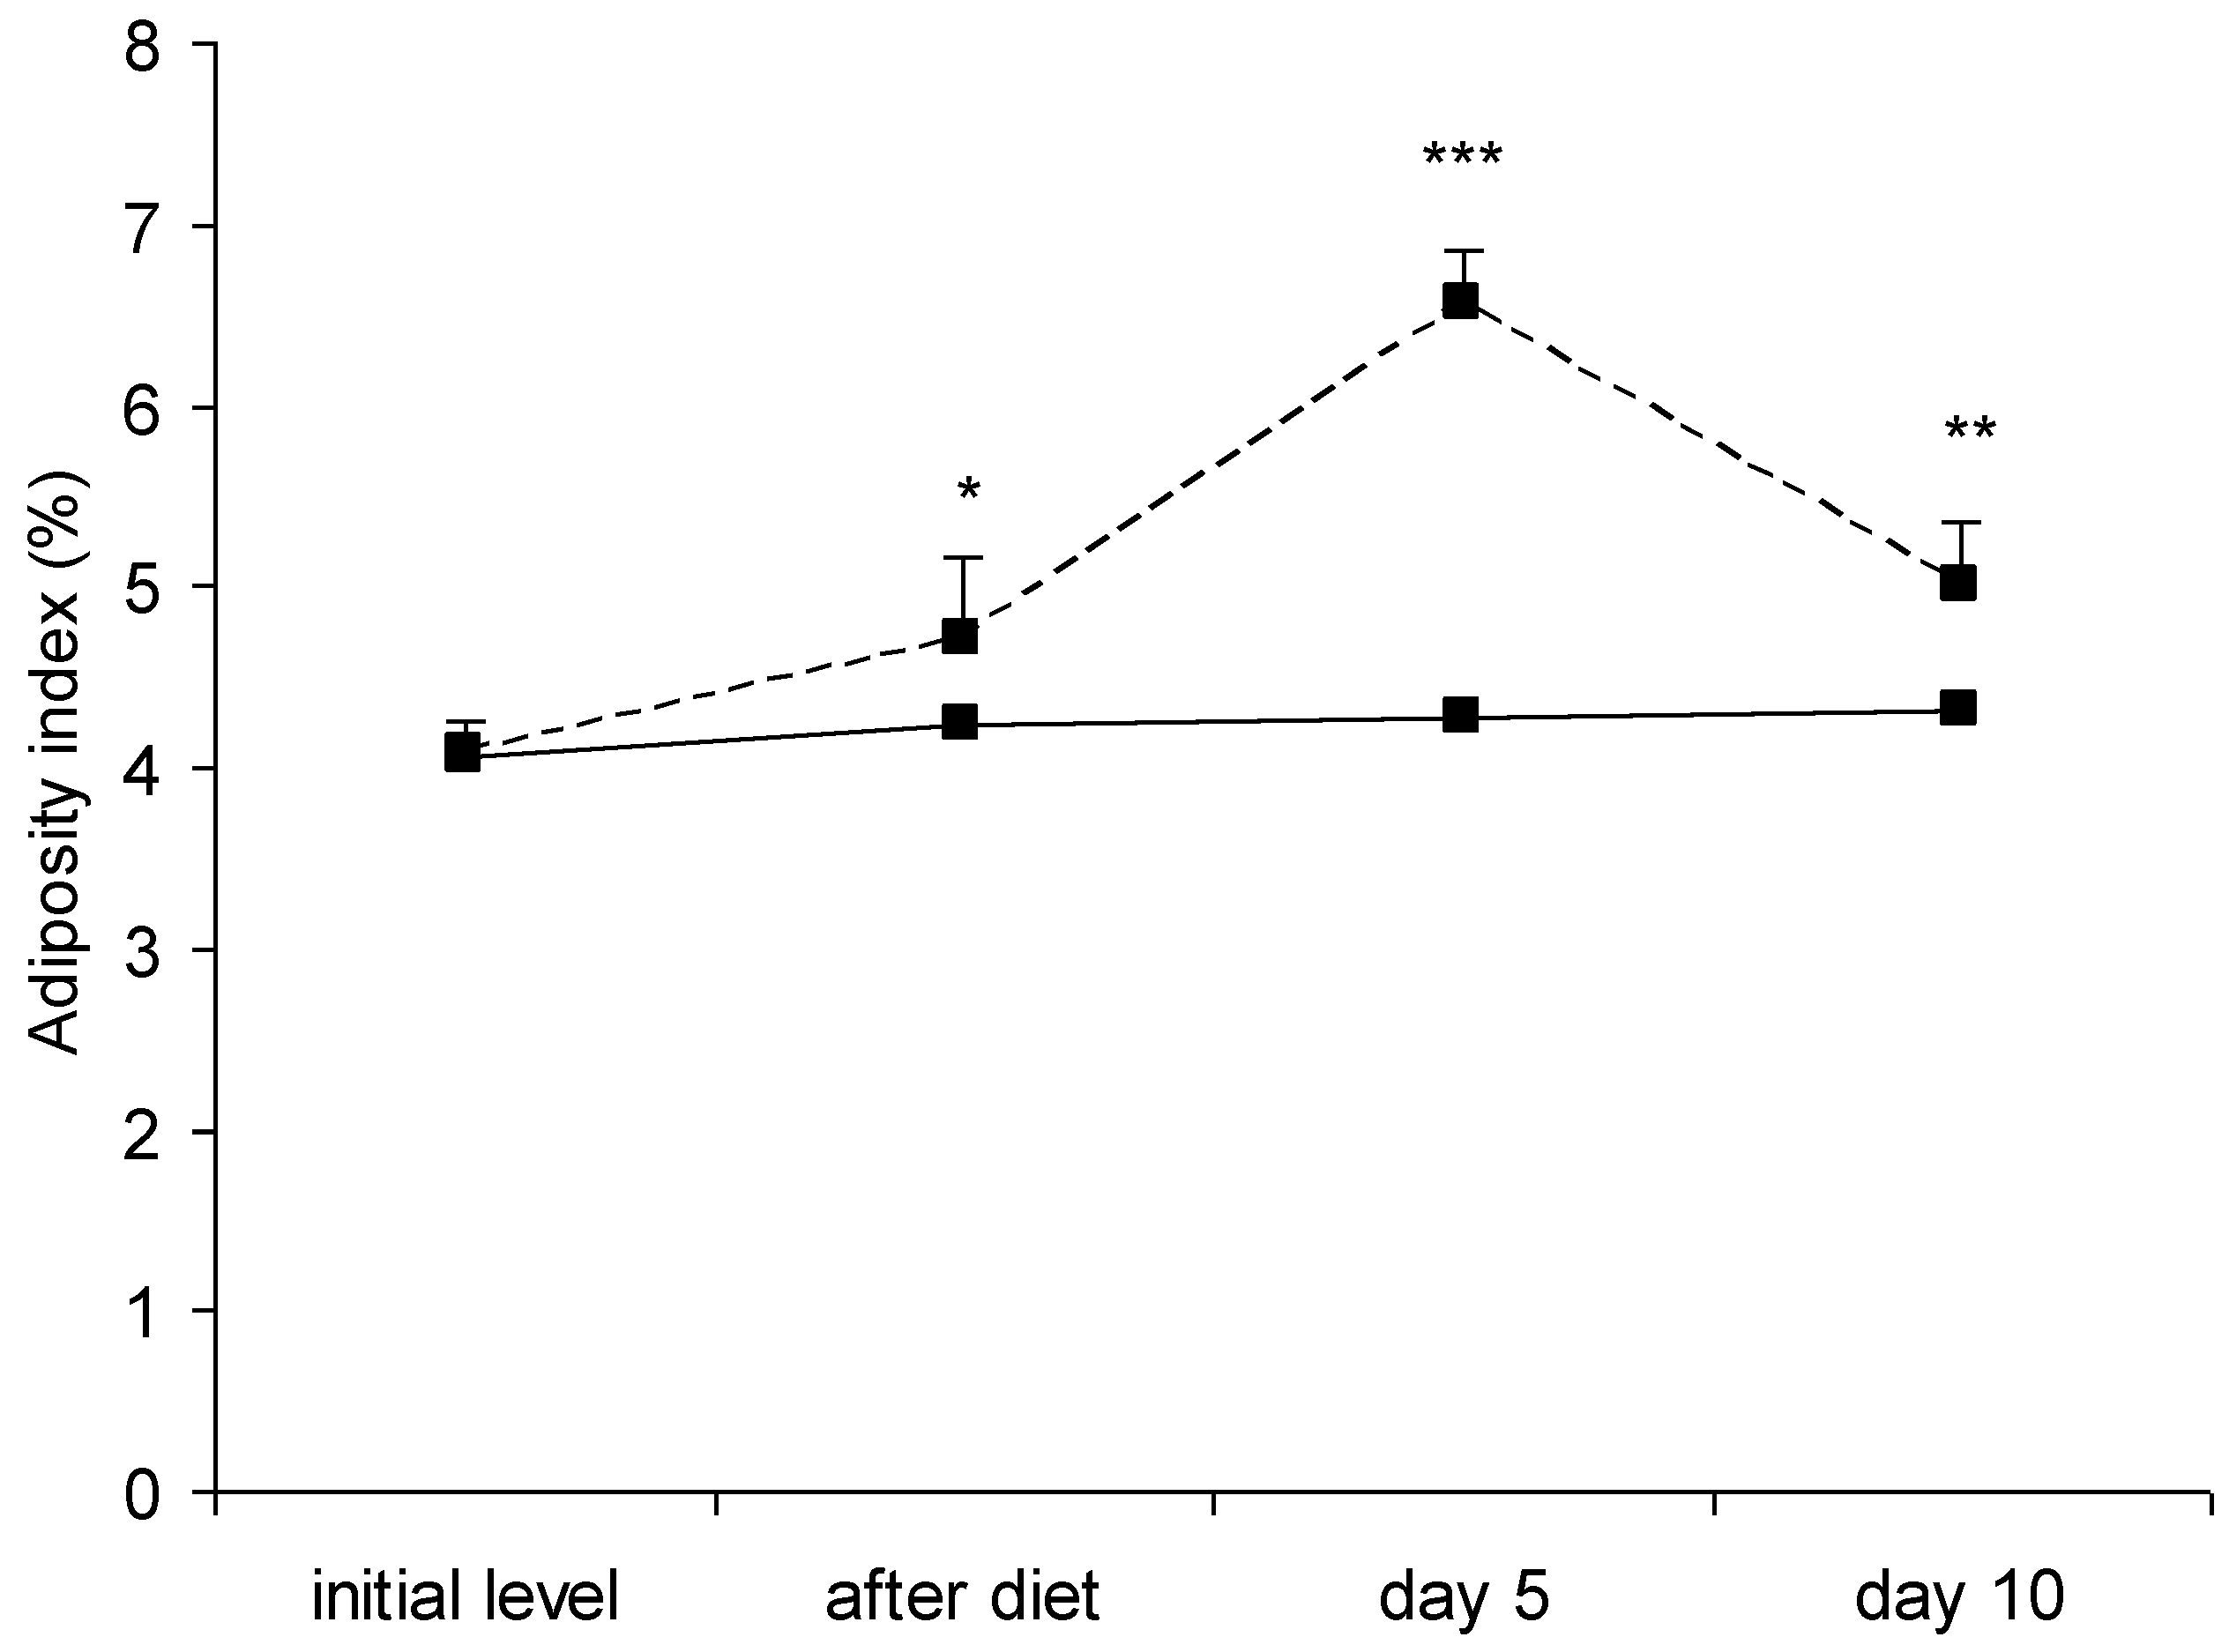
- Adiposity index—at each stage of the study, 5 animals from each group were anesthetized with sodium pentobarbital (50 mg/kg BW, i. p.) and decapitated. Inguinal, epididymal and perirenal fat depots were precisely dissected and their absolute mass (in grams) was determined using an electronic scale (OHAUS™ Scout™ STX, Ohaus Corporation, Northglenn, CO, USA). The adiposity index was calculated as total body fat/BW × 100 [42].
2.5. Statistical Analysis
3. Results
3.1. Anthropometric Parameters
3.2. Parameters for Determination of Insulin Resistance in Rats
3.3. Serum Lipid Profile
3.4. Blood Protein and Purine Markers
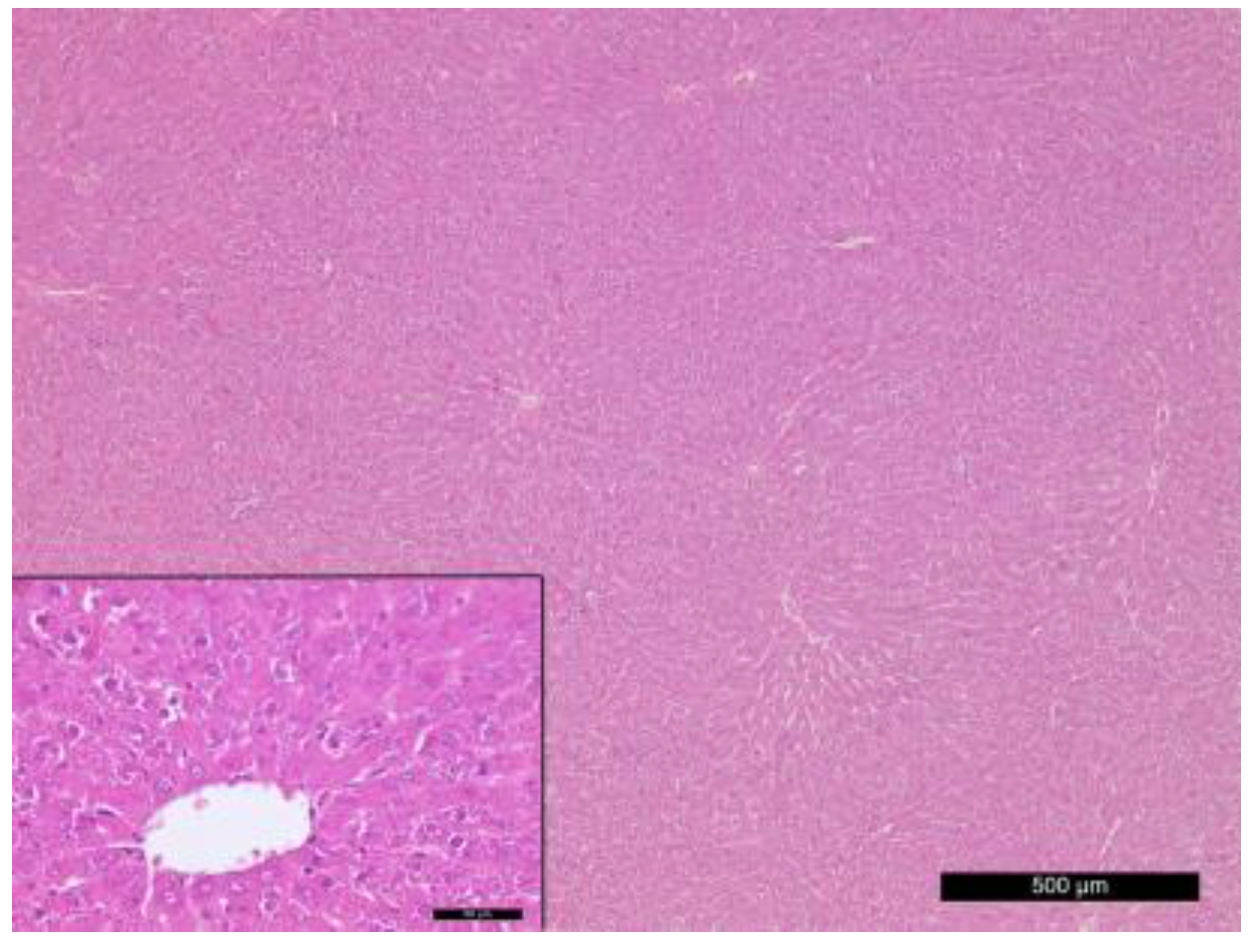
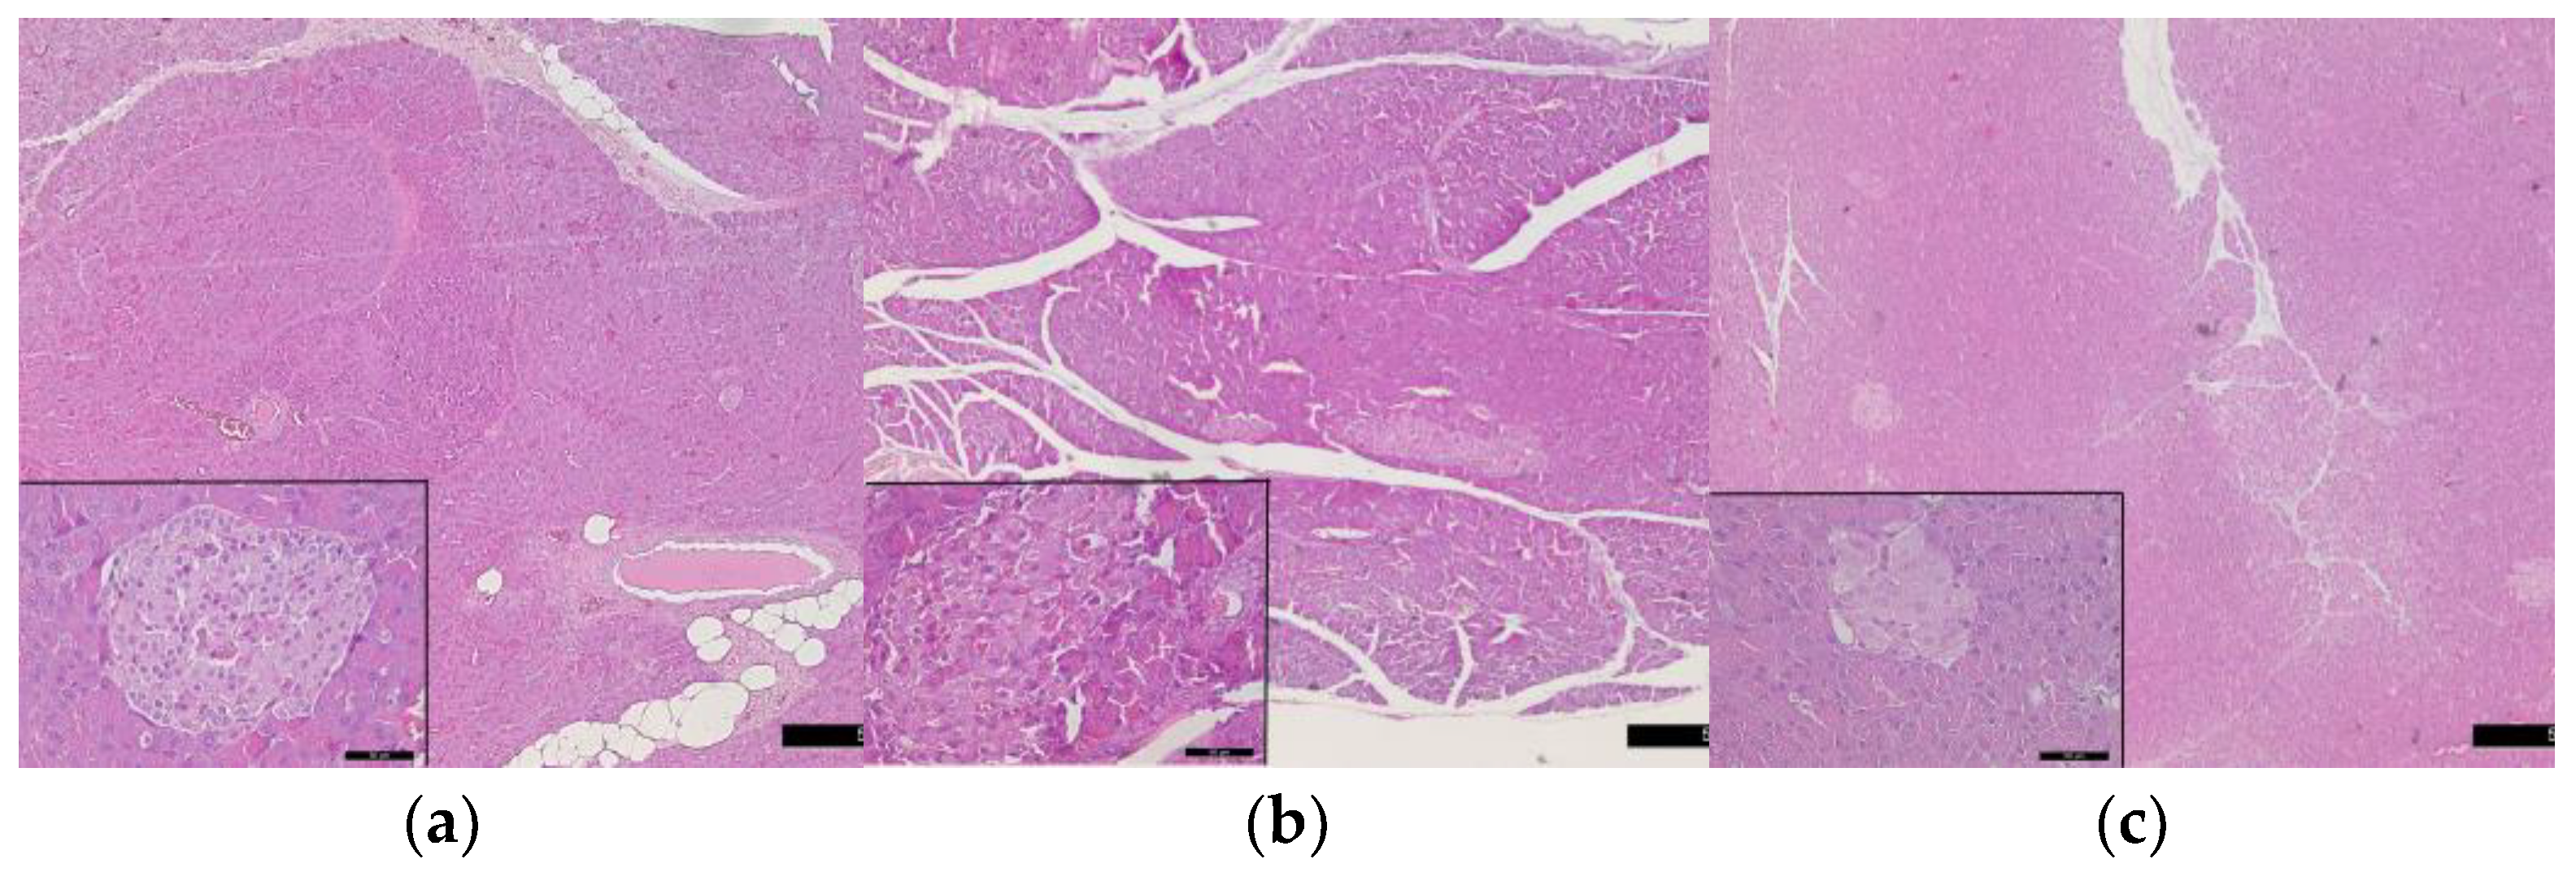
3.5. Histological Changes
4. Discussion
5. Conclusions
Author Contributions
Funding
Institutional Review Board Statement
Informed Consent Statement
Data Availability Statement
Acknowledgments
Conflicts of Interest
References
- Chatterjee, S.; Khunti, K.; Davies, M.J. Type 2 diabetes. Lancet 2017, 389, 2239–2251. [Google Scholar] [CrossRef] [PubMed]
- Zheng, Y.; Ley, S.H.; Hu, F.B. Global aetiology and epidemiology of type 2 diabetes mellitus and its complications. Nat. Rev. Endocrinol. 2018, 14, 88–98. [Google Scholar] [CrossRef] [PubMed]
- Niaz, K.; Maqbool, F.; Khan, F.; Hassan, F.I.; Momtaz, S.; Abdollahi, M. Comparative occurrence of diabetes in canine, feline, and few wild animals and their association with pancreatic diseases and ketoacidosis with therapeutic approach. Vet. World 2018, 11, 410–422. [Google Scholar] [CrossRef] [PubMed]
- Goyal, R.; Jialal, I. Diabetes Mellitus, Type 2. StatPearls Publishing. 2018. Available online: www.ncbi.nlm.nih.gov/books/NBK513253/ (accessed on 8 May 2023).
- Lee, S.H.; Park, S.Y.; Choi, C.S. Insulin resistance: From mechanisms to therapeutic strategies. Diabetes Metab. J. 2022, 46, 15–37. [Google Scholar] [CrossRef]
- Huxley, R.; Mendis, S.; Zheleznyakov, E.; Reddy, S.; Chan, J. Body mass index, waist circumference and waist:hip ratio as predictors of cardiovascular risk—A review of the literature. Eur. J. Clin. Nutr. 2010, 64, 16–22. [Google Scholar] [CrossRef]
- Woolcott, O.O.; Bergman, R.N. Relative Fat Mass (RFM) as a new estimator of whole-body fat percentage–A cross-sectional study in American adult individuals. Sci. Rep. 2018, 8, 10980. [Google Scholar] [CrossRef]
- Chon, S.; Lee, Y.; Fraterrigo, G.; Pozzilli, P.; Choi, M.C.; Kwon, M.K.; Chin, S.O.; Rhee, S.Y.; Oh, S.; Kim, Y.S.; et al. Evaluation of glycemic variability in well-controlled type 2 diabetes mellitus. Diabetes Technol. Ther. 2013, 15, 455–460. [Google Scholar] [CrossRef]
- Gomez-Perez, F.J. Glycated Hemoglobin, fasting, two-hour postchallenge and postprandial glycemia in the diagnosis and treatment of diabetes mellitus: Are we giving them the right interpretation and use? Rev. Investig. Clin. 2015, 67, 76–79. Available online: http://www.ncbi.nlm.nih.gov/pubmed/25938839 (accessed on 28 June 2023).
- Gu, X.; Al Dubayee, M.; Alshahrani, A.; Masood, A.; Benabdelkamel, H.; Zahra, M.; Li, L.; Abdel Rahman, A.M.; Aljada, A. Distinctive Metabolomics Patterns Associated with Insulin Resistance and Type 2 Diabetes Mellitus. Front. Mol. Biosci. 2020, 7, 609806. [Google Scholar] [CrossRef]
- Suneja, S.; Gangopadhyay, S.; Saini, V.; Dawar, R.; Kaur, C. Emerging Diabetic Novel Biomarkers of the 21st Century. Ann. Natl. Acad. Med. Sci. 2021, 57, 69–81. [Google Scholar] [CrossRef]
- Sacks, D.B.; Arnold, M.; Bakris, G.L.; Bruns, D.E.; Horvath, A.R.; Kirkman, M.S.; Lernmark, A.; Metzger, B.E.; Nathan, D.M. Guidelines and recommendations for laboratory analysis in the diagnosis and management of diabetes mellitus. Diabetes Care 2011, 34, e61–e99. [Google Scholar] [CrossRef] [PubMed]
- Ortiz-Martínez, M.; González-González, M.; Martagón, A.J.; Hlavinka, V.; Willson, R.C.; Rito-Palomares, M. Recent Developments in Biomarkers for Diagnosis and Screening of Type 2 Diabetes Mellitus. Curr. Diab. Rep. 2022, 22, 95–115. [Google Scholar] [CrossRef] [PubMed]
- Huang, X.; Liu, G.; Guo, J.; Su, Z. The PI3K/AKT pathway in obesity and type 2 diabetes. Int. J. Biol. Sci. 2018, 14, 1483–1496. [Google Scholar] [CrossRef] [PubMed]
- Leopoldo, A.S.; Lima-Leopoldo, A.P.; Nascimento, A.F.; Luvizotto, R.A.; Sugizaki, M.M.; Campos, D.H.; da Silva, D.C.; Padovani, C.R.; Cicogna, A.C. Classification of different degrees of adiposity in sedentary rats. Braz. J. Med. Biol. Res. 2016, 49, e5028. [Google Scholar] [CrossRef] [PubMed]
- Ghasemi, A.; Jeddi, S.; Kashfi, K. The laboratory rat: Age and body weight matter. EXCLI J. 2021, 20, 1431–1445. [Google Scholar] [CrossRef]
- Søfteland, E.; Poulsen, J.L.; Starup-Linde, J.; Christensen, T.T.; Olesen, S.S.; Singh, S.; Vestergaard, P.; Drewes, A.M.; Dimcevski, G. Pancreatic exocrine insufficiency in diabetes mellitus-prevalence and characteristics. Eur. J. Intern. Med. 2019, 68, 18–22. [Google Scholar] [CrossRef] [PubMed]
- Izzo, A.; Massimino, E.; Riccardi, G.; Della Pepa, G. A Narrative Review on Sarcopenia in Type 2 Diabetes Mellitus: Prevalence and Associated Factors. Nutrients 2021, 13, 183. [Google Scholar] [CrossRef]
- Bandaru, P.; Shankar, A. Association between serum uric acid levels and diabetes mellitus. Int. J. Endocrinol. 2011, 2011, 604715. [Google Scholar] [CrossRef]
- Conti, G.; Caccamo, D.; Siligato, R.; Gembillo, G.; Satta, E.; Pazzano, D.; Carucci, N.; Carella, A.; Campo, G.D.; Salvo, A.; et al. Association of Higher Advanced Oxidation Protein Products (AOPPs) Levels in Patients with Diabetic and Hypertensive Nephropathy. Medicina 2019, 55, 675. [Google Scholar] [CrossRef]
- Zhao, Y.; Zhang, L.; Ouyang, X.; Jiang, Z.; Xie, Z.; Fan, L.; Zhu, D.; Li, L. Advanced oxidation protein products play critical roles in liver diseases. Eur. J. Clin. Investig. 2019, 5, e13098. [Google Scholar] [CrossRef]
- Kottaisamy, C.P.D.; Raj, D.S.; Prasanth Kumar, V. Experimental animal models for diabetes and its related complications—A review. Lab. Anim. Res. 2021, 37, 23. [Google Scholar] [CrossRef] [PubMed]
- Ghasemi, A.; Jeddi, S. Streptozotocin as a tool for induction of rat models of diabetes: A practical guide. EXCLI J. 2023, 22, 274–294. [Google Scholar] [CrossRef] [PubMed]
- Lutz, T.A. Mammalian models of diabetes mellitus, with a focus on type 2 diabetes mellitus. Nat. Rev. Endocrinol. 2023, 19, 350–360. [Google Scholar] [CrossRef]
- Pasquali, P. The importance of animal models in research. Res. Vet. Sci. 2018, 118, 144–145. [Google Scholar] [CrossRef] [PubMed]
- Kleinert, M.; Clemmensen, C.; Hofmann, S. Animal models of obesity and diabetes mellitus. Nat. Rev. Endocrinol. 2018, 14, 140–162. [Google Scholar] [CrossRef]
- Omolaoye, T.S.; Skosana, B.T.; du Plessis, S.S. Diabetes mellitus-induction: Effect of different streptozotocin doses on male reproductive parameters. Acta Histochem. 2018, 120, 103–109. [Google Scholar] [CrossRef]
- Furman, B.L. Streptozotocin-induced diabetic models in mice and rats. Curr. Protoc. 2021, 1, e78. [Google Scholar] [CrossRef]
- Skovsø, S. Modeling type 2 diabetes in rats using high fat diet and streptozotocin. J. Diabetes Investig. 2014, 5, 349–358. [Google Scholar] [CrossRef]
- Holt, R. Pathogenesis of diabetes. In Textbook of Diabetes, 4th ed.; Holt, R., Cockram, C., Flyvbjerg, A., Goldstein, B., Eds.; Wiley-Blackwell: Oxford, UK, 2010; Part 3; pp. 141–227. [Google Scholar]
- Petersen, M.C.; Shulman, G.I. Mechanisms of insulin action and insulin resistance. Physiol. Res. 2018, 98, 2133–2223. [Google Scholar] [CrossRef]
- Perlman, R.L. Mouse models of human disease. An evolutionary perspective. Evol. Med. Public Health 2016, 2016, 170–176. [Google Scholar] [CrossRef]
- Bahadoran, Z.; Mirmiran, P.; Kashfi, K.; Ghasemi, A. Importance of systematic reviews and meta-analyses of animal studies: Challenges for animal-to-human translation. J. Am. Assoc. Lab. Anim. Sci. 2020, 59, 469–477. [Google Scholar] [CrossRef] [PubMed]
- Wen, Y.; Liu, Y.; Huang, Q.; Farag, M.A.; Li, X.; Wan, X.; Zhao, C. Nutritional assessment models for diabetes and aging. Food Front. 2022, 3, 689–705. [Google Scholar] [CrossRef]
- Rodríguez-Correa, E.; González-Pérez, I.; Clavel-Pérez, P.I.; Contreras-Vargas, Y.; Carvajal, K. Biochemical and nutritional overview of diet-induced metabolic syndrome models in rats: What is the best choice? Nutr. Diabetes 2020, 10, 24. [Google Scholar] [CrossRef] [PubMed]
- Reed, M.J.; Meszaros, K.; Entes, L.J.; Claypool, M.D.; Pinkett, J.G.; Gadbois, T.M.; Reaven, G.M. A new rat model of type 2 diabetes: The fat-fed, streptozotocin-treated rat. Metabolism 2000, 49, 1390–1394. [Google Scholar] [CrossRef] [PubMed]
- Qinna, N.A.; Baadwan, A.A. Impact of streptozotocin on altering normal glucose homeostasis during insulin testing in diabetic rats compared to normoglycemic rats. Drug. Des. Devel. Ther. 2015, 9, 2515–2525. [Google Scholar] [CrossRef] [PubMed]
- Ismaiil, L.A.; Joumaa, W.H.; Moustafa, M.E. Selenium decreases triglycerides and VLDL-c in diabetic rats exposed to electromagnetic radiation from mobile phone base stations. J. Taibah Univ. Sci. 2019, 13, 844–849. [Google Scholar] [CrossRef]
- Hanasand, M.; Omdal, R.; Norheim, K.; Goransson, L.; Brede, C.; Jonsson, G. Improved detection of advanced oxidation protein products in plasma. Clin. Chim. Acta 2012, 413, 901–906. [Google Scholar] [CrossRef]
- Matthews, D.R.; Hosker, J.P.; Rudenski, A.S.; Naylor, B.A.; Treacher, D.F.; Turner, R.C. Homeostasis model assessment: Insulin resistance and beta-cell function from fasting plasma glucose and insulin concentrations in man. Diabetologia 1985, 28, 412–419. [Google Scholar] [CrossRef] [PubMed]
- Novelli, E.L.; Diniz, Y.S.; Galhardi, C.M.; Ebaid, G.M.; Rodrigues, H.G.; Mani, F.; Fernandes, A.A.; Cicogna, A.C.; Novelli Filho, J.L. Anthropometrical parameters and markers of obesity in rats. Lab. Anim. 2007, 41, 111–119. [Google Scholar] [CrossRef] [PubMed]
- Li, H.; Matheny, M.; Nicolson, M.; Tumer, N.; Scarpace, P.J. Leptin gene expression increases with age independent of increasing adiposity in rats. Diabetes 1997, 46, 2035–2039. [Google Scholar] [CrossRef] [PubMed]
- Sharma, N.; Okere, I.C.; Duda, M.K.; Johnson, J.; Yuan, C.L.; Chandler, M.P.; Ernsberger, P.; Hoit, B.D.; Stanley, W.C. High fructose diet increases mortality in hypertensive rats compared to a complex carbohydrate or high fat diet. Am. J. Hypertens 2007, 20, 403–409. [Google Scholar] [CrossRef] [PubMed]
- Buettner, R.; Parhofer, K.G.; Woenckhaus, M.; Wrede, C.E.; Kunz-Schughart, L.A.; Schölmerich, J.; Bollheimer, L.C. Defining high-fat-diet rat models: Metabolic and molecular effects of different fat types. J. Mol. Endocrinol. 2006, 36, 485–501. [Google Scholar] [CrossRef] [PubMed]
- Ciapaite, J.; van den Broek, N.M.; Te Brinke, H.; Nicolay, K.; Jeneson, J.A.; Houten, S.M.; Prompers, J.J. Differential effects of short-and long-term high-fat diet feeding on hepatic fatty acid metabolism in rats. Biochim. Biophys. Acta Mol. Cell Biol. Lipids 2011, 1811, 441–451. [Google Scholar] [CrossRef] [PubMed]
- Hoffman, W.P.; Ness, D.K.; van Lier, R.B. Analysis of rodent growth data in toxicology studies. Toxicol. Sci. 2022, 66, 313–319. [Google Scholar] [CrossRef] [PubMed]
- Hattis, D.; Goble, R.; Chu, M. Age-related differences in susceptibility to carcinogenesis. II. Approaches for application and uncertainty analyses for individual genetically acting carcinogens. Environ. Health Perspect. 2005, 113, 509–516. [Google Scholar] [CrossRef] [PubMed]
- Kanasaki, K.; Koya, D. Biology of obesity: Lessons from animal models of obesity. J. Biomed. Biotechnol. 2011, 2011, 197636. [Google Scholar] [CrossRef]
- Cole, C.L.; Beck, C.A.; Robinson, D.; Ye, J.; Mills, B.; Gerber, S.A.; Schwarz, E.M.; Linehan, D. Dual Energy X-ray Absorptiometry (DEXA) as a longitudinal outcome measure of cancer-related muscle wasting in mice. PLoS ONE 2020, 15, e0230695. [Google Scholar] [CrossRef]
- Wondmkun, Y.T. Obesity, Insulin Resistance, and Type 2 Diabetes: Associations and Therapeutic Implications. Diabetes Meta. Syndr. Obes. 2020, 9, 3611–3616. [Google Scholar] [CrossRef] [PubMed]
- Antunes, L.C.; Elkfury, J.L.; Jornada, M.N.; Foletto, K.C.; Bertoluci, M.C. Validation of HOMA-IR in a model of insulin-resistance induced by high-fat diet in Wistar. Arch. Endocrinol. Metab. 2016, 60, 138–142. [Google Scholar] [CrossRef] [PubMed]
- Chao, P.C.; Li, Y.; Chang, C.H.; Shieh, J.P.; Cheng, J.T.; Cheng, K.C. Investigation of insulin resistance in the popularly used four rat models of type-2 diabetes. Biomed. Pharmacother. 2018, 101, 155–161. [Google Scholar] [CrossRef] [PubMed]
- Eleazu, C.O.; Eleazu, K.C.; Chukwuma, S.; Essien, U.N. Review of the mechanism of cell death resulting from streptozotocin challenge in experimental animals, its practical use and potential risk to humans. J. Diabetes Metab. Disord. 2013, 12, 60. [Google Scholar] [CrossRef] [PubMed]
- Lewis, G.F.; Carpentier, A.C.; Pereira, S.; Hahn, M.; Giacca, A. Direct and indirect control of hepatic glucose production by insulin. Cell Metab. 2021, 33, 709–720. [Google Scholar] [CrossRef] [PubMed]
- Schenk, S.; Saberi, M.; Olefsky, J.M. Insulin sensitivity: Modulation by nutrients and inflammation. J. Clin Investig. 2008, 118, 2992–3002. [Google Scholar] [CrossRef] [PubMed]
- Yeasmin, N.; Akhter, Q.; Mahmuda, S.; Afroz, R.; Nahar, S.; Habib, T.; Abira, M.; Hossain, S.; Das, K. Serum Triglycerides and Total Cholesterol levels and its Relation with type 2 148 Diabetes mellitus. J. Dhaka Med. Coll. 2020, 27, 148–154. [Google Scholar] [CrossRef]
- Ottosson, F.; Smith, E.; Gallo, W.; Fernandez, C.; Melander, O. Purine metabolites and carnitine biosynthesis intermediates are biomarkers for incident Type 2 diabetes. J. Clin. Endocrinol. Metabol. 2019, 104, 4921–4930. [Google Scholar] [CrossRef]
- Concepcion, J.; Chen, K.; Saito, R.; Gangoiti, J.; Mendez, E.; Nikita, M.E.; Barshop, B.A.; Natarajan, L.; Sharma, K.; Kim, J.J. Identification of pathognomonic purine synthesis biomarkers by metabolomic profiling of adolescents with obesity and type 2 diabetes. PLoS ONE 2020, 15, e0234970. [Google Scholar] [CrossRef]
- Anothaisintawee, T.; Lertrattananon, D.; Thamakaison, S.; Reutrakul, S.; Ongphiphadhanakul, B.; Thakkinstian, A. Direct and indirect effects of serum uric acid on blood sugar levels in patients with prediabetes: A mediation analysis. J. Diabetes Res. 2017, 2017, 6830671. [Google Scholar] [CrossRef] [PubMed]


| Parameter | Group | Initial Level | After Diet | Day 5 | Day 10 |
|---|---|---|---|---|---|
| Body weight (g) | Control | 160.57 ± 18.96 | 271.43 ± 26.70 *** | 281.00 ± 23.45 *** | 299.57 ± 30.54 *** |
| Experimental | 175.14 ± 20.39 | 295.14 ± 31.02 *** | 287.86 ± 27.93 *** | 292.43 ± 29.47 *** | |
| Body length (cm) | Control | 19.00 ± 0.58 | 21.00 ± 0.82 *** | 21.71 ± 0.76 *** | 21.71 ± 0.95 *** |
| Experimental | 19.35 ± 0.60 | 21.86 ± 1.07 *** | 21.14 ± 1.68 ** | 22.71 ± 0.49 ***a1 | |
| BMI (g/cm2) | Control | 0.44 ± 0.05 | 0.62 ± 0.05 *** | 0.60 ± 0.04 *** | 0.64 ± 0.06 *** |
| Experimental | 0.49 ± 0.06 | 0.62 ± 0.05 ** | 0.65 ± 0.09 *** | 0.57 ± 0.04 a1 | |
| Abdominal circumference (cm) | Control | 15.28 ± 0.76 | 16.86 ± 0.69 *** | 17.00 ± 0.58 *** | 17.42 ± 0.58 *** |
| Experimental | 15.32 ± 0.60 | 16.42 ± 0.78 * | 17.57 ± 1.27 * | 17.72 ± 1.11 * |
| Parameter | Group | Initial Level | After Diet | Day 1 | Day 3 | Day 5 | Day 10 |
|---|---|---|---|---|---|---|---|
| Insulin (μIU/mL) | Control | 11.33 ± 1.28 | 12.76 ± 1.49 | 12.02 ± 0.90 | 11.64 ± 2.30 | 11.98 ± 1.74 | 11.16 ± 1.04 |
| Experimental | 10.80 ± 0.86 | 16.85 ± 2.70 ** | 15.44 ± 3.24 * | 17.05 ± 2.73 **a1 | 14.26 ± 12.59 | 14.60 ± 3.80 | |
| Glucose (mmol/L) | Control | 5.81 ± 0.66 | 5.74 ± 0.52 | 5.81 ± 1.07 | 5.7 ± 0.55 | 5.80 ± 1.01 | 5.84 ± 1.20 |
| Experimental | 5.80 ± 1.01 | 7.20 ± 1.13 a1 | 19.97 ± 4.29 ***+++a3 | 21.69 ± 7.50 ***+++a3 | 26.52 ± 7.19 ***+++a3 | 27.55 ± 5.59 ***+++a3 |
| Parameter | Group | Initial Level | After Diet | Day 1 | Day 3 | Day 5 | Day 10 |
|---|---|---|---|---|---|---|---|
| Total cholesterol (mmol/L) | Control | 1.50 ± 0.31 | 1.49 ± 0.14 | 1.44 ± 0.22 | 1.47 ± 0.06 | 1.48 ± 0.16 | 1.48 ± 0.09 |
| Experimental | 1.49 ± 0.30 | 2.47 ± 0.17 a3 | 2.33 ± 0.41 a3 | 2.34 ± 0.42 | 2.99 ± 0.97 *a1 | 3.07 ± 1.85 * | |
| Triglycerides (mmol/L) | Control | 0.74 ± 0.17 | 0.75 ± 0.26 | 0.71 ± 0.26 | 0.73 ± 0.21 | 0.73 ± 0.38 | 0.70 ± 0.33 |
| Experimental | 0.74 ± 0.22 | 1.88 ± 0.33 a3 | 3.68 ± 2.56 | 4.90 ± 2.38 | 8.32 ± 4.57 ***++va3 | 5.95 ± 3.99 *a1 | |
| LDL (mmol/L) | Control | 0.43 ± 0.07 | 0.42 ± 0.06 | 0.41 ± 0.08 | 0.44 ± 0.06 | 0.46 ± 0.13 | 0.48 ± 0.06 |
| Experimental | 0.46 ± 0.12 | 0.83 ± 0.11 a3 | 0.79 ± 0.18 a3 | 0.73 ± 0.21 ***++vvv | 0.89 ± 0.45 •••a3 | 0.76 ± 0.67 • | |
| VLDL (mmol/L) | Control | 0.34 ± 0.08 | 0.34 ± 0.12 | 0.32 ± 0.12 | 0.33 ± 0.10 | 0.34 ± 0.17 | 0.32 ± 0.15 |
| Experimental | 0.34 ± 0.10 | 0.86 ± 0.15 a3 | 1.68 ± 1.17 | 2.24 ± 1.09 | 3.81 ± 2.09 ***++va3 | 2.72 ± 1.82 *a1 | |
| HDL (mmol/L) | Control | 0.95 ± 0.23 | 0.94 ± 0.23 | 0.93 ± 0.12 | 0.91 ± 0.12 | 0.96 ± 0.25 | 0.93 ± 0.08 |
| Experimental | 0.96 ± 0.25 | 1.24 ± 0.11 a1 | 1.12 ± 0.24 | 1.02 ± 0.22 | 0.90 ± 0.27 | 0.91 ± 0.11 |
| Parameter | Group | Initial Level | After Diet | Day 1 | Day 3 | Day 5 | Day 10 |
|---|---|---|---|---|---|---|---|
| AOPP (μmol/L) | Control | 51.86 ± 7.20 | 63.86 ± 12.95 | 65.14 ± 11.94 | 64.86 ± 10.94 | 65.28 ± 9.78 | 67.43 ± 14.32 |
| Experimental | 42.57 ± 7.72 | 66.86 ± 24.20 | 74.57 ± 24.18 | 116.57 ± 35.33 ***+a3 | 181.00 ± 44.38 ***+++VVVa3 | 113.71 ± 24.39 ***+a3 | |
| Uric acid (μmol/L) | Control | 87.86 ± 22.12 | 85.43 ± 32.78 | 86.43 ± 18.62 | 87.43 ± 21.39 | 87.14 ± 16.60 | 87.00 ± 15.62 |
| Experimental | 85.28 ± 17.88 | 115.00 ± 26.6 | 138.29 ± 21.75 *a1 | 144.57 ± 43.30 *a1 | 136.43 ± 38.06 *a1 | 129.14 ± 28.99 |
Disclaimer/Publisher’s Note: The statements, opinions and data contained in all publications are solely those of the individual author(s) and contributor(s) and not of MDPI and/or the editor(s). MDPI and/or the editor(s) disclaim responsibility for any injury to people or property resulting from any ideas, methods, instructions or products referred to in the content. |
© 2023 by the authors. Licensee MDPI, Basel, Switzerland. This article is an open access article distributed under the terms and conditions of the Creative Commons Attribution (CC BY) license (https://creativecommons.org/licenses/by/4.0/).
Share and Cite
Andonova, M.; Dzhelebov, P.; Trifonova, K.; Yonkova, P.; Kostadinov, N.; Nancheva, K.; Ivanov, V.; Gospodinova, K.; Nizamov, N.; Tsachev, I.; et al. Metabolic Markers Associated with Progression of Type 2 Diabetes Induced by High-Fat Diet and Single Low Dose Streptozotocin in Rats. Vet. Sci. 2023, 10, 431. https://doi.org/10.3390/vetsci10070431
Andonova M, Dzhelebov P, Trifonova K, Yonkova P, Kostadinov N, Nancheva K, Ivanov V, Gospodinova K, Nizamov N, Tsachev I, et al. Metabolic Markers Associated with Progression of Type 2 Diabetes Induced by High-Fat Diet and Single Low Dose Streptozotocin in Rats. Veterinary Sciences. 2023; 10(7):431. https://doi.org/10.3390/vetsci10070431
Chicago/Turabian StyleAndonova, Maria, Petko Dzhelebov, Krastina Trifonova, Penka Yonkova, Nikola Kostadinov, Krasimira Nancheva, Veselin Ivanov, Krasimira Gospodinova, Nikola Nizamov, Ilia Tsachev, and et al. 2023. "Metabolic Markers Associated with Progression of Type 2 Diabetes Induced by High-Fat Diet and Single Low Dose Streptozotocin in Rats" Veterinary Sciences 10, no. 7: 431. https://doi.org/10.3390/vetsci10070431
APA StyleAndonova, M., Dzhelebov, P., Trifonova, K., Yonkova, P., Kostadinov, N., Nancheva, K., Ivanov, V., Gospodinova, K., Nizamov, N., Tsachev, I., & Chernev, C. (2023). Metabolic Markers Associated with Progression of Type 2 Diabetes Induced by High-Fat Diet and Single Low Dose Streptozotocin in Rats. Veterinary Sciences, 10(7), 431. https://doi.org/10.3390/vetsci10070431


