
Femoral Neck Thickness Index as an Indicator of Proximal Femur Bone Modeling

 ,
,  ,
,  , ,
, ,  ,
,
Abstract
Simple Summary
Abstract
1. Introduction
2. Materials and Methods
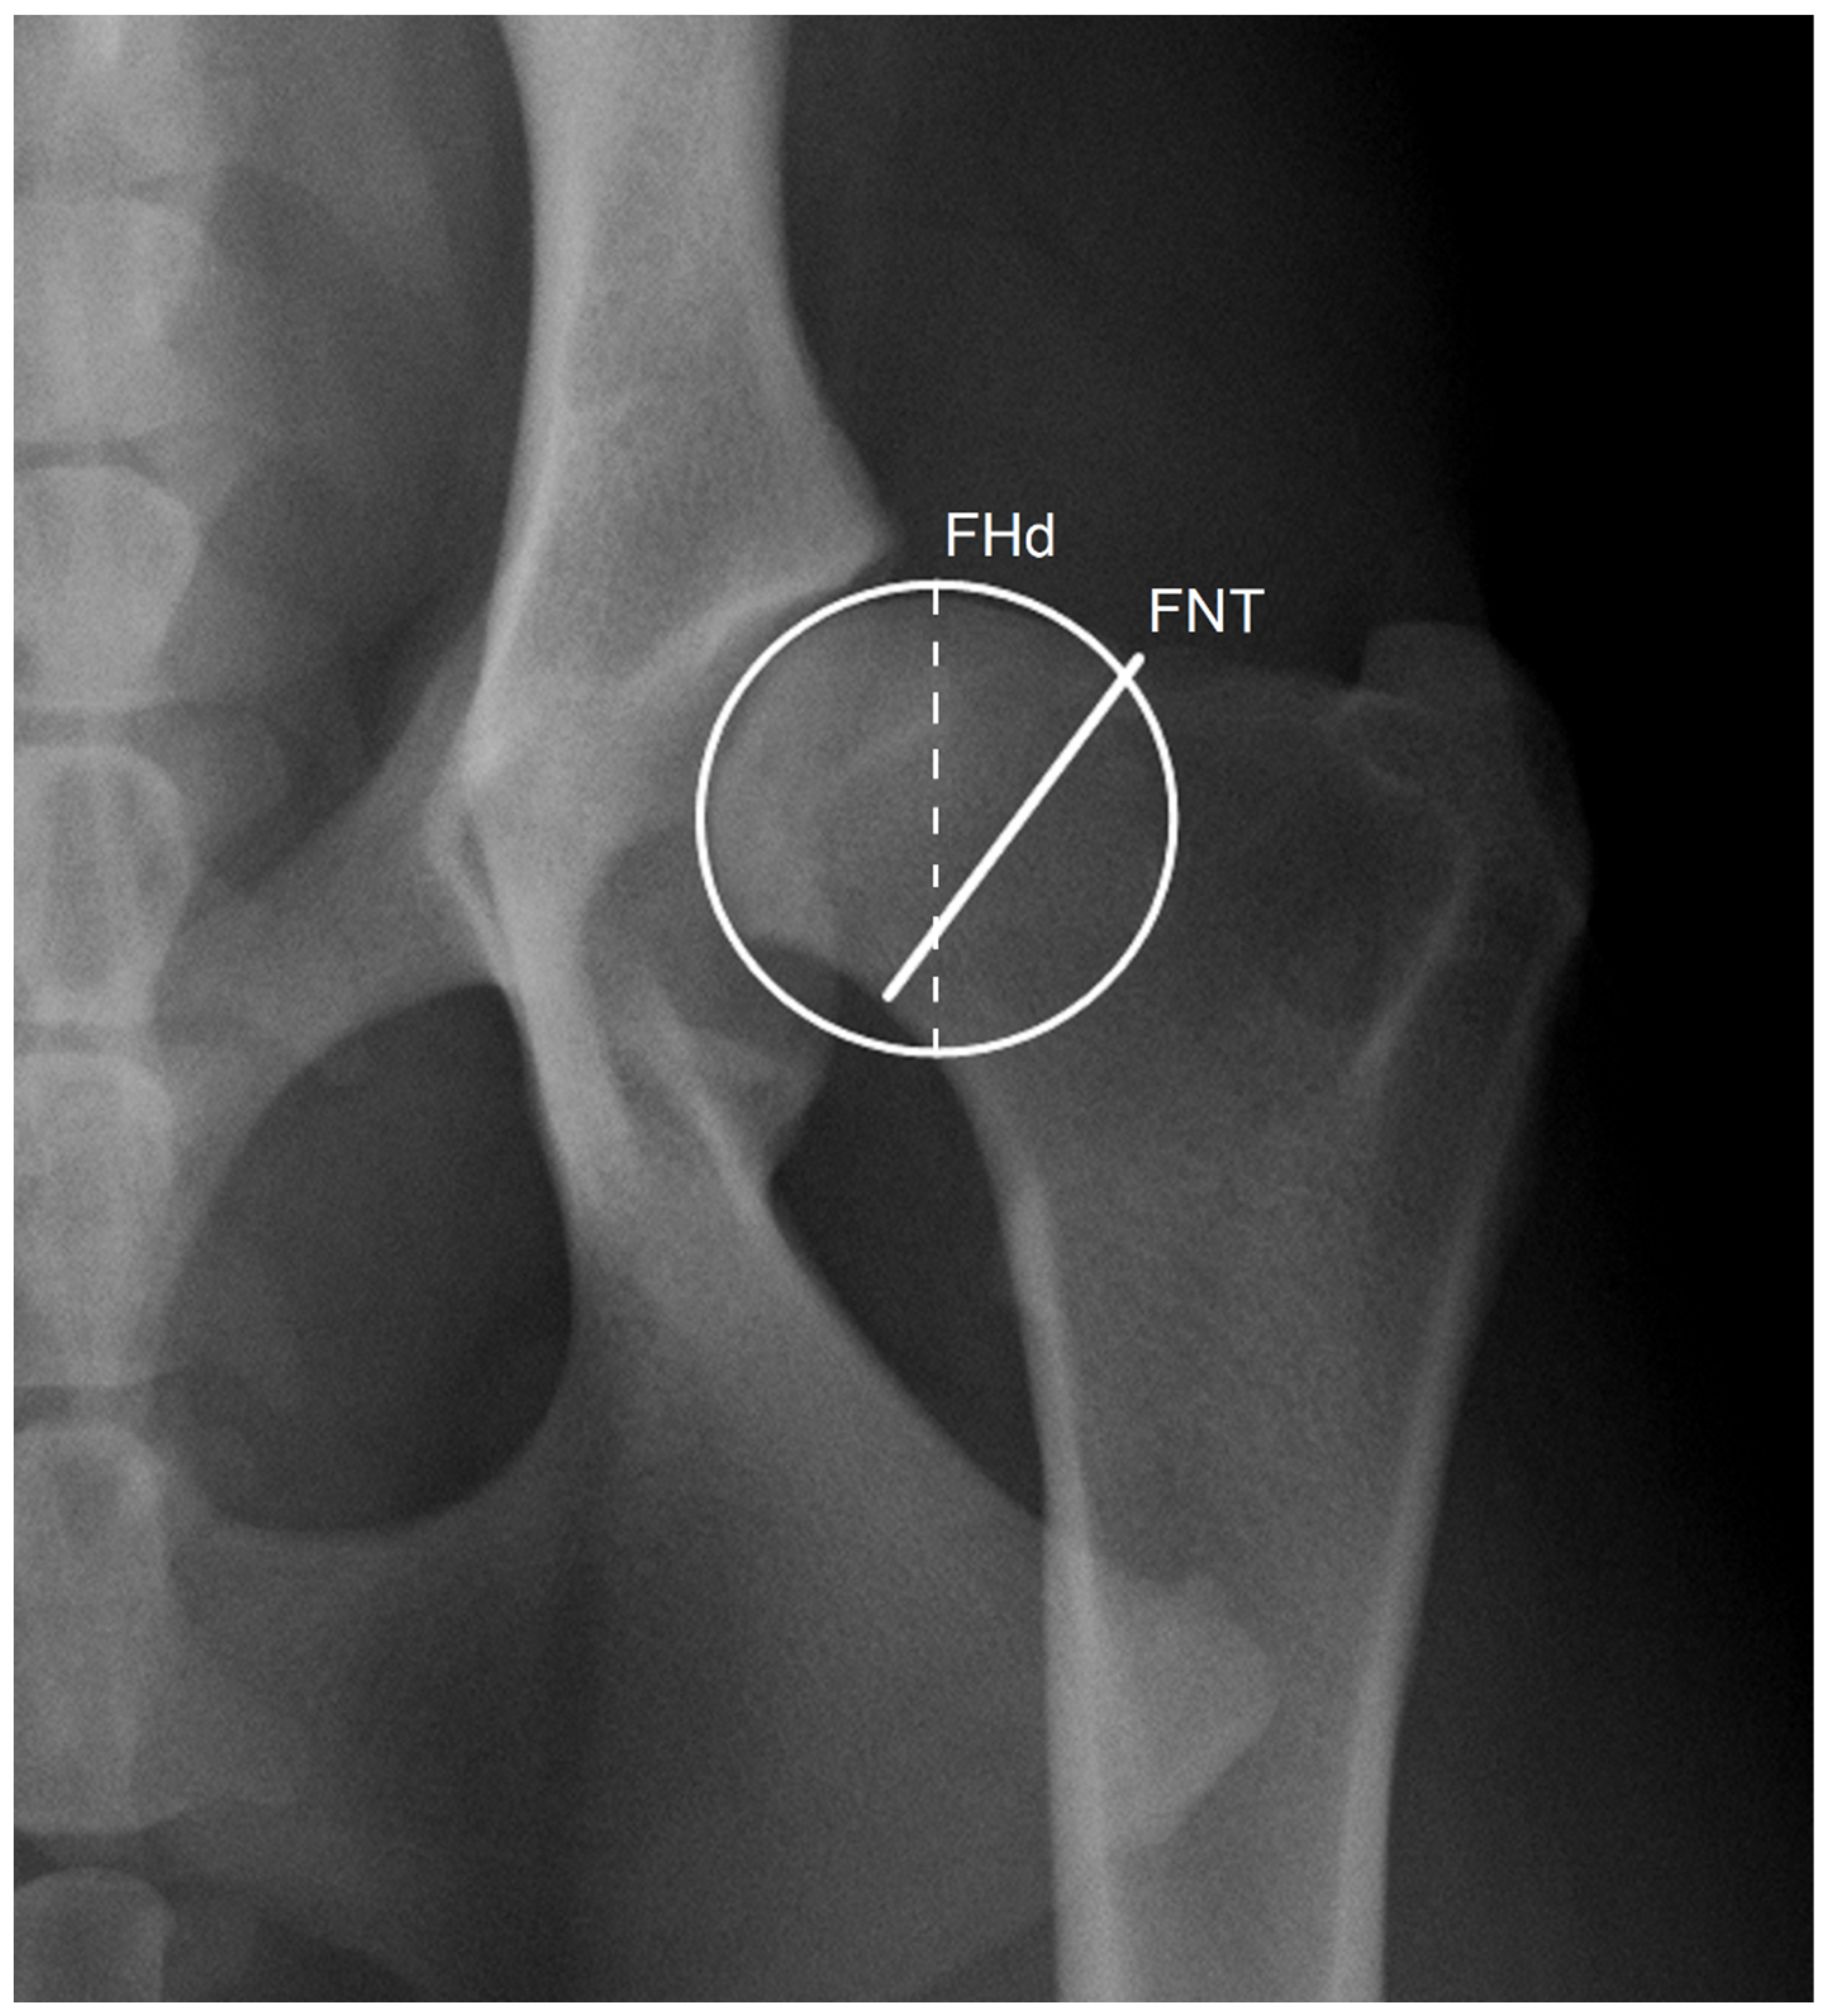
2.1. Radiographic Measurements
2.2. Statistical Analysis
3. Results
4. Discussion
5. Conclusions
Author Contributions
Funding
Institutional Review Board Statement
Informed Consent Statement
Data Availability Statement
Acknowledgments
Conflicts of Interest
References
- Smith, G.K.; Paster, E.R.; Powers, M.Y.; Lawler, D.F.; Biery, D.N.; Shofer, F.S.; McKelvie, P.J.; Kealy, R.D. Lifelong Diet Restriction and Radiographic Evidence of Osteoarthritis of the Hip Joint in Dogs. J. Am. Vet. Med. Assoc. 2006, 229, 690–693. [Google Scholar] [CrossRef] [PubMed]
- Ginja, M.M.; Gonzalo-Orden, J.M.; Melo-Pinto, P.; Bulas-Cruz, J.; Orden, M.A.; San Roman, F.; Llorens-Pena, M.P.; Ferreira, A.J. Early hip laxity examination in predicting moderate and severe hip dysplasia in Estrela mountain dog. J. Small Anim. Pract. 2008, 49, 641–646. [Google Scholar] [CrossRef] [PubMed]
- Bartolomé, N.; Segarra, S.; Artieda, M.; Francino, O.; Sánchez, E.; Szczypiorska, M.; Casellas, J.; Tejedor, D.; Cerdeira, J.; Martínez, A.; et al. A genetic predictive model for canine hip dysplasia: Integration of Genome Wide Association Study (GWAS) and candidate gene approaches. PLoS ONE 2015, 10, e0122558. [Google Scholar] [CrossRef] [PubMed]
- Bruun, C.S.; Bank, A.; Ström, A.; Proschowsky, H.F.; Fredholm, M. Validation of DNA test for hip dysplasia failed in Danish Labrador Retrievers. Anim. Genet. 2020, 51, 617–619. [Google Scholar] [CrossRef]
- Lopez, M.; Schachner, E. Diagnosis, Prevention, and Management of Canine Hip Dysplasia: A Review. Vet. Med. Res. Rep. 2015, 6, 181–192. [Google Scholar] [CrossRef]
- Ginja, M.M.D.; Silvestre, A.M.; Gonzalo-Orden, J.M.; Ferreira, A.J.A. Diagnosis, Genetic Control and Preventive Management of Canine Hip Dysplasia: A Review. Vet. J. 2010, 184, 269–276. [Google Scholar] [CrossRef]
- Martins, J.; Colaço, B.; Alves-Pimenta, S.; Gonzalo Orden, J.M.; Ferreira, A.J.; Ginja, M.M. Effect of the Dog positioning on X-ray Table on Hip Dysplasia Parameter Evaluation. Vet. Comp. Orthop. Traumatol. 2019, 32, 376–382. [Google Scholar] [CrossRef]
- Coopman, F.; Verhoeven, G.; Paepe, D.; Van Bree, H.; Duchateau, L.; Saunders, J.H. Inter-Observer Agreement on the Radiographic Assessment of Canine Hip Dysplasia. Vlaams Diergeneeskd. Tijdschr. 2007, 76, 417–422. [Google Scholar]
- Genevois, J.-P.; Cachon, T.; Fau, D.; Carozzo, C.; Viguier, E.; Collard, F.; Remy, D. Canine Hip Dysplasia Radiographic Screening. Prevalence of Rotation of the Pelvis along Its Length Axis in 7012 Conventional Hip Extended Radiographs. Vet. Comp. Orthop. Traumatol. 2007, 20, 296–298. [Google Scholar]
- Powers, M.Y.; Biery, D.N.; Lawler, D.F.; Evans, R.H.; Shofer, F.S.; Mayhew, P.; Gregor, T.P.; Kealy, R.D.; Smith, G.K. Use of the Caudolateral Curvilinear Osteophyte as an Early Marker for Future Development of Osteoarthritis Associated with Hip Dysplasia in Dogs. J. Am. Vet. Med. Assoc. 2004, 225, 233–237. [Google Scholar] [CrossRef]
- Franco-Gonçalo, P.; Moreira da Silva, D.; Leite, P.; Alves-Pimenta, S.; Colaço, B.; Ferreira, M.; Gonçalves, L.; Filipe, V.; McEvoy, F.; Ginja, M. Acetabular Coverage Area Occupied by the Femoral Head as an Indicator of Hip Congruency. Animals 2022, 12, 2201. [Google Scholar] [CrossRef]
- Flückiger, M. Scoring Radiographs for Canine Hip Dysplasia—The Big Three Organizations in the World. Eur. J. Companion Anim. Pract. 2007, 17, 135–140. [Google Scholar]
- Geissbühler, U.; Drazovic, S.; Lang, J.; Howard, J. Inter-Rater Agreement in Radiographic Canine Hip Dysplasia Evaluation. Vet. Rec. 2017, 180, 357. [Google Scholar] [CrossRef]
- Fortrie, R.R.; Verhoeven, G.; Broeckx, B.; Duchateau, L.; Janssens, L.; Samoy, Y.; Schreurs, E.; Saunders, J.; van Bree, H.; Vandekerckhove, P.; et al. Intra- and Interobserver Agreement on Radiographic Phenotype in the Diagnosis of Canine Hip Dysplasia. Vet. Surg. 2015, 44, 467–473. [Google Scholar] [CrossRef]
- Riser, W.H.; Rhodes, W.H.; Newton, C.D. Hip Dysplasia. In Textbook of Small Animal Orthopedics; U. Penn CAL Small Animal Orthopedics; Lippincott Williams & Wilkins: Philadelphia, PA, USA, 1982. [Google Scholar]
- Smith, G.K. New Paradigms for Hip Dysplasia Prevention and Control, Performance and Ethics of CHD Screening. In 12th ESVOT Congress Proceedings; Vezzoni, A., Schramme, M., Eds.; LMU: Munich, Germany, 2004; pp. 125–131. [Google Scholar]
- Pinna, S.; Tassani, C.; Antonino, A.; Vezzoni, A. Prevalence of Primary Radiographic Signs of Hip Dysplasia in Dogs. Animals 2022, 12, 2788. [Google Scholar] [CrossRef]
- Andronescu, A.A.; Kelly, L.; Kearney, M.T.; Lopez, M.J. Associations between Early Radiographic and Computed Tomographic Measures and Canine Hip Joint Osteoarthritis at Maturity. Am. J. Vet. Res. 2015, 76, 19–27. [Google Scholar] [CrossRef]
- Dennis, R. Interpretation and Use of BVA/KC Hip Scores in Dogs. InPractice 2012, 34, 178–194. [Google Scholar] [CrossRef]
- Gaspar, A.R.; Hayes, G.; Ginja, C.; Ginja, M.M.; Todhunter, R.J. The Norberg Angle Is Not an Accurate Predictor of Canine Hip Conformation Based on the Distraction Index and the Dorsolateral Subluxation Score. Prev. Vet. Med. 2016, 135, 47–52. [Google Scholar] [CrossRef]
- Kwak, S.G.; Kim, J.H. Cornerstone of Modern Statistics. Korean J. Anesthesiol. 2017, 70, 144–156. [Google Scholar] [CrossRef]
- Watson, P.F.; Petrie, A. Method Agreement Analysis: A Review of Correct Methodology. Theriogenology 2010, 73, 1167–1179. [Google Scholar] [CrossRef]
- Ludbrook, J. Confidence in Altman-Bland Plots: A Critical Review of the Method of Differences. Clin. Exp. Pharmacol. Physiol. 2010, 37, 143–149. [Google Scholar] [CrossRef] [PubMed]
- Bland, J.M.; Altman, D.G. Measuring Agreement in Method Comparison Studies. Stat. Methods Med. Res. 1999, 8, 135–160. [Google Scholar] [CrossRef] [PubMed]
- Koo, T.K.; Li, M.Y. A Guideline of Selecting and Reporting Intraclass Correlation Coefficients for Reliability Research. J. Chiropr. Med. 2016, 15, 155–163. [Google Scholar] [CrossRef] [PubMed]
- Lee, J.; Koh, D.; Ong, C.N. Statistical Evaluation of Agreement between Two Methods for Measuring a Quantitative Variable. Comput. Biol. Med. 1989, 19, 61–70. [Google Scholar] [CrossRef]
- Cohen, J. Statistical Power Analysis for the Behavioral Sciences, 2nd ed.; Lawrence Erlbaum Associates, Inc.: London, UK, 1988. [Google Scholar]
- Marôco, J. Análise Estatística Com o SPSS Statistics, 7th ed.; Gráfica Manuel Barbosa & Filhos: Pêro Pinheiro, Portugal, 2018. [Google Scholar]
- Hedhammar, Å. Swedish Experiences From 60 Years of Screening and Breeding Programs for Hip Dysplasia-Research, Success, and Challenges. Front. Vet. Sci. 2020, 27, 228. [Google Scholar] [CrossRef]
- Edinger, D.T.; Hayashi, K.; Hongyu, Y.; Markel, M.D.; Manley, P.A. Histomorphometric Analysis of the Proximal Portion of the Femur in Dogs with Moderate Osteoarthritis. Am. J. Vet. Res. 2005, 66, 150–155. [Google Scholar] [CrossRef]
- Martins, J.; Ferreira, A.J.; Ginja, M.M. Morphometric assessment of the hip joint in the Estrela Mountain Dog breed. Vet. Comp. Orthop. Traumatol. 2012, 25, 202–210. [Google Scholar] [CrossRef]
- McEvoy, F.J.; Proschowsky, H.F.; Müller, A.V.; Moorman, L.; Bender-Koch, J.; Svalastoga, E.L.; Frellsen, J.; Nielsen, D.H. Deep Transfer Learning Can Be Used for the Detection of Hip Joints in Pelvis Radiographs and the Classification of Their Hip Dysplasia Status. Vet. Radiol. Ultrasound. 2021, 62, 387–393. [Google Scholar] [CrossRef]
- Banzato, T.; Wodzinski, M.; Tauceri, F.; Donà, C.; Scavazza, F.; Müller, H.; Zotti, A. An AI-Based Algorithm for the Auto-matic Classification of Thoracic Radiographs in Cats. Front. Vet. Sci. 2021, 8, 731936. [Google Scholar] [CrossRef]
- Morgan, J.K.; Stephens, M. Radiographic Diagnosis and Control of Canine Hip Dysplasia; Iowa State University Digital Press: Ames, IA, USA, 1985. [Google Scholar]
- FCI Hip Dyspalsia Classification. In Proceedings of the FCI/DKK Hip Dysplasia Conference, Copenhagen, Denmark, 24–25 May 2022; p. 11.


| Comparison | Paired t-Test p-Value | Cohen’s d | ICC [95% CI] | d ± SD | 95% LA | ||
|---|---|---|---|---|---|---|---|
| Lower Bound | Upper Bound | ||||||
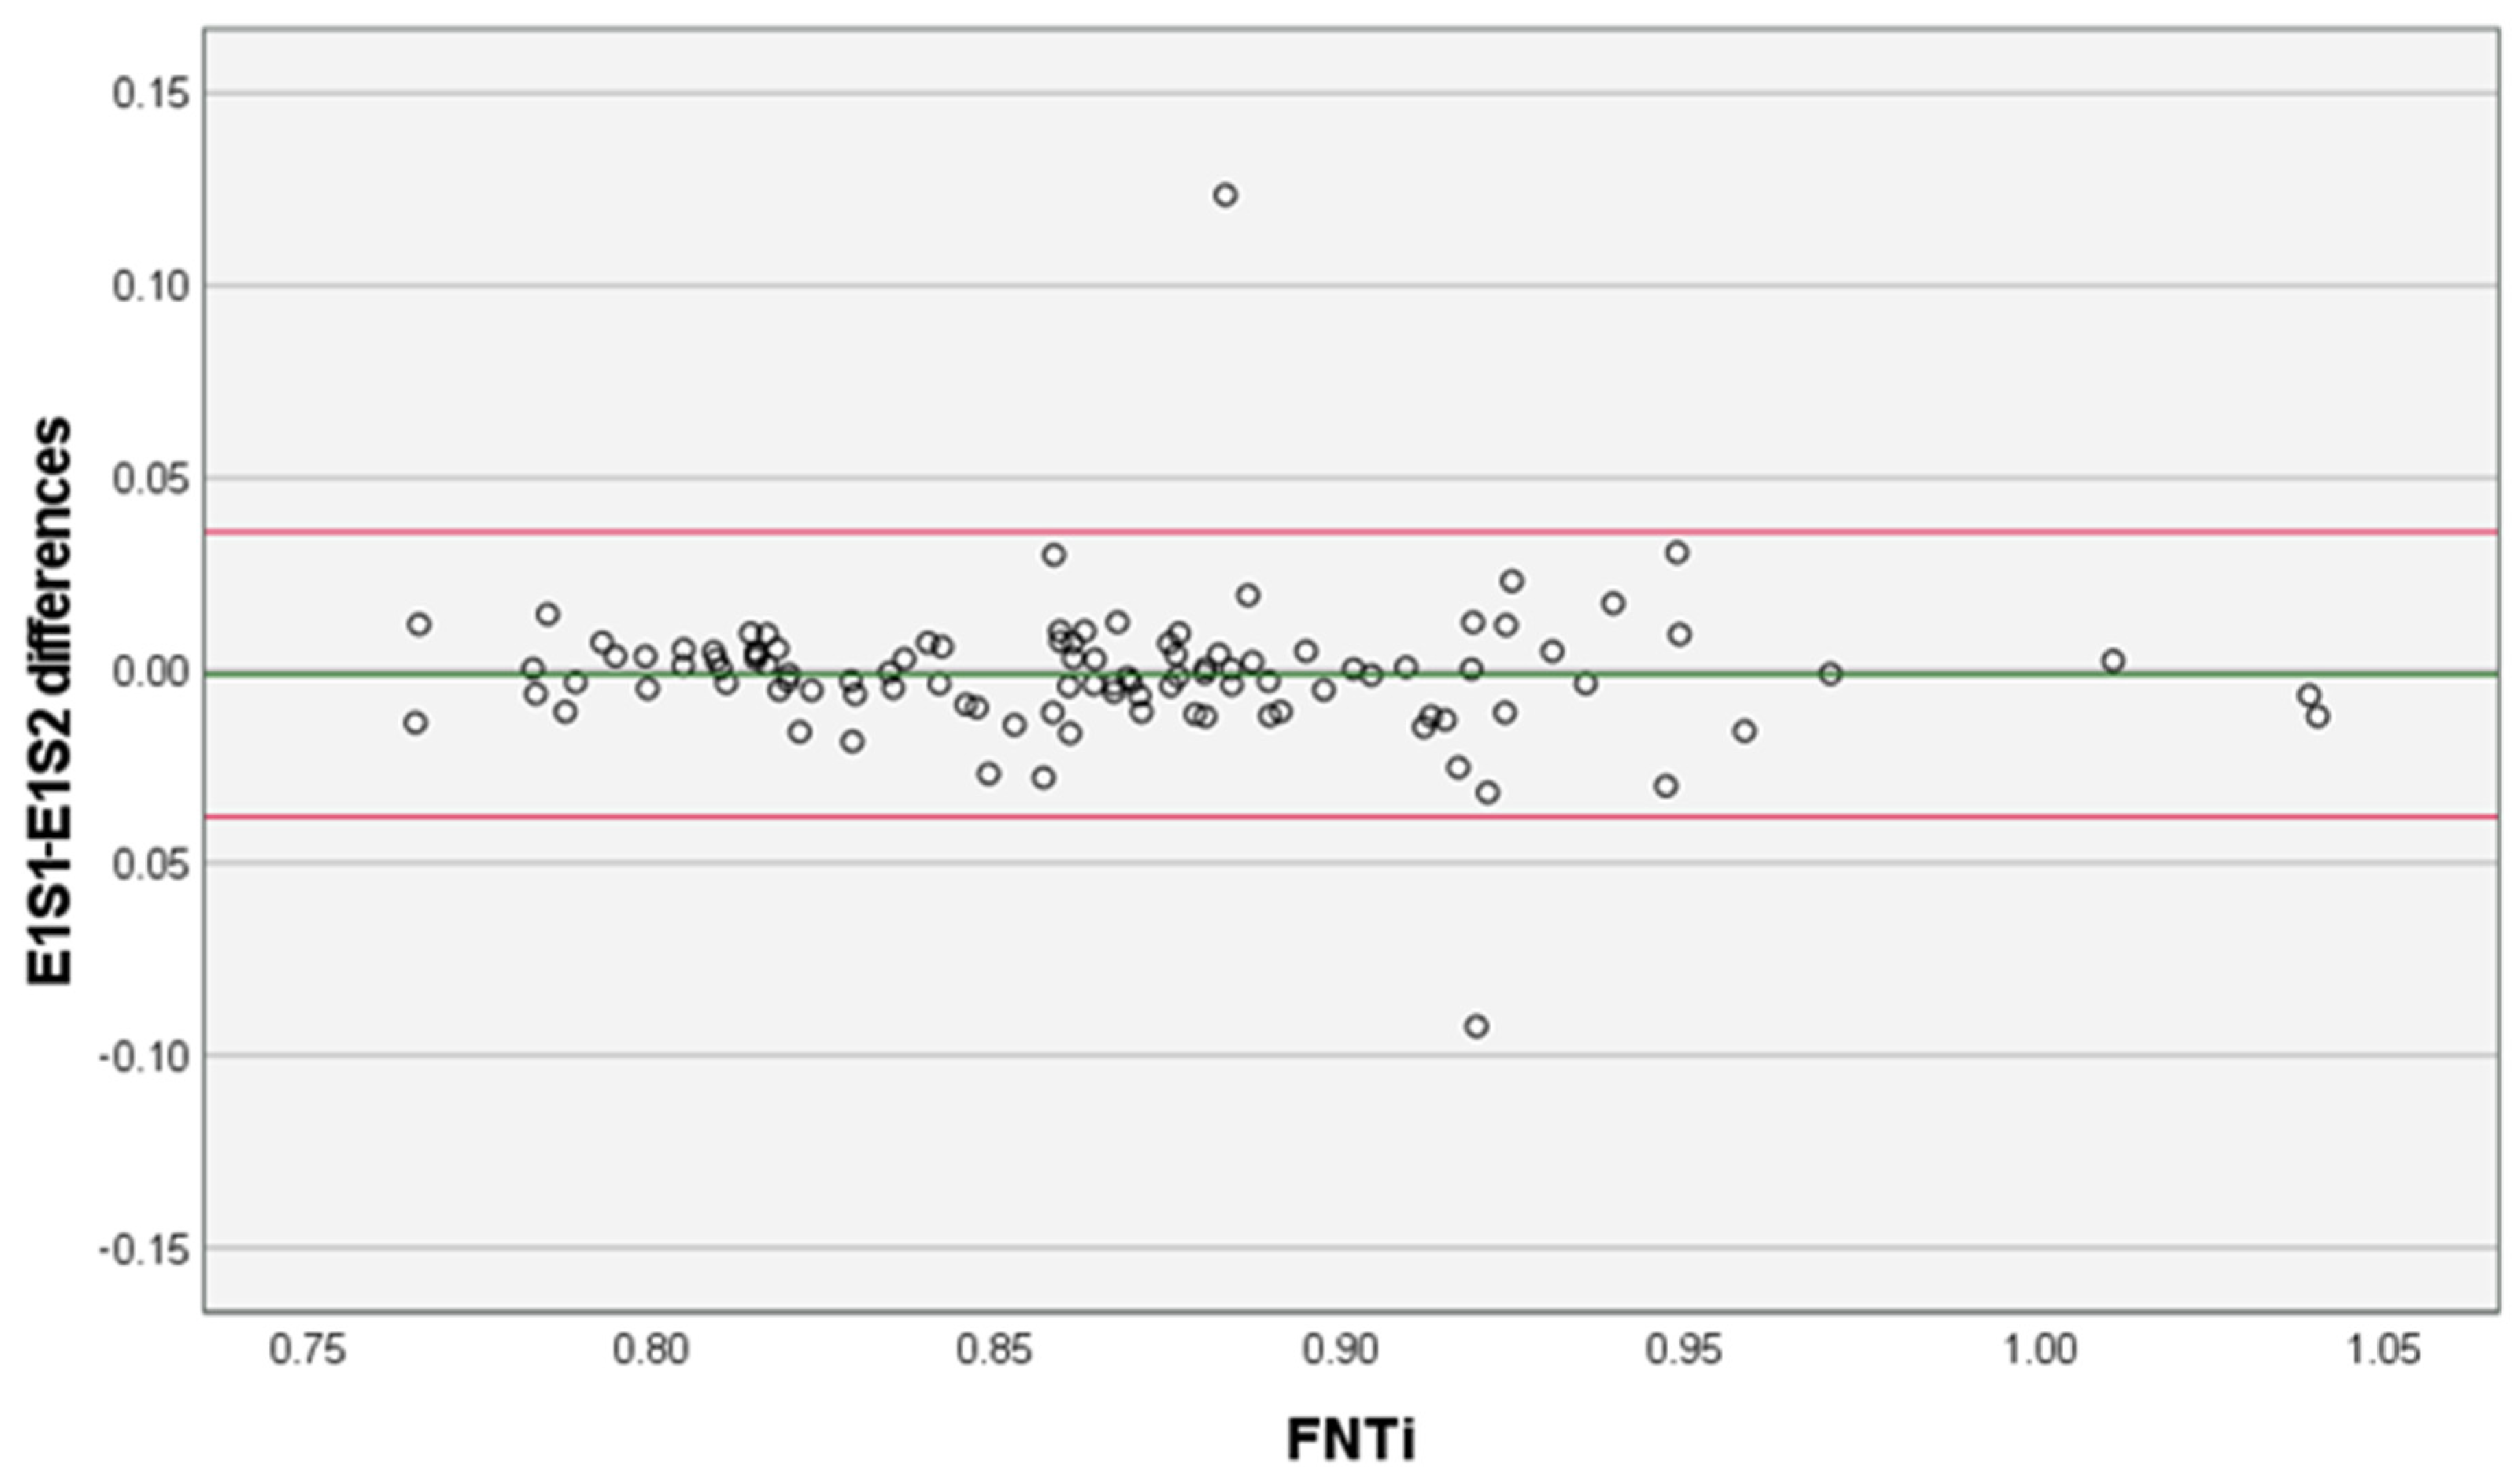
| Intra- examiner | E1S1–E1S2 | 0.583 | -- | 0.94 [0.92,0.96] | −0.001 ± 0.019 | −0.038 | 0.036 |
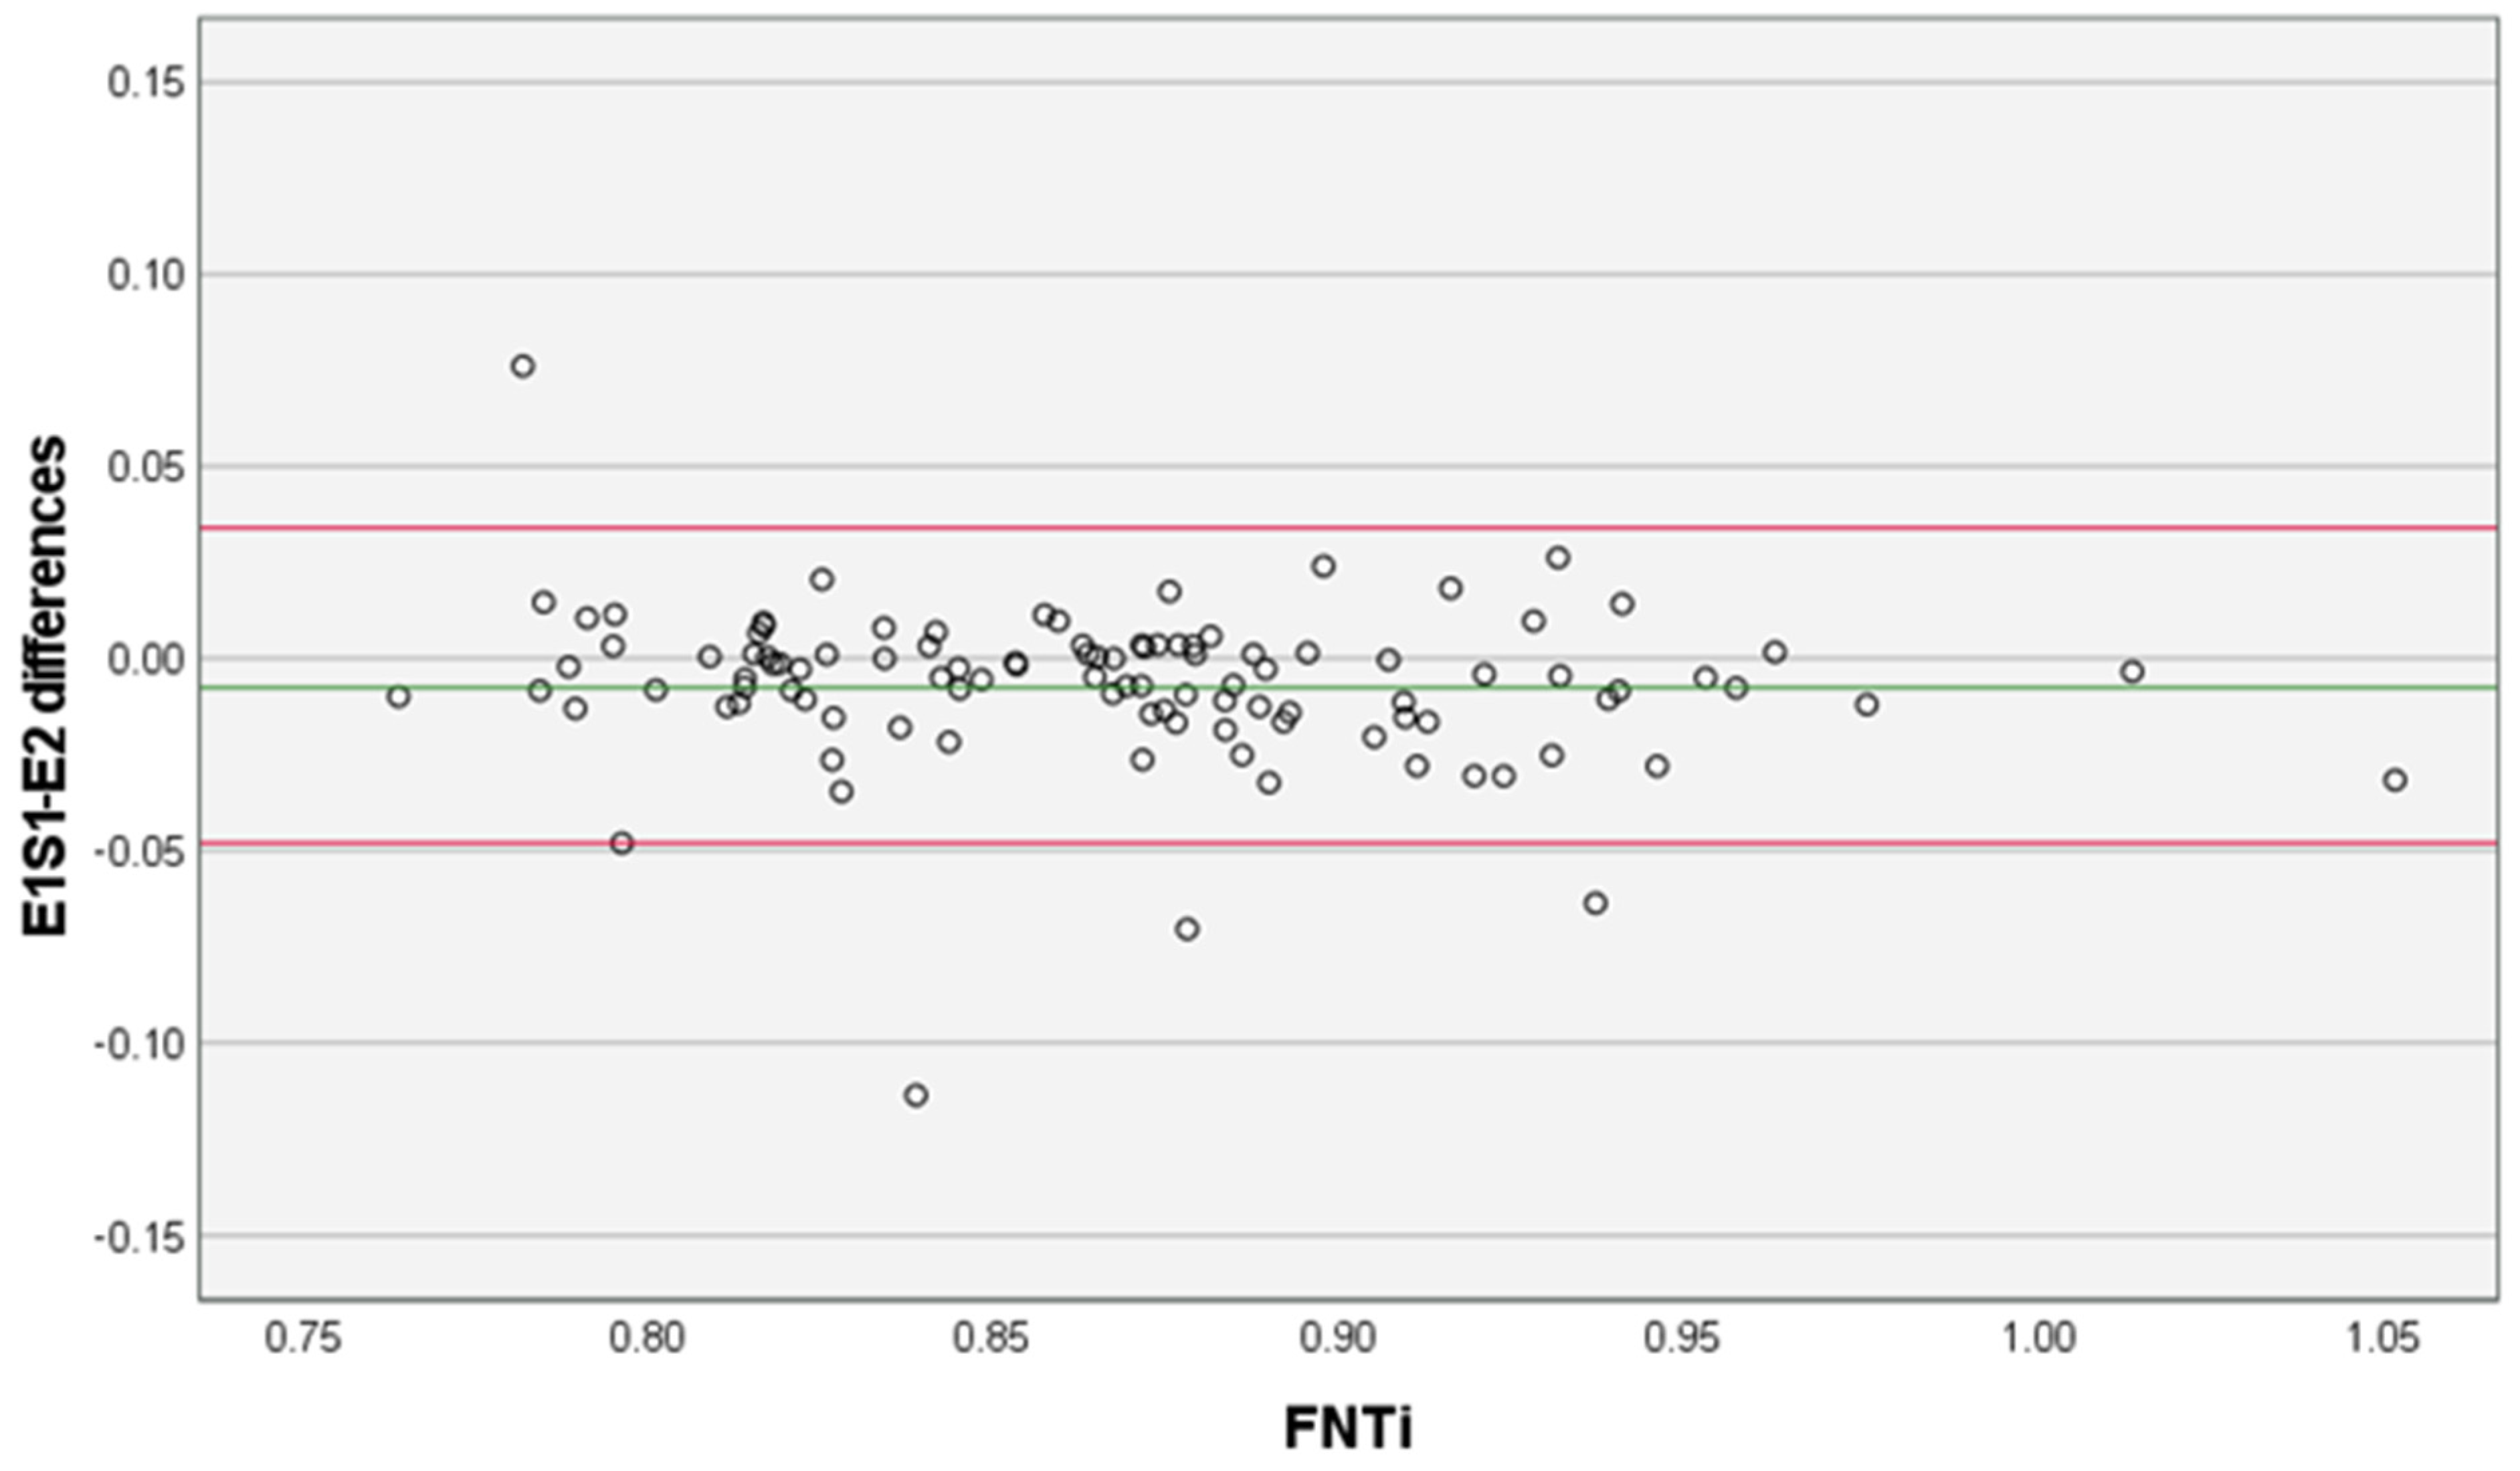
| Inter- examiner | E1S1–E2 | <0.001 | 0.14 | 0.93 [0.90,0.95] | −0.007 ± 0.021 | −0.048 | 0.034 |
| FCI Categories | N | Mean * | SD | Mean 95% CI | Min | Max | |
|---|---|---|---|---|---|---|---|
| Lower Bound | Upper Bound | ||||||
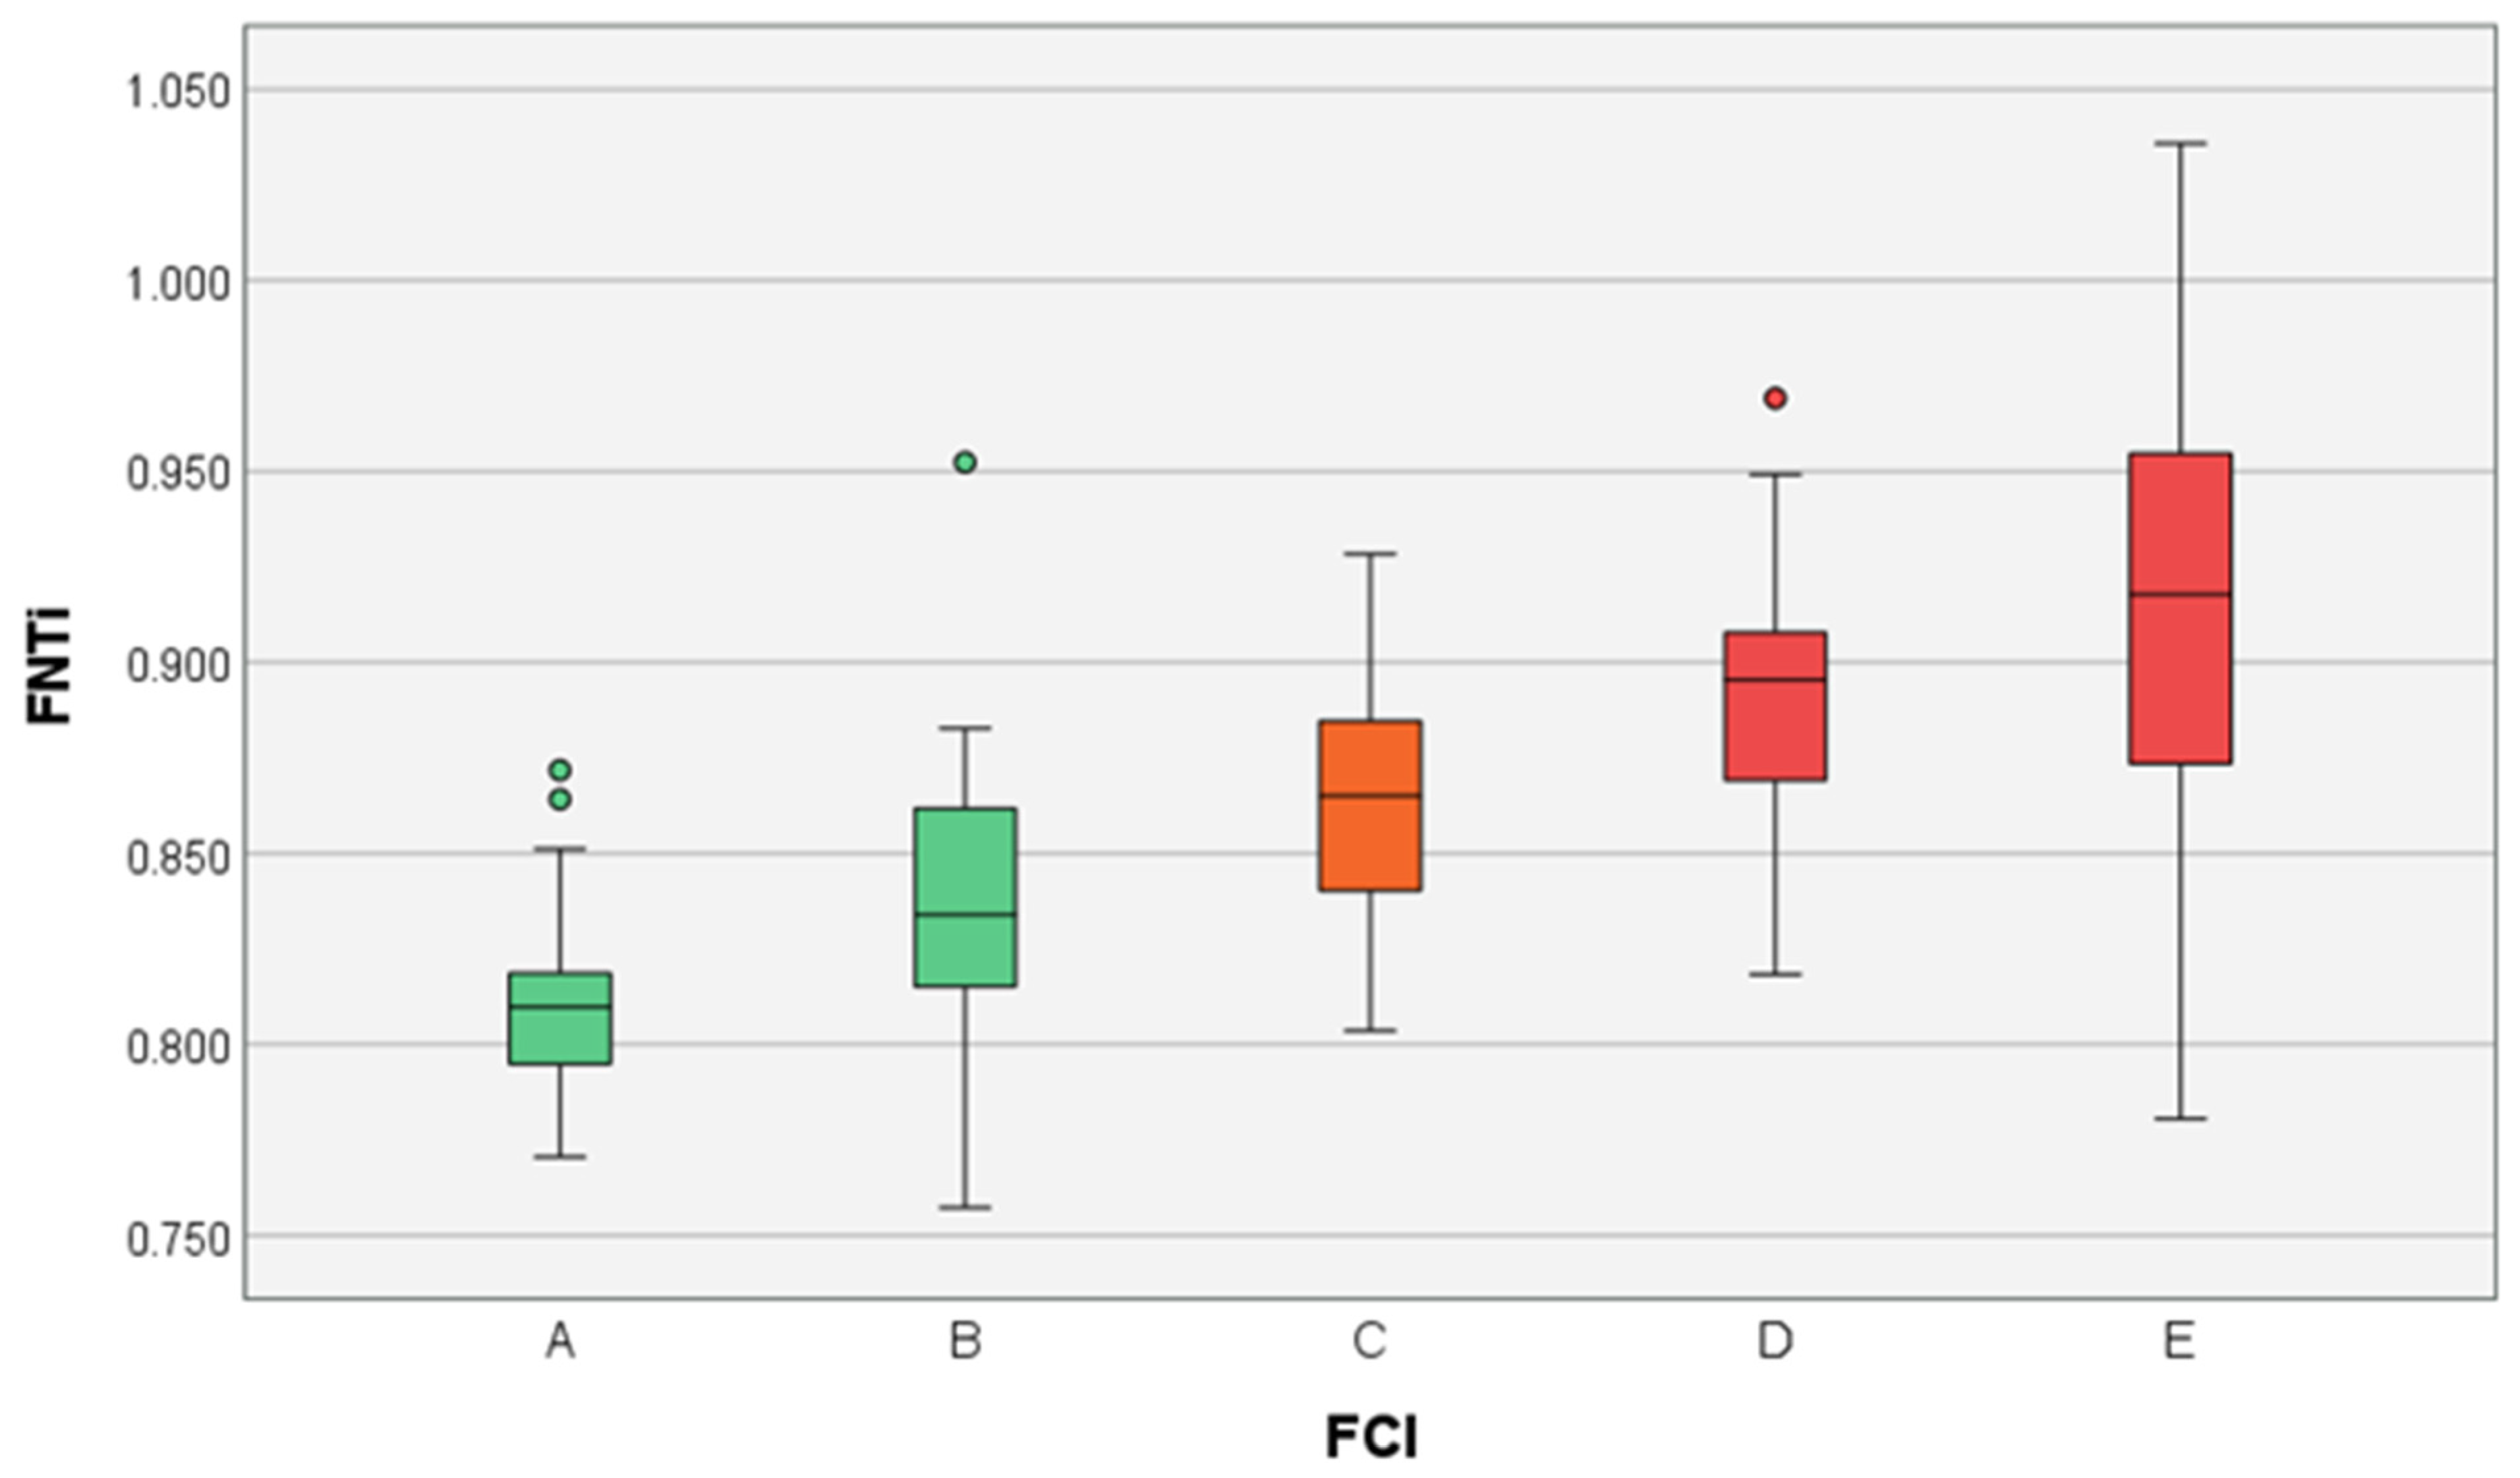
| A | 19 | 0.809 a | 0.024 | 0.797 | 0.823 | 0.771 | 0.864 |
| B | 23 | 0.835 a,b | 0.044 | 0.812 | 0.859 | 0.757 | 0.952 |
| C | 24 | 0.868 b,c | 0.022 | 0.856 | 0.880 | 0.831 | 0.918 |
| D | 24 | 0.903 c,d | 0.033 | 0.886 | 0.921 | 0.841 | 0.969 |
| E | 16 | 0.923 d | 0.068 | 0.887 | 0.959 | 0.781 | 1.036 |
Disclaimer/Publisher’s Note: The statements, opinions and data contained in all publications are solely those of the individual author(s) and contributor(s) and not of MDPI and/or the editor(s). MDPI and/or the editor(s) disclaim responsibility for any injury to people or property resulting from any ideas, methods, instructions or products referred to in the content. |
© 2023 by the authors. Licensee MDPI, Basel, Switzerland. This article is an open access article distributed under the terms and conditions of the Creative Commons Attribution (CC BY) license (https://creativecommons.org/licenses/by/4.0/).
Share and Cite
Franco-Gonçalo, P.; Pereira, A.I.; Loureiro, C.; Alves-Pimenta, S.; Filipe, V.; Gonçalves, L.; Colaço, B.; Leite, P.; McEvoy, F.; Ginja, M. Femoral Neck Thickness Index as an Indicator of Proximal Femur Bone Modeling. Vet. Sci. 2023, 10, 371. https://doi.org/10.3390/vetsci10060371
Franco-Gonçalo P, Pereira AI, Loureiro C, Alves-Pimenta S, Filipe V, Gonçalves L, Colaço B, Leite P, McEvoy F, Ginja M. Femoral Neck Thickness Index as an Indicator of Proximal Femur Bone Modeling. Veterinary Sciences. 2023; 10(6):371. https://doi.org/10.3390/vetsci10060371
Chicago/Turabian StyleFranco-Gonçalo, Pedro, Ana Inês Pereira, Cátia Loureiro, Sofia Alves-Pimenta, Vítor Filipe, Lio Gonçalves, Bruno Colaço, Pedro Leite, Fintan McEvoy, and Mário Ginja. 2023. "Femoral Neck Thickness Index as an Indicator of Proximal Femur Bone Modeling" Veterinary Sciences 10, no. 6: 371. https://doi.org/10.3390/vetsci10060371
APA StyleFranco-Gonçalo, P., Pereira, A. I., Loureiro, C., Alves-Pimenta, S., Filipe, V., Gonçalves, L., Colaço, B., Leite, P., McEvoy, F., & Ginja, M. (2023). Femoral Neck Thickness Index as an Indicator of Proximal Femur Bone Modeling. Veterinary Sciences, 10(6), 371. https://doi.org/10.3390/vetsci10060371