Abstract
To address the growing electricity demand driven by population growth and economic development while mitigating climate change, West and Central African countries are increasingly prioritizing renewable energy as part of their Nationally Determined Contributions (NDCs). This study evaluates the implications of climate change on renewable energy potential using ten downscaled and bias-adjusted CMIP6 models (CDFt method). Key climate variables—temperature, solar radiation, and wind speed—were analyzed and integrated into the Teal-WCA platform to aid in energy resource planning. Projected temperature increases of 0.5–2.7 °C (2040–2069) and 0.7–5.2 °C (2070–2099) relative to 1985–2014 underscore the need for strategies to manage the rising demand for cooling. Solar radiation reductions (~15 W/m2) may lower photovoltaic (PV) efficiency by 1–8.75%, particularly in high-emission scenarios, requiring a focus on system optimization and diversification. Conversely, wind speeds are expected to increase, especially in coastal regions, enhancing wind power potential by 12–50% across most countries and by 25–100% in coastal nations. These findings highlight the necessity of integrating climate-resilient energy policies that leverage wind energy growth while mitigating challenges posed by reduced solar radiation. By providing a nuanced understanding of the renewable energy potential under changing climatic conditions, this study offers actionable insights for sustainable energy planning in West and Central Africa.
Dataset:https://wca.tealtool.earth and https://zenodo.org/records/10205606 (accessed on 11 September 2024).
1. Introduction
Although a larger proportion of the global population has gained access to electricity in the last decade than ever before, the number of people without electricity in Sub-Saharan Africa has increased [1]. According to the World Bank, more than 50% of the Sub-Saharan population was without access to electricity in 2020, accounting for 70% (around 130 million) and 53% (around 220 million) of inhabitants in the Central and West Africa regions, respectively [2]. Energy production is dominated by the use of fossil fuels, namely, natural gases, coal, and petrol, as primary energy sources which are the principal sources of greenhouse gas emissions [3]. For instance, in 2019, gas, oil, and hydropower represented, respectively, 56%, 12%, and 31% of the primary energy sources contributing to electricity generation in West Africa, while solar energy accounted for less than 1%, and combined wind, coal, and bioenergy together accounted for less than 1% [4,5]. In contrast, Central Africa’s electricity generation (as of 2019) largely comes from hydropower generation (74%), followed by oil (12.8%) and natural gas (12.5%) and, finally, bioenergy (0.5%) and solar (0.2%) [4,5]. Fossil fuels are currently the main supplement to hydropower, with oil-fired power generation accounting for more than half of the electricity supply in the Central African Republic and Chad, and up to 95% in São Tomé and Príncipe.
The household sector accounts for the greatest energy consumption in both regions: 70% and 74% for the West and Central Africa regions, respectively [6]. It is important to highlight that this sector is more influenced by population growth, the increase in the rate of connected people, the increase in the level of life and electricity use for different appliances including for cooling, and climate change (warming, and increased demand for cooling) [7] and, consequently, this represents a great challenge for these regions. Therefore, the energy needed for this sector will increase in the future with the population growth rate. Indeed, Sub-Saharan Africa’s population is expected to reach 3.07 billion by 2100 [8], more than triple that of 2017. Consequently, the tripling of the population in Sub-Saharan Africa over the next 80 years will necessitate huge investments to maintain levels of basic services and amenities. Specifically, between 2020 and 2040, electricity consumption in West Africa is expected to grow significantly, with a combined annual growth rate ranging from 4% to 6% [4].
The challenge with the dominantly used primary energy resources (natural gas and oil) in West and Central Africa is that they are considered exhaustible and not environmentally smart in the context of the Paris Agreement and are one of the main contributors to global warming [9,10]. However, these countries have abundant renewable energy resources that make energy affordable, reliable, and sustainable. Therefore, promoting renewable energy resources can help accelerate the achievement of sustainable development goals and the Paris Agreement. Renewable energy deployment strategies in Africa have gained momentum due to a combination of factors such as dynamic economic activity, rapid population growth, and declining renewable energy technology costs [11].
Before promoting renewable energy, it is important to evaluate the availability of the resources and ensure their feasibility in the context of climate change due to its high dependency on climate variables. Though the regions of West Africa (WAF) and Central Africa (CAF) have experience with the principal renewable energy source, which is hydropower, this source is highly sensitive to climate change and variables [12,13,14,15,16]. In the future, climate change may influence much more regarding the occurrence and intensity of extreme events [17,18] and their compounding frequencies in these regions [19], which will affect energy demand, production, and consumption. This urges the diversification of the renewable energy sources in these regions and therefore the need to assess their potential. In West Africa, the solar power generation potential (PVP_CFR) is estimated in the range of 8% to 25%, but the annual cycle is influenced by the seasonal variation of the monsoon system [20].
The solar energy potential in West and Central Africa is closely linked to the region’s climatic patterns, particularly the variability of the West African monsoon. This dependence is further influenced by major oceanic oscillations that significantly modulate climatic conditions over various temporal scales, as noted by [21]. Key oscillatory drivers include the North Atlantic Oscillation (NAO), the Atlantic Multidecadal Oscillation (AMO), the Indian Ocean Dipole (IOD), the Pacific Decadal Oscillation (PDO), and the El Niño–Southern Oscillation (ENSO). These phenomena affect regional rainfall patterns and are likely to influence critical factors such as sunshine hours and wind speeds, both of which are integral to the performance of solar photovoltaic (PV) systems and wind energy generation. For example, recent studies have highlighted the AMO’s significant impact on sunshine variability [22] and its implications for PV yields in West Africa. Understanding the interplay between these oscillations and renewable energy resources is crucial for improving energy planning and resilience in the region. Incorporating these findings into energy resource assessments would enhance the precision of predictions and the reliability of renewable energy development strategies.
Additionally, climate change is likely to have an impact on solar and wind power generation. For instance, a general decrease in PVP for both the West and Central Africa regions is projected under RCP8.5 (up to 2%), more pronounced in the mid-century (2041–2060) than the near-century (2021–2040) relative to 1995–2014 [23], and strongest at the end of the century [24]. This significant decrease in solar PVP_CFR is also projected in the future (2041–2100) compared to 1981–2014 during the boreal winter (Dec–Jan–Feb) under SSP5-8.5, with up to a 10% decrease in Africa, particularly in the West and Central regions (Nigeria, Cameroon, Republic of Congo, and the Democratic Republic of the Congo) [25]. The PVP_CFR over West Africa is expected to decline in the future, with the magnitude of the decline increasing with warming levels [23]. Moreover, a multi-model analysis revealed a decrease in solar PVP_CFR throughout West Africa in the twenty-first century, with an ensemble mean reduction of about 12% in the region’s southern parts, driven by a decrease in surface irradiance and an increase in near-surface air temperature [26].
The assessment of wind power potential (at a standard height of 80 m) reveals that only the Sahelian band of West and Central Africa is suitable for wind energy development [27]. For 1.5 °C or higher global warming, the model ensemble mean of eleven models from the Coordinated Regional Climate Downscaling Experiment (CORDEX) noted that the strongest wind power density is found in the Western Sahel zone, particularly around Dakar [28]. However, not all viable sites are appropriate for wind power generation. The projected change in wind power density was found to increase with monsoon wind speed, but the magnitude of the increase is insufficient to make West Africa viable for wind power generation in a warmer climate. Both RCPs (2.6 and 8.5) project an increase in wind power density in both West and Central Africa in 2021–2040 and the mid-century (2041–2060), with a maximum increase of 20% [23]. There is still a lack of CMIP6 use for this type of study.
The CMIP6 climate models, a cornerstone of the IPCC AR6 report, have been widely critiqued for significantly overestimating equilibrium climate sensitivity (ECS), largely due to exaggerated cloud feedback mechanisms [29,30,31]. These inflated ECS values fail to align with observational data and historical temperature trends, calling into question the reliability of CMIP6 projections for future climate scenarios [32]. Moreover, the models inadequately represent aerosol–cloud interactions, neglecting critical cooling effects, which leads to inconsistencies in reproducing observed historical temperature patterns [33]. Such inaccuracies undermine the credibility of CMIP6 models for determining critical policy-relevant metrics, including carbon budgets and net-zero emission targets [33,34]. Addressing these deficiencies requires significant advancements in modeling cloud processes and achieving closer alignment with empirical data to ensure they are robust and actionable.
Previous studies using CMIP6 data have been neither downscaled nor bias-corrected at scales relevant to national policymakers and energy planners to address these biases. This means that global projections cannot be used directly for impact studies on a national/local scale, due to two main problems: (i) they are biased about observations, and (ii) their spatial scale is too coarse for certain applications. Therefore, downscaling and bias adjustment are needed to use CMIP6 models for impact studies. Moreover, understanding how seasonal changes in climate variables may affect the potential of solar and wind energy is of great importance for resource planning. Furthermore, there is a lack of information on how change in these energy resources could progress in the (near and far) future at the country and sub-country levels in West and Central Africa.
This study aims to assess the change in climate variables that control the potential solar and wind energy resources in the West and Central African regions using statistical approaches applied to an ensemble of 10 climate models at the country (ADM0, country boundaries) and sub-country (ADM1, a primary administrative division of a country) levels. It also makes the data available via a visual interface, the Teal tool (https://wca.tealtool.earth), which allows one to select variables and areas and displays time series. This paper is structured as follows: The data and methodology used are described in Section 2, and the results are presented in Section 3. An overall discussion is presented in Section 4, followed by the conclusions in Section 5 with a summary of the key findings and some perspectives.
2. Data and Methodology
2.1. Study Area
West Africa is Africa’s westernmost region and is composed of 15 countries, namely, Benin (BJ), Burkina Faso (BF), Cape Verde (CV), The Gambia (GM), Ghana (GH), Guinea (GN), Guinea-Bissau (GW), Ivory Coast (CI), Liberia (LR), Mali (ML), Mauritania (MR), Niger (NE), Nigeria (NG), Senegal (SN), Sierra Leone (SL), and Togo (TG) (see Figure 1). It is the most rapidly growing region on the African continent, both demographically and economically. West Africa’s population was estimated to be around 381,981,000 in 2017 and 419 million in 2021.
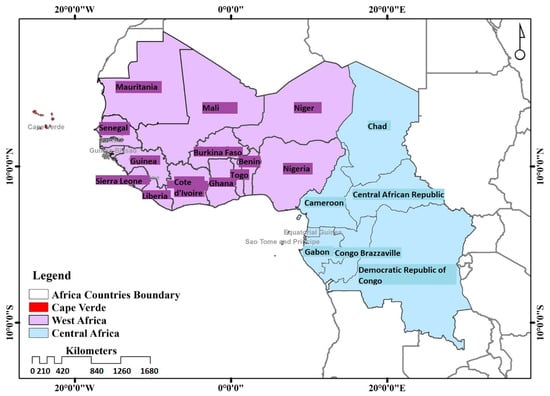
Figure 1.
West and Central Africa region locations.
Central Africa comprises the southern Sahara, the eastern West African Shield, and the western Great Rift Valley. Countries in this region are located generally around the equator. These countries are Cameroon (CM), the Central African Republic (CF), Chad (TD), the Democratic Republic of the Congo (CD), the Republic of the Congo (CG), Equatorial Guinea (GQ), Gabon (GA), and São Tomé and Príncipe (ST) (see Figure 1). Central Africa’s population was estimated to be around 163,495,000 in 2017 and 191 million in 2021.
The West and Central Africa regions have the lowest electricity access among Africa’s sub-regions, with access rates of 47% and 30%, respectively [2]. In West Africa, electricity is mainly generated by fossil fuels, with natural gas accounting for a large share in Nigeria, Benin, Côte d’Ivoire, Ghana, Senegal, and Guinea. As shown by [7], electricity demand is growing rapidly in the region. It is expected to continuously grow in the next decades, with a 4 to 6% annual rate [4]. To compensate for this gap, renewable energy deployment has recently increased, especially in West and Central regions, with renewable-based generation capacity on the continent increasing by 7% over the last decade (2010–2020), with solar energy the most significant addition [4].
In Central Africa, electricity is mainly generated with hydropower, which accounts for nearly two-thirds of the region’s power generation capacity. Fossil fuels are currently the main supplement to hydropower, with oil-fired power generation accounting for more than half of the electricity supply in the Central African Republic and Chad, and up to 95% in São Tomé and Príncipe.
2.2. Data
Ten models of Phase 6 of the Coupled Models Inter-comparison Project (CMIP6, see Table 1) were firstly downscaled to 0.25° × 0.25° using bilinear interpolation and secondly adjusted using the cumulative distribution function transform (CDFt) method, taking the ERA5 reanalysis as a reference. The CDFt method was developed by [35] to adjust for the biases in distributions of simulated climate variables typically obtained from climate experiments. This approach is successful applied for WAF for impacts studies [36]. In practical terms, a correction function is calibrated from the bias between the statistical distributions of the climate variable estimated in climate simulations and in observations for the same period. This correction function, assumed to be stationary in time, is used to correct outputs of the model for future periods. CDFt is often used in a downscaling mode when the climate variable is at larger spatial scale than the target one.
In this study, three ‘Shared Socioeconomic Pathways’ (SSPs) scenarios, namely, the lowest (SSP1-2.6), the intermediate (SSP2-4.5), and the highest (SSP5-8.5) [37], were used. SSP1-2.6 refers to a pathway staying below 2 °C of warming with zero net emissions in the second half of the century. The SSP2-4.5 scenario is roughly at the upper limit of the combined commitments made under the Paris Agreement. This scenario deviates slightly from a baseline scenario with no climate policy additions, resulting in a best-estimated warming of about 2.7 °C by the end of the twenty-first century. Lastly, SSP5-8.5 is a high reference scenario with no additional climate policy and high emissions associated with socio-economic development driven by the use of fossil fuels. For all the simulations, the historical run covers the period 1950–2014, while the projections are analyzed from 2015 to 2099.
The bias-adjusted climate variables, namely, wind speed (WS) at 10 m, solar radiation (GHI), and surface temperature (TA), were used to compute the wind capacity factor and solar density at the country (ADM0) and sub-country (ADM1) administrative levels. The analysis of the results was mainly done on the ensemble mean of 10 models, and the difference between the models is discussed where appropriate. The method applied to compute the wind and solar power potential is presented in the following sub-section.

Table 1.
CMIP6 model descriptions.
Table 1.
CMIP6 model descriptions.
| Institute/Country | Model | Reference | Horizontal Resolution |
|---|---|---|---|
| Alfred Wegener Institute Climate Mode (AWI-CM) | AWI-CM-1-1-MR | [38] | 0.937° × 0.934° |
| Chinese Academy of Meteorological Sciences (CAMS) | CAMS-CSM1-0 | [39] | 1.125° × 1.121° |
| Community Earth system model version 2—the whole atmosphere community climate model (CESM2-WACCM) | CESM2-WACCM | [40] | 1.25° × 0.942° |
| Euro-Mediterranean Centre on Climate Change coupled climate model (CMCC-CM2) | CMCC-CM2-SR5 | [41] | 1.250° × 0.942° |
| EC-Earth consortium | EC-Earth3-Veg | [42] | 0.703° × 0.701° |
| Chinese Academy of Sciences (CAS) Flexible Global Ocean–Atmosphere–Land System (FGOALS-f3-L) | FGOALS-f3-L | [43] | 1.250° × 1° |
| First Institute of Oceanography (FIO), China | FIO-ESM-2-0 | [44] | 1.250° × 0.942° |
| Meteorological Research Institute Earth System Model (MRI-ESM), Japan | MRI-ESM2-0 | [45] | 1.125° × 1.121° |
| Norwegian Earth System Model (NorESM) | NorESM2-MM | [46] | 1.250° × 0.942° |
| Taiwan Earth System Model | TaiESM1 | [47] | 1.250° × 0.942° |
2.3. Methodology
2.3.1. Solar Energy Potential
The solar energy potential was estimated using the aggregated temperature, wind speed, and solar radiation at ADM0 and ADM1 levels. Photovoltaic power output at a grid point is determined by two factors, namely, its PVP_CFR and installed capacity. The PVP_CFR, or capacity factor, is a dimensionless magnitude that accounts for the performance of PV cells relative to their nominal power capacity under actual ambient conditions [48]. The instantaneous PV production is obtained by multiplying PVP_CFR by the nominal installed Watts of the PV power capacity.
PVP_CFR is primarily a function of the amount of solar resources (GHI), but it is also worth considering other climatic variables that may affect the efficiency of PV cells. The PVP_CFR is given in (Equation (1)) as follows:
where GHI(t) refers to the solar radiation at a given time t, GHISTC = 1000 W·m−2 is the radiation under standard test conditions in which the nominal capacity of a PV device is determined as its measured power output, and Pr(t) is the performance ratio formulated to account for changes in the PV cells’ efficiency due to changes in their temperature, as in (Equation (2)):
where TSTC = 25 °C and δ = −0.005 °C−1 (for monocrystalline silicon solar panels). Tcell is given as follows (Equation (3)):
where C1 = 4.3 °C, C2 = 0.943, C3 = 0.028 °C·m2.W−1, and C4 = −1.528 °Csm−1. Tas, GHI, and WS stand for the temperature, solar radiation, and wind speed.
By substituting Equations (2) and (3) into Equation (1), the PVP_CFR can be computed for a given time as follows (Equation (4)):
where α1 = 1.1035 × 10⁻³, α2 = −1.4 × 10⁻⁷, α3 = 4.715 × 10⁻⁶, α4 = 7.64 × 10⁻⁶, and PVP_CFR(t) is the instantaneous solar power energy potential.
2.3.2. Wind Energy Potential
The adjusted wind speed data at 10 m are aggregated at ADM0 and ADM1 levels and then extrapolated to the 100 m level using Equation (5) [49]:
where vr and zr are, respectively, the wind speed and height at the initial stage. In our case, vr refers to the wind speed at the 10 m level and zr a height of 10 m, while zd is 100 m.
The wind power is computed using the wind speed at 100 m and the turbine’s power curve (Figure 2) for each country and sub-country [50]. Indeed, an onshore turbine (Vestas V135/3450 with rated power 3.45 MW) was selected. A model is built using the spline (smooth) function based on the wind power curve for a turbine hub (power function of wind speed). This model is used to compute the potential wind power. It is worth noting that smoothing splines are an effective method for estimating functional relationships between predictor X and response Y. Finally, the capacity factor is computed (Equation (6)):
where Pmax is the maximum power output of the wind turbine (3.45 MW for an onshore turbine).
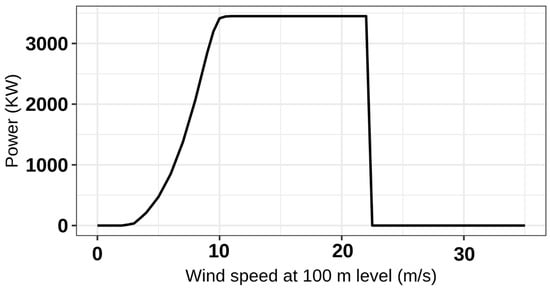
Figure 2.
A standard wind power curve for a turbine hub at 100 m height.
3. Results
3.1. Evaluation of Downscaled and Adjusted Data
All 10 models presented above were downscaled and bias-adjusted, and their ensemble mean was computed and analyzed. The performance of the applied adjustment method was then assessed through metrics score computations, namely, the bias and Pearson correlation. These scores of the ensemble mean (EnsM) compared to ERA5 are presented over West Africa and Central Africa, respectively, in Figure 3 and Figure 4. An underestimation is noted for the EnsM model raw data compared to ERA5 in most parts of WAF for all the variables, except over the coast for temperature (Figure A1a) and solar radiation (Figure A1c), and below 15° N latitude for wind speed (Figure A1b), where a positive bias is noted. The bias metric score is presented in the Appendix A (Figure A1 for West Africa and Figure A2 for Central Africa). The bias is ±0.5–15% and above for wind speed ±(0.1–3 m/s) and solar radiation ±(0.5–50 W/m2), while it is ±0.5–1.5% ± (0.1–1 °C) for temperature for WAF. Underestimation is also noted over the CAF land area in the same range, except on the coastline for a temperature around ±0.1–1 °C (Figure A2a) and between the 10° N to 10° S band for wind speed (±0.1–3 m/s, Figure A2b). The applied method effectively reduced and/or removed these biases for both regions to less than ±0.1 °C (Figure A1d and Figure A2d) for temperature and 0.5–3 W/m2 (Figure A1f and Figure A2f) for solar radiation and wind speed (<0.1 m/s) (Figure A1e and Figure A2e).
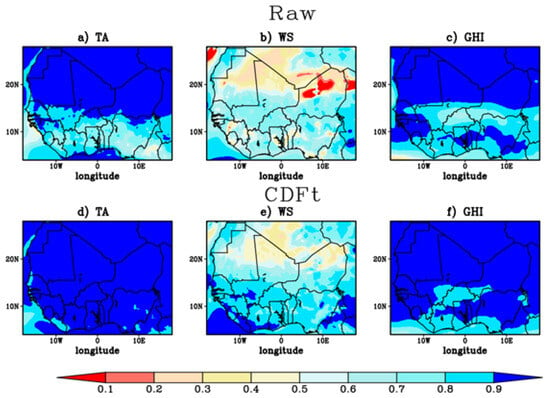
Figure 3.
Metric scores between the CMIP6 ensemble mean (EnsM) and ERA5 (1979–2014) for the WAF region. (a–c) and (d–f) present the Pearson correlations for the raw data and adjusted data, respectively, compared to ERA5.
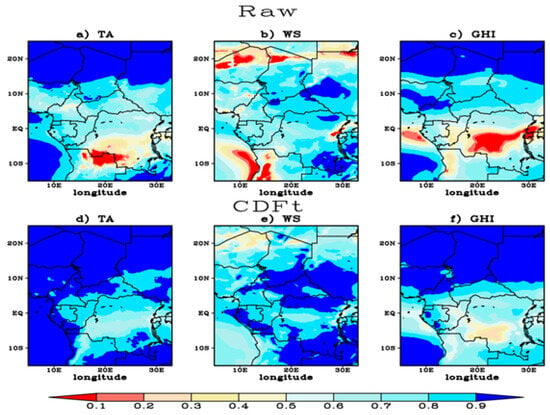
Figure 4.
Same as Figure 3, but for the CAF region.
3.2. Projected Change in Climate Variables
The summary of adjusted data at the country level for the three climate variables of the ensemble mean (EnsM) is presented in Figure 5 for the historical run (1985–2014, reference period) and projection scenarios for both the near (2040–2069) and far (2070–2099) futures. The analysis of the results shows that the GHI will be lower in the future and that this decrease will be greater under a higher greenhouse gas emission scenario, compared to the reference period for all the selected countries for both futures. This means that the median values of GHI will be lower under SSP5-8.5 than SSP2-4.5 and lower under SSP2-4.5 than SSP1-2.6. The decrease will be greater in the far future than in the near future. However, considering the median, the TA will be higher in the projections (both futures) than in the reference period, but it will increase in high-emission pathways and the far future. These results for the GHI and TA show the same variation for all countries (ADM0) and sub-countries (ADM1). Nevertheless, the WS does not show agreement when comparing projection scenarios to the historical period (considering the median). The outcomes vary according to the country (ADM0) and sub-country (ADM1). The WS will be higher in both futures than in the reference period, especially along the coast of the Gulf of Guinea, from Benin to Guinea, including São Tomé and Príncipe (BJ, TG, GH, CI, LR, SL, GN, and ST), and it will be even higher with increasing emissions.
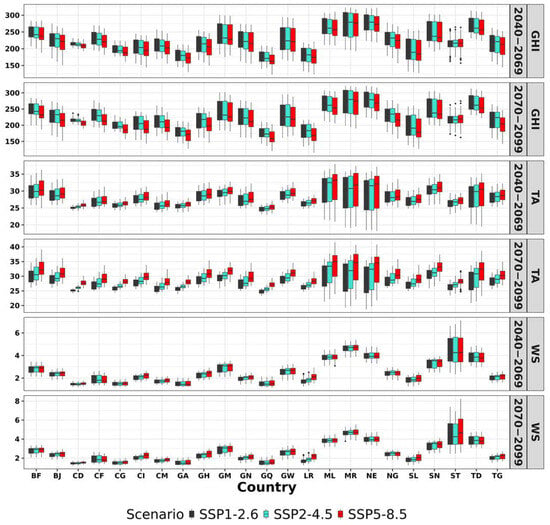
Figure 5.
Summary of climate variables at the monthly scale for the EnsM of WAF and CAF countries. GHI (W/m2), TA (°C), and WS (m/s) are, respectively, solar radiation, temperature, and wind speed. The historical run (HIST) is for 1985–2014, while the projections (SP1-2.6, SP2-4.5, and SP5-8.5) are for the near (2040–2069) and far (2070–2099) futures.
The changes were evaluated by comparing mean near-future (2040–2069) and far-future (2070–2099) projections to the reference period (1985–2014) at a monthly scale. The results reveal that the GHI is noted to decrease, while the TA will increase in both the near and far future compared to the reference period for all countries (ADM0) and sub-countries (ADM1) for all months. However, there is no agreement on the change in WS, because it varies according to the country and the month. The magnitude of change depends on the geographical location of the country (either coastline or Sahelian bands). For instance, the greatest increase in temperature is noted to be in the countries near the equator, such as Equatorial Guinea (GQ), Gabon (GA), the Democratic Republic of the Congo (CD), and the Republic of the Congo (CG). The changes may be intensified in the far future as compared to the near future, especially for the TA. The GHI (TA) will decrease (increase) with increasing emissions.
At seasonal (see Figure 6) and annual (Figure 7) scales, the analysis reveals that the GHI will decrease (~15 W/m2) while the TA will increase (0.5–2.7 °C for the near and 0.7–5.2 °C for the far future) in both the near and far future compared to the reference period for all countries (ADM0) and sub-countries (ADM1) for almost all seasons. However, there is no agreement on the changes in WS (−0.2 to 0.4 m/s in the near and 0.3 to 0.8 m/s in the far future), because they vary according to the country and season (see Figure 6). Nevertheless, the countries along the Gulf of Guinea, from Guinea to Benin, are noted to present an increase in WS, with the highest changes occurring in Liberia (LR) and Sierra Leone (SL). Some countries of the western Sahelian band (Mauritania, Mali, and Niger) in WAF and ST in CAF also show an increased change in WS in both the near and far future, but with a lower magnitude compared to the countries of the coastline of the Gulf of Guinea (Figure 7). Indeed, the magnitude of change depends on the geographical location of the country (either coastline or Sahelian bands). For once, the greatest increase in temperature is noted to be in the Sahelian band countries such as Mauritania (MR), Mali (ML), and Niger (NE) (from 1.5 to 5.2 °C for both futures; see Figure 7). The changes may be intensified in the far future depending on the scenario in the near future, especially changes in TA.
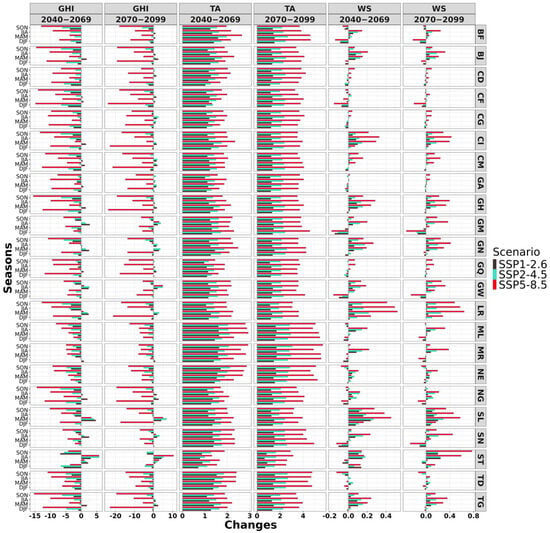
Figure 6.
Changes in climate variables over the projection periods 2040–2069 and 2070–2099 relative to the reference period 1985–2014 at a seasonal scale. GHI (W/m2), TA (°C), and WS (m/s) are, respectively, solar radiation, temperature, and wind speed.
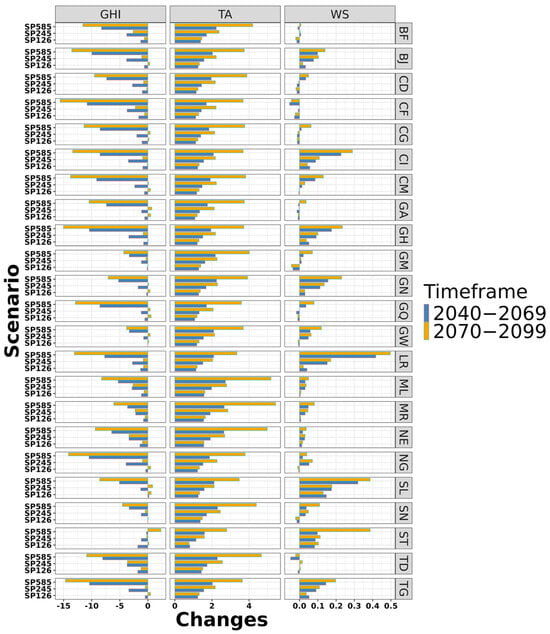
Figure 7.
Same as Figure 6, but at an annual scale. GHI (W/m2), TA (°C), and WS (m/s) are, respectively, solar radiation, temperature, and wind speed.
3.3. Simulated Power
The simulated solar power density (SPV_CFR) and onshore wind power capacity factor (WON_CFR) for each country, based on the EnsM model for both near and far futures as well as the reference period, are summarized in Figure 8. The SPV_CFR is noted to be lower under the projection scenarios (2040–2069 and 2070–2099) than in the reference period (1985–2014) but decreases with increasing emissions. By considering the median values, the Sahelian countries such as Mauritania (MR), Mali (ML), Niger (NE), and Chad (TD) are noted to have high SPV_CFR. However, WON_CFR is greater under the 2040–2069 and 2070–2099 projections than in the historical run, further increasing with a higher-emission scenario. The countries with the greatest wind resources, namely, (the Sahelian band) MR, ML, NE, TD, and (island) ST, show the greatest WON_CFR.
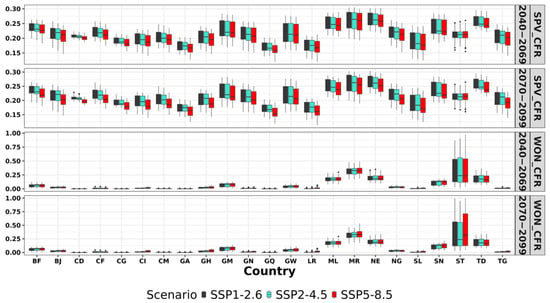
Figure 8.
Same as Figure 5, but for the solar power density (SPV_CFR in W/m2) and onshore wind power capacity factor (WON_CFR, unitless).
The changes (%) in WON_CFR and SPV_CFR were evaluated by comparing mean near-future (2040–2069) and far-future (2070–2099) projections to the reference period (1985–2014) at the seasonal scale (see Figure 9). The results reveal that WON_CFR will increase in all seasons (see Figure 9) and all months in both future periods relative to the reference period for all countries (ADM0) and sub-countries (ADM1). This change is noted to be greater in the far future than in the near future, and to intensify with increasing emission scenarios. The change in solar potential (SPV_CFR) is in contrast to that in WON_CFR for all countries (ADM0) and sub-countries (ADM1). The SPV_CFR will decrease in both the near and far future with increasing emissions.
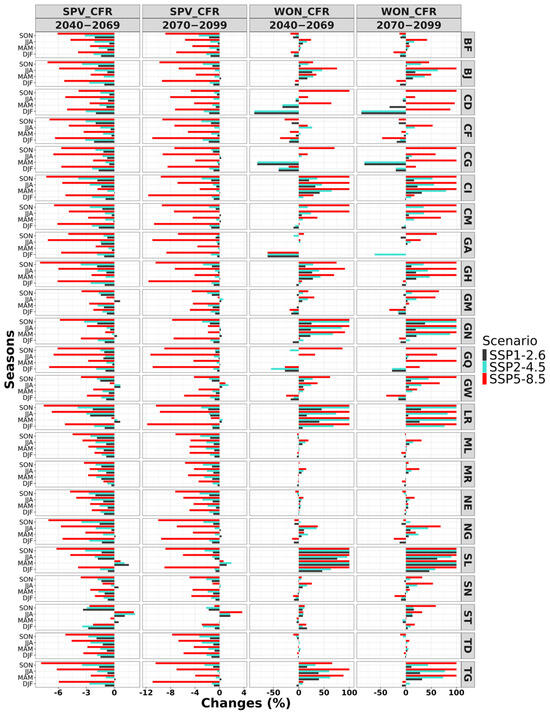
Figure 9.
Changes in energy potential over the projection periods 2040–2069 and 2070–2099 relative to the reference period 1985–2014 at the seasonal scale. WON_CFR and SPV_CFR are, respectively, the onshore wind capacity factor and the solar power density potential.
The changes in WON_CFR and SPV_CRF at the annual scale for the near and future relative to the reference period are presented in Figure 10. The WON_CRF (SPV_CRF) will increase (decrease) in both scenarios relative to the reference period for all countries (ADM0) and sub-countries (ADM1). The change in WON_CFR (SPV_CFR) will increase (decrease) in magnitude with increasing emissions. The increase in WON_CFR will be greatest in coastal countries, particularly Liberia (LR), Sierra Leone (SL), and Côte d’Ivoire (CI), while SPV_CFR will decrease in all countries along the Gulf of Guinea coast, from Guinea (GN) to Cameroon (CM).
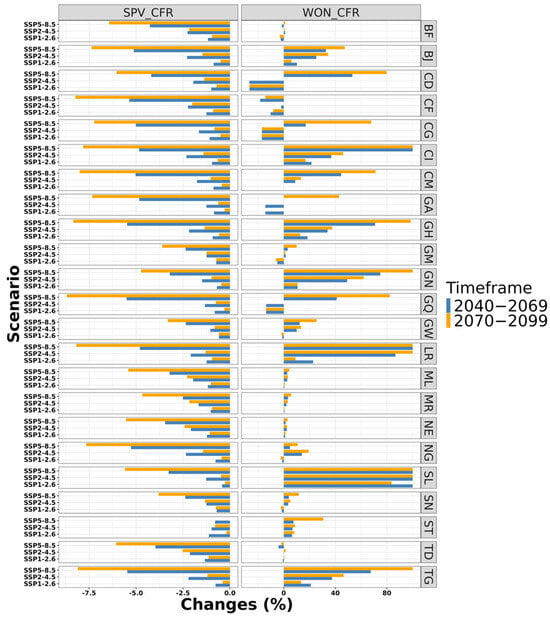
Figure 10.
Same as Figure 7, but for an annual time scale.
4. Discussion
The ability of 10 CMIP6 models to simulate the monthly temperature, wind speed, and solar radiation over WAF and CAF was assessed using the ensemble mean (EnsM) compared to ERA5. Our results show that there are biases for the considered variables. Indeed, CMIP6 climate models, while pivotal to climate projections, exhibit notable limitations, including an overestimation of equilibrium climate sensitivity due to exaggerated cloud feedback mechanisms, which diverge from historical temperature observations and empirical data. These models also inadequately capture aerosol–cloud interactions, omitting essential cooling effects and resulting in discrepancies when reproducing historical climate patterns. This resulted in these climate models being subject to bias and the need for them to be adjusted if they are to be used for impact studies [36,51,52]. In this study, to address these gaps, CMIP6 data were downscaled, bias-corrected, and combined into an ensemble mean for 10 models, enhancing their reliability and applicability for policy-relevant metrics and future climate scenario assessments. It was noted that the CMIP6 ensemble mean outperforms most individual models in accurately representing climate variables across the region [53].
The detected biases were adjusted using the CDFt approach after interpolation to the ERA5 spatial resolution. We found that the adjusted data bias was less than ±0.1% for temperature and ±0.5% for wind speed and solar radiation. The analysis of the adjusted data revealed that WAF and CAF will be warmer in the mid (2040–2069) and end (2070–2099) periods of the century relative to the reference period (1985–2014). The rise in temperature within the WAF domain is estimated to be higher than the global mean temperature increase under both 1.5 °C and 2 °C warming contexts, and the intensity could be greater in the drier regions of the Sahel, especially in the central Sahel and particularly in the eastern Sahel [17] areas, which may affect the solar energy potential in the region. Solar radiation will also decrease in the future. The magnitude of change in both temperature and solar radiation will increase with increasing greenhouse gas emissions. The wind speed will increase in coastal countries; however, there is no agreement with the emission scenario in the remaining countries. This projected change in climate variables may affect the wind and solar power potential of the region and this may vary across spatiotemporal scales.
The analysis revealed a decrease in the range of 1.5 to 8.75% in the projected solar power capacity factor, and that the magnitude of change will increase with emissions. This finding follows existing studies in West Africa, but the change magnitude depends on the climate experiment. For instance, ref. [26] using multi-model analysis (CMIP6), found a decrease in solar PV potential across WAF in the twenty-first century, with an ensemble mean reduction of about 12% in the region’s southern parts. The CORDEX simulation ensemble predicted a decrease in PV potential over West Africa in the future, with the magnitude increasing with warming levels. A general decrease in PVP_CFR is expected, which will be more pronounced in the mid-century future and under RCP8.5 (up to 2%) [23]. Even at a warming level of 3.0 °C, the maximum decrease in PVP projected over any country or zone in the WAF region was less than 3.8% [20]. Based on CORDEX-Africa high-resolution climate experiments, the annual mean solar potential is expected to decrease by 4% over most of the African continent by the end of the century, as a result of a decrease in solar radiation and an increase in air surface temperature [24].
Regarding the WON_CFR, it is noted that the countries of the Sahel, namely, Mauritania, Mali, Niger, Chad, Senegal, and São Tomé and Príncipe, show greater wind power potential. This is in agreement with previous studies which showed that the northern parts of Mauritania, Mali, Niger, and Chad will be more suitable for wind power [4,54]. For instance, it was noted that apart from the Sahelian band, which has marginal (200–300 W/m2) and fair (300–400 W/m2) wind power density, the remaining areas of WAF and CAF have poor wind power density (<200 W/m2) [54]. Moreover, CAF presents less wind power potential compared to other African regions [55]. However, the analysis also revealed that the change in wind speed potential could also be impacted by changes and variability in wind speed. Overall, WON_CFR is promised to increase, with the strongest change occurring in coastline countries which will experience the greatest change in wind speed, which is in agreement with the findings of [53]. The increase will be greater in the far future than in the near future and stronger with increasing emissions. This agrees with Sawadogo et al. [23,28], who showed that RCMs predict an increase in monsoon wind speed and wind power density over West African cities, with the magnitude increasing with global warming and a maximum increase of 20%.
The projected changes in wind power potential (WON_CFR) and solar power potential (SPV_CFR) across West and Central Africa demonstrate significant spatial and seasonal variations under different emission scenarios (SP1-2.6, SP2-4.5, SP5-8.5) for the near future (2040–2069) and far future (2070–2099) periods. The wind power potential shows notable increases in some countries, particularly in coastal and semi-arid regions; however, the projections are inconsistent across seasons and scenarios, reflecting substantial uncertainty and making long-term planning challenging. The solar power potential exhibits more consistent declines across most countries, especially under high-emission scenarios (SP5-8.5), with the reductions being more pronounced by the far future period. Seasonal variability further complicates renewable energy planning, as the impacts on energy potential differ between wet (JJA and SON) and dry (DJF and MAM) seasons. The disparities across countries/sub-countries and seasons underscore the need for region-specific, adaptive strategies to address the varying impacts on renewable energy resources.
5. Conclusions
The ensemble mean (EnsM) of ten climate models adjusted via the CDFt approach was used to assess the wind and solar power potential over West and Central African countries (ADM0) and sub-countries (ADM1). The solar power density potential (SPV_CFR) and wind power capacity factor potential (WON_CFR) were computed under changing climatic conditions using the statistical approach with these adjusted climate data as input. The key takeaway messages are summarized in the following points.
Projected change in temperature:
The analysis indicates significant warming across the region, countries, and sub-countries, with air surface temperatures projected to rise substantively during the end of the century (2015–2099) compared to the historical period (1950–2014). It is projected to increase in range from 0.5–2.7 °C in the near future (2040–2069) to 0.7–5.2 °C in the far future (2070–2099), depending on the scenario and the geographical location. This warming trend is evident across all countries and sub-regions, with the highest temperature increases anticipated in the far future.
Projected changes in solar radiation and estimated solar power potential:
The results highlighted that solar radiation is projected to decline under all scenarios, with reductions being more pronounced with increasing emissions and in the far future than in the near future. This decrease directly impacts solar power density potential (SPV_CFR), leading to a decline in solar energy output. Gulf of Guinea countries are expected to experience the most significant reductions in SPV_CFR, underscoring the need for adaptive strategies in solar energy deployment.
Projected wind speed and wind power capacity factor potential:
Positive changes in wind speed are projected for most countries and scenarios, which increases wind power capacity factor potential (WON_CFR). The far future shows the greatest improvements in WON_CFR, with Sahelian regions exhibiting the highest absolute values. However, Gulf of Guinea countries are expected to see the largest relative increases in WON_CFR, reinforcing the region’s potential for wind energy expansion.
Implications for a renewable energy strategy:
The contrasting trends in solar and wind energy potentials highlight the importance of adopting a mixed energy strategy. West and Central African countries will need to leverage both resources to optimize energy generation and mitigate the impacts of climate change on renewable energy infrastructure.
Data accessibility and the Teal-WCA platform:
To support stakeholders, this study provides bias-adjusted and downscaled climate data, including rainfall as well as the wind and solar capacity factor potentials, at country and sub-country levels. These data, alongside the study’s findings, are publicly available on the Teal-WCA platform (https://wca.tealtool.earth/). The platform addresses challenges associated with limited internet bandwidth in Africa, allowing users to download bias-adjusted data for specific regions or grid points, thereby facilitating localized climate impact assessments.
Future perspectives:
The Teal-WCA platform is a significant advancement in improving access to climate data for researchers, policymakers, and decision-makers. To further enhance its utility, the platform could be expanded to include high-resolution datasets for additional renewable energy resources such as hydropower, biomass energy, and green hydrogen. While the current dataset is available at a monthly temporal resolution, future studies could benefit from incorporating daily-resolution data to capture finer-scale variability.
This study focuses on projected climate models, but future efforts could explore the integration of real-time forecasting and nowcasting data to support near-term decision-making. Additionally, while this research provides climate information services tailored to the energy sector, future investigations could emphasize climate variables and indicators that impact water availability for both energy and agricultural sectors, ultimately addressing crop yield variability across spatial and temporal scales.
Special attention could also be directed towards assessing the impacts of climate hazards, including their compounding effects, on renewable energy potential and agricultural productivity. Such advancements would offer a more holistic resource for developing sustainable renewable energy plans implementing effective climate adaptation strategies and accelerating the achievement of sustainable development goals and the Africa Union Agenda 2063 across West and Central Africa.
Author Contributions
S.O.: data curation, conceptualization, formal analysis, methodology, writing—original draft. A.D.: conceptualization, data curation, formal analysis, methodology, writing—original draft, fund research. A.T. and P.B.: conceptualization, data curation, formal analysis, methodology, validation, writing—review & editing. S.A., L.C. and B.H.: writing—review & editing. T.A.F.A., W.F.F., D.K., C.M. and F.S.: fund research, writing—review & editing. All authors have read and agreed to the published version of the manuscript.
Funding
The research leading to this publication is co-funded by ACE-IMPACT/CEA CCBAD, by the IRD (Institut de Recherche pour le Développement; France) grant number “UMR IGE Imputation 252RA5”, and by the SUSTAINDAM project, co-funded by the Agence National de la Recherche (ANR, France; Contract n° 400914/00) implemented in the frame of the Belmont Forum collaborative actions on transdisciplinary research for pathways to sustainability.
Institutional Review Board Statement
Not applicable.
Informed Consent Statement
Not applicable.
Data Availability Statement
The datasets generated during and/or analyzed during the current study are available from the corresponding author on reasonable request and can also be accessed on https://wca.tealtool.earth/ (accessed on 11 September 2024).
Acknowledgments
The authors thank the Institute of Research for Development (IRD, France) and Institute of Geosciences for Environment (IGE, University Grenoble Alpes) for providing the facility (the Regional Climate Modelling Platform) to perform this study at the University Felix Houphouët Boigny (Abidjan, Côte d’Ivoire) and the IT support funded by the IRD/PRPT contract. This study was implemented at the national high performance-computing center of Côte d’Ivoire (Centre National de Calcul de Côte d’Ivoire, CNCCI). The support for the investigation with new multidisciplinary data was possible thanks to the Belmont Forum collaborative actions on transdisciplinary research for pathways to sustainability.
Conflicts of Interest
The authors declare no conflict of interest.
Appendix A
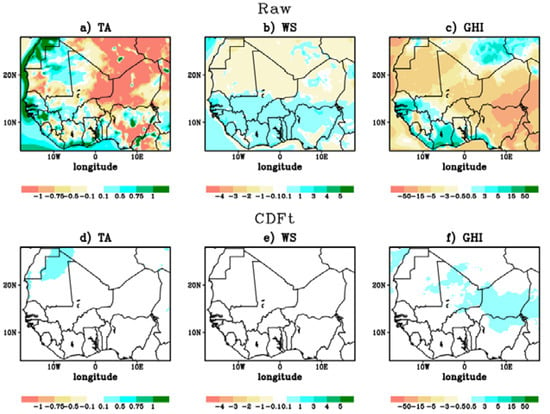
Figure A1.
Bias between the CMIP6 ensemble mean (EnsM) and ERA5 (1979–2014) for WAF. GHI (W/m2), TA (°C), and WS (m/s) are, respectively, solar radiation, temperature, and wind speed.
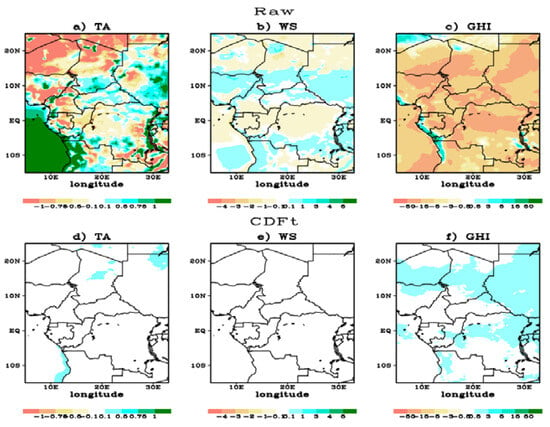
Figure A2.
Bias between the CMIP6 ensemble mean (EnsM) and ERA5 (1979–2014) for CAF. GHI (W/m2), TA (°C), and WS (m/s) are, respectively, solar radiation, temperature, and wind speed.
References
- Puig, D.; Moner-Girona, M.; Kammen, D.M.; Mulugetta, Y.; Marzouk, A.; Jarrett, M.; Hailu, Y.; Nakićenović, N. An action agenda for Africa’s electricity sector. Science 2021, 373, 616–619. [Google Scholar] [CrossRef] [PubMed]
- PwC. Africa Energy Review 2021; PwC: London, UK, 2021. [Google Scholar]
- Ritchie, H.; Roser, M.; Rosado, P. CO2 and Greenhouse Gas Emissions. Our World Data. 2020, pp. 2–6. Available online: https://ourworldindata.org/co2-and-greenhouse-gas-emissions (accessed on 11 September 2024).
- IRENA; AfDB. Renewable Energy Market Analysis: Africa and Its Regions; International Renewable Energy Agency: Abu Dhabi, United Arab Emirates; African Development Bank: Abidjan, Côte d’Ivoire, 2022. [Google Scholar]
- Amoah, A.; Kwablah, E.; Korle, K.; Offei, D. Renewable energy consumption in Africa: The role of economic well-being and economic freedom. Energy Sustain. Soc. 2020, 10, 32. [Google Scholar] [CrossRef]
- IEA. World Energy Outlook Special Report; IEA: Paris, France, 2022. [Google Scholar] [CrossRef]
- Kondi-Akara, G.; Hingray, B.; Francois, B.; Diedhiou, A. Recent trends in urban electricity consumption for cooling in West and Central African countries. Energy 2023, 276, 127597. [Google Scholar] [CrossRef]
- Ezeh, A.; Kissling, F.; Singer, P. Why sub-Saharan Africa might exceed its projected population size by 2100. Lancet 2020, 396, 1131–1133. [Google Scholar] [CrossRef]
- IPCC. Climate Change 2022: Mitigation of Climate Change. Contribution of Working Group III to the Sixth Assessment Report of the Intergovernmental Panel on Climate Change; Cambridge University Press: Cambridge, UK; New York, NY, USA, 2022. [Google Scholar]
- IPCC. Climate Change 2021 the Physical Science Basis Summary for Policymakers Working Group I Contribution to the Sixth Assessment Report of the Intergovernmental Panel on Climate Change; Cambridge University Press: Cambridge, UK; New York, NY, USA, 2021. [Google Scholar]
- Rim, B. Energies Renouvelables en Afrique: Enjeux, Défis et Opportunités; Policy Center for the New South: Rabat, Morocco, 2019. [Google Scholar]
- Obahoundje, S.; Diedhiou, A. Potential impacts of climate, land use and land cover changes on hydropower generation in West Africa: A review. Environ. Res. Lett. 2022, 17, 043005. [Google Scholar] [CrossRef]
- Obahoundje, S.; Diedhiou, A.; Kouassi, K.L.; Ta, M.Y.; Mortey, E.M.; Roudier, P.; Kouame, D.G.M. Analysis of hydroclimatic trends and variability and their impacts on hydropower generation in two river basins in Côte d’Ivoire (West Africa) during 1981–2017. Environ. Res. Commun. 2022, 4, 065001. [Google Scholar] [CrossRef]
- Obahoundje, S.; Diedhiou, A.; Dubus, L.; Alamou, E.A.; Amoussou, E.; Akpoti, K.; Ofosu, E.A. Modeling climate change impact on inflow and hydropower generation of Nangbeto dam in West Africa using multi-model CORDEX ensemble and ensemble machine learning. Appl. Energy 2022, 325, 119795. [Google Scholar] [CrossRef]
- Obahoundje, S.; Youan Ta, M.; Diedhiou, A.; Amoussou, E.; Kouadio, K. Sensitivity of Hydropower Generation to Changes in Climate and Land Use in the Mono Basin (West Africa) using CORDEX Dataset and WEAP Model. Environ. Process. 2021, 8, 1073–1097. [Google Scholar] [CrossRef]
- Obahoundje, S.; Amoussou, E.; Youan Ta, M.; Kouassi, L.K.; Diedhiou, A. Multiyear rainfall variability in the Mono river basin and its impacts on Nangbeto hydropower scheme. Proc. Int. Assoc. Hydrol. Sci. 2021, 384, 343–347. [Google Scholar] [CrossRef]
- Diedhiou, A.D.; Bichet, A.; Wartenburger, R.; I Seneviratne, S.; Rowell, D.P.; Sylla, M.B.; Diallo, I.; Todzo, S.; E Touré, N.; Camara, M.; et al. Changes in climate extremes over West and Central Africa at 1.5 °C and 2 °C global warming. Environ. Res. Lett. 2018, 13, 065020. [Google Scholar] [CrossRef]
- Obahoundje, S.; Hermann, V.; Bi, N.; Diedhiou, A.; Kravitz, B.; Moore, J.C. Influence of stratospheric aerosol geoengineering on temperature mean and precipitation extremes indices in Africa. Int. J. Clim. Chang. Strateg. Manag. 2022, 14, 399–423. [Google Scholar] [CrossRef]
- Obahoundje, S.; Nguessan-Bi, V.H.; Diedhiou, A.; Kravitz, B.; Moore, J.C. Implication of stratospheric aerosol geoengineering on compound precipitation and temperature extremes in Africa. Sci. Total. Environ. 2023, 863, 160806. [Google Scholar] [CrossRef] [PubMed]
- Sawadogo, W.; Abiodun, B.J.; Okogbue, E.C. Impacts of global warming on photovoltaic power generation over West Africa. Renew. Energy 2020, 151, 263–277. [Google Scholar] [CrossRef]
- Lüdecke, H.J.; Müller-Plath, G.; Wallace, M.G.; Lüning, S. Decadal and multidecadal natural variability of African rainfall. J. Hydrol. Reg. Stud. 2021, 34, 100795. [Google Scholar] [CrossRef]
- Lüdecke, H.J.; Müller-Plath, G.; Lüning, S. Central-European sunshine hours, relationship with the Atlantic Multidecadal Oscillation, and forecast. Sci. Rep. 2024, 14, 25152. [Google Scholar] [CrossRef]
- Sawadogo, W.; Reboita, M.S.; Faye, A.; da Rocha, R.P.; Odoulami, R.C.; Olusegun, C.F.; Adeniyi, M.O.; Abiodun, B.J.; Sylla, M.B.; Diallo, I.; et al. Current and future potential of solar and wind energy over Africa using the RegCM4 CORDEX-CORE ensemble. Clim. Dyn. 2021, 57, 1647–1672. [Google Scholar] [CrossRef]
- Bichet, A.; Hingray, B.; Evin, G.; Diedhiou, A.; Kebe, C.M.F.; Anquetin, S. Potential impact of climate change on solar resource in Africa for photovoltaic energy: Analyses from CORDEX-Africa climate experiments. Environ. Res. Lett. 2019, 14, 124039. [Google Scholar] [CrossRef]
- Dutta, R.; Chanda, K.; Maity, R. Future of solar energy potential in a changing climate across the world: A CMIP6 multi-model ensemble analysis. Renew. Energy 2022, 188, 819–829. [Google Scholar] [CrossRef]
- Danso, D.K.; Anquetin, S.; Diedhiou, A.; Lavaysse, C.; Hingray, B.; Raynaud, D.; Kobea, A.T. A CMIP6 assessment of the potential climate change impacts on solar photovoltaic energy and its atmospheric drivers in West Africa. Environ. Res. Lett. 2022, 17, 044016. [Google Scholar] [CrossRef]
- Mentis, D.; Hermann, S.; Howells, M.; Welsch, M.; Siyal, S.H. Assessing the technical wind energy potential in africa a GIS-based approach. Renew. Energy 2015, 83, 110–125. [Google Scholar] [CrossRef]
- Sawadogo, W.; Abiodun, B.J.; Okogbue, E.C. Projected changes in wind energy potential over West Africa under the global warming of 1.5 °C and above. Theor. Appl. Climatol. 2019, 138, 321–333. [Google Scholar] [CrossRef]
- Wang, C.; Soden, B.J.; Yang, W.; Vecchi, G.A. Compensation Between Cloud Feedback and Aerosol-Cloud Interaction in CMIP6 Models. Geophys. Res. Lett. 2021, 48, e2020GL091024. [Google Scholar] [CrossRef]
- Forster, P.M.; Maycock, A.C.; McKenna, C.M.; Smith, C.J. Latest climate models confirm need for urgent mitigation. Nat. Clim. Chang. 2020, 10, 7–10. [Google Scholar] [CrossRef]
- Scafetta, N. CMIP6 GCM ensemble members versus global surface temperatures. Clim. Dyn. 2022, 60, 3091–3120. [Google Scholar] [CrossRef]
- Voosen, P.U.N. Climate panel confronts implausibly hot forecasts of future warming. Science 2021, 373, 474–475. [Google Scholar] [CrossRef]
- Mülmenstädt, J.; Salzmann, M.; Kay, J.E.; Zelinka, M.D.; Ma, P.-L.; Nam, C.; Kretzschmar, J.; Hörnig, S.; Quaas, J. An underestimated negative cloud feedback from cloud lifetime changes. Nat. Clim. Chang. 2021, 11, 508–513. [Google Scholar] [CrossRef]
- Scafetta, N. CMIP6 GCM Validation Based on ECS and TCR Ranking for 21st Century Temperature Projections and Risk Assessment. Atmosphere 2023, 14, 345. [Google Scholar] [CrossRef]
- Michelangeli, P.A.; Vrac, M.; Loukos, H. Probabilistic downscaling approaches: Application to wind cumulative distribution functions. Geophys. Res. Lett. 2009, 36, 2–7. [Google Scholar] [CrossRef]
- Famien, A.M.; Janicot, S.; Ochou, A.D.; Vrac, M.; Defrance, D.; Sultan, B.; Noël, T. A bias-corrected CMIP5 dataset for Africa using the CDF-t method—A contribution to agricultural impact studies. Earth Syst. Dyn. 2018, 9, 313–338. [Google Scholar] [CrossRef]
- Riahi, K.; Van Vuuren, D.P.; Kriegler, E.; Edmonds, J.; O’Neill, B.C.; Fujimori, S.; Bauer, N.; Calvin, K.; Dellink, R.; Fricko, O.; et al. The Shared Socioeconomic Pathways and their energy, land use, and greenhouse gas emissions implications: An overview. Glob. Environ. Chang. 2017, 42, 153–168. [Google Scholar] [CrossRef]
- Semmler, T.; Danilov, S.; Gierz, P.; Goessling, H.F.; Hegewald, J.; Hinrichs, C.; Koldunov, N.; Khosravi, N.; Mu, L.; Rackow, T.; et al. Simulations for CMIP6 with the AWI Climate Model AWI-CM-1-1. J. Adv. Model. Earth Syst. 2020, 12, e2019MS002009. [Google Scholar] [CrossRef]
- Rong, X. CAMS CAMS-CSM1.0 Model Output Prepared for CMIP6 ScenarioMIP. Version YYYYMMDD.Earth System Grid Federation. 2019. Available online: https://www.wdc-climate.de/ui/cmip6?input=CMIP6.ScenarioMIP.CAMS.CAMS-CSM1-0 (accessed on 11 September 2024). [CrossRef]
- Liu, S.-M.; Chen, Y.-H.; Rao, J.; Cao, C.; Li, S.-Y.; Ma, M.-H.; Wang, Y.-B. Parallel comparison of major sudden stratospheric warming events in CESM1-WACCM and CESM2-WACCM. Atmosphere 2019, 10, 679. [Google Scholar] [CrossRef]
- Lovato, T.; Peano, D.; Butenschön, M.; Materia, S.; Iovino, D.; Scoccimarro, E.; Fogli, P.G.; Cherchi, A.; Bellucci, A.; Gualdi, S.; et al. CMIP6 Simulations with the CMCC Earth System Model (CMCC-ESM2). J. Adv. Model. Earth Syst. 2022, 14, e2021MS002814. [Google Scholar] [CrossRef]
- Döscher, R.; Acosta, M.; Alessandri, A.; Anthoni, P.; Arsouze, T.; Bergmann, T.; Bernardello, R.; Boussetta, S.; Caron, L.-P.; Carver, G.; et al. The EC-Earth3 Earth System Model for the Climate Model Intercomparison Project 6. Geosci. Model Dev. Discuss. 2022, 15, 2973–3020. [Google Scholar] [CrossRef]
- Guo, Y.; Yu, Y.; Lin, P.; Liu, H.; He, B.; Bao, Q.; Zhao, S.; Wang, X. Overview of the CMIP6 Historical Experiment Datasets with the Climate System Model CAS FGOALS-f3-L. Adv. Atmos. Sci. 2020, 37, 1057–1066. [Google Scholar] [CrossRef]
- Song, Z.; Qiao, F.; Bao, Y.; Shu, Q.; Song, Y.; Yang, X. FIO-QLNM FIO-ESM2.0 model output prepared for CMIP6 CMIP historical. Version YYYYMMDD. Earth Syst. Grid. Fed. 2019, 6, 4–7. [Google Scholar] [CrossRef]
- Yukimoto, S.; Kawai, H.; Koshiro, T.; Oshima, N.; Yoshida, K.; Urakawa, S.; Tsujino, H.; Deushi, M.; Tanaka, T.; Hosaka, M.; et al. The meteorological research institute Earth system model version 2.0, MRI-ESM2.0: Description and basic evaluation of the physical component. J. Meteorol. Soc. 2019, 97, 931–965. [Google Scholar] [CrossRef]
- Seland, Ø.; Bentsen, M.; Olivié, D.; Toniazzo, T.; Gjermundsen, A.; Graff, L.S.; Debernard, J.B.; Gupta, A.K.; He, Y.-C.; Kirkevåg, A.; et al. Overview of the Norwegian Earth System Model (NorESM2) and key climate response of CMIP6 DECK, historical, and scenario simulations. Geosci. Model Dev. 2020, 13, 6165–6200. [Google Scholar] [CrossRef]
- Lee, W.-L.; Liang, H.-C. AS-RCEC TaiESM1.0 model output prepared for CMIP6 CMIP 1pctCO2. Earth Syst. Grid. Fed. 2020, 6, 4–7. [Google Scholar] [CrossRef]
- Jerez, S.; Tobin, I.; Vautard, R.; Montávez, J.P.; López-Romero, J.M.; Thais, F.; Bartok, B.; Christensen, O.B.; Colette, A.; Déqué, M.; et al. The impact of climate change on photovoltaic power generation in Europe. Nat. Commun. 2015, 6, 10014. [Google Scholar] [CrossRef]
- Gualtieri, G.; Secci, S. Methods to extrapolate wind resource to the turbine hub height based on power law: A 1-h wind speed vs. Weibull distribution extrapolation comparison. Renew. Energy 2012, 43, 183–200. [Google Scholar] [CrossRef]
- Dubus, L.; Saint-Drenan, Y.-M.; Troccoli, A.; De Felice, M.; Moreau, Y.; Ho-Tran, L.; Goodess, C.; Amaro e Silva, R.; Sanger, L. C3S Energy: A climate service for the provision of power supply and demand indicators for Europe based on the ERA5 reanalysis and ENTSO-E data. Meteorol. Appl. 2023, 30, e2145. [Google Scholar] [CrossRef]
- Ivanov, M.A.; Luterbacher, J.; Kotlarski, S. Climate model biases and modification of the climate change signal by intensity-dependent bias correction. J. Clim. 2018, 31, 6591–6610. [Google Scholar] [CrossRef]
- Vaittinada Ayar, P.; Vrac, M.; Mailhot, A. Ensemble bias correction of climate simulations: Preserving internal variability. Sci. Rep. 2021, 11, 3098. [Google Scholar] [CrossRef]
- Akinsanola, A.A.; Ogunjobi, K.O.; Abolude, A.T.; Salack, S. Projected changes in wind speed and wind energy potential over West Africa in CMIP6 models. Environ. Res. Lett. 2021, 16, 044033. [Google Scholar] [CrossRef]
- Bandoc, G.; Prăvălie, R.; Patriche, C.; Degeratu, M. Spatial assessment of wind power potential at global scale. A geographical approach. J. Clean. Prod. 2018, 200, 1065–1086. [Google Scholar] [CrossRef]
- Fant, C. WIDER Working Paper 2016/125 Wind Turbine and Photovoltaic Generating Efficiency in Africa; United Nations University: Tokyo, Japan; World Institute for Development Economics Research: Helsinki, Finland, 2016. [Google Scholar] [CrossRef]
Disclaimer/Publisher’s Note: The statements, opinions and data contained in all publications are solely those of the individual author(s) and contributor(s) and not of MDPI and/or the editor(s). MDPI and/or the editor(s) disclaim responsibility for any injury to people or property resulting from any ideas, methods, instructions or products referred to in the content. |
© 2024 by the authors. Licensee MDPI, Basel, Switzerland. This article is an open access article distributed under the terms and conditions of the Creative Commons Attribution (CC BY) license (https://creativecommons.org/licenses/by/4.0/).