
A Dataset of Scalp EEG Recordings of Alzheimer’s Disease, Frontotemporal Dementia and Healthy Subjects from Routine EEG

 ,
,  ,
,  ,
,  , ,
, , 
 ,
,  , ,
, ,  and
and 
Abstract
1. Summary
2. Data Description
2.1. EEG Recordings
2.2. Participants
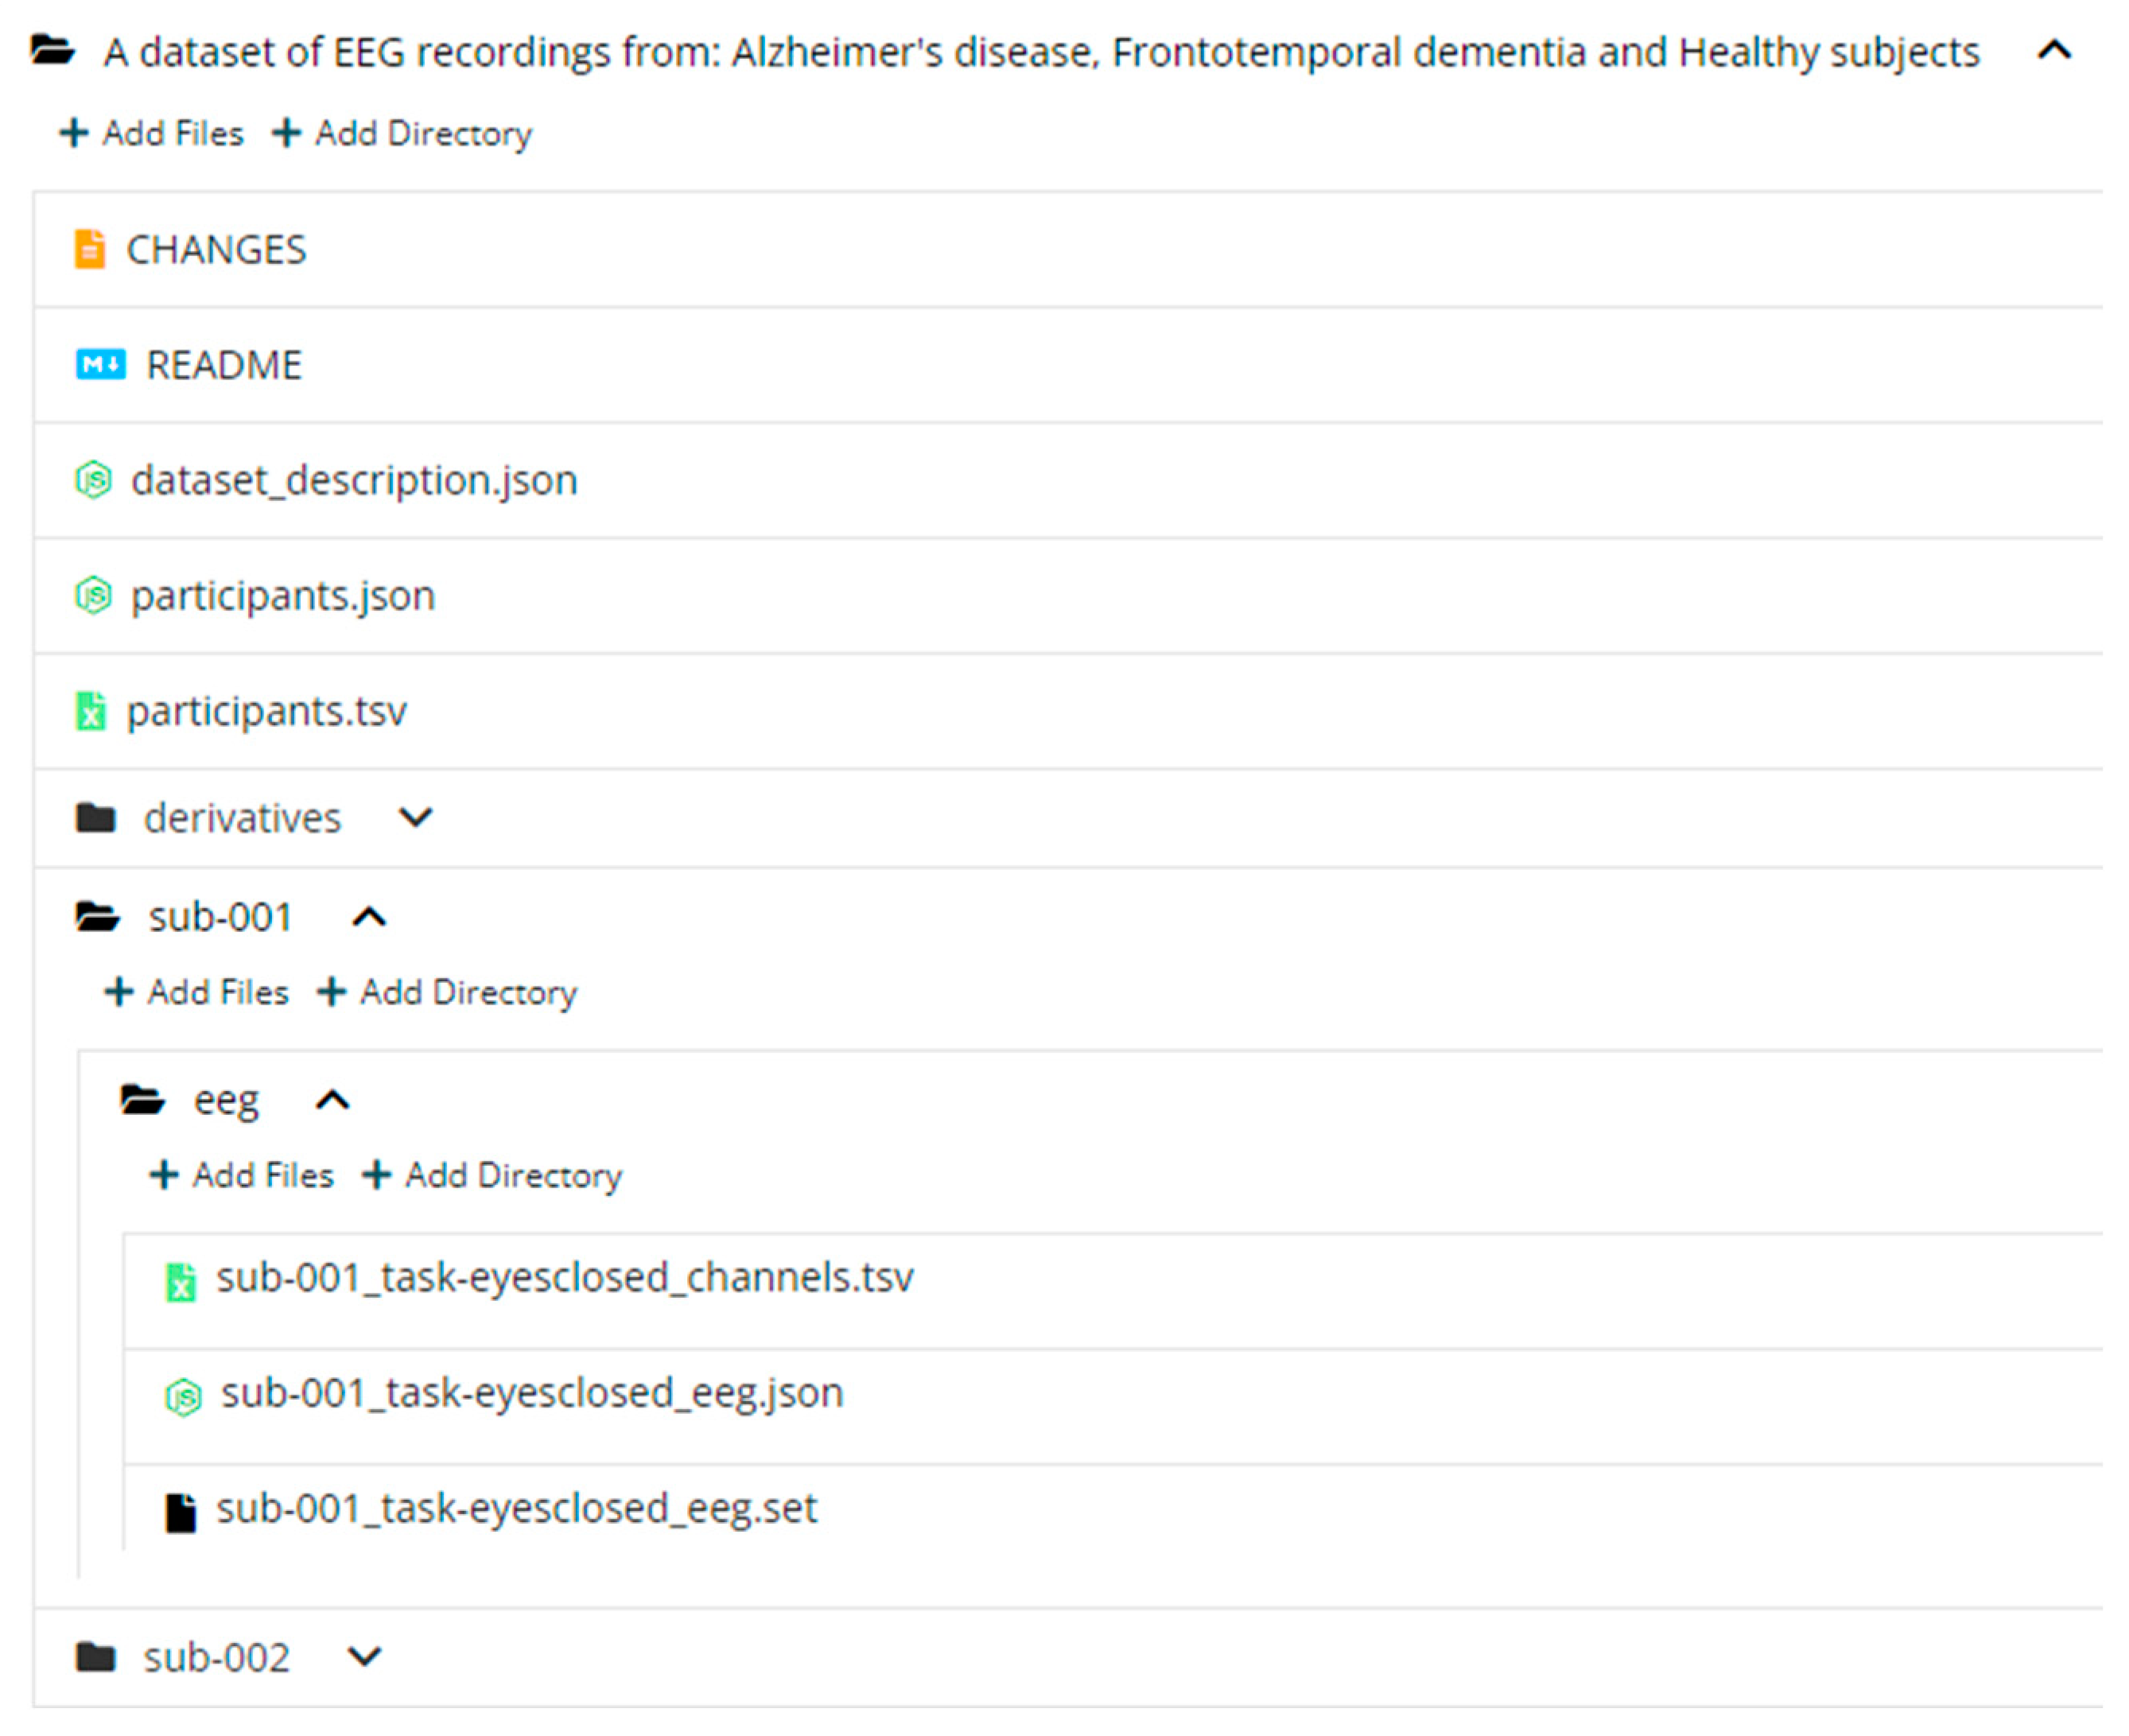
2.3. Dataset Structure
3. Methods
3.1. Recording
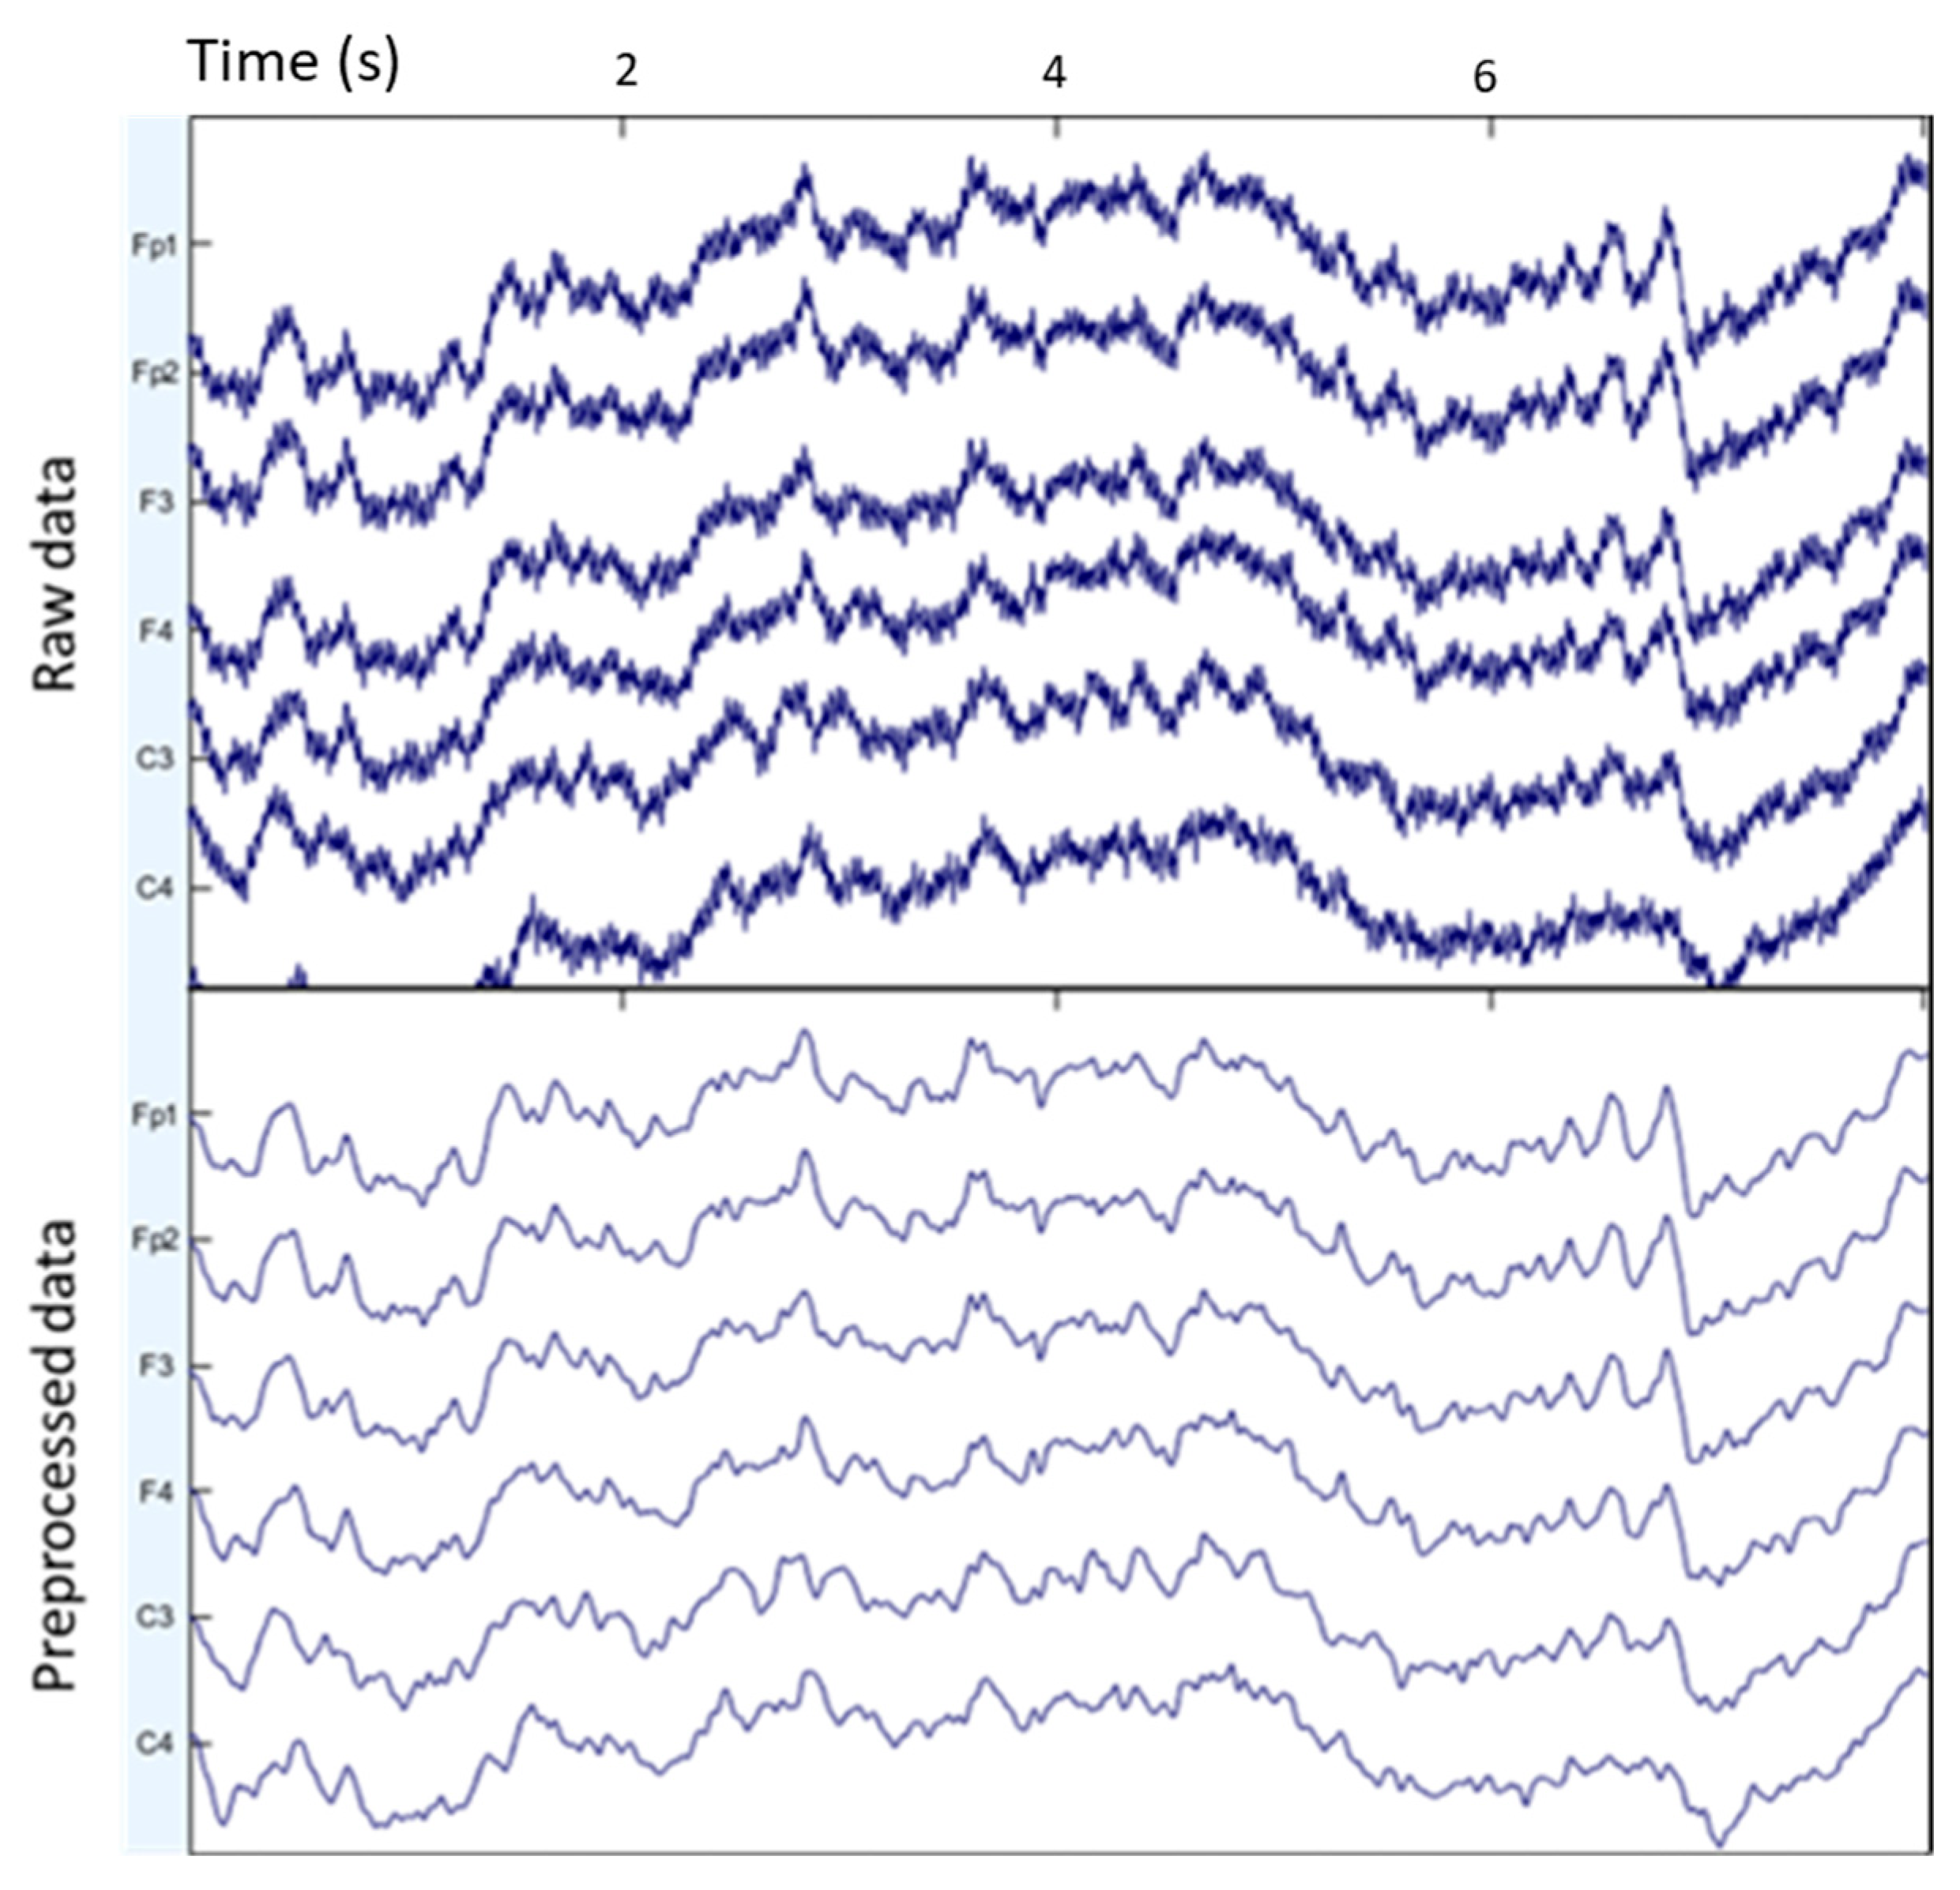
3.2. Preprocessing
3.3. Classification Benchmark
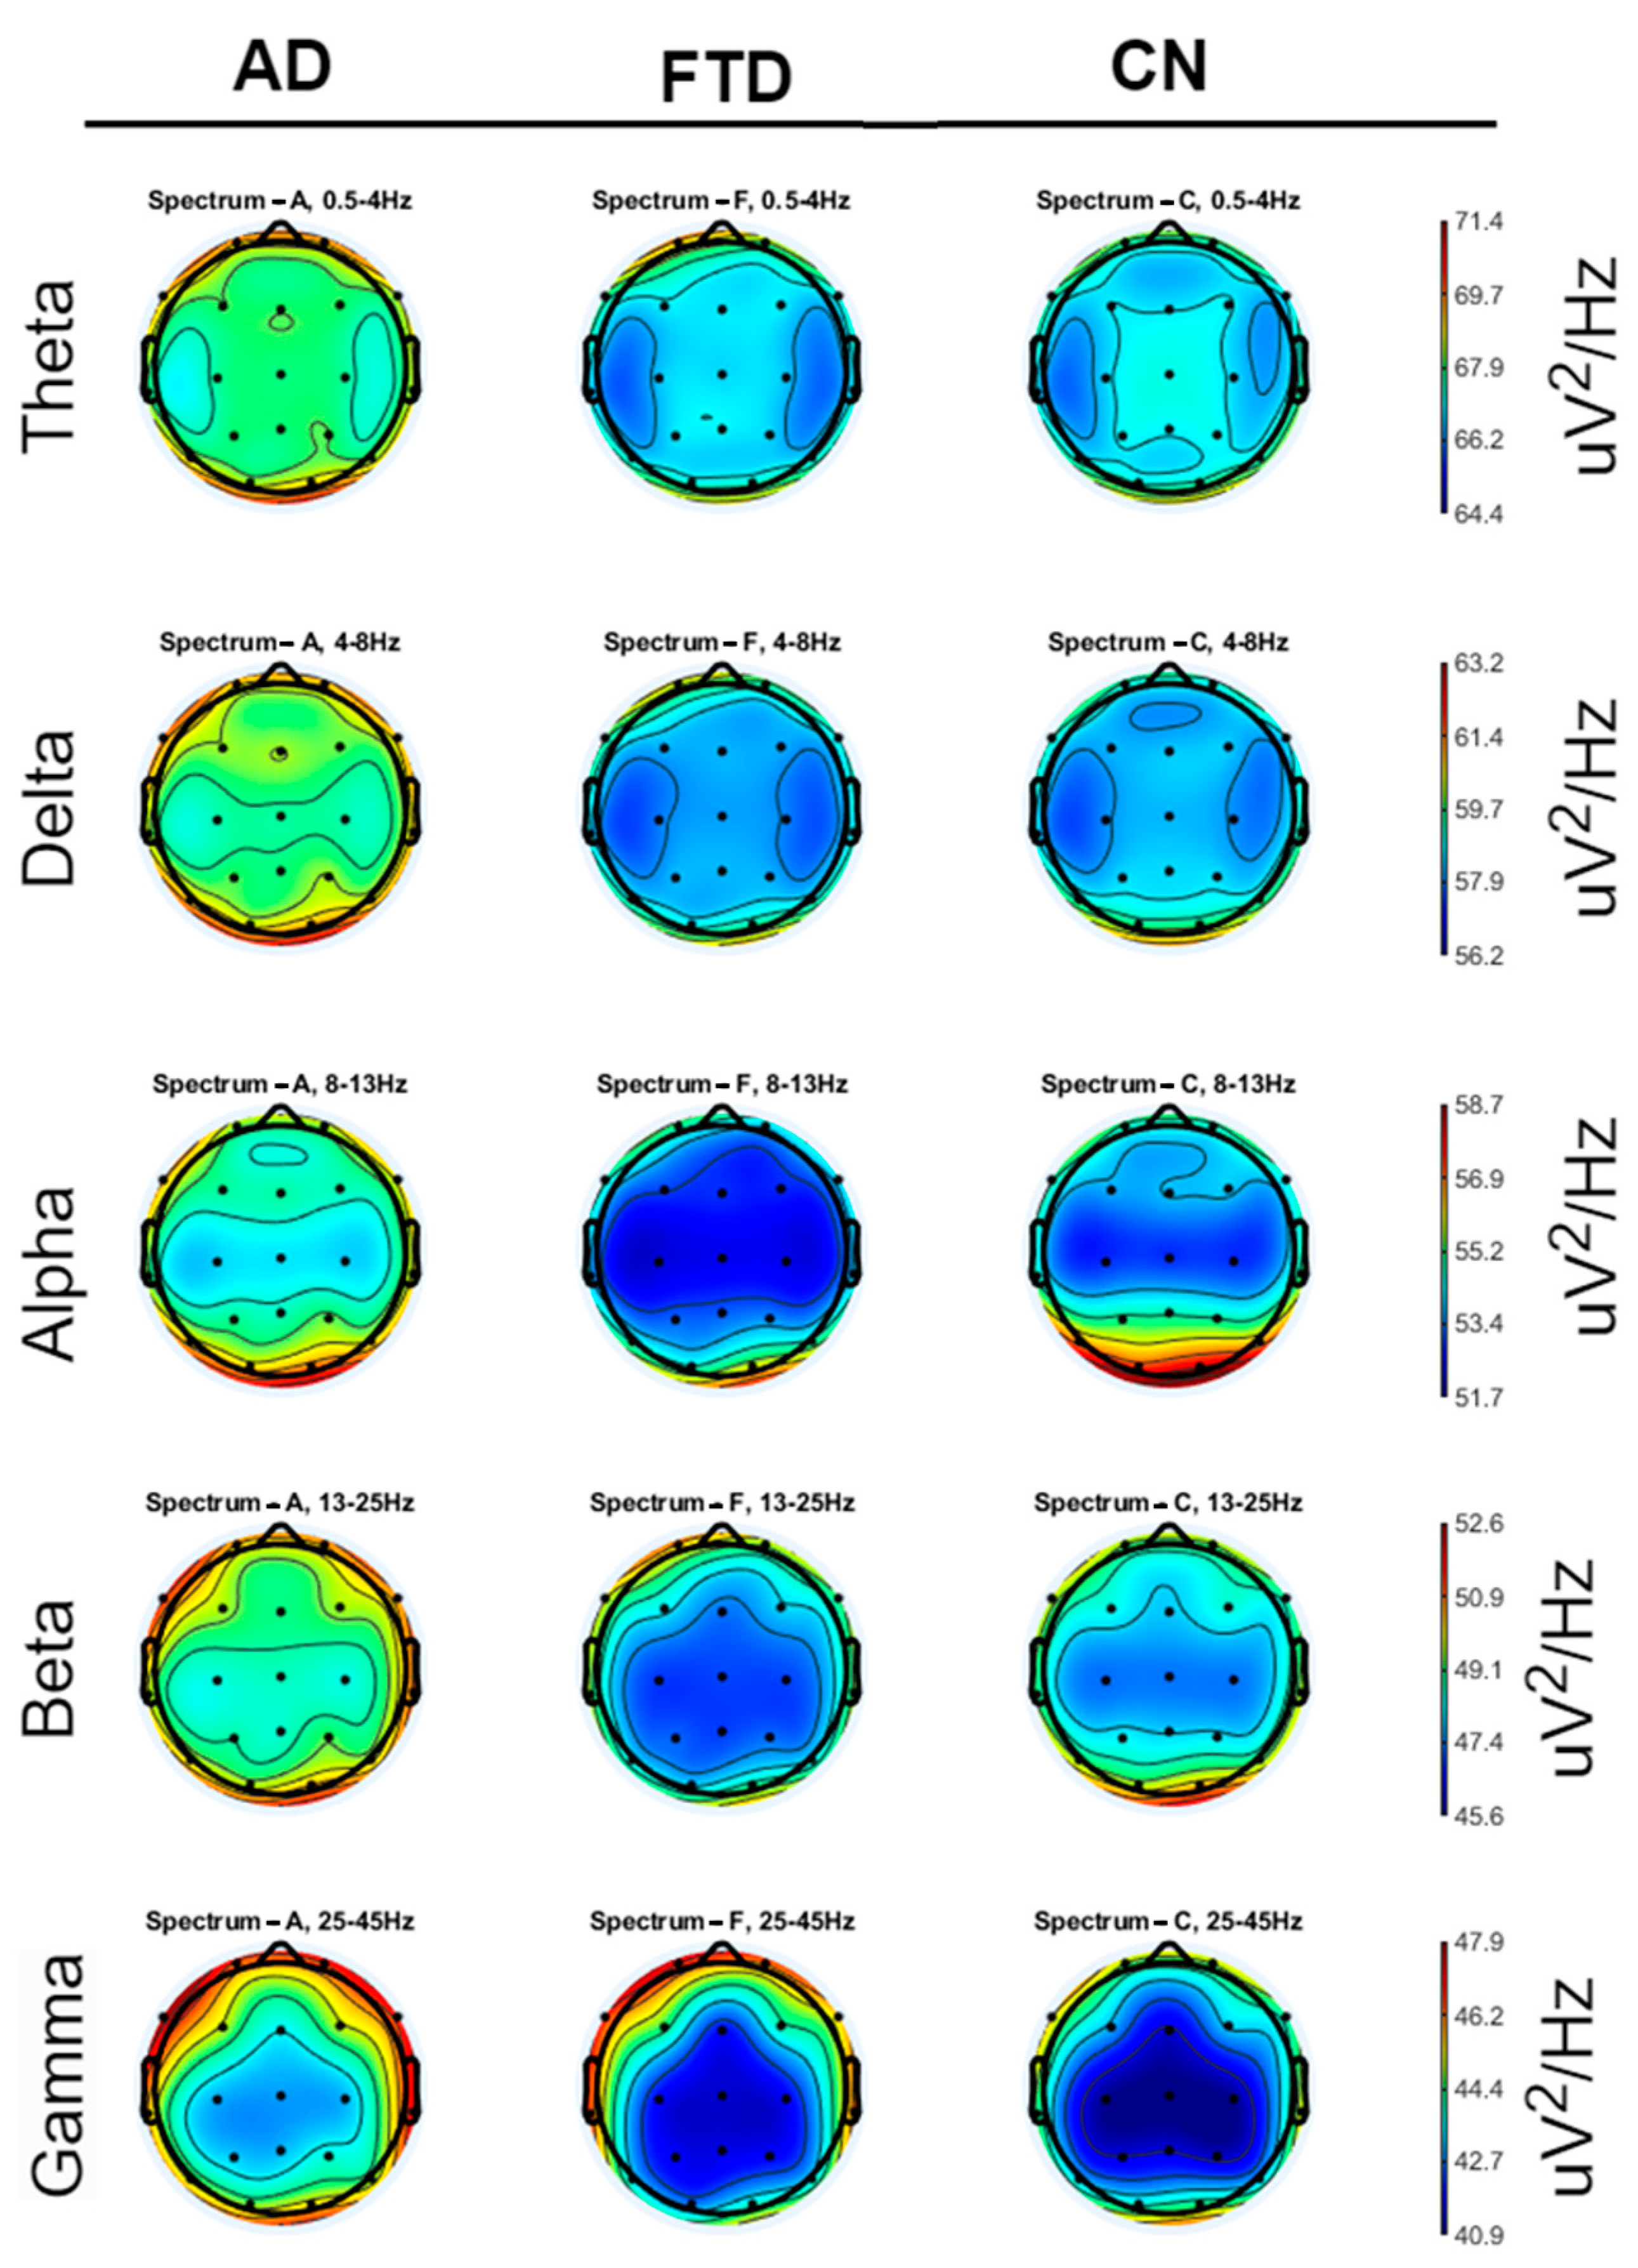
3.3.1. Feature Extraction
- Delta: 0.5–4 Hz
- Theta: 4–8 Hz
- Alpha: 8–13 Hz
- Beta: 13–25 Hz
- Gamma: 25–45 Hz
3.3.2. Classification
4. User Notes
Author Contributions
Funding
Institutional Review Board Statement
Informed Consent Statement
Data Availability Statement
Acknowledgments
Conflicts of Interest
References
- Serrano-Pozo, A.; Frosch, M.P.; Masliah, E.; Hyman, B.T. Neuropathological Alterations in Alzheimer Disease. Cold Spring Harb. Perspect. Med. 2011, 1, a006189. [Google Scholar] [CrossRef] [PubMed]
- Miltiadous, A.; Tzimourta, K.D.; Giannakeas, N.; Tsipouras, M.G.; Afrantou, T.; Ioannidis, P.; Tzallas, A.T. Alzheimer’s Disease and Frontotemporal Dementia: A Robust Classification Method of Eeg Signals and a Comparison of Validation Methods. Diagnostics 2021, 11, 1437. [Google Scholar] [CrossRef] [PubMed]
- Perry, R.J.; Hodges, J.R. Differentiating Frontal and Temporal Variant Frontotemporal Dementia from Alzheimer’s Disease. Neurology 2000, 12, 2277–2285. [Google Scholar] [CrossRef] [PubMed]
- Nishida, K.; Yoshimura, M.; Isotani, T.; Yoshida, T.; Kitaura, Y.; Saito, A.; Mii, H.; Kato, M.; Takekita, Y.; Suwa, A.; et al. Differences in Quantitative EEG between Frontotemporal Dementia and Alzheimer’s Disease as Revealed by LORETA. Clin. Neurophysiol. 2011, 122, 1718–1725. [Google Scholar] [CrossRef] [PubMed]
- McMahon, P.M.; Araki, S.S.; Sandberg, E.A.; Neumann, P.J.; Gazelle, G.S. Cost-Effectiveness of PET in the Diagnosis of Alzheimer Disease. Radiology 2003, 228, 515–522. [Google Scholar] [CrossRef] [PubMed]
- Kivistö, J.; Soininen, H.; Pihlajamaki, M. Functional MRI in Alzheimer’s Disease. In Advanced Brain Neuroimaging Topics in Health and Disease: Methods and Applications; IntechOpen: Rijeka, Croatia, 2014. [Google Scholar]
- Mantzavinos, V.; Alexiou, A. Biomarkers for Alzheimer’s Disease Diagnosis. Curr. Alzheimer Res. 2017, 14, 1149–1154. [Google Scholar] [CrossRef] [PubMed]
- Ouchani, M.; Gharibzadeh, S.; Jamshidi, M.; Amini, M. A Review of Methods of Diagnosis and Complexity Analysis of Alzheimer’s Disease Using EEG Signals. BioMed Res. Int. 2021, 2021, 5425569. [Google Scholar] [CrossRef] [PubMed]
- Miltiadous, A.; Tzimourta, K.D.; Giannakeas, N.; Tsipouras, M.G.; Glavas, E.; Kalafatakis, K.; Tzallas, A.T. Machine Learning Algorithms for Epilepsy Detection Based on Published EEG Databases: A Systematic Review. IEEE Access 2023, 11, 564–594. [Google Scholar] [CrossRef]
- Christodoulides, P.; Miltiadous, A.; Tzimourta, K.D.; Peschos, D.; Ntritsos, G.; Zakopoulou, V.; Giannakeas, N.; Astrakas, L.G.; Tsipouras, M.G.; Tsamis, K.I.; et al. Classification of EEG Signals from Young Adults with Dyslexia Combining a Brain Computer Interface Device and an Interactive Linguistic Software Tool. Biomed. Signal Process. Control 2022, 76, 103646. [Google Scholar] [CrossRef]
- Aspiotis, V.; Miltiadous, A.; Kalafatakis, K.; Tzimourta, K.D.; Giannakeas, N.; Tsipouras, M.G.; Peschos, D.; Glavas, E.; Tzallas, A.T. Assessing Electroencephalography as a Stress Indicator: A VR High-Altitude Scenario Monitored through EEG and ECG. Sensors 2022, 22, 5792. [Google Scholar] [CrossRef] [PubMed]
- Christou, V.; Miltiadous, A.; Tsoulos, I.; Karvounis, E.; Tzimourta, K.D.; Tsipouras, M.G.; Anastasopoulos, N.; Tzallas, A.T.; Giannakeas, N. Evaluating the Window Size’s Role in Automatic EEG Epilepsy Detection. Sensors 2022, 22, 9233. [Google Scholar] [CrossRef] [PubMed]
- Meyer, M.; Lamers, D.; Kayhan, E.; Hunnius, S.; Oostenveld, R. Enhancing Reproducibility in Developmental EEG Research: BIDS, Cluster-Based Permutation Tests, and Effect Sizes. Dev. Cogn. Neurosci. 2021, 52, 101036. [Google Scholar] [CrossRef] [PubMed]
- Tzimourta, K.D.; Afrantou, T.; Ioannidis, P.; Karatzikou, M.; Tzallas, A.T.; Giannakeas, N.; Astrakas, L.G.; Angelidis, P.; Glavas, E.; Grigoriadis, N.; et al. Analysis of Electroencephalographic Signals Complexity Regarding Alzheimer’s Disease. Comput. Electr. Eng. 2019, 76, 198–212. [Google Scholar] [CrossRef]
- Kurlowicz, L.; Wallace, M. The Mini-Mental State Examination (MMSE). J. Gerontol. Nurs. 1999, 25, 8–9. [Google Scholar] [CrossRef] [PubMed]
- Bell, C.C. DSM-IV: Diagnostic and Statistical Manual of Mental Disorders. JAMA: The Journal of the American Medical Association 1994, 272, 828. [Google Scholar] [CrossRef]
- McKhann, G.; Drachman, D.; Folstein, M.; Katzman, R.; Price, D.; Stadlan, E.M. Clinical Diagnosis of Alzheimer’s Disease: Report of the NINCDS-ADRDA Work Group under the Auspices of Department of Health and Human Services Task Force on Alzheimer’s Disease. Neurology 1984, 34, 939–944. [Google Scholar] [CrossRef] [PubMed]
- Delorme, A.; Makeig, S. EEGLAB: An Open Source Toolbox for Analysis of Single-Trial EEG Dynamics Including Independent Component Analysis. J. Neurosci. Methods 2004, 134, 9–21. [Google Scholar] [CrossRef] [PubMed]
- Delorme, A.; Sejnowski, T.; Makeig, S. Enhanced Detection of Artifacts in EEG Data Using Higher-Order Statistics and Independent Component Analysis. Neuroimage 2007, 34, 1443–1449. [Google Scholar] [CrossRef] [PubMed]
- Solomon, J.O.M. PSD Computations Using Welch’s Method. [Power Spectral Density (PSD)]; Sandia National Lab: Albuquerque, NM, USA; Livermore, CA, USA, 1991. [Google Scholar]
- Bergstra, J.; Komer, B.; Eliasmith, C.; Yamins, D.; Cox, D.D. Hyperopt: A Python Library for Model Selection and Hyperparameter Optimization. Comput. Sci. Discov. 2015, 8, 014008. [Google Scholar] [CrossRef]


| Participant_id | Gender | Age | Group | MMSE |
|---|---|---|---|---|
| sub-001 | F | 57 | A | 16 |
| sub-002 | F | 78 | A | 22 |
| sub-003 | M | 70 | A | 14 |
| sub-004 | F | 67 | A | 20 |
| sub-005 | M | 70 | A | 22 |
| sub-006 | F | 61 | A | 14 |
| sub-007 | F | 79 | A | 20 |
| sub-008 | M | 62 | A | 16 |
| sub-009 | F | 77 | A | 23 |
| sub-010 | M | 69 | A | 20 |
| sub-011 | M | 71 | A | 22 |
| sub-012 | M | 63 | A | 18 |
| sub-013 | F | 64 | A | 20 |
| sub-014 | M | 77 | A | 14 |
| sub-015 | M | 61 | A | 18 |
| sub-016 | F | 68 | A | 14 |
| sub-017 | F | 61 | A | 6 |
| sub-018 | F | 73 | A | 23 |
| sub-019 | F | 62 | A | 14 |
| sub-020 | M | 71 | A | 4 |
| sub-021 | M | 79 | A | 22 |
| sub-022 | F | 68 | A | 20 |
| sub-023 | M | 60 | A | 16 |
| sub-024 | F | 69 | A | 20 |
| sub-025 | F | 79 | A | 20 |
| sub-026 | F | 61 | A | 18 |
| sub-027 | F | 67 | A | 16 |
| sub-028 | M | 49 | A | 20 |
| sub-029 | F | 53 | A | 16 |
| sub-030 | F | 56 | A | 20 |
| sub-031 | F | 67 | A | 22 |
| sub-032 | F | 59 | A | 20 |
| sub-033 | F | 72 | A | 20 |
| sub-034 | F | 75 | A | 18 |
| sub-035 | F | 57 | A | 22 |
| sub-036 | F | 58 | A | 9 |
| sub-037 | M | 57 | C | 30 |
| sub-038 | M | 62 | C | 30 |
| sub-039 | M | 70 | C | 30 |
| sub-040 | M | 61 | C | 30 |
| sub-041 | F | 77 | C | 30 |
| sub-042 | M | 74 | C | 30 |
| sub-043 | M | 72 | C | 30 |
| sub-044 | F | 64 | C | 30 |
| sub-045 | F | 70 | C | 30 |
| sub-046 | M | 63 | C | 30 |
| sub-047 | F | 70 | C | 30 |
| sub-048 | M | 65 | C | 30 |
| sub-049 | F | 62 | C | 30 |
| sub-050 | M | 68 | C | 30 |
| sub-051 | F | 75 | C | 30 |
| sub-052 | F | 73 | C | 30 |
| sub-053 | M | 70 | C | 30 |
| sub-054 | M | 78 | C | 30 |
| sub-055 | M | 67 | C | 30 |
| sub-056 | F | 64 | C | 30 |
| sub-057 | M | 64 | C | 30 |
| sub-058 | M | 62 | C | 30 |
| sub-059 | M | 77 | C | 30 |
| sub-060 | F | 71 | C | 30 |
| sub-061 | F | 63 | C | 30 |
| sub-062 | M | 67 | C | 30 |
| sub-063 | M | 66 | C | 30 |
| sub-064 | M | 66 | C | 30 |
| sub-065 | F | 71 | C | 30 |
| sub-066 | M | 73 | F | 20 |
| sub-067 | M | 66 | F | 24 |
| sub-068 | M | 78 | F | 25 |
| sub-069 | M | 70 | F | 22 |
| sub-070 | F | 67 | F | 22 |
| sub-071 | M | 62 | F | 20 |
| sub-072 | M | 65 | F | 18 |
| sub-073 | F | 57 | F | 22 |
| sub-074 | F | 53 | F | 20 |
| sub-075 | F | 71 | F | 22 |
| sub-076 | M | 44 | F | 24 |
| sub-077 | M | 61 | F | 22 |
| sub-078 | M | 62 | F | 22 |
| sub-079 | F | 60 | F | 18 |
| sub-080 | F | 71 | F | 20 |
| sub-081 | F | 61 | F | 18 |
| sub-082 | M | 63 | F | 27 |
| sub-083 | F | 68 | F | 20 |
| sub-084 | F | 71 | F | 24 |
| sub-085 | M | 64 | F | 26 |
| sub-086 | M | 49 | F | 26 |
| sub-087 | M | 73 | F | 24 |
| sub-088 | M | 55 | F | 24 |
| AD/CN | ACC | SENS | SPEC | F1 |
|---|---|---|---|---|
| LightGBM | 76.43% | 76.01% | 76.16% | 76.12% |
| SVM | 73.14% | 71.89% | 75.98% | 73.74% |
| kNN | 71.23% | 69.67% | 74.19% | 72.81% |
| MLP | 73.12% | 73.00% | 74.63% | 74.82% |
| Random Forests | 77.01% | 78.32% | 80.94% | 75.31% |
| FTD/CN | ACC | SENS | SPEC | F1 |
|---|---|---|---|---|
| LightGBM | 72.43% | 61.13% | 80.74% | 67.32% |
| SVM | 70.14% | 62.41% | 75.98% | 68.32% |
| kNN | 67.34% | 59.67% | 76.13% | 70.81% |
| MLP | 73.12% | 63.00% | 78.63% | 72.82% |
| Random Forests | 72.01% | 72.32% | 80.94% | 66.31% |
Disclaimer/Publisher’s Note: The statements, opinions and data contained in all publications are solely those of the individual author(s) and contributor(s) and not of MDPI and/or the editor(s). MDPI and/or the editor(s) disclaim responsibility for any injury to people or property resulting from any ideas, methods, instructions or products referred to in the content. |
© 2023 by the authors. Licensee MDPI, Basel, Switzerland. This article is an open access article distributed under the terms and conditions of the Creative Commons Attribution (CC BY) license (https://creativecommons.org/licenses/by/4.0/).
Share and Cite
Miltiadous, A.; Tzimourta, K.D.; Afrantou, T.; Ioannidis, P.; Grigoriadis, N.; Tsalikakis, D.G.; Angelidis, P.; Tsipouras, M.G.; Glavas, E.; Giannakeas, N.; et al. A Dataset of Scalp EEG Recordings of Alzheimer’s Disease, Frontotemporal Dementia and Healthy Subjects from Routine EEG. Data 2023, 8, 95. https://doi.org/10.3390/data8060095
Miltiadous A, Tzimourta KD, Afrantou T, Ioannidis P, Grigoriadis N, Tsalikakis DG, Angelidis P, Tsipouras MG, Glavas E, Giannakeas N, et al. A Dataset of Scalp EEG Recordings of Alzheimer’s Disease, Frontotemporal Dementia and Healthy Subjects from Routine EEG. Data. 2023; 8(6):95. https://doi.org/10.3390/data8060095
Chicago/Turabian StyleMiltiadous, Andreas, Katerina D. Tzimourta, Theodora Afrantou, Panagiotis Ioannidis, Nikolaos Grigoriadis, Dimitrios G. Tsalikakis, Pantelis Angelidis, Markos G. Tsipouras, Euripidis Glavas, Nikolaos Giannakeas, and et al. 2023. "A Dataset of Scalp EEG Recordings of Alzheimer’s Disease, Frontotemporal Dementia and Healthy Subjects from Routine EEG" Data 8, no. 6: 95. https://doi.org/10.3390/data8060095
APA StyleMiltiadous, A., Tzimourta, K. D., Afrantou, T., Ioannidis, P., Grigoriadis, N., Tsalikakis, D. G., Angelidis, P., Tsipouras, M. G., Glavas, E., Giannakeas, N., & Tzallas, A. T. (2023). A Dataset of Scalp EEG Recordings of Alzheimer’s Disease, Frontotemporal Dementia and Healthy Subjects from Routine EEG. Data, 8(6), 95. https://doi.org/10.3390/data8060095