You are currently viewing a new version of our website. To view the old version click .
Data
  • Data Descriptor
  • Open Access

18 June 2023

RipSetCocoaCNCH12: Labeled Dataset for Ripeness Stage Detection, Semantic and Instance Segmentation of Cocoa Pods

,
,
,
and
Escuela de Ciencias Aplicadas e Ingeniería, Universidad EAFIT, Medellín 050022, Colombia
*
Author to whom correspondence should be addressed.

Abstract

Fruit counting and ripeness detection are computer vision applications that have gained strength in recent years due to the advancement of new algorithms, especially those based on artificial neural networks (ANNs), better known as deep learning. In agriculture, those algorithms capable of fruit counting, including information about their ripeness, are mainly applied to make production forecasts or plan different activities such as fertilization or crop harvest. This paper presents the RipSetCocoaCNCH12 dataset of cocoa pods labeled at four different ripeness stages: stage 1 (0–2 months), stage 2 (2–4 months), stage 3 (4–6 months), and harvest stage (>6 months). An additional class was also included for pods aborted by plants in the early stage of development. A total of 4116 images were labeled to train algorithms that mainly perform semantic and instance segmentation. The labeling was carried out with CVAT (Computer Vision Annotation Tool). The dataset, therefore, includes labeling in two formats: COCO 1.0 and segmentation mask 1.1. The images were taken with different mobile devices (smartphones), in field conditions, during the harvest season at different times of the day, which could allow the algorithms to be trained with data that includes many variations in lighting, colors, textures, and sizes of the cocoa pods. As far as we know, this is the first openly available dataset for cocoa pod detection with semantic segmentation for five classes, 4116 images, and 7917 instances, comprising RGB images and two different formats for labels. With the publication of this dataset, we expect that researchers in smart farming, especially in cocoa cultivation, can benefit from the quantity and variety of images it contains.

Dataset License

Licensed under Creative Commons Attribution 4.0 International.

1. Introduction

The application of precision agriculture strategies in cocoa crops continues to encounter various challenges that need to be addressed. These challenges primarily involve issues related to the poor quality of existing data and the acquisition of new data necessary for the application of advanced precision agriculture techniques [].
One of the main challenges is to identify different stages of ripeness of the cocoa pods since this type of crop has a wide number of varieties, and all of them can show different textures and color characteristics in their maturation process [].
Detecting ripeness stages in cocoa pods is critical in determining two relevant factors in any crop: effectively planning the optimal timing of harvest and accurately predicting production volumes. Unfortunately, the adequate maturity to harvest is not always homogeneous, affecting the fermentation process necessary to obtain good chocolate quality [].
The following different techniques have been tested for ripeness-stages detection in cocoa pods:
  • acoustic signals [,],
  • determination of metabolic profiles through biochemical markers [], and
  • laser techniques with backscattered images [].
However, these techniques are unrealistic when implemented in the field with real conditions, since the devices for capturing sound data, laser images, spectrometry, or bio-chemical markers require expensive devices that are not within the reach of the farmers.
On the other hand, artificial intelligence techniques based on artificial neural networks (ANNs), better known as deep learning, are increasingly used [,,].
The precision and robustness of deep learning models depend on the quality and quantity of the training data, as they are crucial factors that contribute to the variability of the phenomenon under study [].
Moreover, the increasing prevalence of smartphones among farmers for their daily activities simplifies the process of capturing images, eliminating the necessity of investing in costly equipment and specialized management for data capture.
Unfortunately, the community engaged in applied research using deep learning techniques to detect ripeness stages in cocoa pods faces a scarcity of image datasets for most varieties. In addition, the available public datasets offer only a limited number of images for training deep learning models [,].
To help the community that performs applied research for developing deep learning solutions to detect ripeness stages in cocoa pods, we propose the RipSetCocoaC-NCH12 dataset, which consists of 4116 images taken with different types of smartphones labeled for semantic segmentation. Having several stages of ripeness is a feature that will allow researchers to train machine learning algorithms that classify more than two classes: mature and immature. These features will allow the scientific community interested in these applications to train more robust and accurate deep learning models.
The RipSetCocoaCNCH12 dataset will be important for the training of machine learning algorithms that seek to detect different ripeness stages in cocoa crops of the CNCH12 variety and to make inventories of pods.

2. RipSetCocoaCNCH12 Dataset

2.1. Descripion

CACAO CNCH12, developed by “Compañía Nacional de Chocolates”, is the cocoa variety in the dataset. The images were collected at the “Compañía Nacional de Chocolates” farm, located in the municipality of Támesis, department of Antioquia—Colombia (5°43′02″ N–75°41′25″ W). The average height above sea level in the farm is approximately 1100 m. The dataset was created between 1 December 2022 and 17 February 2023, the primary cocoa harvest season in the study area.
The average ripening period for a cocoa pod typically spans six to seven months, although slight variations may occur based on the specific agronomic and climatic conditions of the crop. The ripeness stages were defined in ranges of two months due to the key physical and chemical differences of the cocoa pods according to the agronomists of the “Compañía Nacional de Chocolates” company. The stages are defined based on the duration in months, starting from pollination of the flowers to the optimal time for harvesting the pod. The sequential progression of cocoa pods during the ripening process, from 0 to 6 months, is illustrated in Figure 1.
Figure 1. Ripeness process in a sequence of cocoa pods.
The images of cocoa pods were divided into five classes (Table 1). They were divided into four classes according to their ripeness stage in months: Class 1 (0–2 months), Class 2 (2–4 months), Class 3 (4–6 months), and Class 4 (>6 months) (Figure 2). Additionally, there is a fifth class known as “abortions” that does not fall under any of the ripeness stages (Class A). Abortions are cocoa pods that start their growth process but die from various causes associated with attacks by pests or diseases or even due to physiological problems of the plant (Figure 3).
Table 1. Number and names of instances per class.
Figure 2. Ripeness stages: (a) 0–2 months (C1); (b) 2–4 months (C2); (c) 4–6 months (C3); (d) >6 months (C4).
Figure 3. Examples of several types of abortions (CA).
The dataset contains two folders: the first contains the annotations in COCO 1.0 format, and the second contains the images in segmentation mask 1.1 format. In each of these folders, the images are divided into subfolders named with the main class they contain; an image can contain several instances of different classes, but the images in each folder are dominated by one of the classes. The distribution of instances in each folder can be seen below in Figure 4.
Figure 4. Distribution of the instances for each image folder (y-axes differ between the frames).

2.2. Quantitative Measure to Differenciate Cocoa Classes

The ripening process of fruit involves a sequence of physiological changes to become ready for consumption or processing. The fruit grows, accumulating essential nutrients and water, while noticeable transformations in color, texture, and composition signify its ripeness.
A widely used way to measure the state of maturity of a fruit quantitatively at different stages is to calculate the internal sugar content by measuring Brix degrees [,,,]. To have a quantitative measure that would confirm the difference between ripeness stages, the Brix degrees were measured in more than 35 cocoa pods for each class in the four ripeness stages (C1 to C4). The results are presented in Table 2.
Table 2. Number of samples and average Brix degrees for the ripeness stages.
An ANOVA test was performed to check for a significant difference between the different classes, according to their measure of Brix degrees. The results can be seen below in Table 3.
Table 3. ANOVA table for Brix degrees in the four different ripeness stages.
N u l l   h y p o t h e s i s :   μ j   a r e   e q u a l A l t e r n a t i v e   h y p o t h e s i s :   μ j   a r e   n o t   e q u a l
According to the results of the F and p-value, the null hypothesis is rejected. Therefore, there is a significant difference in Brix degrees among classes, which confirms the accuracy of dividing cocoa pods into the four proposed classes for the stages of ripeness.
Every image is 3000 × 3000 px in JPEG format, with 8 bits. The image files were named with the date and time of capture. Figure 5 is an example of the images corresponding to the four ripeness stages.
Figure 5. Dataset examples of the ripeness stages: (a) Class 1; (b) Class 2; (c) Class 3; (d) Class 4.
Table 4 below shows a summary of the RipSetCocoaCNCH12 dataset.
Table 4. The RipSetCocoaCNCH12 specifications.

3. Methods

Nowadays, smartphones have become ubiquitous. In even the most remote rural areas, smartphones have become the main communication technology due to their low costs and portability. These devices can also give farmers the ability to collect image data. Therefore, in this work, the images were captured with smartphones to have a dataset as similar as possible to real conditions.

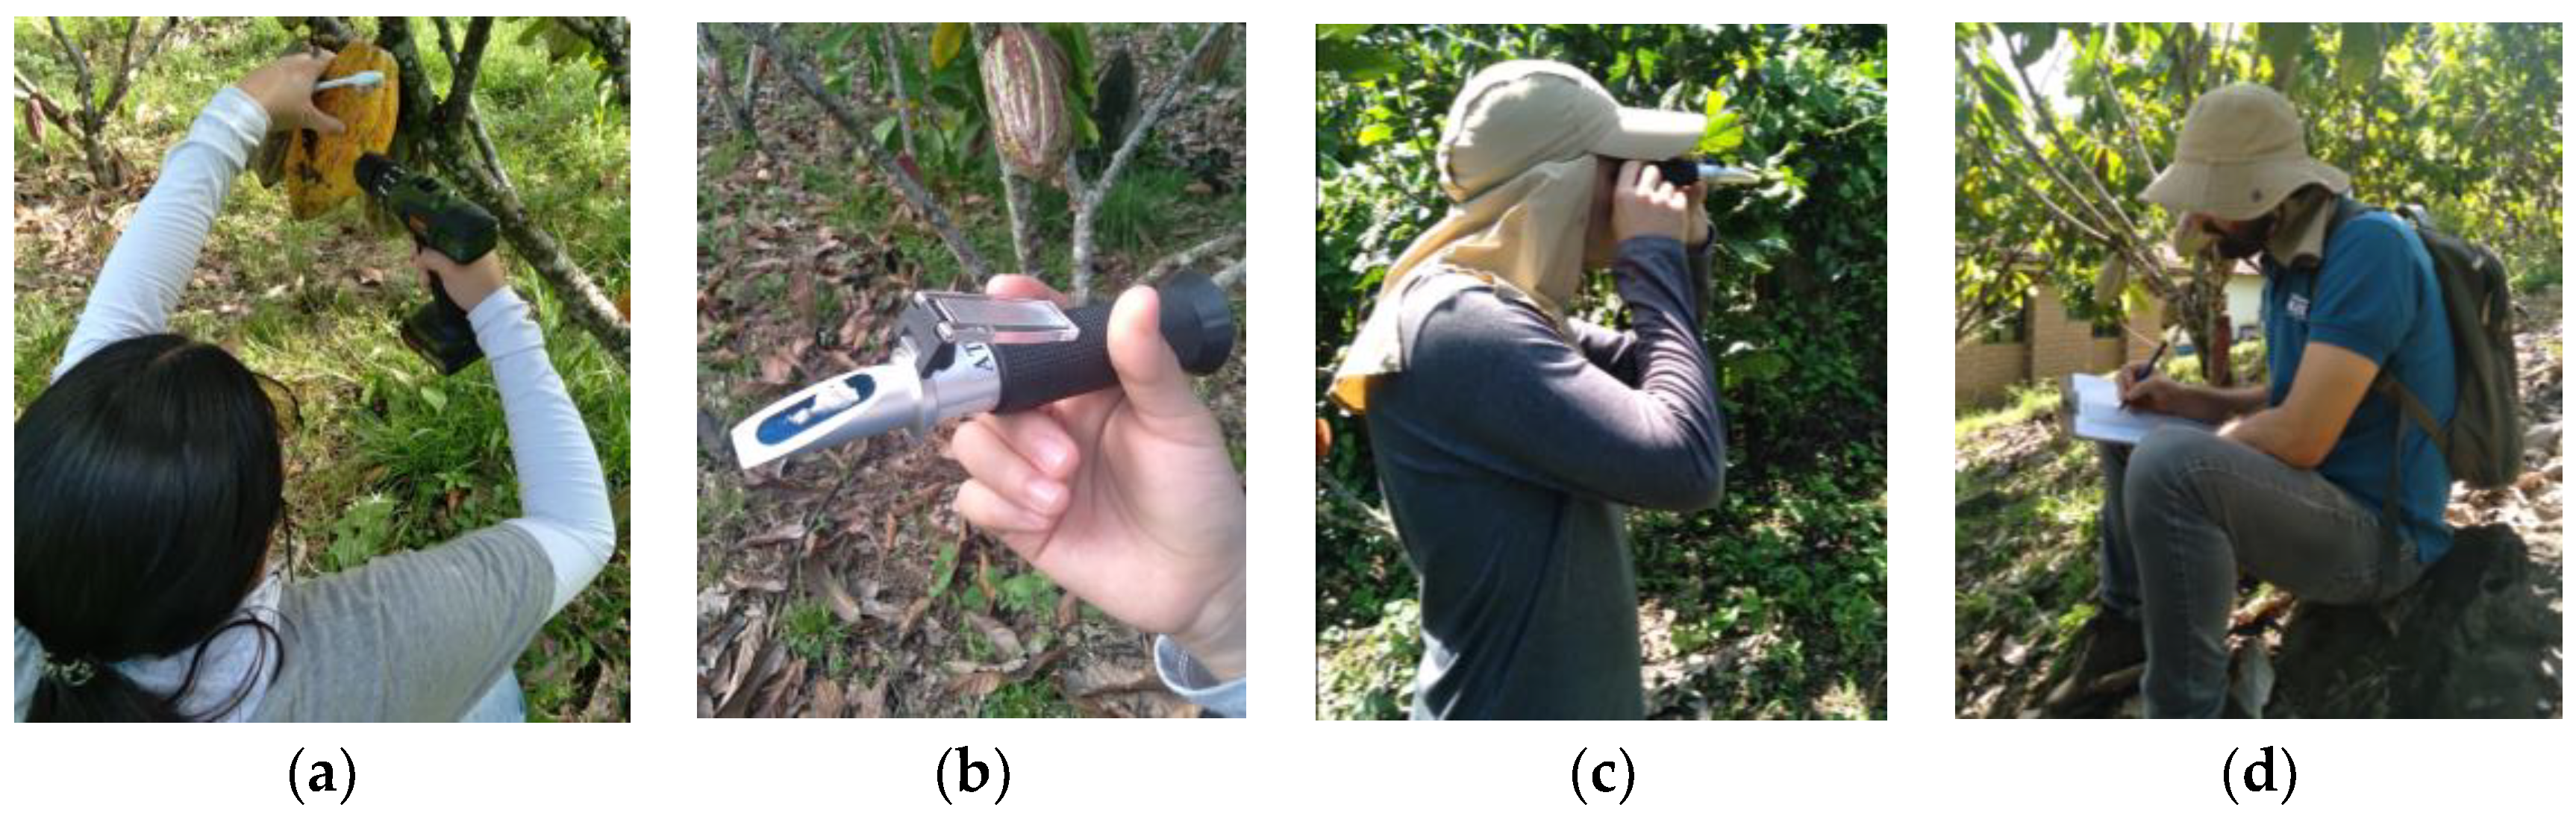
3.1. Image Data Acquisition

Five devices from some of the leading manufacturers were selected for this work. To ensure significant variability in the types of images captured and enrich the dataset, multiple devices were chosen. The technical specifications of used smartphones can be seen below in Table 5.
Table 5. Technical specifications of the smartphone cameras used to capture the dataset images.
The strategy for capturing images involved zigzag paths in the field enabling access to each crop tree. During each pass, a person took images of a single class to allow easier classification in the folders.
Between one and four images of each cocoa pod were taken from different angles to obtain as many samples as possible (Figure 6).
Figure 6. Image capture process for one cocoa pod from different angles.
The images were taken between 8:00 a.m. and 4:00 p.m. First, the size format for the capture was adjusted on all smartphones to a 1:1 ratio, and then resizing was applied to them using a script in the Python language with Pillow (Python Imaging Library), giving them a final size of 3000 × 3000 px. The original images had sizes in the range from 3072 × 3072 to 4096 × 4096 px.

3.2. Brix Degrees Data Acquisition

Some pods were selected to measure the Brix degrees of the internal sugar content, as mentioned in Section 2.1. First, the pods chosen for samples were perforated with a drill. Then, the sample was extracted, which was later placed in a handheld refractometer, and finally, the data were recorded manually. Images of this process can be seen below in Figure 7.
Figure 7. Process of sampling to measure Brix degrees: (a) perforation of the cocoa pod with a drill, (b) placement of the sample in a handheld spectrometer, (c) reading of the Brix degree measurement, and (d) measurement recording.

3.3. Data Annotation

The tool used for labeling images was CVAT (Computer Vision Annotation Tool) [], which allows for different techniques. The technique used for this work was polygon labeling to obtain a semantic segmentation of the classes (Figure 8).
Figure 8. Examples of labeling of cocoa pods with CVAT.
The dataset contains labels in two alternative formats: (1) COCO 1.0, which has files in the format (*.json) for detection using bounding boxes and polygons, and (2) segmentation mask 1.1, which contains separate folders for semantic segmentation and instance segmentation. Examples of these masks can be seen in Figure 9 and Figure 10.
Figure 9. Examples of masks for semantic segmentation: (a) C1; (b) C2; (c) C3; (d) C4.
Figure 10. Example of masks for instance segmentation: Class 1.

4. Limitations

The RipSetCocoaCNCH12 dataset does not include classes of cocoa pods to discard. In future work, diseases and rotten pods may be included. Additionally, more data should be collected on other different cocoa varieties.

Author Contributions

Conceptualization, J.F.R.-A., M.I.H.-P., and A.M.-T.; methodology, J.F.R.-A. and M.I.S.-A.; software, J.F.R.-A.; validation, J.F.R.-A., M.I.H.-P., and A.M.-T.; formal analysis, M.I.S.-A. and J.F.R.-A.; data curation, M.I.S.-A. and M.C.G.-C.; writing—original draft preparation, J.F.R.-A.; writing—review and editing, J.F.R.-A., M.I.H.-P., and A.M.-T.; project administration, J.F.R.-A. All authors have read and agreed to the published version of the manuscript.

Funding

This research was funded by Universidad EAFIT, project No. 819422.

Institutional Review Board Statement

Not applicable.

Data Availability Statement

The data presented in this study are openly available in Zenodo at https://doi.org/10.5281/zenodo.7968315 (accessed on 24 May 2023).

Acknowledgments

We want to thank the “Compañía Nacional de Chocolates” company for providing access to the farm “La Granja” in the municipality of Támesis to take the images for this work. Thanks for their support and for allowing us to use their facilities. Special thanks to the BIOSUROESTE organization.

Conflicts of Interest

The authors declare no conflict of interest.

References

  1. Bosompem, M. Potential challenges to precision agriculture technologies development in Ghana: Scientists’ and cocoa extension agents’ perspectives. Precis. Agric. 2021, 22, 1578–1600. [Google Scholar] [CrossRef]
  2. Bueno, G.E.; Valenzuela, K.A.; Arboleda, E.R. Maturity classification of cacao through spectrogram and convolutional neural network. J. Teknol. Sist. Komput. 2020, 8, 228–233. [Google Scholar] [CrossRef]
  3. Quezada-Ramón, L.A.; Quevedo-Guerrero, J.N.; García-Batista, R.M. Determinación del efecto del grado de madurez de las mazorcas en la producción y la calidad sensorial de (Theobroma cacao L.). Rev. Científica Agroecosistemas 2017, 5, 36–46. Available online: http://aes.ucf.edu.cu/index.php/aes/index (accessed on 12 May 2023).
  4. Galindo, J.A.M.; Rosal, J.E.C.; Villaverde, J.F. Ripeness Classification of Cacao Using Cepstral-Based Statistical Features and Support Vector Machine. In Proceedings of the 2022 IEEE International Conference on Artificial Intelligence in Engineering and Technology (IICAIET), Kota Kinabalu, Malaysia, 13–15 September 2022; pp. 1–5. [Google Scholar] [CrossRef]
  5. Gallego, A.M.; Zambrano, R.A.; Zuluaga, M.; Rodríguez, A.V.C.; Cortés, M.S.C.; Vergel, A.P.R.; Valencia, J.W.A. Analysis of fruit ripening in Theobroma cacao pod husk based on untargeted metabolomics. Phytochemistry 2022, 203, 113412. [Google Scholar] [CrossRef] [PubMed]
  6. Lockman, N.A.; Hashim, N.; Onwude, D.I. Laser-Based imaging for Cocoa Pods Maturity Detection. Food Bioprocess Technol. 2019, 12, 1928–1937. [Google Scholar] [CrossRef]
  7. Veites-Campos, S.A.; Betancour, R.R.; González-Pérez, M. Identification of Cocoa Pods with Image Processing and Artificial Neural Networks. Int. J. Adv. Eng. Manag. Sci. 2018, 4, 510–518. [Google Scholar] [CrossRef]
  8. Heredia-Gómez, J.F.; Rueda-Gómez, J.P.; Talero-Sarmiento, L.H.; Ramírez-Acuña, J.S.; Coronado-Silva, R.A. Cocoa pods ripeness estimation, using convolutional neural networks in an embedded system. Rev. Colomb. Comput. 2020, 21, 42–55. [Google Scholar] [CrossRef]
  9. Baculio, N.G.; Barbosa, J.B. An Objective Classification Approach of Cacao Pods using Local Binary Pattern Features and Artificial Neural Network Architecture (ANN). Indian J. Sci. Technol. 2022, 15, 495–504. Available online: https://indjst.org/articles/an-objective-classification-approach-of-cacao-pods-using-local-binary-pattern-features-and-artificial-neural-network-architecture-ann (accessed on 1 March 2023). [CrossRef]
  10. Goodfellow, I.; Bengio, Y.; Courville, A. Deep Learning; The MIT Press: Cambridge, MA, USA, 2016. [Google Scholar]
  11. Ayikpa, K.J.; Mamadou, D.; Ballo, A.B.; Yao, K.; Gouton, P.; Adou, K.J. CocoaMFDB: A dataset of cocoa pod maturity and families in an uncontrolled environment in Côte d’Ivoire. Data Brief 2023, 48, 109196. Available online: https://linkinghub.elsevier.com/retrieve/pii/S2352340923003153 (accessed on 1 March 2023). [CrossRef] [PubMed]
  12. Pérez, V.O.; Álvarez-Barreto, C.I.; Matallana, L.G.; Acuña, J.R.; Echeverri, L.F.; Imbachí, L.C. Effect of Prolonged Fermentations of Coffee Mucilage with Different Stages of Maturity on the Quality and Chemical Composition of the Bean. Fermentation 2022, 8, 519. [Google Scholar] [CrossRef]
  13. Darbellay, C.; Luisier, J.-L.; Villettaz, J.-C.; Azodanlou, R. Changes in flavour and texture during the ripening of strawberries. Eur. Food Res. Technol. 2003, 218, 167–172. [Google Scholar] [CrossRef]
  14. Chassagne-Berces, S.; Fonseca, F.; Citeau, M.; Marin, M. Freezing protocol effect on quality properties of fruit tissue according to the fruit, the variety and the stage of maturity. LWT 2010, 43, 1441–1449. [Google Scholar] [CrossRef]
  15. Teka, T.A. Analysis of the effect of maturity stage on the postharvest biochemical quality characteristics of tomato (Lycopersicon esculentum Mill.) fruit. Int. Res. J. Pharm. Appl. Sci. 2013, 3, 180–186. Available online: www.irjpas.com (accessed on 1 March 2023).
  16. CVAT. Available online: https://www.cvat.ai/ (accessed on 21 February 2023).
Disclaimer/Publisher’s Note: The statements, opinions and data contained in all publications are solely those of the individual author(s) and contributor(s) and not of MDPI and/or the editor(s). MDPI and/or the editor(s) disclaim responsibility for any injury to people or property resulting from any ideas, methods, instructions or products referred to in the content.

Article Metrics

Citations

Article Access Statistics

Multiple requests from the same IP address are counted as one view.