
Physico-Chemical Quality and Physiological Profiles of Microbial Communities in Freshwater Systems of Mega Manila, Philippines

 , and
, and
Abstract
1. Summary
- (1)
- the physico-chemical parameters and physiological profiles of microbial communities in freshwater systems are useful data when assessing water quality, which can inform regulatory and monitoring policies and practices at the national and local levels.
- (2)
- raw and analyzed data can be shared with key agencies in the Philippines, such as the Department of Health (DOH), the Department of Environment and Natural Resources (DENR), and the Laguna Lake Development Authority (LLDA). These government agencies can use our reported data as a reference or as baseline information when evaluating the outcomes of their respective national programs that use water quality as a success metric. For example, LLDA can use our reported quality data to describe whether there has been an improvement in the quality of water from Laguna Lake tributaries, e.g., when comparisons are to be made between specific years.
- (3)
- the raw data reported in this article can be used to compute a single aggregate value, the water quality index (WQI). The WQI is a summary metric that indicates the overall quality of water in a system. The suitability of a body of water as a source of drinking water can be assessed using the weighted arithmetic WQI method, which assigns a relative weight to each parameter considered for the computation of the overall WQI [1].
- (4)
- metabolic fingerprints, which can be determined using CLPP metrics such as standardized absorbance (SA) and substrate average well color development (SAWCD), can serve as in vitro measures of the biochemical activity of aquatic microbes. Phenotype-based metabolic fingerprints of microbial communities in an environmental sample are useful in informing strategies for implementing additional techniques and protocols, i.e., microcosm experiments [2], taxonomic profiling of microbial communities [3,4,5], amplification of target metabolic genes/functional profiling of microbial communities [6], and isolation of potential bioactive species [7].
2. Data Description
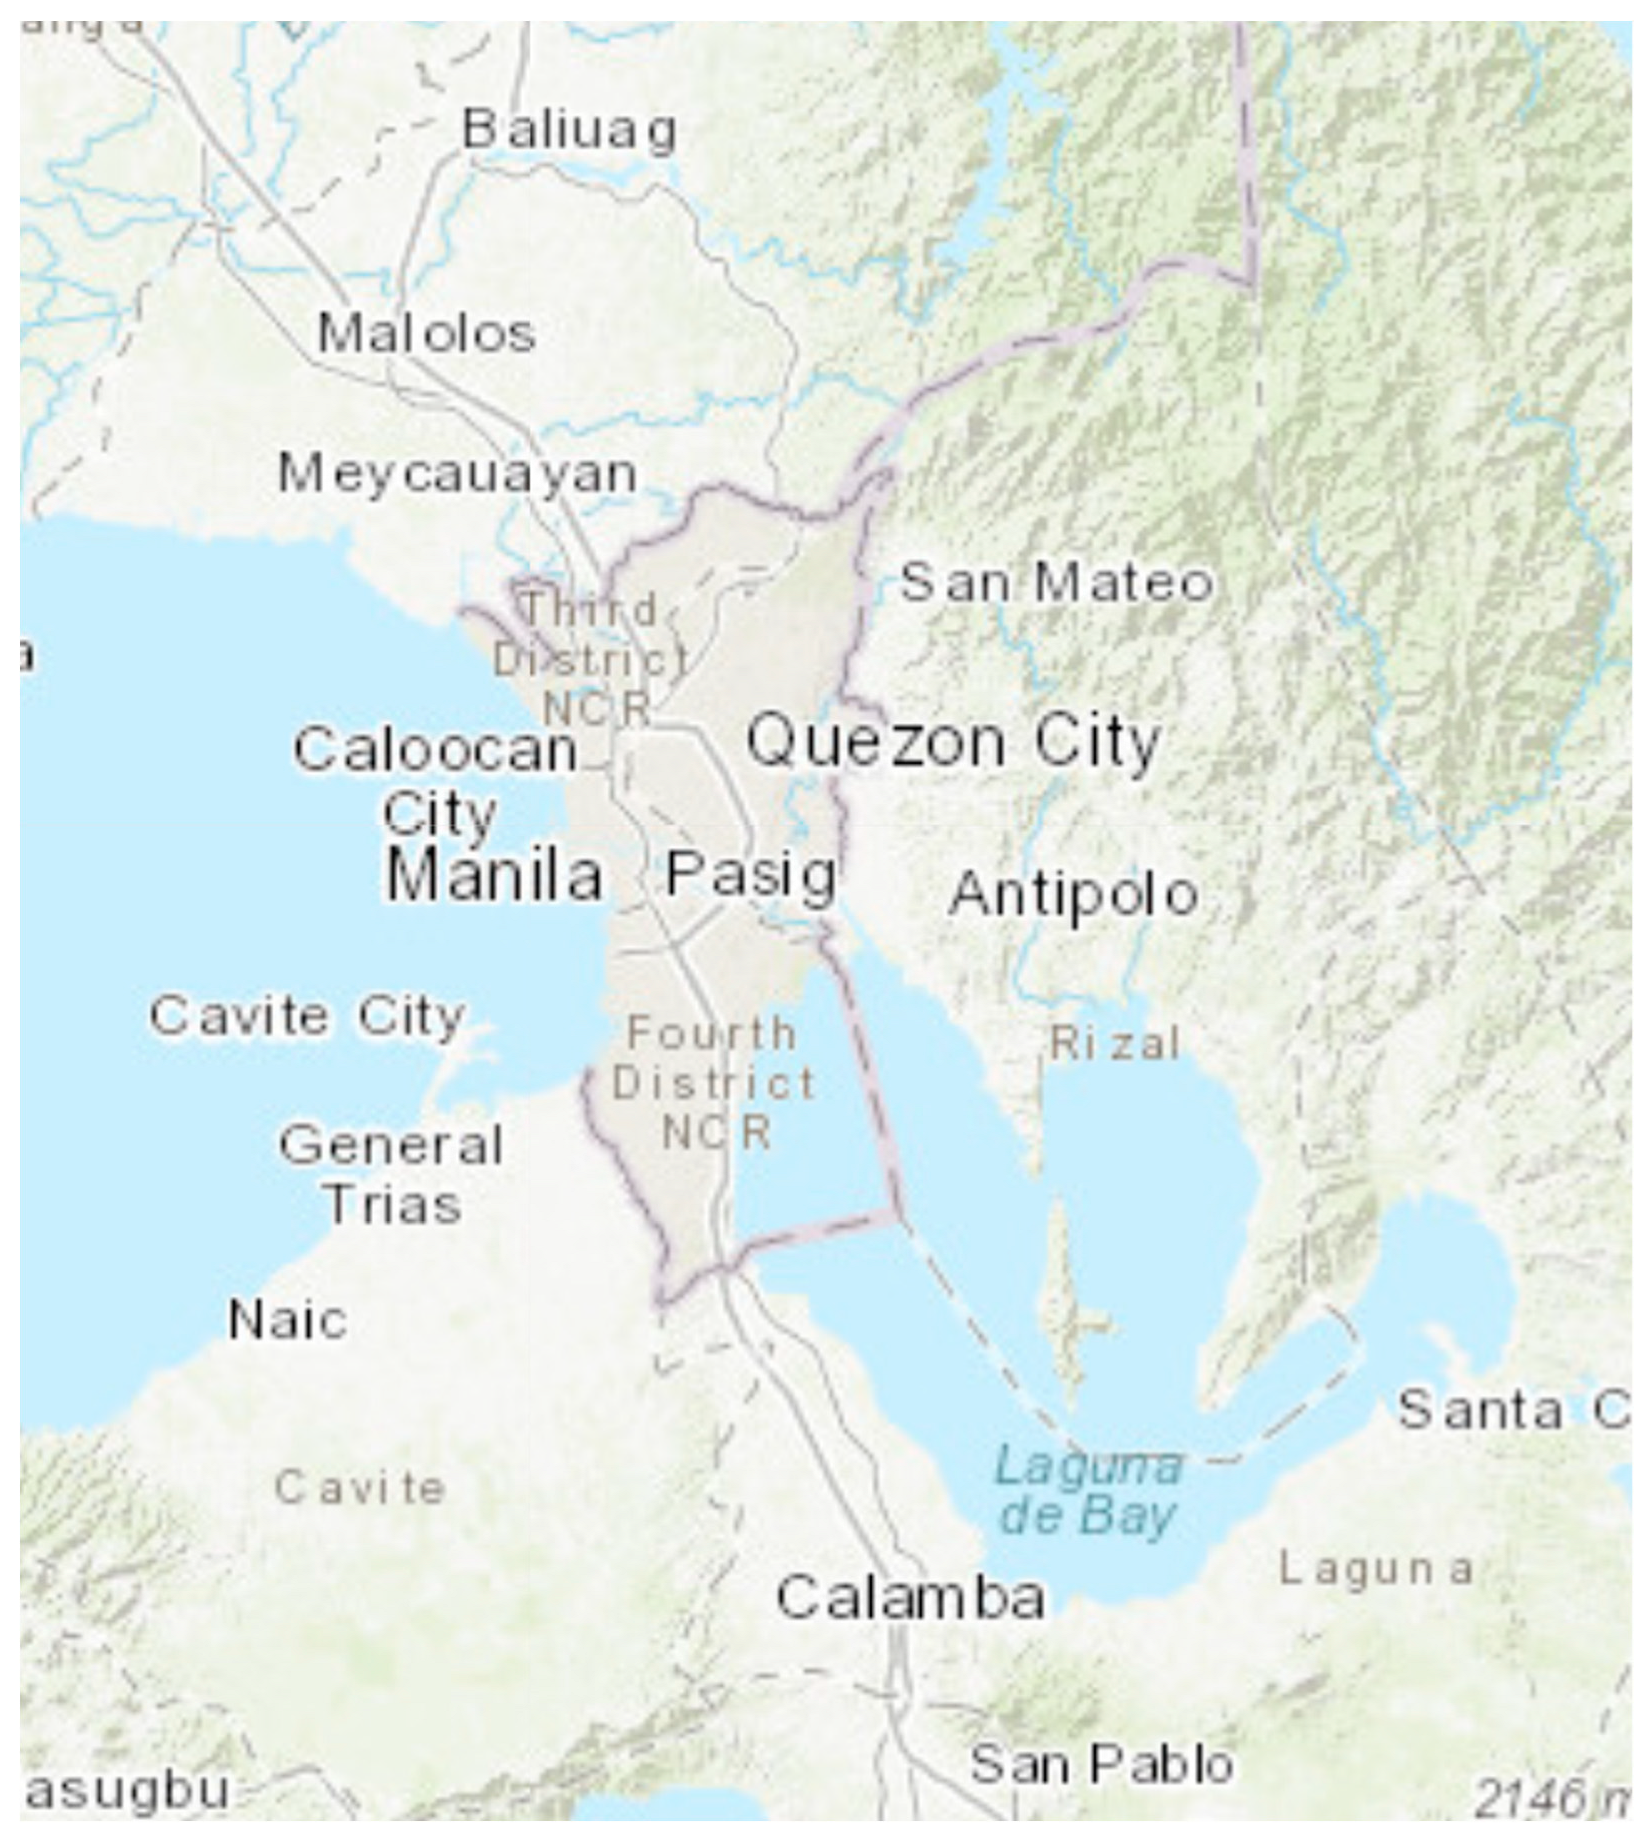
2.1. Study Area
2.2. Data on Physico-Chemical Parameters of Water Samples
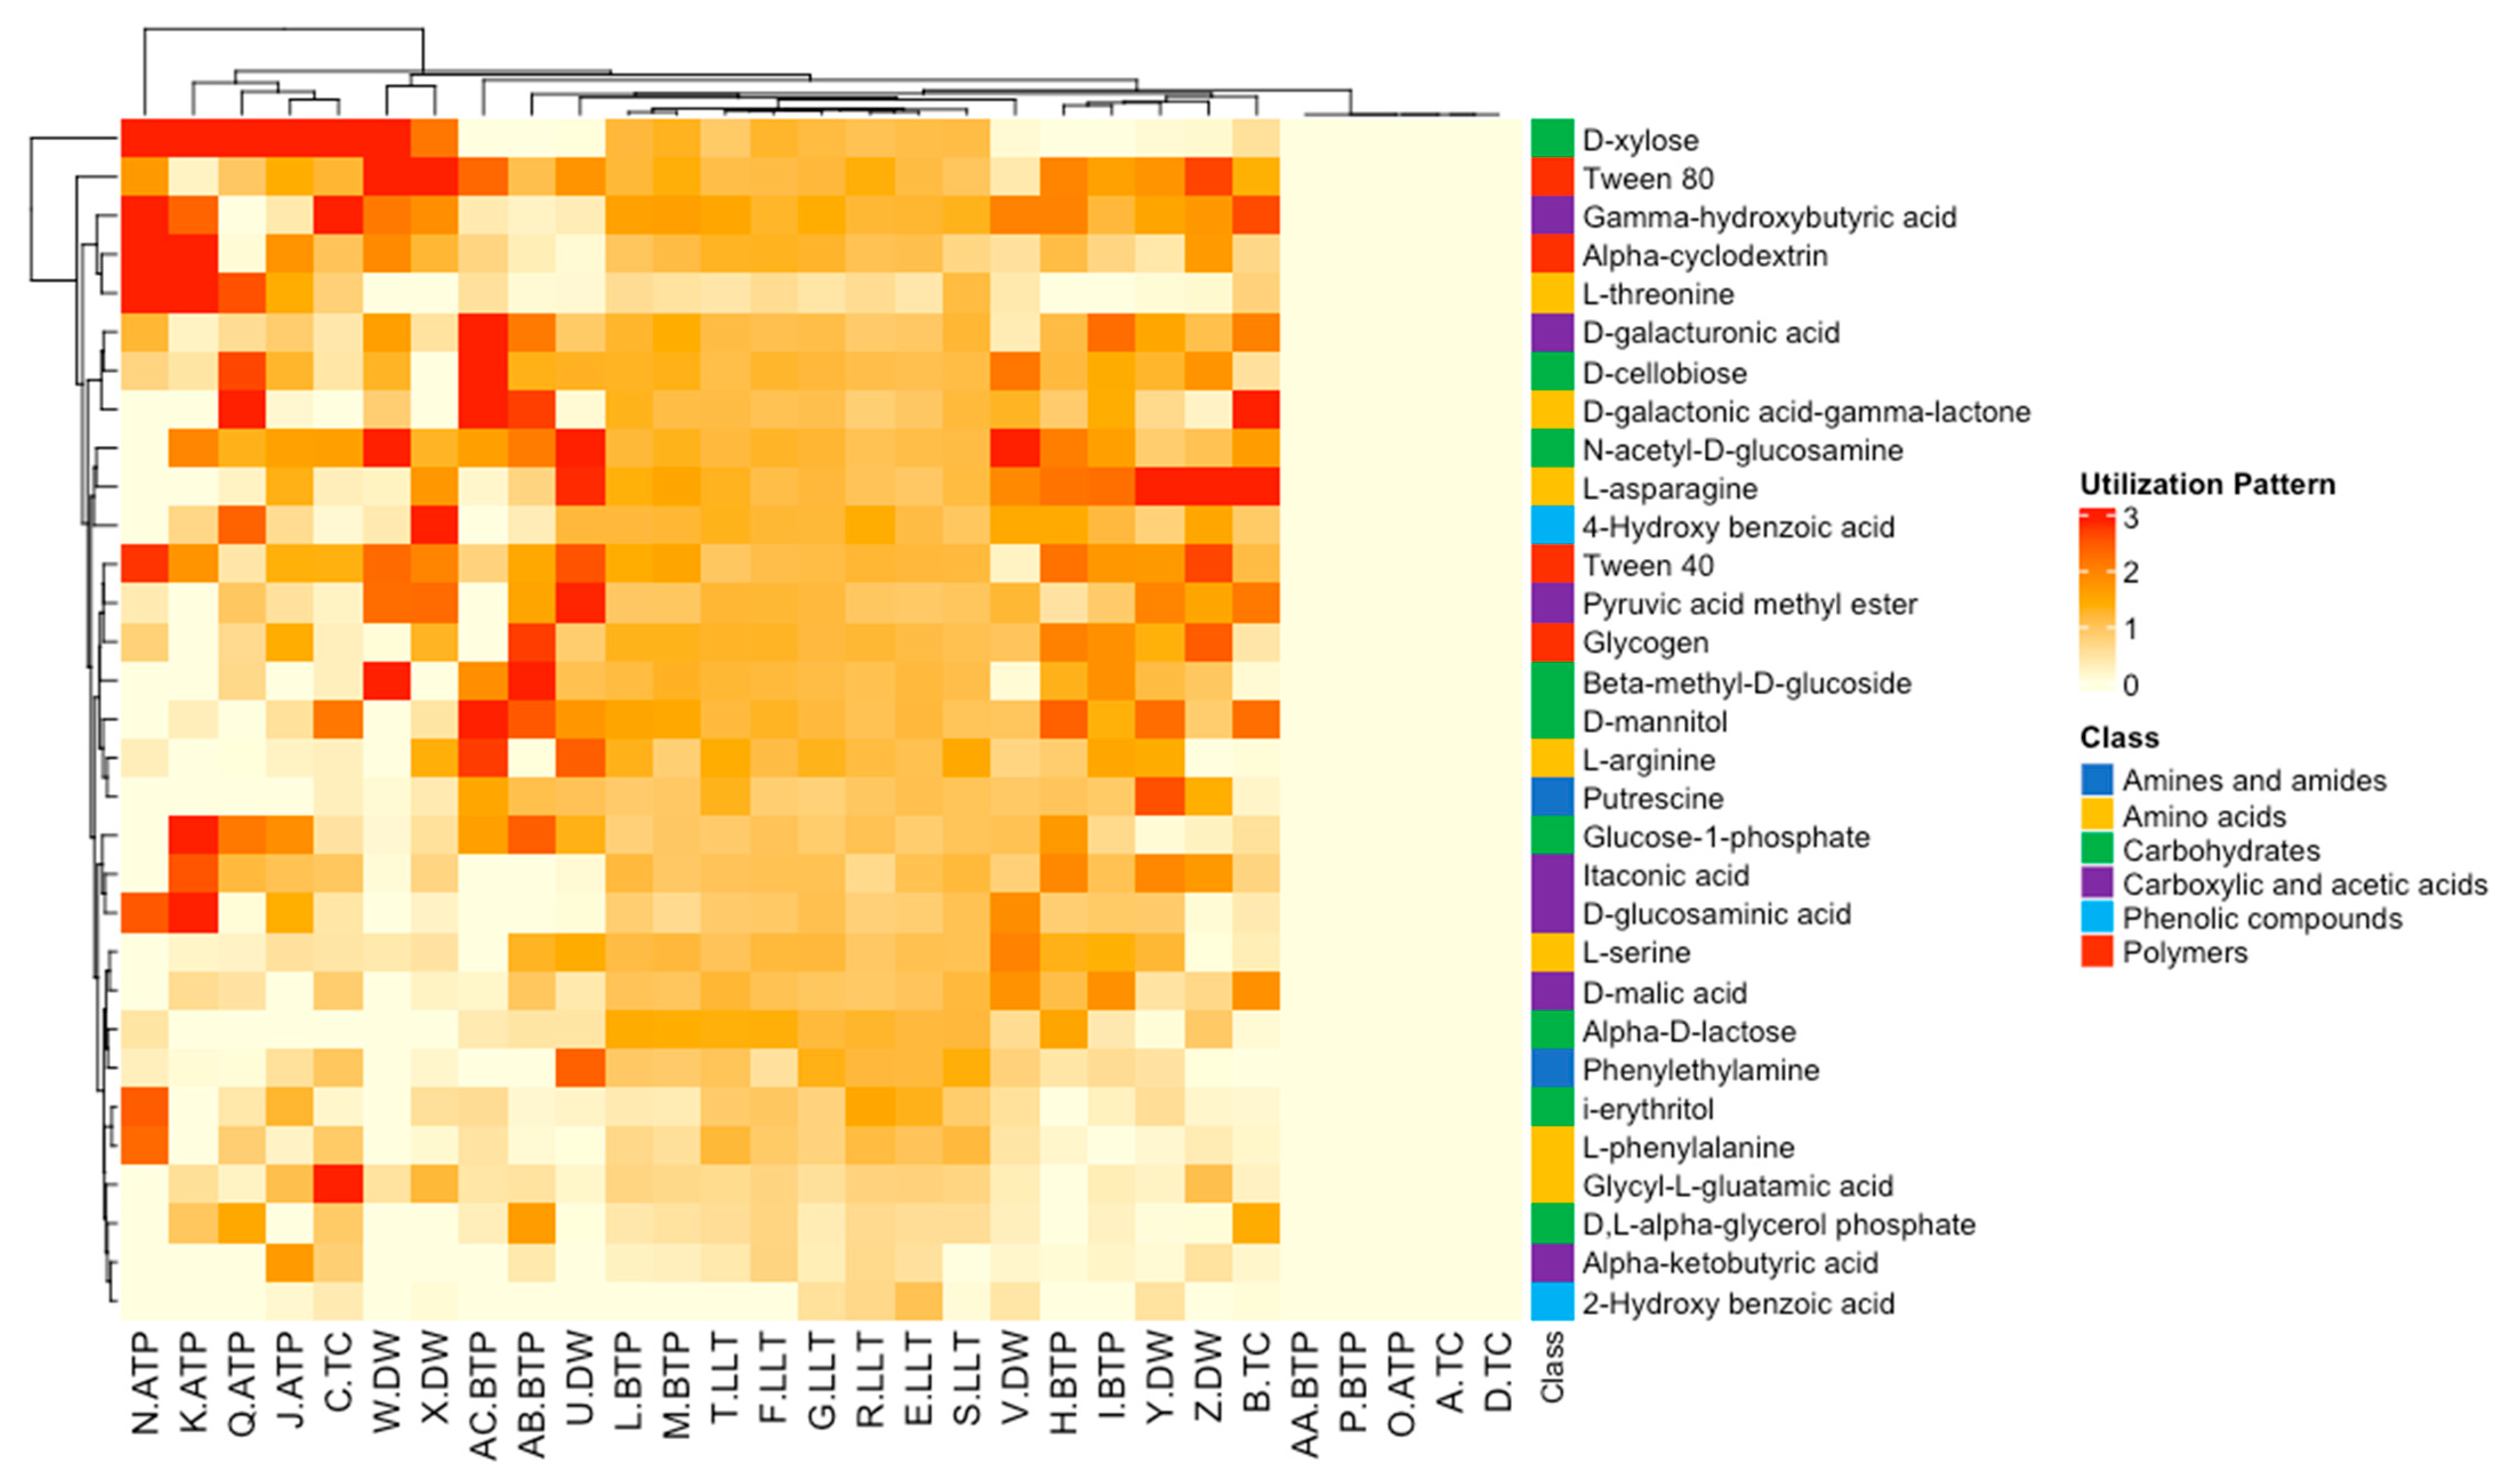
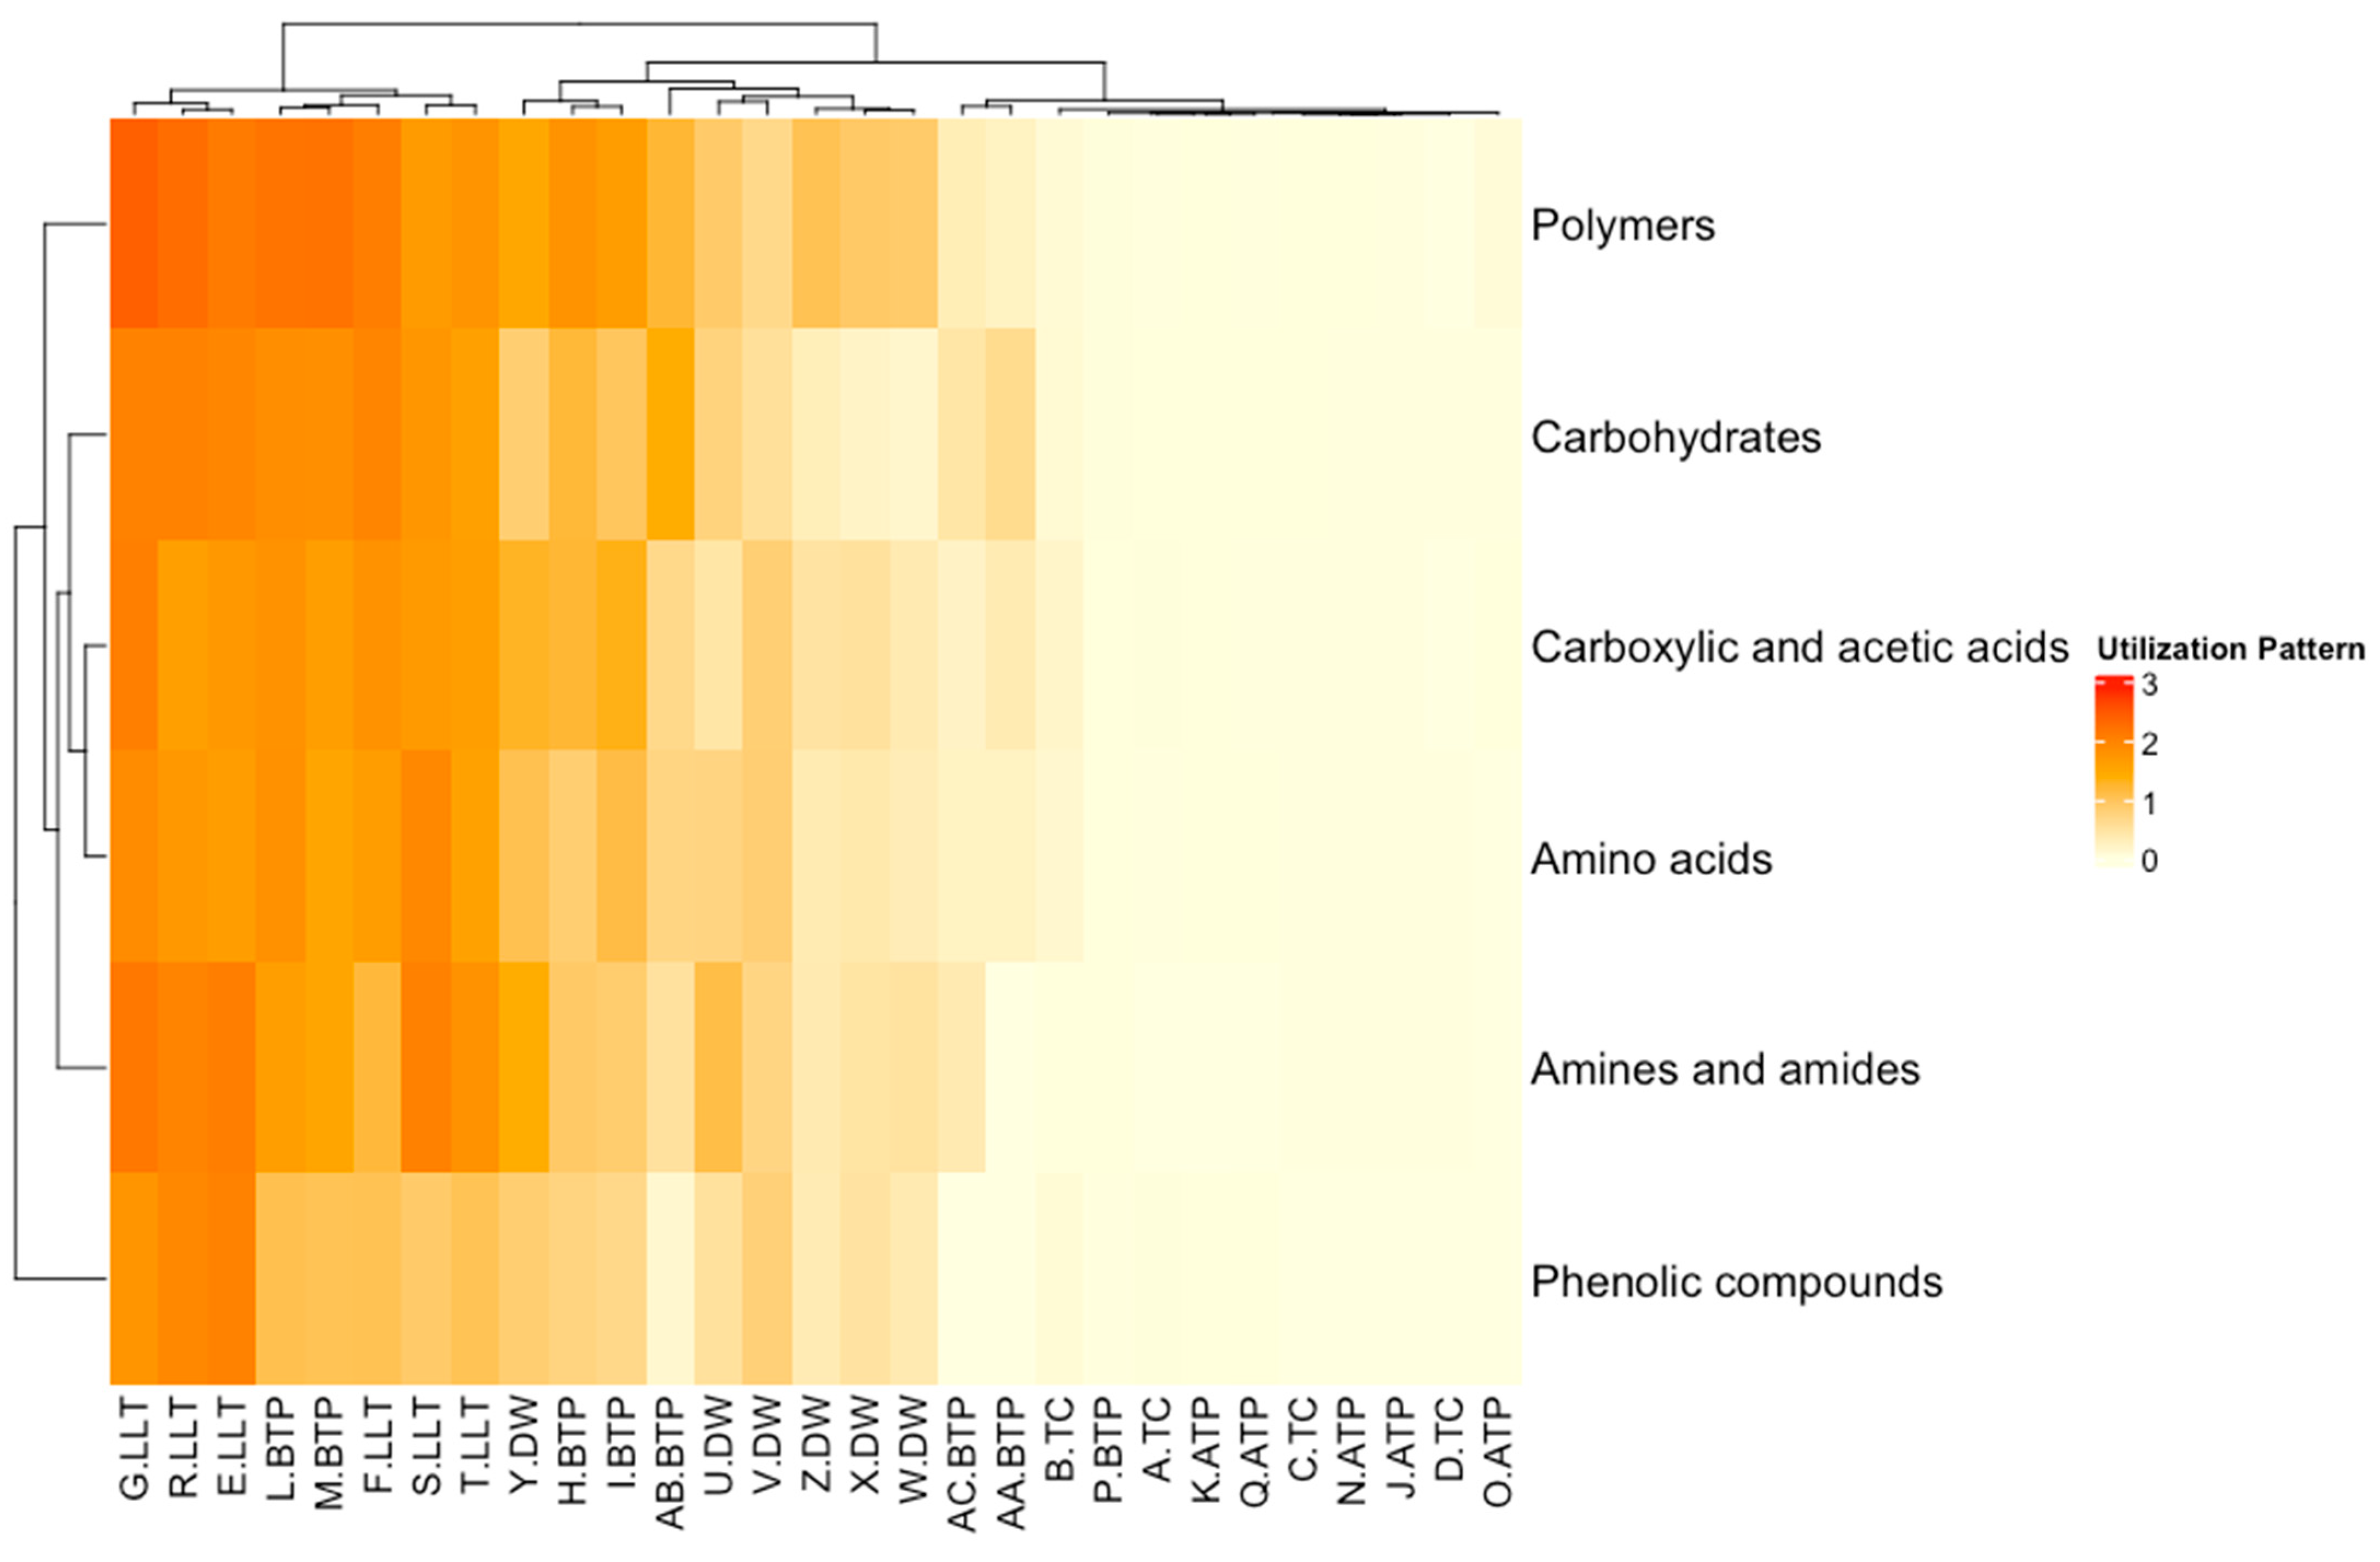
2.3. Microbial Community Physiological Profiles
3. Methods
Supplementary Materials
Author Contributions
Funding
Institutional Review Board Statement
Informed Consent Statement
Data Availability Statement
Conflicts of Interest
References
- Akter, T.; Jhohura, F.T.; Akter, F.; Chowdhury, T.R.; Mistry, S.K.; Dey, D.; Barua, M.K.; Islam, M.A.; Rahman, M. Water quality index for measuring drinking water quality in rural Bangladesh: A cross-sectional study. J. Health Popul. Nutr. 2016, 35, 4. [Google Scholar] [CrossRef] [PubMed]
- Németh, I.; Molnár, S.; Vaszita, E.; Molnár, M. The biolog ecoplate™ technique for assessing the effect of metal oxide nanoparticles on freshwater microbial communities. Nanomaterials 2021, 11, 1777. [Google Scholar] [CrossRef] [PubMed]
- Ge, Z.; Du, H.; Gao, Y.; Qiu, W. Analysis on metabolic functions of stored rice microbial communities by Biolog Eco microplates. Front. Microbiol. 2018, 9, 1375. [Google Scholar] [CrossRef] [PubMed]
- Tobias-Hünefeldt, S.P.; Wing, S.R.; Baltar, F.; Morales, S.E. Changes in microbial community phylogeny and metabolic activity along the water column uncouple at near sediment aphotic layers in fjords. Sci. Rep. 2021, 11, 19303. [Google Scholar] [CrossRef] [PubMed]
- Dumontet, S.; Cavoski, I.; Ricciuti, P.; Mondelli, D.; Jarrar, M.; Pasquale, V.; Crecchio, C. Metabolic and genetic patterns of soil microbial communities in response to different amendments under Organic Farming System. Geoderma 2017, 296, 79–85. [Google Scholar] [CrossRef]
- Koner, S.; Chen, J.-S.; Hsu, B.-M.; Tan, C.-W.; Fan, C.-W.; Chen, T.-H.; Hussain, B.; Nagarajan, V. Assessment of carbon substrate catabolism pattern and functional metabolic pathway for Microbiota of Limestone Caves. Microorganisms 2021, 9, 1789. [Google Scholar] [CrossRef] [PubMed]
- Gałązka, A.; Marzec-Grządziel, A.; Varsadiya, M.; Niedźwiecki, J.; Gawryjołek, K.; Furtak, K.; Przybyś, M.; Grządziel, J. Biodiversity and metabolic potential of bacteria in bulk soil from the peri-root zone of black alder (Alnus glutinosa), silver birch (betula pendula) and Scots pine (pinus sylvestris). Int. J. Mol. Sci. 2022, 23, 2633. [Google Scholar] [CrossRef] [PubMed]
- National Economic and Development Authority—Roadmap for Transport Infrastructure Development for Metro Manila and its Surrounding Areas (Region III and Region IV-A). Available online: https://neda.gov.ph/roadmap-transport-infrastructure-development-metro-manila-surrounding-areas-region-iii-region-iv/ (accessed on 8 April 2023).
- Philippine Statistics Authority—2020 Census of Population and Housing (2020 CPH) Population Counts Declared Official by the President. Available online: https://psa.gov.ph/content/2020-census-population-and-housing-2020-cph-population-counts-declared-official-president (accessed on 23 January 2023).
- Jałowiecki, Ł.; Chojniak, J.M.; Dorgeloh, E.; Hegedusova, B.; Ejhed, H.; Magnér, J.; Płaza, G.A. Microbial community profiles in wastewaters from onsite Wastewater Treatment Systems Technology. PLoS ONE 2016, 11, e0147725. [Google Scholar] [CrossRef] [PubMed]
- Melita, M.; Amalfitano, S.; Preziosi, E.; Ghergo, S.; Frollini, E.; Parrone, D.; Zoppini, A. Physiological profiling and functional diversity of groundwater microbial communities in a municipal solid waste landfill area. Water 2019, 11, 2624. [Google Scholar] [CrossRef]
- HANNA Instruments—HI98194, HI98195, HI98196 Multiparameter Meters Instruction Manual. Available online: https://hanna-worldwide.com/mwdownloads/download/link/id/27 (accessed on 23 January 2023).
- APHA. Standard Methods for Estimation of Water and Wastewater. Available online: https://beta-static.fishersci.com/content/dam/fishersci/en_US/documents/programs/scientific/technical-documents/white-papers/apha-water-testing-standard-methods-introduction-white-paper.pdf (accessed on 23 January 2023).
- United States Environmental Protection Agency (USEPA). SW-846 Test Method 6010D: Inductively Coupled Plasma-Optical Emission Spectrometry (ICP-OES). Available online: https://www.epa.gov/hw-sw846/sw-846-test-method-6010d-inductively-coupled-plasma-optical-emission-spectrometry-icp-oes (accessed on 23 January 2023).
- United States Environmental Protection Agency (USEPA). Method 8270D Semivolatile Organic Compounds by Gas Chromatography/Mass Spectrometry (GC/MS). Available online: https://archive.epa.gov/epa/sites/production/files/2015-12/documents/8270d.pdf (accessed on 23 January 2023).
- United States Environmental Protection Agency (USEPA). Method 8081B Organochlorine Pesticides by Gas Chromatography Methods. Available online: https://www.epa.gov/sites/default/files/2015-12/documents/8081b.pdf (accessed on 23 January 2023).
- Biolog—Microbial Community Analysis with EcoPlates. Available online: https://www.biolog.com/products-portfolio-overview/microbial-community-analysis-with-ecoplates/ (accessed on 23 January 2023).
- Weber, K.P.; Legge, R.L. Community-level physiological profiling. In Methods in Molecular Biology; Springer: Berlin/Heidelberg, Germany, 2009; pp. 263–281. [Google Scholar]
- Sala, M.M.; Arrieta, J.M.; Boras, J.A.; Duarte, C.M.; Vaqué, D. The impact of ice melting on Bacterioplankton in the Arctic Ocean. Polar Biol. 2010, 33, 1683–1694. [Google Scholar] [CrossRef]
- Chou, Y.-M.; Shen, F.-T.; Chiang, S.-C.; Chang, C.-M. Functional diversity and dominant populations of bacteria in banana plantation soils as influenced by long-term organic and conventional farming. Appl. Soil Ecol. 2017, 110, 21–33. [Google Scholar] [CrossRef]


| Sample Code | Sample Type | Temp. [°C] | pH | ORP [mV] | EC [µS/cm] | R [KOhm-cm] | TDS [ppt] | Sal. [psu] | Press. [psi] | DO [ppm] |
|---|---|---|---|---|---|---|---|---|---|---|
| A | TC | 26.51 | 7.05 | 111.00 C | 102.00 A | 0.01 | 49.00 | 0.05 A | 14.54 A | 4.73 |
| B | TC | 28.94 | 6.81 | 122.00 C | 9.00 A | 0.13 | 4.00 | 0.00 A | 14.54 A | 4.39 |
| C | TC | 26.53 | 7.28 | 78.90 C | 133.00 A | 0.01 | 64.00 | 0.06 A | 14.54 A | 4.93 |
| D | TC | 26.97 | 7.09 | 133.20 C | 31.00 A | 0.03 | 15.00 | 0.01 A | 14.54 A | 4.68 |
| E | LLT | 29.61 | 6.67 | −243.97 A,C | 658.33 A | 334.08 | 0.30 | 0.29 A | 14.65 A | 0.14 |
| F | LLT | 29.50 | 7.19 | −100.43 A,C | 665.00 A | 0.00 | 306.67 | 0.29 A | 14.68 A | 0.85 |
| G | LLT | 32.10 | 7.09 | −171.67 A,C | 1181.00 A | 0.00 | 520.00 | 0.51 A | 14.63 A | 1.53 |
| H | BTP | 26.03 | 7.61 | 30.07 | 147.33 | 6.91 | 0.07 | 0.07 | 14.59 | 3.98 |
| I | BTP | 26.22 | 7.48 | 16.97 | 147.33 | 6.93 | 0.07 | 0.07 | 14.59 | 5.67 |
| J | ATP | 26.21 | 7.46 | 622.70 A,B | 147.00 | 6.96 | 0.07 | 0.07 | 14.59 | 4.25 |
| K | ATP | 26.43 | 7.48 | 636.83 A,B | 147.00 | 6.98 | 0.07 | 0.07 | 14.62 | 7.14 |
| L | BTP | 31.08 | 8.02 | 5.07 | 781.33 | 1.43 | 0.35 | 0.34 | 14.71 | 0.24 |
| M | BTP | 31.29 | 7.70 | 2.93 | 790.00 | 1.42 | 0.35 | 0.34 | 14.73 | 0.25 |
| N | ATP | 32.02 | 7.09 | 524.60 A,B | 810.33 | 1.40 | 0.36 | 0.34 | 14.72 | 0.27 |
| O | ATP | 26.99 | 8.05 | 466.77 A,B | 147.67 | 7.03 | 0.07 | 0.07 | 14.69 | 0.23 |
| P | BTP | 30.61 | 7.01 | 579.80 | 785.00 | 1.41 | 0.35 | 0.34 | 14.65 | 0.38 |
| Q | ATP | 27.22 | 7.36 | 595.37 A,B | 151.33 | 0.01 | 72.67 | 0.07 | 14.60 | 0.25 |
| R | LLT | 30.34 | 7.25 | −222.13 A,C | 665.00 A | 1.66 | 0.30 | 0.29 A | 14.69 A | 0.41 |
| S | LLT | 29.06 | 6.91 | −16.47 A,C | 307.33 A | 111.57 | 0.14 | 0.13 A | 14.72 A | 0.00 |
| T | LLT | 30.96 | 7.45 | 23.10 A,C | 681.67 A | 1.64 | 0.31 | 0.29 A | 14.71 A | 0.01 |
| U | DW | 29.36 | 7.04 | −8.63 B | 568.33 | 1.91 | 0.26 | 0.25 | 14.58 | 0.00 |
| V | DW | 29.22 | 8.65 | −70.30 B | 551.00 | 1.96 | 0.26 | 0.24 | 14.64 | 0.00 |
| W | DW | 29.46 | 7.04 | −77.90 B | 535.00 | 2.03 | 0.25 | 0.23 | 14.62 | 0.00 |
| X | DW | 28.22 | 8.62 | −87.17 B | 564.33 | 1.90 | 0.27 | 0.25 | 14.66 | 0.00 |
| Y | DW | 28.04 | 7.53 | −91.90 B | 465.00 | 2.28 | 0.22 | 0.21 | 14.63 | 0.00 |
| Z | DW | 28.60 | 7.91 | −59.77 B | 402.67 | 2.66 | 0.19 | 0.18 | 14.69 | 0.00 |
| AA | BTP | 26.12 | 8.05 | −16.13 | 147.67 | 6.93 | 0.07 | 0.07 | 14.45 | 0.00 |
| AB | BTP | 23.84 | 8.57 | 68.50 | 139.33 | 7.03 | 0.07 | 0.07 | 14.59 | 0.00 |
| AC | BTP | 24.72 | 7.61 | 24.37 | 138.33 | 7.17 | 0.07 | 0.06 | 14.60 | 0.00 |
| Sample Code | Sample Type | Arsenic [mg/L] | Lead [mg/L] | Cadmium [mg/L] | Mercury [mg/L] | PAHs [ug/L] | OCPs [ug/L] |
|---|---|---|---|---|---|---|---|
| A | TC | <MDL | <MDL | <MDL | <MDL | ND | ND |
| B | TC | <MDL | <MDL | <MDL | <MDL | ND | ND |
| C | TC | <MDL | <MDL | <MDL | <MDL | ND | ND |
| D | TC | <MDL | <MDL | <MDL | <MDL | ND | ND |
| E | LLT | <MDL | 0.734 | 0.014 | 0.00018 | <MDL | <MDL |
| F | LLT | 0.008 | 0.22 | 0.012 | 0.0017 | <MDL | <MDL |
| G | LLT | <MDL | 1.686 | 0.006 | 0.002 | <MDL | <MDL |
| H | BTP | <MDL | 0.074 | <MDL | 0.0012 | <MDL | <MDL |
| I | BTP | <MDL | 0.068 | <MDL | 0.0013 | <MDL | <MDL |
| J | ATP | <MDL | 0.062 | <MDL | 0.0011 | <MDL | <MDL |
| K | ATP | <MDL | 0.054 | <MDL | 0.0012 | <MDL | <MDL |
| L | BTP | <MDL | 0.064 | <MDL | 0.0012 | <MDL | <MDL |
| M | BTP | <MDL | 0.026 | <MDL | 0.0012 | <MDL | <MDL |
| N | ATP | <MDL | 0.024 | <MDL | 0.0014 | <MDL | <MDL |
| O | ATP | <MDL | <MDL | <MDL | <MDL | <MDL | <MDL |
| P | BTP | <MDL | 0.001 | <MDL | <MDL | <MDL | <MDL |
| Q | ATP | <MDL | 0.001 | <MDL | <MDL | <MDL | <MDL |
| R | LLT | <MDL | <MDL | <MDL | <MDL | <MDL | <MDL |
| S | LLT | <MDL | <MDL | <MDL | <MDL | <MDL | <MDL |
| T | LLT | <MDL | <MDL | <MDL | <MDL | <MDL | <MDL |
| U | DW | <MDL | <MDL | <MDL | 0.0002 | <MDL | <MDL |
| V | DW | <MDL | <MDL | <MDL | 0.0003 | <MDL | <MDL |
| W | DW | <MDL | <MDL | <MDL | 0.0002 | <MDL | <MDL |
| X | DW | <MDL | <MDL | <MDL | 0.0004 | <MDL | <MDL |
| Y | DW | <MDL | <MDL | <MDL | 0.0007 | <MDL | <MDL |
| Z | DW | <MDL | <MDL | <MDL | 0.003 | <MDL | <MDL |
| AA | BTP | <MDL | <MDL | <MDL | 0.0005 | <MDL | <MDL |
| AB | BTP | <MDL | <MDL | <MDL | 0.0002 | <MDL | <MDL |
| AC | BTP | <MDL | <MDL | <MDL | 0.0004 | <MDL | <MDL |
| Sample Code | Sample Type | AWCD | CMD |
|---|---|---|---|
| A | TC | 0.01483870968 (0.01296822339) B | 0 B |
| B | TC | 0.1164086022 (0.05841774577) B | 5 B |
| C | TC | 0.0116344086 (0.005071941683) B | 0 B |
| D | TC | 0.0008924731183 (0.001545808785) B | 0 B |
| E | LLT | 1.82394623700 (0.0859611085) A,B | 31 A,B |
| F | LLT | 1.734043011 (0.06011458304) A,B | 30 A,B |
| G | LLT | 2.037892473 (0.08508079244) A,B | 31 A,B |
| H | BTP | 1.119387097 (0.5999576216) | 25 |
| I | BTP | 1.143666667 (0.2180662634) | 24 |
| J | ATP | 0.008462365591 (0.003574148907) A | 0 A |
| K | ATP | 0.01991397849 (0.01713581463) A | 0 A |
| L | BTP | 1.797129032 (0.1438013863) | 30 |
| M | BTP | 1.67955914 (0.2894580503) | 29 |
| N | ATP | 0.008516129032 (0.006719673076) A | 0 A |
| O | ATP | 0.005677419355 (0.005017451335) A | 0 A |
| P | BTP | 0.02705376344 (0.02855444319) | 0 |
| Q | ATP | 0.01431182796 (0.009223794803) A | 0 A |
| R | LLT | 1.879408602 (0.01568074879) A,B | 31 A,B |
| S | LLT | 1.719462366 (0.1569285392) A,B | 30 A,B |
| T | LLT | 1.553505376 (0.344758706) A,B | 30 A,B |
| U | DW | 0.6966236559 (0.2111123366) | 13 |
| V | DW | 0.7065591398 (0.6286307092) | 14 |
| W | DW | 0.3399784946 (0.4529326825) | 9 |
| X | DW | 0.4320322581 (0.5781944527) | 10 |
| Y | DW | 1.102913978 (0.4458875064) | 19 |
| Z | DW | 0.4518602151 (0.06537119126) | 16 |
| AA | BTP | 0.2282043011 (0.2012599862) | 9 |
| AB | BTP | 0.8999032258 (0.1105057384) | 18 |
| AC | BTP | 0.2719892473 (0.1583313756) | 10 |
Disclaimer/Publisher’s Note: The statements, opinions and data contained in all publications are solely those of the individual author(s) and contributor(s) and not of MDPI and/or the editor(s). MDPI and/or the editor(s) disclaim responsibility for any injury to people or property resulting from any ideas, methods, instructions or products referred to in the content. |
© 2023 by the authors. Licensee MDPI, Basel, Switzerland. This article is an open access article distributed under the terms and conditions of the Creative Commons Attribution (CC BY) license (https://creativecommons.org/licenses/by/4.0/).
Share and Cite
Obusan, M.C.M.; Castro, A.E.; Villanueva, R.M.D.; Isagan, M.D.E.; Caras, J.A.A.; Simbahan, J.F. Physico-Chemical Quality and Physiological Profiles of Microbial Communities in Freshwater Systems of Mega Manila, Philippines. Data 2023, 8, 103. https://doi.org/10.3390/data8060103
Obusan MCM, Castro AE, Villanueva RMD, Isagan MDE, Caras JAA, Simbahan JF. Physico-Chemical Quality and Physiological Profiles of Microbial Communities in Freshwater Systems of Mega Manila, Philippines. Data. 2023; 8(6):103. https://doi.org/10.3390/data8060103
Chicago/Turabian StyleObusan, Marie Christine M., Arizaldo E. Castro, Ren Mark D. Villanueva, Margareth Del E. Isagan, Jamaica Ann A. Caras, and Jessica F. Simbahan. 2023. "Physico-Chemical Quality and Physiological Profiles of Microbial Communities in Freshwater Systems of Mega Manila, Philippines" Data 8, no. 6: 103. https://doi.org/10.3390/data8060103
APA StyleObusan, M. C. M., Castro, A. E., Villanueva, R. M. D., Isagan, M. D. E., Caras, J. A. A., & Simbahan, J. F. (2023). Physico-Chemical Quality and Physiological Profiles of Microbial Communities in Freshwater Systems of Mega Manila, Philippines. Data, 8(6), 103. https://doi.org/10.3390/data8060103