1. Introduction
The concept of Industry 4.0 is the name given to the current trend of digitalization and the related automation of production. One of the cornerstones is the collection of data from industrial machines, without which it would be impossible to meet the goals and vision of this concept. A major challenge is the digitization of current industrial processes and machines, which often need to be equipped with a sensor system and start the digitization process from scratch [
1].
One such example is the industrial press located at Brose, Kopřivnice. It is a large hydraulic industrial press used to create sheet metal moldings used in the automotive industry. The press contains two hydraulic cylinders working in parallel.
The individual motors and the operation of the press are controlled by a programmable logic controller (PLC), which also provides basic diagnostic data.
This work aims to develop a system for collecting a large amount of data, reflecting the current operating conditions and the state of the hydraulic press. Based on this data, the goal is to create a suitable dataset that can be subsequently used for standstill accounting tasks to predict diagnostics and optimize machine operation. At the same time, it is planned to use the created dataset as the basic input matrix of a digital twin press.
By combining these techniques, it is possible to achieve a higher sustainability of the machine operation, optimization of the operation, prediction of its maintenance, increase in efficiency with the possibility of optimization of the machine stroke and thus, ultimately, a reduction of the operating costs [
2].
Edge computing is a distributed computing paradigm that brings computing resources closer to where data are generated, processed, and consumed. In edge computing, data are processed at the edge of the network, which can be a device, a sensor, a gateway, or a server located in close proximity to the data source. The goal of edge computing is to reduce the latency and bandwidth required to transfer data between the data source and a centralized cloud data center [
3,
4].
Fog computing is a variant of edge computing that refers to a hierarchical architecture where computing resources are distributed across the network from the edge to the cloud. In fog computing, the computing resources are located closer to the edge than in cloud computing, but they are still centralized and managed by a cloud service provider [
5].
Cloud computing is a centralized computing paradigm where computing resources are delivered over a network as a service. In cloud computing, the computing resources are located in remote data centers managed by a cloud service provider. Cloud computing provides on-demand access to a variety of computing resources, including storage, processing power, and software applications [
4].
The main difference between edge computing and cloud computing is that edge computing brings computing resources closer to the data source, while cloud computing centralizes computing resources in remote data centers. The main difference between fog computing and both edge and cloud computing is that fog computing is a hybrid architecture that combines the benefits of edge and cloud computing [
6].
The solution described in the text is an edge computing solution because it involves the collection, pre-processing, and analysis of data at the edge of the network, close to the source of the data. In this case, the edge device is an industrial hydraulic press. By performing data processing and analysis at the edge, the solution minimizes the amount of data that needs to be sent to the cloud for further processing, which can reduce latency and improve overall system performance. Additionally, the solution includes data normalization methods, which can help to reduce the amount of data that needs to be transmitted and stored, further reducing network congestion and storage requirements. Overall, the use of edge computing in this solution enables more efficient and effective data management and analysis for the purpose of further digitizing industrial operations.
2. Related Works
In the research and development of the precise closed-loop control system in a large hydraulic press, the touch screen and PLC are frequently applied to design, debug, and test the system. Though a better closed-loop control characteristic can be acquired after repeated testing in this way, the comprehensive state data of the hydraulic press are unable to get, which leads to a long research cycle and also restricts the maintenance and upgrade of the equipment in the later period [
7,
8].
Retrofits of hydraulic and mechanical deep drawing presses often stop with the exchange of the electrical and the hydraulic parts. However, that is only half the job. The use of high-definition control electronics, faster CPUs, and more dynamic hydraulic actuators offers the opportunity of redesigning the already existing control concepts of the press. Reference describes the performance improvement of the press, i.e., the control quality, can be increased for hydraulic ram and cushion axes [
9,
10].
A system capable of monitoring loading, stress, and strain, based on fatigue reliability analysis theory, has been developed in this paper. The 800 MN die-forging hydraulic press body structure system in pre-tightened condition was studied and developed as capable of loading, stress and strain monitoring, and data processing methods [
11,
12].
To reduce carbon emission intensity and improve energy efficiency, the overall carbon emissions of hydraulic presses were first analyzed. For a series of intermediate energy conversions in working processes, it is essential to understand and identify the energy dissipation characteristics of the investigated presses. Then, some energy-matching methods for the hydraulic drive system and a group of hydraulic presses in the manufacturing system were presented to implement energy reduction. Finally, the proposed methodology shows great energy-saving potential in sheet metal forming hydraulic presses [
13].
This paper presents an approach for implementing artificial intelligence (AI) in the concept of smart hydraulic press with regard to I4.0 concept. Conceptual solutions for greater system flexibility and improved blanket formability focus on designing a suitable concept for cyber-physical systems in combination with the digital twin. The main challenge is to develop a suitable AI-based algorithm in the manufacturing execution system (MES) so that the system can improve the forming process and avoid disturbances in real-time. The concept of visualization and data analysis based on real-time monitoring of the parameters of a smart hydraulic press is presented. With continuous quality control of the products, a more sophisticated system can be achieved. The main advantage to take into account in terms of hydraulics and Manufacturing as a Service (MaaS) are the new trends in the energy efficiency of the systems and rapid automatic tool exchange [
14,
15].
The overall equipment effectiveness (OEE) is a management ratio to evaluate the added value of machine tools. Unplanned machine downtime reduces the operational availability and, therefore, the OEE. Increased machine costs are the consequence. An important cause of unplanned machine downtimes is the total failure of ball screws of the feed axes due to wear. Therefore, monitoring the condition of ball screws is important. Common concepts rely on high-frequency acceleration sensors from external control systems to detect a change in the condition [
16].
For the problem of data accumulation caused by massive sensor data in transmission line condition monitoring system, this paper analyzes the type and amount of data in the transmission line sensor network, compares the compression algorithms of wireless sensor network data at home and abroad, and proposes an efficient lossless compression algorithm suitable for sensor data in transmission line linear heterogeneous networks. The algorithm combines the wavelet compression algorithm and the neighborhood index sequence algorithm. It displays a fast operation speed and requires a small amount of calculation. It is suitable for battery-powered wireless sensor network nodes. By combining wavelet correlation analysis and neighborhood index sequence coding, the compression algorithm proposed in this paper can achieve a high compression rate, has strong robustness to packet loss, has high compression performance, and can help to reduce network load and the packet loss rate [
17].
3. Technology Description
Hydraulic press in Brose CZ spol. s r.o. is used for pressing sheet metal parts for the automotive industry. It is a large industrial press reaching a height of over 7.5 m.
The hydraulic press is operated by asynchronous 3-phase motors of 75 kW (high pressure) and 132 kW (press and stroke). The motors are coupled with axial piston pumps 3OR-PPH25N00, Rexrooth (132 kW) and QX63-080 R08, Bucher (75 kW—high pressure). The press contains two hydraulic cylinders working synchronously.
The control system is based on a Siemens Simatic 1200 industrial logic controller (PLC). The PLC comprehensively controls the function of the press. In addition to the control tasks, the PLC also measures large amounts of data, which it provides to an industrial computer for further processing—Edge Computing.
The entire system is controlled by the PLC. The PLC is also used as the main link for collecting the press operating data. The operating data are collected at the maximum frequency that the PLC allows. The measuring cycle of data acquisition ranges from 5 ms to 10 ms. Based on the measurement cycle, over 7 million records are generated daily. In the event of a temporary interruption of the press cycle, the number of records generated is reduced. On average, the dataset contains 6.55 million records. Each record contains 51 values (data and timestamp), and the values are stored in a CSV file. Each CSV has an average size of 1.44 GB of data.
Boolean data types are used primarily as state variables in this particular dataset. Another group of data has the data type integer (int), which is mainly measured data by sensors. Data can be divided into several groups:
It is a comprehensive data package that provides a complete data frame on the current state of the press.
4. Methods
The use of statistical and data mining methods is common in many areas of science and engineering. However, applying these methods to real-world problems is often difficult, in part because the data used are not in the required form. This section introduces the problem of data preprocessing, which is the process of converting raw PLC data into a suitable form for further analysis; this section covers the topic of a block
Signal preprocessing of the diagram depicted in
Figure 1.
4.1. Signal Preprocessing
The raw PLC signals are divided into individual CSV files, each containing 10-s sequences. The first step in the preprocessing pipeline is to bundle these raw data into hour-long sequences, also in CSV format. The pressing force of the hydraulic press must be derived from the signals of the two internal cylinder pressure sensors, as this information is not provided directly in the PLC data. After calculating the pressing force signal, the first resampling step is performed. The intended raw sampling frequency is 125 Hz, with a period of 8 ms. However, an analysis of the signals reveals that the PLC system is not technically capable of maintaining a stable sampling frequency, and the period fluctuates around 12 ms with a standard deviation of 2 ms. To stabilize the sampling frequency, the signal is resampled to 125 Hz using average filtering. This resampling step is not intended for data reduction but rather to align the signals and facilitate further data processing. The timestamps of the signals were then reindexed as well, so they correspond to the 125 Hz sampling rate.
4.2. Data Reduction and Anomaly Detection
Goal of the phase is to reduce the number of data points for further processing with a good trade-off between data reduction and the error of the subsampled signal to run an anomaly detection process in the data with the goal of identifying signal sequences which contain so-called micro-interruptions, which happen during the pressins sequence in irregular intervals, during the operational state of the press for further analysis of these events.
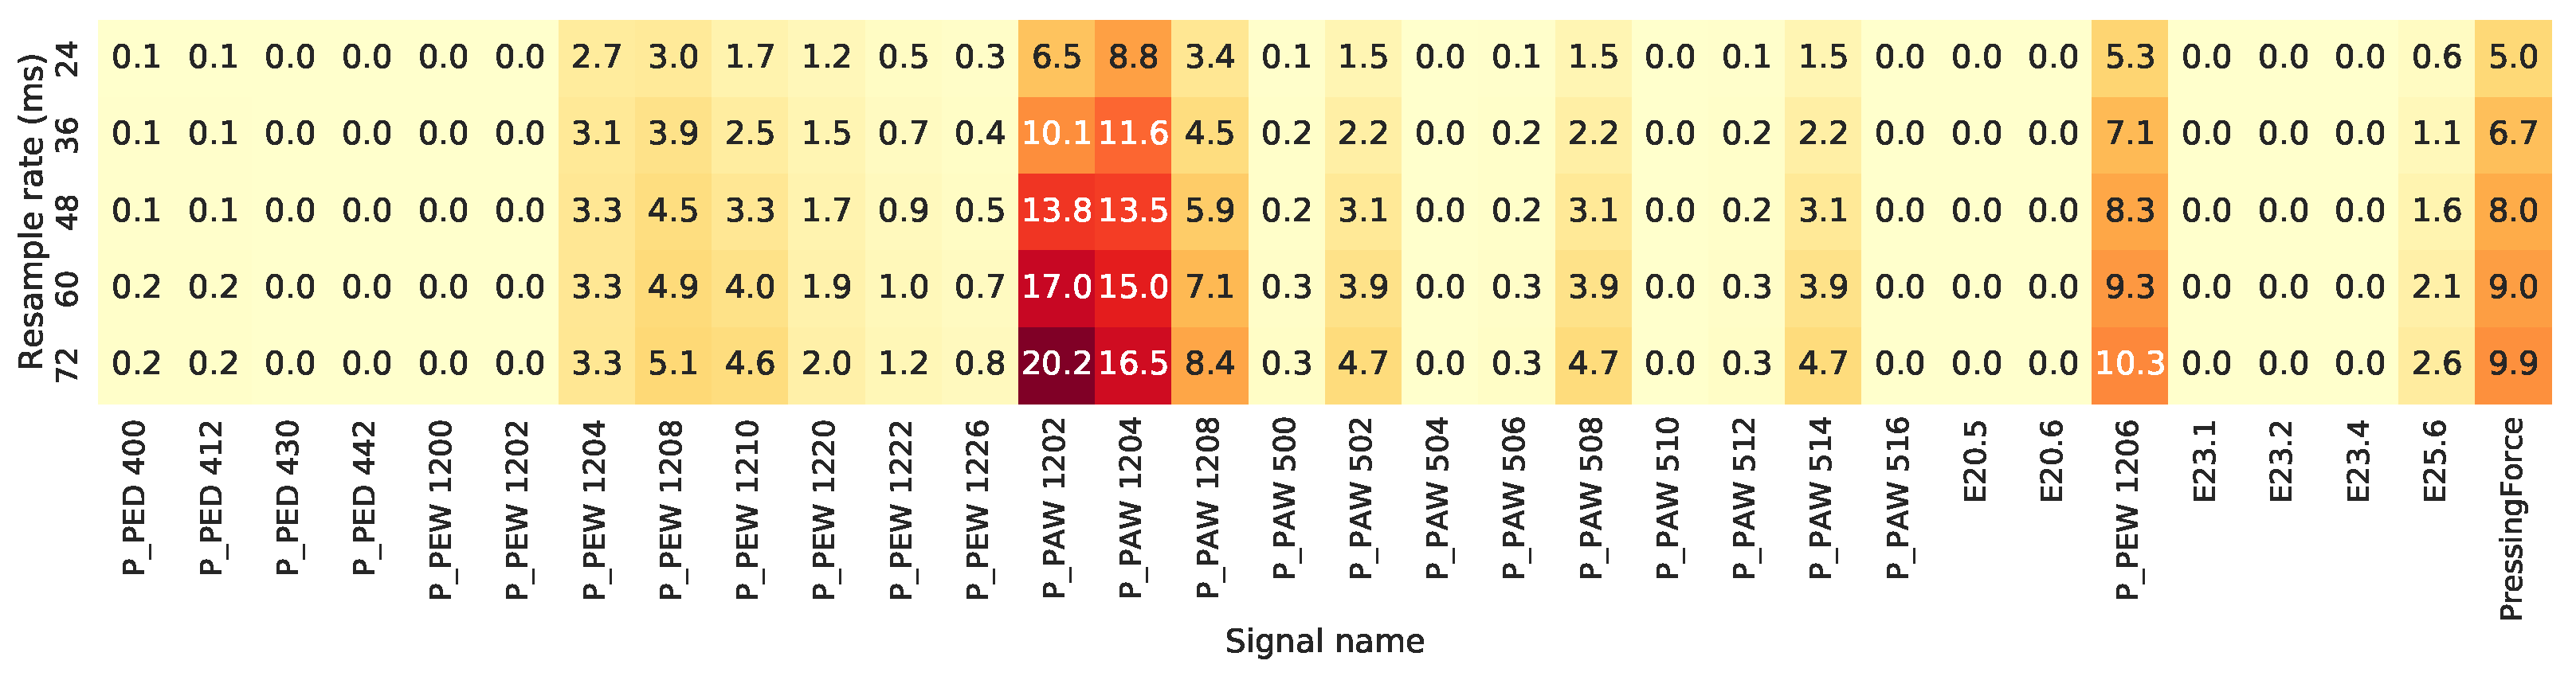
After finalizing the preprocessing steps of the previous phase, data reduction is applied through signal subsampling. We have conducted several experiments with subsampling rates in the range of 12 to 72 ms. SMAPE [
18] (Symmetric Mean Absolute Percentage Error, defined in Equation (
1)) was chosen as an error metric because of the need not only to sub-sample the data but also to introduce the lowest error possible so there is no significant distortion in the signal. The subsampling signal period of 24 ms was chosen due to only 5.00% SMAPE for the main pressing force signal and peak SMAPE 8.8% for the pressure control oil sensor (the
P_PAW 1204 signal in the dataset), but also for the good data reduction properties, as the number of data points that need to be processed is reduced by half. We can see an individual SMAPE reconstruction error using various subsampling rates depicted in
Figure 2.
The data collection process collects data points constantly; however, the hydraulic press is not in an operating state at all times, as there are shift changes, material replenishment, and similar events during the day regularly. Due to this fact, the data are filtered by operation state before further processing, as only the data during the regular operating state are suitable for the analysis. The hydraulic press state is recorded in the logbook, so filtering of meaningful data are possible. The result of this step is a collection of signal sequences during which the hydraulic press was fully operating.
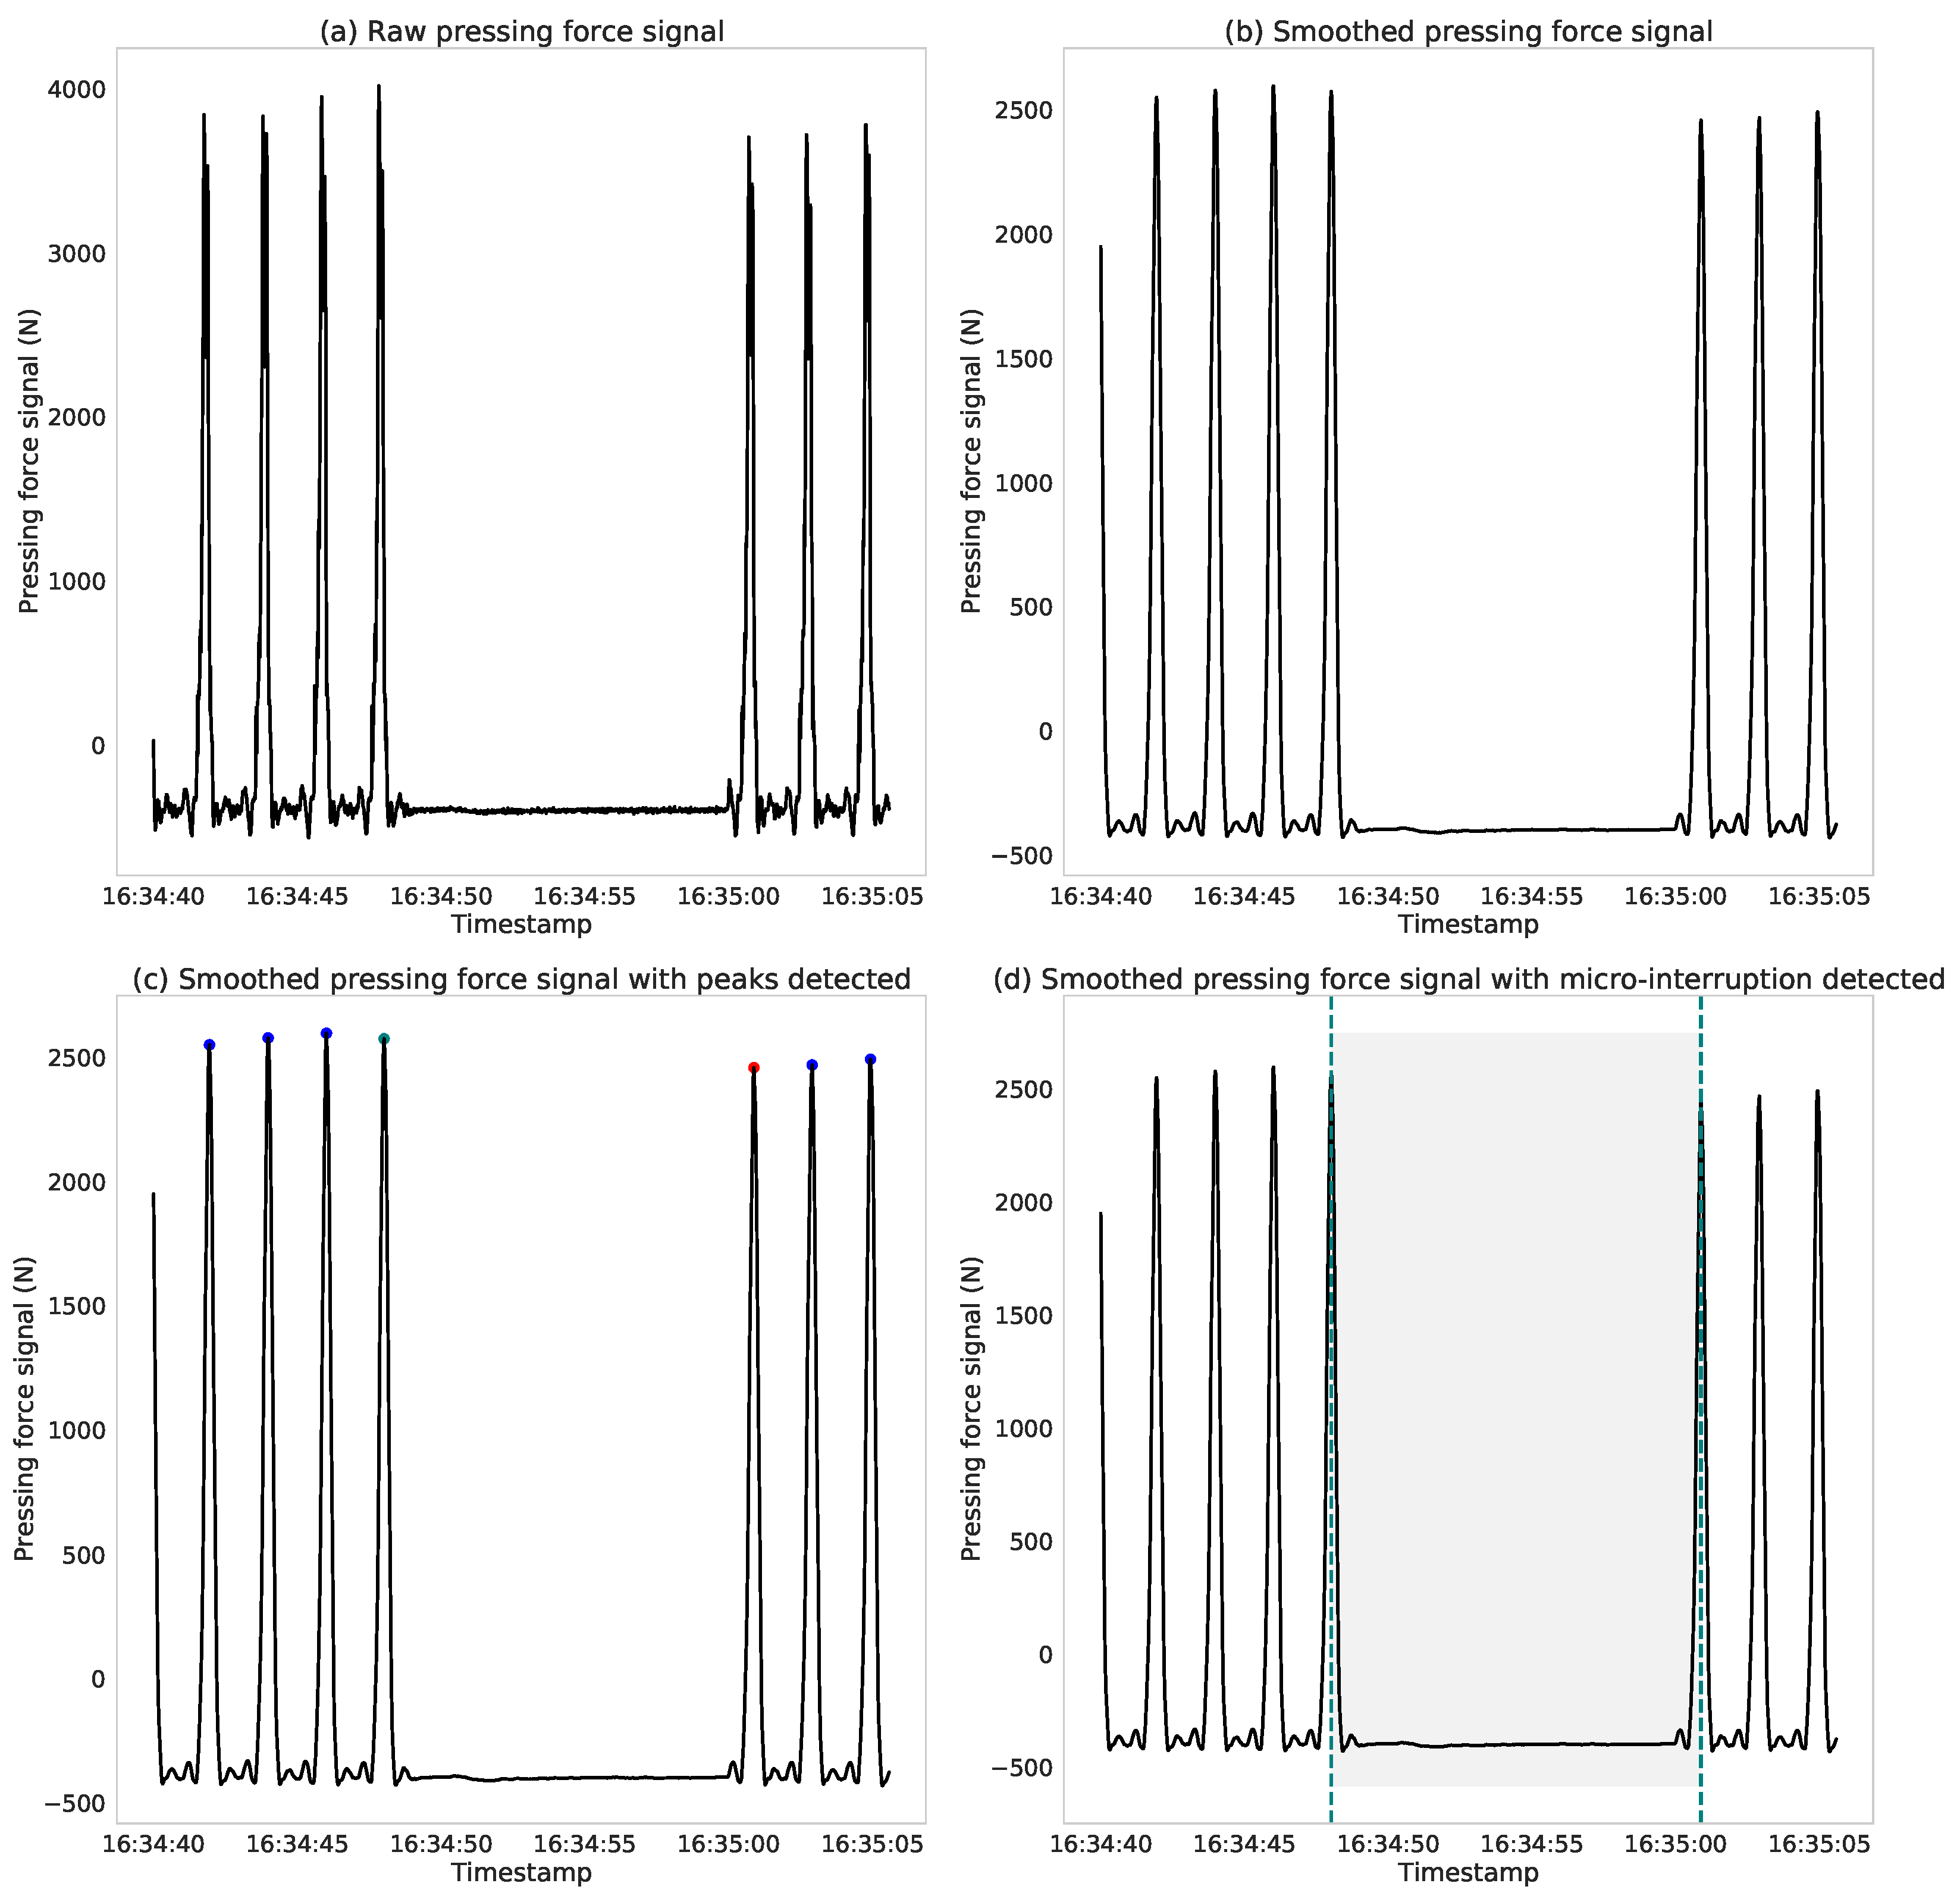
The purpose of the anomaly detection phase is to detect the so-called micro-interruptions in the pressing force signal; an example of such an event is depicted in
Figure 3 which causes irregularities in the pressing cycles, so a more detailed analysis of its occurrences is needed.
The anomaly detection methodology we propose in this work uses the individual pressing force signal sequences from the operating-state signal collection and marks them for further analysis if there are one or more micro-interruptions present in the signal. The biggest advantage of this approach is that only a single signal time series is needed; thus, there is very little performance overhead, and it is possible to perform the step using an edge computing device on-premise and subsequently transfer only the selected data to the cloud.
The proposed methodology consists of three consecutive steps:
- 1.
Rolling median smoothing: As discussed in
Section 4.1, the signal sampling frequency is unstable; therefore, there is the possibility of signal distortion to be present and also that the peaks are not perfectly aligned because of this. Due to this caveat, a rolling median filtering is performed on the differenced signal using a window of 24 samples, which prevents the formation of a peak misdetection due to the signal noise. We can see the difference between the raw and filtered signal in
Figure 3a,b; there is a clear difference in the signal peak area as there is more noise present in the raw signal compared to the filtered one.
- 2.
Press cycle peak localization: The filtered signal is then used as input for a peak detection algorithm. The formed peaks can be localized very precisely in the correctly preprocessed signal; thus, only a 1-D local maxima detector based on a comparison of neighboring values is needed. Only two parameters need to be specified; the first is the minimum height of the peak ; the value depends on the domain, as each hydraulic press may produce different absolute levels of the measured signal; the other parameter is the minimum distance between two consecutive peaks as there might occur a false positive event in case of signal distortion around the local maxima; the value of this parameter depends on the time frame of the press cycle. We have selected the parameters based on the measured signal data; thus, for the pressing force signal in the proposed dataset, value of 3000 and a value of of 3840 ms were used.
- 3.
Micro-interruption localization: The input press signal is cyclical, with a time frame of approximately 4536 ms between two consecutive cycles. Thus, the first step is to treat the detected peak positions as an additional signal and to perform a differencing of them. If there is no micro-interruption present, the differenced signal is flat, i.e., the values are nearly constant, as there is very little difference among the peak position differences. However, if there is any micro-interruption, there is a significant difference compared to the normal operation state, i.e., the peak-to-peak differenced signal value is higher, which is easily detectable using a threshold value.
4.3. Data Transfer and Storage
Anomaly detection methodology enables us to detect periods of time with irregularities in the pressing cycles present. These time frames are then grouped into blocks by the hour, compressed, and transferred by the SFTP protocol to cloud storage. A relational database is used for storing the transferred signal data as the data have a defined fixed structure. Data bundles are decompressed after the transfer and inserted in bulk into the database. This approach makes the subsequent, more demanding exploration analysis of the data and visualization possible.
The raw acquired signal data are valuable from a research point of view. To prevent loss of these data, the raw signal with stable sampling frequency is transferred to cloud storage in the daily bundles during the nightly downtime of the press and archived.
5. Experiment Design
The methodology described in
Section 4.2 enabled us to precisely label suspicious segments of the pressing force signal in the form of micro-interruptions. However, the methodology consists of several consecutive steps, which require several procedures such as median smoothing and peak detection performed, which makes it difficult to employ in an online detection system. We have decided to automate the whole procedure further using an artificial intelligence model. Deep learning and machine learning are widely used for time series analysis in the I4.0 concept solutions [
19,
20,
21], thus, we have designed and trained our own neural network model for the micro-interruption, or even other anomaly states, detection as well. We used the publicly available part of the data in the experiments, and the created training and testing datasets are publicly available alongside the raw data.
The pressing force signal was divided into approx. 10 s long non-overlapping windows; thus, each data point in the set is represented as a vector of 830 consecutive values. As we have already extracted the micro-interruption (anomaly) timestamp of the beginning and end of the anomaly signal segment in the past steps, we labeled each window with either label 0 if only normal pressing cycles occurred during its period or label 1 if there was an anomaly present. As there were breaks in the press production periods, we have used only periods of the data in which the hydraulic press operated for more than 5 min in the created dataset; thus, there is no noise in the data caused by test runs during service procedures, etc. The created dataset contains 2255 instances, 386 instances labeled as 1. Examples of such instances are depicted in
Figure 4.
The experiments were conducted using two sets of conditions. In the first setup, we have trained the models to predict the current label; thus, the model can be used in condition monitoring scenarios. In the second scenario, we have trained the model to predict the label of the next consecutive time frame so we can evaluate the performance of the models for the predictive tasks using the dataset as well.
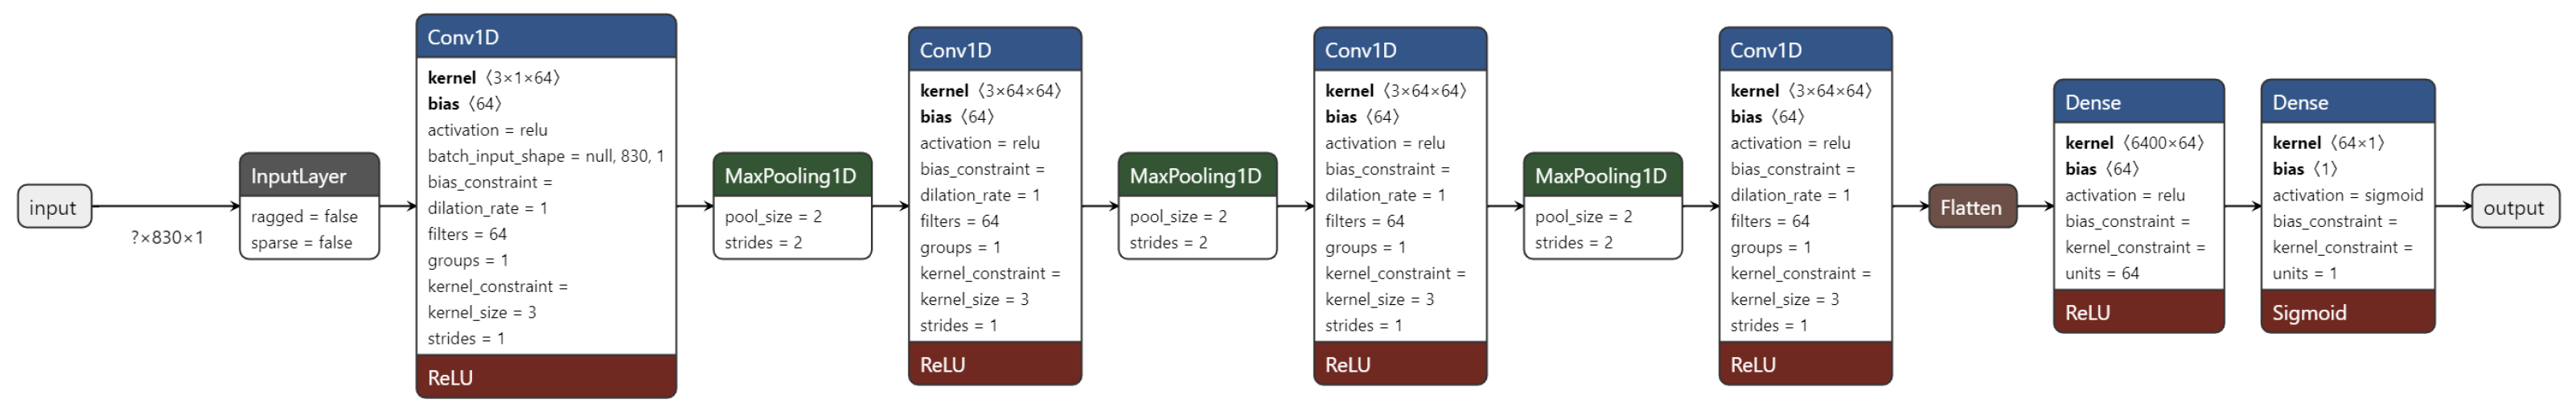
The model evaluation process used a randomized train-test split method; 80% of data were used for the model training, and 20% was left for the testing phase. We have used the 1D-Convolutional deep learning model (CNN) as a primary classifier. The model consists of 4 sequentially stacked blocks, each block has 1 1D-Convolution layer with 64 (3 × 1) kernels with ReLU activation followed by a MaxPooling layer with a filter size of 2. These blocks are followed by 2 fully-connected layers; the last layer has only 1 neuron and uses Sigmoid activation. The full architecture is depicted in
Figure 5. The network was trained for 20 epochs with 32 instances in the batches and Adam optimizer. We have used NVIDIA GeForce RTX 3090 GPU for the deep learning model experiments.
We have compared the deep learning approach with three widely used machine learning algorithms, the Decision tree classifier, Random forest classifier (100 partial estimators), and Gradient Boosting classifier (100 partial estimators), in both tasks. The dataset is imbalanced; thus, the models are compared using F1-Score (Equation (
2)).
6. Results
Table 1 provides information on different sensors and their installation parameters required to monitor various aspects of a hydraulic press machine. The sensors are grouped into different categories, including pressing force, tilting moment and displacement, cutting shock absorber, movement of ram, bearings of the pump, cooling, control oil circuit, and energy consumption. For each sensor category, the table describes the sensors and their corresponding installation parameters. These parameters include the type of sensor used, the location of installation, and the signal output of the sensor. Additionally, the table provides information on the various components of the hydraulic press machine that are being monitored, such as the ram position, control valve, pump bearings, and energy consumption.
- 1.
Pressing Force: This category includes sensors that measure the pressure on the top and bottom sides of the cylinder and includes installation of an internal pressure sensor, pressure tappet force, additional pressure sensors, and an output signal of 0–10 V.
- 2.
Tilting Moment and Tilting Displacement: This category includes sensors that measure the position of the ram on the front and rear, left and right sides, and includes installation of internal position sensors, a position sensor between the side stand and the ram, and a position sensor MTS Temposonics R-Series.
- 3.
Cutting Shock Absorber: This category includes sensors that measure the pressure in all 4 cylinders, as well as set point and actual value control valve signals.
- 4.
Movement of Ram: This category includes sensors that measure the position of the ram on the front and rear, left and right sides, and includes installation of internal position sensors, a position sensor between the side stand and the ram, and set point and actual value signals for a control valve piston.
- 5.
Bearings of Pump: This category includes sensors that measure vibration signals at the pump flange of pumps 1–3/4–5 and includes the installation of acceleration sensors at each pump flange.
- 6.
Cooling: This category includes sensors that measure the temperature in the tank, before and after the chiller, and includes the installation of a temperature sensor in the oil tank, on the inlet side of the chiller, and after the chiller, as well as a flow sensor in the cooling water circuit.
- 7.
Control Oil Circuit: This category includes sensors that measure the pressure control oil and includes the installation of a pressure sensor and a switching signal valve.
- 8.
Energy Consumption: This category includes sensors that measure the voltage and currents at the main pump 1–3, as well as at the cooling water pump and control oil pump, and includes installation of external sensors such as current clamps or voltage dividers.
6.1. Machine and Deep Learning Experiment Results
The results of the experiments carried out are in
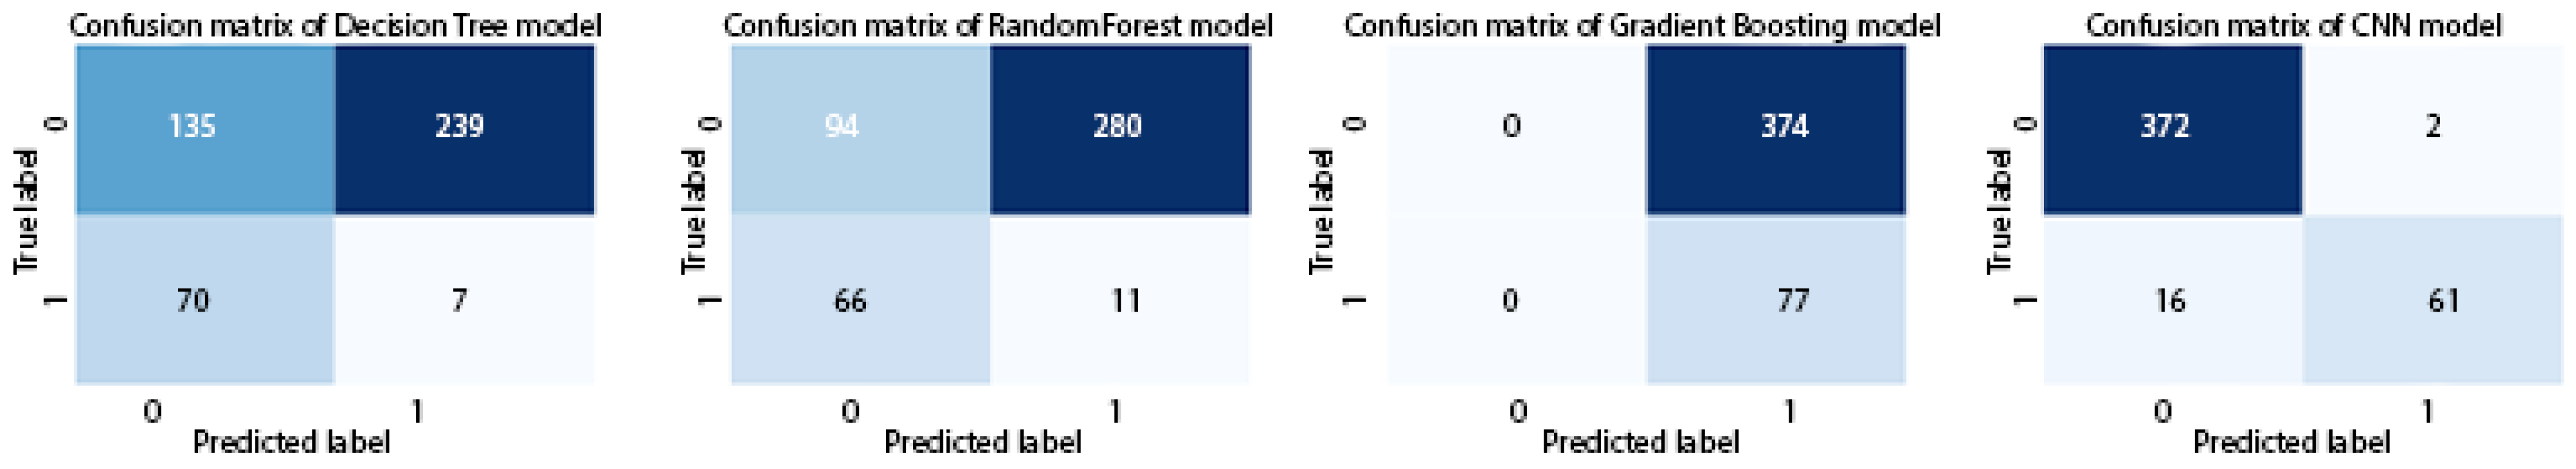
Table 2. We can see that the deep learning approach (CNN model) was superior to the machine learning approaches in both tasks. The current label F1 score for the CNN model is very high, but it decreased slightly in the next label prediction task. It is clear that the prediction of the future hydraulic press state is definitely a much more challenging task than just condition monitoring of the current state, so the results are in line with the general expectations. The F1 scores of the machine learning models are very low, as the models are not very well suited for the time series data, and we can see that they produce a large number of false positive predictions; the precise numbers can be seen in the confusion matrices in
Figure 6 and
Figure 7.
6.2. Notes
Calculation of pressing force: The pressing force can be calculated using the pressures on the piston and ring sides, taking into account the piston and ring surfaces and the ram mass.
Calculation of tilting: The tilting around the x- and y-axis can be calculated from the four position signals. However, the measurement of the tilting moment requires a digital twin and a corresponding model.
Monitoring cutting impact damping: The signals from ram speed, press force, tilting moment, and ram tilting can be used to monitor the function of the cutting impact damping and its influence on the process.
Wear and damage detection: The signals can be used to detect wear and damage to various components of the machine, including the pumps, control valves, and rolling bearings.
Power and energy calculation: The signals can be used to calculate the active and apparent power and corresponding energies of the machine.
Analysis of pressureless circulation: The pressure and valve signals can be used to analyze the switching frequency of the pressureless circulation, which can help monitor wear in the control oil circuit.
7. Conclusions and Discussion
The development of a state-of-the-art dataset based on the concept of a hydraulic press with respect to the Industry 4.0 concept is a significant achievement. The goal was to collect a large amount of signal data that reflects current operating conditions and the state of the hydraulic press. By proposing a suitable dataset, subsequent research can predict diagnostics and optimize machine operation.
The rarity of high-quality, real-world datasets makes the creation of this dataset a valuable resource for research teams interested in the Industry 4.0 domain. The data can accelerate the development of methods that achieve higher sustainability of machine operation, optimize the operation, predict maintenance needs, increase efficiency, and optimize the machine stroke, ultimately leading to a reduction in operating costs.
The availability of this dataset can pave the way for researchers to create more advanced machine-learning models to predict and prevent machine failures. With this dataset, researchers can analyze the performance of hydraulic presses under various operating conditions and predict future behavior based on the data collected. Furthermore, researchers can optimize the operation of hydraulic presses and reduce energy consumption, thus, reducing overall operating costs.
In conclusion, the development of a state-of-the-art dataset based on a hydraulic press with respect to the Industry 4.0 concept is a significant achievement. This dataset is a valuable resource for researchers interested in the Industry 4.0 domain and can be used to develop methods that can optimize machine operation, predict maintenance needs, increase efficiency, and reduce operating costs.
In addition to the benefits mentioned above, the availability of this state-of-the-art dataset can also contribute to the development of artificial intelligence (AI) and machine learning (ML) algorithms. The dataset can be used to train AI and ML models to improve predictive maintenance accuracy, optimize machine operation, and reduce downtime. We have already prepared a publicly available dataset, along with the raw data, suitable directly for testing the AI and ML models in the condition monitoring or predictive maintenance scenarios and concluded initial experiments to demonstrate the usage of the data for the selected use case ourselves.
Furthermore, the availability of this dataset can also foster collaboration and knowledge-sharing among researchers and experts in the Industry 4.0 domain. This can lead to the development of innovative and more efficient solutions to optimize machine operation, reduce maintenance costs, and increase overall productivity.
In addition, companies and organizations can also use the data set to benchmark their hydraulic press performance against industry standards and identify areas for improvement. By analyzing the data and comparing it with industry benchmarks, companies can identify opportunities to optimize their production processes and reduce costs.
Overall, the availability of this state-of-the-art dataset can have a significant impact on the development of Industry 4.0 solutions, AI and ML algorithms, and the overall productivity and efficiency of hydraulic press operations. It is a valuable resource that can contribute to the advancement of the industry and benefits companies, researchers, and society as a whole.
The data were collected in cooperation with an industrial partner. The data are protected as a trade secret and are available upon request under an NDA. A part of the dataset—one working day data and the created dataset used in the deep learning experiment is publicly available without restrictions for other researchers on this URL (accessed on 11 April 2023):
https://drive.google.com/drive/folders/1D7IIgGiojowqyr2a4Aqt3KmV3e9BPRt3.
Author Contributions
Conceptualization, R.H. and R.S.; methodology, R.S.; software, R.S.; validation, R.H. and R.S.; formal analysis, R.H.; investigation, R.H.; resources, R.S.; data curation, R.S.; writing—original draft preparation, R.H. and R.S.; writing—review and editing, R.H.; visualization, R.S.; supervision, R.H.; project administration, R.H.; funding acquisition, R.H. All authors have read and agreed to the published version of the manuscript.
Funding
This research received no external funding.
Institutional Review Board Statement
Not applicable.
Informed Consent Statement
Not applicable.
Data Availability Statement
Not applicable.
Acknowledgments
This work was supported by the European Regional Development Fund in “A Research Platform focused on Industry 4.0 and Robotics in Ostrava Agglomeration” project, reg. nr. CZ.02.1.01/0.0/0.0/17_049/0008425 within the Operational Programme Research, Development, and Education, and the project SP2023/009, “Development of algorithms and systems for control, measurement and safety applications IX” of Student Grant System, VSB-TU Ostrava.
Conflicts of Interest
The authors declare no conflict of interest.
Abbreviations
The following abbreviations are used in this manuscript:
| AI | Artificial intelligence |
| CSV | Comma-separated values |
| CPU | Central processing unit |
| PLC | Programmable logic controller |
| ML | Machine-Learning |
| SMAPE | Symmetric Mean Absolute Percentage Error |
References
- Badshah, A.; Iwendi, C.; Jalal, A.; Hasan, S.S.U.; Said, G.; Band, S.S.; Chang, A. Use of regional computing to minimize the social big data effects. Comput. Ind. Eng. 2022, 171, 108433. [Google Scholar] [CrossRef]
- Jeon, G.; Albertini, M.; Bellandi, V.; Chehri, A. Intelligent mobile edge computing for IoT big data. Complex Intell. Syst. 2022, 8, 3595–3601. [Google Scholar] [CrossRef]
- Pääkkönen, P.; Pakkala, D. Extending reference architecture of big data systems towards machine learning in edge computing environments. J. Big Data 2020, 7, 25. [Google Scholar] [CrossRef]
- Kubiak, K.; Dec, G.; Stadnicka, D. Possible Applications of Edge Computing in the Manufacturing Industry—Systematic Literature Review. Sensors 2022, 22, 2445. [Google Scholar] [CrossRef] [PubMed]
- Kanani, P.; Padole, M. Exploring and Optimizing the Fog Computing in Different Dimensions. Procedia Comput. Sci. 2020, 171, 2694–2703. [Google Scholar] [CrossRef]
- Gopala, M.; Sriram, G. Edge Computing vs. Cloud Computing: An overview of Big Data challenges and opportunities for large enterprises. Int. Res. J. Mod. Eng. Technol. Sci. 2022, 4, 1331–1337. [Google Scholar]
- Du, H.; Huang, B.; Wang, L.; Chen, S.M. The Design of Monitoring System in Large Hydraulic Press Aiming at the Precise Closed-Loop Control. Adv. Mater. Res. 2014, 989–994, 3062–3069. [Google Scholar] [CrossRef]
- Li, R.; Yuan, W.; Ding, X.; Xu, J.; Sun, Q.; Zhang, Y. Review of Research and Development of Hydraulic Synchronous Control System. Processes 2023, 11, 981. [Google Scholar] [CrossRef]
- Helmke, M.; Majer, H. Improvement of hydraulic control quality for deep drawing presses through retrofit. In Proceedings of the 10th International Fluid Power Conference, Dresden, Germany, 8–10 March 2016; pp. 367–378. [Google Scholar]
- Shaaban, A.; Elakkad, A.S. Numerical and experimental analysis of single-acting stroke deep drawing of symmetric low-depth products without blank holder. Ain Shams Eng. J. 2021, 12, 2907–2919. [Google Scholar] [CrossRef]
- Yu, H.Y.; Tang, J.L.; Tang, Y. Research on 800 MN hydraulic press monitoring system. Mater. Res. Innov. 2015, 19, S6-181–S6-183. [Google Scholar] [CrossRef]
- Zhang, X.; Zhang, L.; Liu, L.; Huo, L. Prestress Monitoring of a Steel Strand in an Anchorage Connection Using Piezoceramic Transducers and Time Reversal Method. Sensors 2018, 18, 4018. [Google Scholar] [CrossRef] [PubMed]
- Gao, M.; Li, X.; Huang, H.; Liu, Z.; Li, L.; Zhou, D. Energy-saving Methods for Hydraulic Presses Based on Energy Dissipation Analysis. Procedia CIRP 2016, 48, 331–335. [Google Scholar] [CrossRef]
- Jankovič, D.; Šimic, M.; Herakovič, N. The Concept of Smart Hydraulic Press. In Service Oriented, Holonic and Multi-Agent Manufacturing Systems for Industry of the Future; Springer International Publishing: Berlin/Heidelberg, Germany, 2021; pp. 409–420. [Google Scholar] [CrossRef]
- Angeli, C.; Chatzinikolaou, A. An expert system approach to fault diagnosis in hydraulic systems. Expert Syst. 1995, 12, 323–330. [Google Scholar] [CrossRef]
- Hinrichs, R.; Schmidt, A.; Koslowski, J.; Bergmann, B.; Denkena, B.; Ostermann, J. Analysis of the impact of data compression on condition monitoring algorithms for ball screws. Procedia CIRP 2021, 102, 270–275. [Google Scholar] [CrossRef]
- Liu, G.; Jia, L.; Hu, T.; Deng, F.; Chen, Z.; Sun, T.; Feng, Y. Novel Data Compression Algorithm for Transmission Line Condition Monitoring. Energies 2021, 14, 8275. [Google Scholar] [CrossRef]
- Chen, Z.; Yang, Y. Assessing Forecast Accuracy Measures 2004. Available online: https://www.researchgate.net/publication/228774888_Assessing_forecast_accuracy_measures (accessed on 11 April 2023).
- Ao, S.I.; Gelman, L.; Karimi, H.R.; Tiboni, M. Advances in Machine Learning for Sensing and Condition Monitoring. Appl. Sci. 2022, 12, 12392. [Google Scholar] [CrossRef]
- Gonzalez-Abreu, A.D.; Saucedo-Dorantes, J.J.; Osornio-Rios, R.A.; Arellano-Espitia, F.; Delgado-Prieto, M. Deep Learning based Condition Monitoring approach applied to Power Quality. In Proceedings of the 2020 25th IEEE International Conference on Emerging Technologies and Factory Automation (ETFA), Vienna, Austria, 8–11 September 2020; Volume 1, pp. 1427–1430. [Google Scholar] [CrossRef]
- Yaghoubi, V.; Cheng, L.; Paepegem, W.V.; Keremans, M. Vibration-Based Condition Monitoring By Ensemble Deep Learning. arXiv 2021, arXiv:2110.06601. [Google Scholar]
| Disclaimer/Publisher’s Note: The statements, opinions and data contained in all publications are solely those of the individual author(s) and contributor(s) and not of MDPI and/or the editor(s). MDPI and/or the editor(s) disclaim responsibility for any injury to people or property resulting from any ideas, methods, instructions or products referred to in the content. |
© 2023 by the authors. Licensee MDPI, Basel, Switzerland. This article is an open access article distributed under the terms and conditions of the Creative Commons Attribution (CC BY) license (https://creativecommons.org/licenses/by/4.0/).


