Abstract
Maize crops occupy an important place in world food security. However, different conditions, such as abiotic stress factors, can affect the productivity of these crops, requiring technologies that facilitate their monitoring. One such technology is spectroscopy, which measures the energy reflected and emitted by a surface along the electromagnetic spectrum. Spectral data can help to identify abiotic factors in plants, since the spectral signature of vegetation has discriminating features associated with the plant’s health condition. This paper introduces a spectral library captured on maize crops under different nitrogen-deficiency stress levels. The datasets will be of potential interest to researchers, ecologists, and agronomists seeking to understand the spectral features of maize under nitrogen-deficiency stress. The library includes three datasets captured at different growth stages of 10 tropical maize genotypes. The spectral signatures collected were in the visible to near-infrared range (450–950 nm). The data were pre-processed to reduce noise and anomalous signatures. This study presents a spectral library of the effects of nitrogen deficiency on ten maize genotypes, highlighting that some genotypes show tolerance to this type of stress at different phenological stages. Most of the evaluated genotypes showed discriminate spectral features 4–6 weeks after sowing. Higher reflectance was obtained at approximately 550 nm for the lowest nitrogen fertilization treatments. Finally, we describe some potential applications of the spectral library of maize leaves under nitrogen-deficiency stress.
Dataset:
10.5281/zenodo.7272041
Dataset License:
CC-BY-NC
1. Summary
Increasing crop tolerance to different abiotic and biotic stress factors is necessary to ensure food security. Crops such as maize (Zea mays L.) play an important role in food security, as it is considered the third most important cereal in the world [1]. However, maize productivity is expected to decrease by 10–25% for every degree Celsius increase in global temperature, so it is necessary to have tools to assess the health of maize crops [2,3]. One technology with great potential for crop monitoring is spectrometry [4,5]. Spectral systems measure the energy reflected and emitted by a surface across the electromagnetic spectrum. The shape and characterization of spectral signatures allow the identification of materials in the sensor’s field of view [6].
The spectral response of vegetation is one of the most complex. One characteristic of the vegetation spectral signature is low reflectance in the visible region due to pigments such as chlorophyll and carotenes [6]. One of the most relevant features of the vegetation signature is between 690 and 720 nm, a region known as the red edge. In this region, the low reflectance increases significantly at approximately 800 nm. This behavior is associated with the internal structure of leaves and water content [6]. In the near-infrared region (700–1300 nm), plants have high reflectance that depends on the internal structure of the leaves. The mid-infrared region (1300–2500 nm) is characterized by water absorption and levels of other biochemicals [6].
The spectral signature of a plant can change due to a variety of factors, including growth stage, stress conditions, and irradiance. For example, owing to the amount of pigment in the leaves, the position of the red edge can shift [7]. Previous research studied the relationship between spectral response and different plant phenological stages, stress, environmental and geographical conditions, and their interaction. For instance, the study in ref. [8] evaluated the use of multispectral images collected by an unmanned aerial vehicle (UAV) to map the water stress of maize. This work used two vegetation indices to monitor water stress at the reproductive and maturation stages. In ref. [9], spectral indices were used to estimate different stresses in maize at the seedling stage. On the other hand, the research in ref. [10] demonstrated that hyperspectral imagery can detect water stress over individual maize plants. In ref. [11], vegetation indices were also used to assess the water and nitrogen status of sweet maize. Most of the previous studies were designed using vegetation indices derived from hyperspectral or multispectral data.
Despite previous work, it is not easy to access spectral libraries that allow the study of different phenomena influencing the spectral response of maize. In addition, most studies have focused on vegetation indices, limiting the analysis to a few bands, and not taking advantage of the information available along the spectral signature [12].
This paper introduces a spectral library of maize leaves under nitrogen-deficiency stress. The datasets are part of the research program “Intelligent Systems for Monitoring Permanent and Annual Agricultural Crops,” which seeks to integrate remote sensing and internet of things (IoT) technologies for monitoring abiotic stress in crops. This library aims to facilitate access to spectral data in the visible to near-infrared regions of several genotypes of maize under different nitrogen deficiency stress levels and in different growth stages. This library can be used in different studies to understand the spectral response of maize, develop new methodologies for stress monitoring and detection, and identify genotypic tolerance to abiotic conditions. The library includes spectral signatures calibrated at wavelengths from 450 to 950 nm. Since the full spectra are provided, they can be used in studies exploring vegetation indices and in emerging methodologies considering the whole spectrum.
2. Data Description
The datasets consist of three sets of spectra collected on maize leaves under nitrogen stress conditions. The studied maize plants included ten genotypes, including experimental and commercial seeds from several companies and different grain colors (Table 1). The plants were cultivated under different nitrogen fertilization treatments: 25% (T1), 50% (T2), 75% (T3), and 100% (T4) of the optimum level determined by soil analysis. The three sets of data were obtained in different maize-growing stages.

Table 1.
Description of maize genotypes used to build the spectral library.
The first dataset corresponds to spectra collected in the early stage of development (V3 [13,14], 2–4 weeks after sowing). This dataset (Table 2) contains 258 spectral signatures collected from maize plants under treatment T1, 256 spectra under T2, 263 spectra under T3, and 274 under T4. The second dataset contains the spectral signatures obtained at stage V7 [13,14] of maize growth, which occurs 4–6 weeks after sowing. The second dataset (Table 3) includes 506 spectra from maize plants under T1, 505 under T2, 510 under T3, and 517 under T4. Finally, the third dataset was collected from maize plants between stages V10 and V12 [13,14], before flowering (Table 4). This last dataset includes 506 spectral signatures under T1, 501 spectra under T2, 516 spectra under T3, and 510 under T4.
Table 2.
Dataset 1: Number of spectra acquired from maize plants at V3 stage per genotype and treatment after pre-processing.
Table 3.
Dataset 2: Number of spectra acquired from maize plants at V7 stage per genotype and treatment after pre-processing.
Table 4.
Dataset 3: Number of spectra acquired from maize plants at V10-V12 stage per genotype and treatment after pre-processing.
The spectra were collected using a FLAME S VIR NIR spectrometer integrated with 2 m QP600-2-VIR-NIR optical fibers and an HL-2000-LL light source (all equipment, Ocean Insight®). The spectrometer’s range was between 350 and 1000 nm, capturing 2049 bands. Data collection was performed as described in Section 3.2. The spectral library contains the signatures already calibrated in reflectance and filtered (see Section 3.3). For each dataset, three files are included (Table 5): “Data.txt” contains the matrix data, where each column is a signature; “Label.txt” contains two rows of labels, where the first row is the nitrogen treatment (1: T1, 2: T2, 3: T3, and 4: T4) and the second row is the genotype (Table 1). Finally, the file “Wavelength.txt” includes the spectral bands for each signature in the dataset. Each signature has 1485 spectral bands between 450 and 950 nm.
Table 5.
Spectral library.
3. Methods
3.1. Vegetal Material and Experimental Design
This study used ten maize genotypes, of which six were commercial hybrids, one was a commercial variety, and three were experimental hybrids (Table 1). The experiments were conducted at La Selva Research Center of AGROSAVIA, located in the Llanogrande sector, municipality of Rionegro, Antioquia, Colombia (06°08′06″ N; 75°25′03″ W, 2093 m.a.s.l.). This area has an average annual temperature of 17 °C, precipitation of 1917 mm, relative humidity of 78%, daylight of 1726 h yr−1, and evapotranspiration of 1202 mm. The study site is located in the Low Montane Humid Forest (bh-MB) ecological life zone, in the Rionegro Association cartographic unit, on a low alluvial terrace of the Rionegro River [15].
Trials were established in the field on April 5, 2022, using three levels of nitrogen fertilization corresponding to 25%, 50%, and 75% of the optimum nitrogen dose for maize. Additionally, one trial had 100% of the optimum fertilization as a control (Figure 1). The soil was previously sterilized and free of weed seeds and pathogens. Soil fertility analysis determined the nitrogen level before establishing the trial. The experimental design was laid out in a randomized complete block with a split-plot arrangement and three replications, where nitrogen doses were the main plots and genotypes were the sub-plots, for a total of 120 plots (Figure 1a). Each plot included eight plants of the same genotype, spaced 0.2 m apart (Figure 1b). The spacing between each plot was 0.8 m (Figure 1c). The distribution of genotypes within each replicate was randomly arranged.
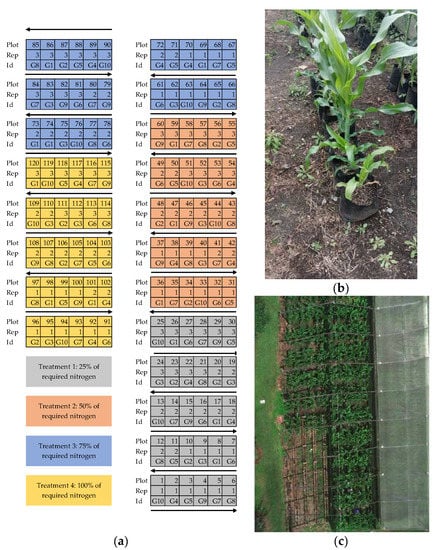
Figure 1.
(a) Distribution of plots according to genotype, repetition, and treatment. (b) Photograph of a row of plants of the same genotype and treatment. (c) Aerial photograph of the experimental design area.
3.2. Data Collection
We used a FLAME S VIR NIR spectrometer integrated with 2 m QP600-2-VIR-NIR optical fibers, with a core size of 600 µm, and an HL-2000-LL tungsten halogen light source with an output from 350 to 2400 nm, all manufactured by Ocean Insight®. The spectrometer range was between 350 and 1000 nm, capturing 2049 bands. We used a customized clamp to integrate the spectrometer and light source. The tool was a 3D-printed clamp made of PLA material with a handle for easy manipulation [16]. The clamp fixed the leaf and two optical fibers, with one connected to the light source and the other to the spectrometer. The fiber probes were placed 5 mm from the surface. The fiber connected to the light formed a 45° angle with the surface, and the spectrometer fiber was set perpendicular to the surface. The captured spectrum was the result of an average of 10 measurements to improve the signal-to-noise ratio. Black and white calibration spectra were collected before measurements on the leaves. OceanView 2.0 software (Ocean Insight, Orlando, FL, USA) was used to capture and calibrate the spectral signatures. Data were collected at three stages of maize growth: V3 (12 May, 2022), V7 (2 June 2022), and V10-V12 (23 June 2022). On each date, three individuals were randomly selected from each plot with the same genotype, treatment, and repetition. From the central area of the adaxial face of the upper third leaf of each plant, we collected ten spectral signatures on the first date. On the second and third dates, the number of samples was increased to 20 per plot to achieve greater representativeness of the data.
3.3. Data Pre-Processing
Data pre-processing included three stages. In the first stage, the spectral signatures were graphically analyzed to determine the wavelength range with low noise levels. From this analysis, the data was cropped, maintaining the reflectance between 450 and 950 nm. In the second stage, a 10-point sliding window filter was applied to reduce the noise and maintain the signature waveform (Figure 2). Finally, a two-step automatic process was employed to remove spectral signatures with shapes that did not correspond to the vegetation or atypical behaviors. First, we computed the standard deviation for each group per treatment and genotype. We eliminated spectral signatures falling outside three standard deviations (Figure 3a), then the standard deviation was calculated once again with the remaining spectra, and the process was repeated (Figure 3b). Applying these pre-processing steps to the data captured on the three dates resulted in 1051 signatures for V3, 2038 for V7, and 2033 for V10-V12. Table 2, Table 3 and Table 4 detail the number of spectral signatures obtained for each genotype and treatment.
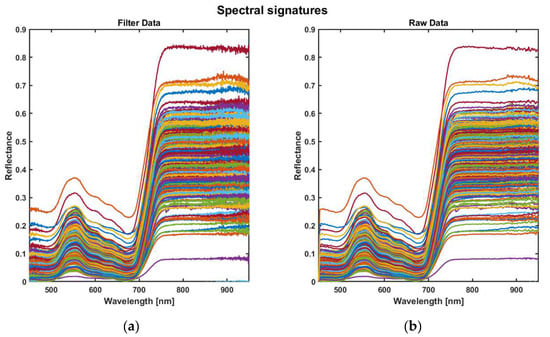
Figure 2.
Spectral signatures (a) before and (b) after filtering.
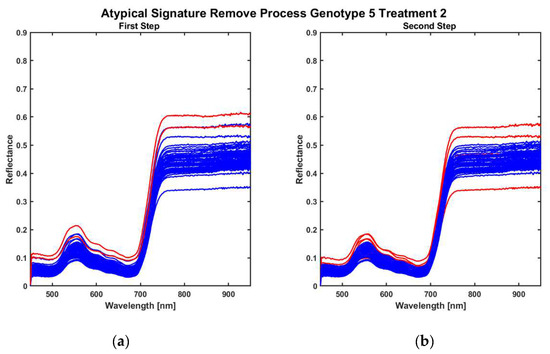
Figure 3.
Removed spectral signatures (red lines) using (a) the three standard deviations criteria and (b) then again using the actualized standard deviation.
3.4. Data analysis
Figure 4, Figure 5 and Figure 6 present the average spectral signatures obtained for each genotype under the different nitrogen-deficiency stress levels. These figures show the effects of stress level on each genotype and growth stage. Figure 4 presents the average signatures at the V3 stage. At this growth stage, genotypes G7 and G9 showed few changes in the spectral signature. In contrast, genotypes G1, G2, G4, G6, and G10 presented higher variations according to stress level. Figure 5 presents the average signatures at the V7 growth stage. In this case, genotypes G3, G4, G8, G9, and G10 showed few variations in the spectral signature due to the level of stress. Finally, Figure 6 shows the average signatures at the V10-V12 stage. At this stage, which precedes plant flowering, the effect of fertilizer treatment was less than in the previous stages. Only genotypes G1, G8, and G9 showed considerable variations. These results demonstrated that each genotype responded differently to nitrogen fertilization treatments, and plant responses changed with the growth stage evaluated.
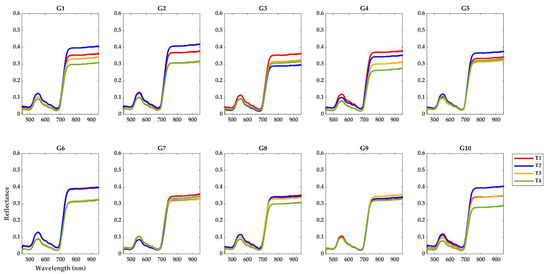
Figure 4.
Mean spectral signatures collected at the V3 stage for each genotype (G1–G10) under different nitrogen fertilization treatments: 25% (T1), 50% (T2), 75% (T3), and 100% (T4).
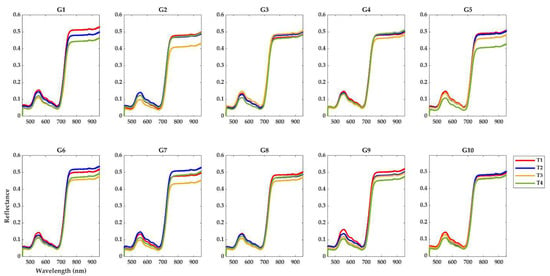
Figure 5.
Mean spectral signatures collected at the V7 stage for each genotype (G1–G10) under different nitrogen fertilization treatments: 25% (T1), 50% (T2), 75% (T3), and 100% (T4).
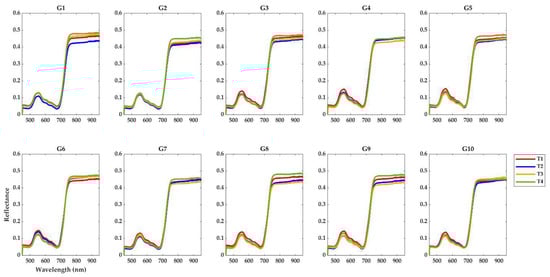
Figure 6.
Mean spectral signatures collected at the V10–V12 stage for each genotype (G1–G10) under different nitrogen fertilization treatments: 25% (T1), 50% (T2), 75% (T3), and 100% (T4).
3.5. Discussion
Library spectral signatures can help elucidate the effects of nitrogen fertilization treatments for different maize genotypes and growth stages. Previous studies reported the spectral characterization of maize with various nitrogen fertilization levels; however, most of these studies did not consider genotype or growth stage. For instance, McMurtrey et al. [17] presented a characterization of the reflectance of maize leaves with various levels of nitrogen fertilization, revealing significant differences between treatments at 550 and 700 nm. Similar results were presented by Blackmer et al. [18], in which a discriminant feature at approximately 550 nm from reflectance signatures collected on maize leaves with several nitrogen fertilizer rates demonstrated greater reflectance at lower nitrogen rates. Noh et al. [19] also showed more significant differences between healthy and nitrogen-deficient maize plants in bands at 650 and 800 nm. The spectral signatures obtained by our experimental setup concurred with these previous studies. At the V3 growth stage (Figure 4), higher reflectance was obtained at lower nitrogen levels, such as in ref. [17,18,19]. On the other hand, the 800 nm wavelength also showed a discriminative feature at the V3 and V7 stages (Figure 4 and Figure 5), as obtained by ref. [19].
This analysis is only one example of the potential studies that can be performed using the spectral library. Other potential work includes estimating parameters such as chlorophyll, carotenoids, dry matter, etc. using diffuse reflectance inversion models [20]. Additionally, the datasets can potentially be used in developing machine learning models for detecting stress and discriminating nitrogen-level stress [21].
4. Conclusions
This paper introduces a new maize spectral library between 450 and 950 nm, collected with a spectrometer positioned directly over the leaves. The datasets include ten genotypes, four nitrogen fertilization treatments, and three maize-growing stages. The library includes calibrated signatures, already filtered and pre-processed. These datasets will facilitate an understanding of the spectral behavior of maize at different growing stages under fertilizer treatments.
Most previous studies have explored the relationship between the vegetation index and stress factors; however, there is a need to explore the full spectra and the effects of other variables, such as genotype and growth stage. In general, access to spectral databases is limited; thus, the proposed spectral library seeks to support studies determining: (i) if a genotype has a higher tolerance than other genotypes to treatment changes, (ii) wavelengths where changes due to stress deficiencies are most perceptible (iii) treatment effects on different vegetation indices, (iv) changes in spectral signature due to genotype, growth stage, and fertilizer treatment, and (v) estimation of optical parameters, such as chlorophyll.
Comparing the mean spectral signatures for genotype, treatment, and growth stage demonstrates the potential of these datasets, evidencing that each genotype has a different spectral response to nitrogen treatment levels, which also depends on the growth stage.
Author Contributions
Conceptualization, M.C.T.-M., M.G., M.A.G., T.R., J.G. and M.C.; methodology, M.C.T.-M., M.G., M.A.G., T.R., P.C., C.A.-C., J.G. and M.C.; validation, M.G., P.C. and C.A.-C.; formal analysis, M.C.T.-M., M.G., M.A.G., T.R., P.C. and S.G.-O.; data curation, M.G., P.C., C.A.-C., S.G.-O., M.D.-F. and S.V.L.; writing—original draft preparation, M.C.T.-M. and M.G.; writing—review and editing, M.C.T.-M., M.G., M.A.G. and T.R.; visualization, M.G., P.C. and S.G.-O.; project administration, M.C.T.-M.; funding acquisition, M.C.T.-M. All authors have read and agreed to the published version of the manuscript.
Funding
This research was funded by the Ministerio de Ciencia, Tecnologia e Inno-vacion—Minciencias, Colombia (grant number RC 80740-475-2020). The APC was funded by Instituto Tecnológico Metropolitano by the action plan of MIRP Research Group (project P21103).
Institutional Review Board Statement
Not applicable.
Informed Consent Statement
Not applicable.
Data Availability Statement
The data presented in this study are openly available in Zenodo at 10.5281/zenodo.7272041.
Conflicts of Interest
The authors declare no conflict of interest.
References
- Erenstein, O.; Chamberlin, J.; Sonder, K. Estimating the global number and distribution of maize and wheat farms. Glob. Food Secur. 2021, 30, 100558. [Google Scholar] [CrossRef]
- Tigchelaar, M.; Battisti, D.S.; Naylor, R.L.; Ray, D.K. Future warming increases probability of globally synchronized maize production shocks. Proc. Natl. Acad. Sci. USA 2018, 115, 6644–6649. [Google Scholar] [CrossRef] [PubMed]
- Zampieri, M.; Ceglar, A.; Dentener, F.; Dosio, A.; Naumann, G.; van den Berg, M.; Toreti, A. When will current climate extremes affecting maize production become the norm? Earth’s Future 2019, 7, 113–122. [Google Scholar] [CrossRef]
- Clevers, J.G. The use of imaging spectrometry for agricultural applications. ISPRS J. Photogramm. Remote. Sens. 1999, 54, 299–304. [Google Scholar] [CrossRef]
- Lu, B.; Dao, P.D.; Liu, J.; He, Y.; Shang, J. Recent advances of hyperspectral imaging technology and applications in agriculture. Remote. Sens. 2020, 12, 2659. [Google Scholar] [CrossRef]
- Kumar, L.; Schmidt, K.; Dury, S.; Skidmore, A. Imaging spectrometry and vegetation science. In Imaging Spectrometry; van der Meer, F.D., De Jong, S.M., Eds.; Springer: Dordrecht, Germany, 2002; Volume 4, pp. 111–155. [Google Scholar] [CrossRef]
- Ustin, S.L.; Gitelson, A.A.; Jacquemoud, S.; Schaepman, M.; Asner, G.P.; Gamon, J.A.; Zarco-Tejada, P. Retrieval of foliar information about plant pigment systems from high resolution spectroscopy. Remote Sens. Environ. 2009, 113, S67–S77. [Google Scholar] [CrossRef]
- Zhang, L.; Zhang, H.; Niu, Y.; Han, W. Mapping maize water stress based on UAV multispectral remote sensing. Remote. Sens. 2019, 11, 605. [Google Scholar] [CrossRef]
- Ma, B.; Pu, R.; Zhang, S.; Wu, L. Spectral identification of stress types for maize seedlings under single and combined stresses. IEEE Access 2018, 6, 13773–13782. [Google Scholar] [CrossRef]
- Asaari, M.S.M.; Mertens, S.; Dhondt, S.; Inzé, D.; Wuyts, N.; Scheunders, P. Analysis of hyperspectral images for detection of drought stress and recovery in maize plants in a high-throughput phenotyping platform. Comput. Electron. Agric. 2019, 162, 749–758. [Google Scholar] [CrossRef]
- Colovic, M.; Yu, K.; Todorovic, M.; Cantore, V.; Hamze, M.; Albrizio, R.; Stellacci, A.M. Hyperspectral vegetation indices to assess water and nitrogen status of sweet maize crop. Agronomy 2022, 12, 2181. [Google Scholar] [CrossRef]
- Huang, S.; Tang, L.; Hupy, J.P.; Wang, Y.; Shao, G. A commentary review on the use of normalized difference vegetation index (NDVI) in the era of popular remote sensing. J. For. Res. 2021, 32, 1–6. [Google Scholar] [CrossRef]
- Ritchie, S.W.; Hanway, J.J.; Benson, G.O. How a corn plant develops. Iowa State University of Science and Technology. Cooperative Extension Service Ames, Iowa. Spec. Rep. 1986, 48, 1–17. Available online: http://publications.iowa.gov/18027/1/How%20a%20corn%20plant%20develops001.pdf (accessed on 28 October 2022).
- Alam, M.; Nakasathien, S.; Molla, M.; Hossain, S.; Islam, M.; Maniruzzaman, M.; Akkas, M.; Sarobol, E.; Vichuki, V.; Hassan, M.; et al. Kernel water relations and kernel filling traits in maize (Zea mays L.) are influenced by water-deficit condition in a tropical environment. Front. Plant Sci. 2021, 12, 1–18. [Google Scholar] [CrossRef] [PubMed]
- IGAC. Estudio General de Suelos y Zonificación de Tierras Departamento de Antioquia; Instituto Geográfico Agustín Codazzi (IGAC); Imprenta Nacional de Colombia: Bogotá, Colombia, 2007; pp. 710–711.
- Acevedo-Correa, C.; Goez, M.M.; Torres-Madronero, M.C.; Rondon, T. Low-cost clamp for the measurement of vegetation spectral signatures. HardwareX 2022, 1–9. [Google Scholar]
- McMurtrey III, J.E.; Chappelle, E.W.; Kim, M.S.; Meisinger, J.J.; Corp, L.A. Distinguishing nitrogen fertilization levels in field corn (Zea mays L.) with actively induced fluorescence and passive reflectance measurements. Remote Sens. Environ. 1994, 47, 36–44. [Google Scholar] [CrossRef]
- Blackmer, T.M.; Schepers, J.S.; Varvel, G.E. Light reflectance compared with other nitrogen stress measurements in corn leaves. Agron. J. 1994, 86, 934–938. [Google Scholar] [CrossRef]
- Noh, H.; Zhang, Q.; Shin, B.; Han, S.; Feng, L. A neural network model of maize crop nitrogen stress assessment for a multispectral imaging sensor. Biosyst. Eng. 2006, 94, 477–485. [Google Scholar] [CrossRef]
- Molina, N.A.; Torres-Madronero, M.C.; Galeano, J.; Casamitjana, M. Direct diffuse reflectance model implementation using optical parameters applied to the spectral simulation of avocado leaf. In Proceedings of the SmartTech-IC 2021 Second International Conference on Smart Technologies, Systems and Applications, Cuenca, Ecuador, 16–18 November 2021; pp. 69–83. Available online: https://dspace.ups.edu.ec/bitstream/123456789/22473/4/Smart%20Technologies%20abril-2022.pdf (accessed on 30 October 2022).
- Barbedo, J.G.A. Detection of nutrition deficiencies in plants using proximal images and machine learning: A review. Comput. Electron. Agric. 2019, 162, 482–492. [Google Scholar] [CrossRef]


Disclaimer/Publisher’s Note: The statements, opinions and data contained in all publications are solely those of the individual author(s) and contributor(s) and not of MDPI and/or the editor(s). MDPI and/or the editor(s) disclaim responsibility for any injury to people or property resulting from any ideas, methods, instructions or products referred to in the content. |
© 2022 by the authors. Licensee MDPI, Basel, Switzerland. This article is an open access article distributed under the terms and conditions of the Creative Commons Attribution (CC BY) license (https://creativecommons.org/licenses/by/4.0/).