1. Summary
Renewable energies are an important pillar of power supply in Germany. Thus, the share of renewable power in gross electricity consumption rose from 6.3% in 2000 to 45.2% in 2020 [
1]. This increase is due to the nationwide expansion of renewable energies for power generation such as wind power plants or photovoltaic systems. However, the development of renewable energy in Germany has also led to political conflicts with residents, topics of land use, nature conservation or the landscape [
2,
3]. In order to provide a detailed insight into the spatial expansion of renewable energy plants over time, precise information on plant locations and system data is helpful. This can help to better track environmental issues and impacts of renewables at local and national level [
3,
4], shed light on the spatial distribution and equity of energy transition, or calculate site-specific generation patterns using numerical simulation models [
5,
6]. Data sets on the geo-locations of renewable energy installations already exist (e.g., [
7,
8]). What all these data sets have in common, however, is that the data they contain do not adequately represent the renewable energy plant stock in Germany over space and time. Either data records for plants are missing or existing data records are incomplete, a fact which was already noted by [
8,
9] before. That is why we have already published a data set and an article on the spatial distribution of wind turbines, photovoltaic field systems, bioenergy plants and river hydropower plants in Germany in 2019 [
8]. However, this data collection only covers installations up to the year 2015 with a so far only roughly resolved and partly imprecise level of information from different sources. In this sense, this contribution is intended as a continuation and further development of the existing work. The aim of this work was to create a data set on the geo-locations and system data of renewable energy installations in Germany that is as error-free as possible. For this purpose, data from the Core Energy Market Data Register (CEMDR) [
10] was used and cross-checked with other available sources where necessary. In this work, we focus on onshore and offshore wind power plants, photovoltaic field systems, bioenergy plants and hydropower plants in Germany.
The article is structured as follows: The following
Section 2 briefly and precisely describes the format of the compiled data set and how the data can be read and interpreted. In
Section 3, the source data used and the procedure for compiling the data set are presented, structured by the types of renewable energy installations mentioned. Finally,
Section 4 summarizes and discusses the main outcomes and the significance of the data set.
3. Raw Data and Methods
This section describes the raw data used and the method applied to compile the data set for the renewable energy installation types mentioned. The technical process of data processing is documented in a Git repository and can be reviewed at [
12].
The raw data used for this work were taken from the Core Energy Market Data Register (CEMDR) maintained by the Federal Network Agency and reflects the status as of the reporting date 7 May 2021 [
10]. The CEMDR data includes all power generation installations in Germany and is provided in XML format. This data source was chosen because it offers the most comprehensive data on renewable energy installations in Germany. However, even though the data provided by the CEMDR is very detailed, the information it contains may be wrong or inaccurate. The main reason for this is incorrect or erroneous information submitted by system operators to the CEMDR. It has been shown, however, that erroneous data of this kind can be corrected by cross-validation with other data sources, by data science techniques or by plant-specific searches [
8,
9]. Data sources that can be used for cross-validation are, for example, plant data from the four large transmission system operators in Germany (Amprion, 50Hertz, TransnetBW and Tenet TSO). They maintain a public list of information on renewable energy plants that are subsidised under the Renewable Energy Sources Act (EEG), but only with reduced plant information [
13]. The federal states also offer data on renewable energy installations in publicly accessible data portals, although the scope and level of detail of the information offered varies (e.g., [
14,
15,
16]). In addition, there are also commercially accessible databases that can be used for cross-validation if required (e.g., [
17,
18]).
As target format for the single files of the compiled data set the GeoJSON format was chosen. The GeoJSON format is an open standard format for representing simple geographic features along with their non-spatial attributes [
19]. Compared to other ways of making the data available, e.g., via an application programming interface (API), this format has the advantage that files of this format can be easily shared, read by common GIS software and used by a user group with little IT knowledge.
By using mentioned alternate data sources and existing methods in association with the techniques presented in this work, the CEMDR data can be improved and made more precise and accessible. This makes it possible to obtain a temporally and spatially high-resolution image of the German renewable energy installation stock in the electricity sector. The procedure for compiling the data set is described below for each type of installation mentioned and reflects the work steps of the technical data processing.
3.1. Wind Power Plants
With a share of 46% in 2021, wind energy has the largest share of the total installed electricity generation capacity from renewable energies in Germany [
1]. The capacity has been continuously expanded in recent years and has been built both on land and at sea. The data extract from the CEMDR contains a combined total of 30,759 onshore and offshore installations, excluding those that are planned.
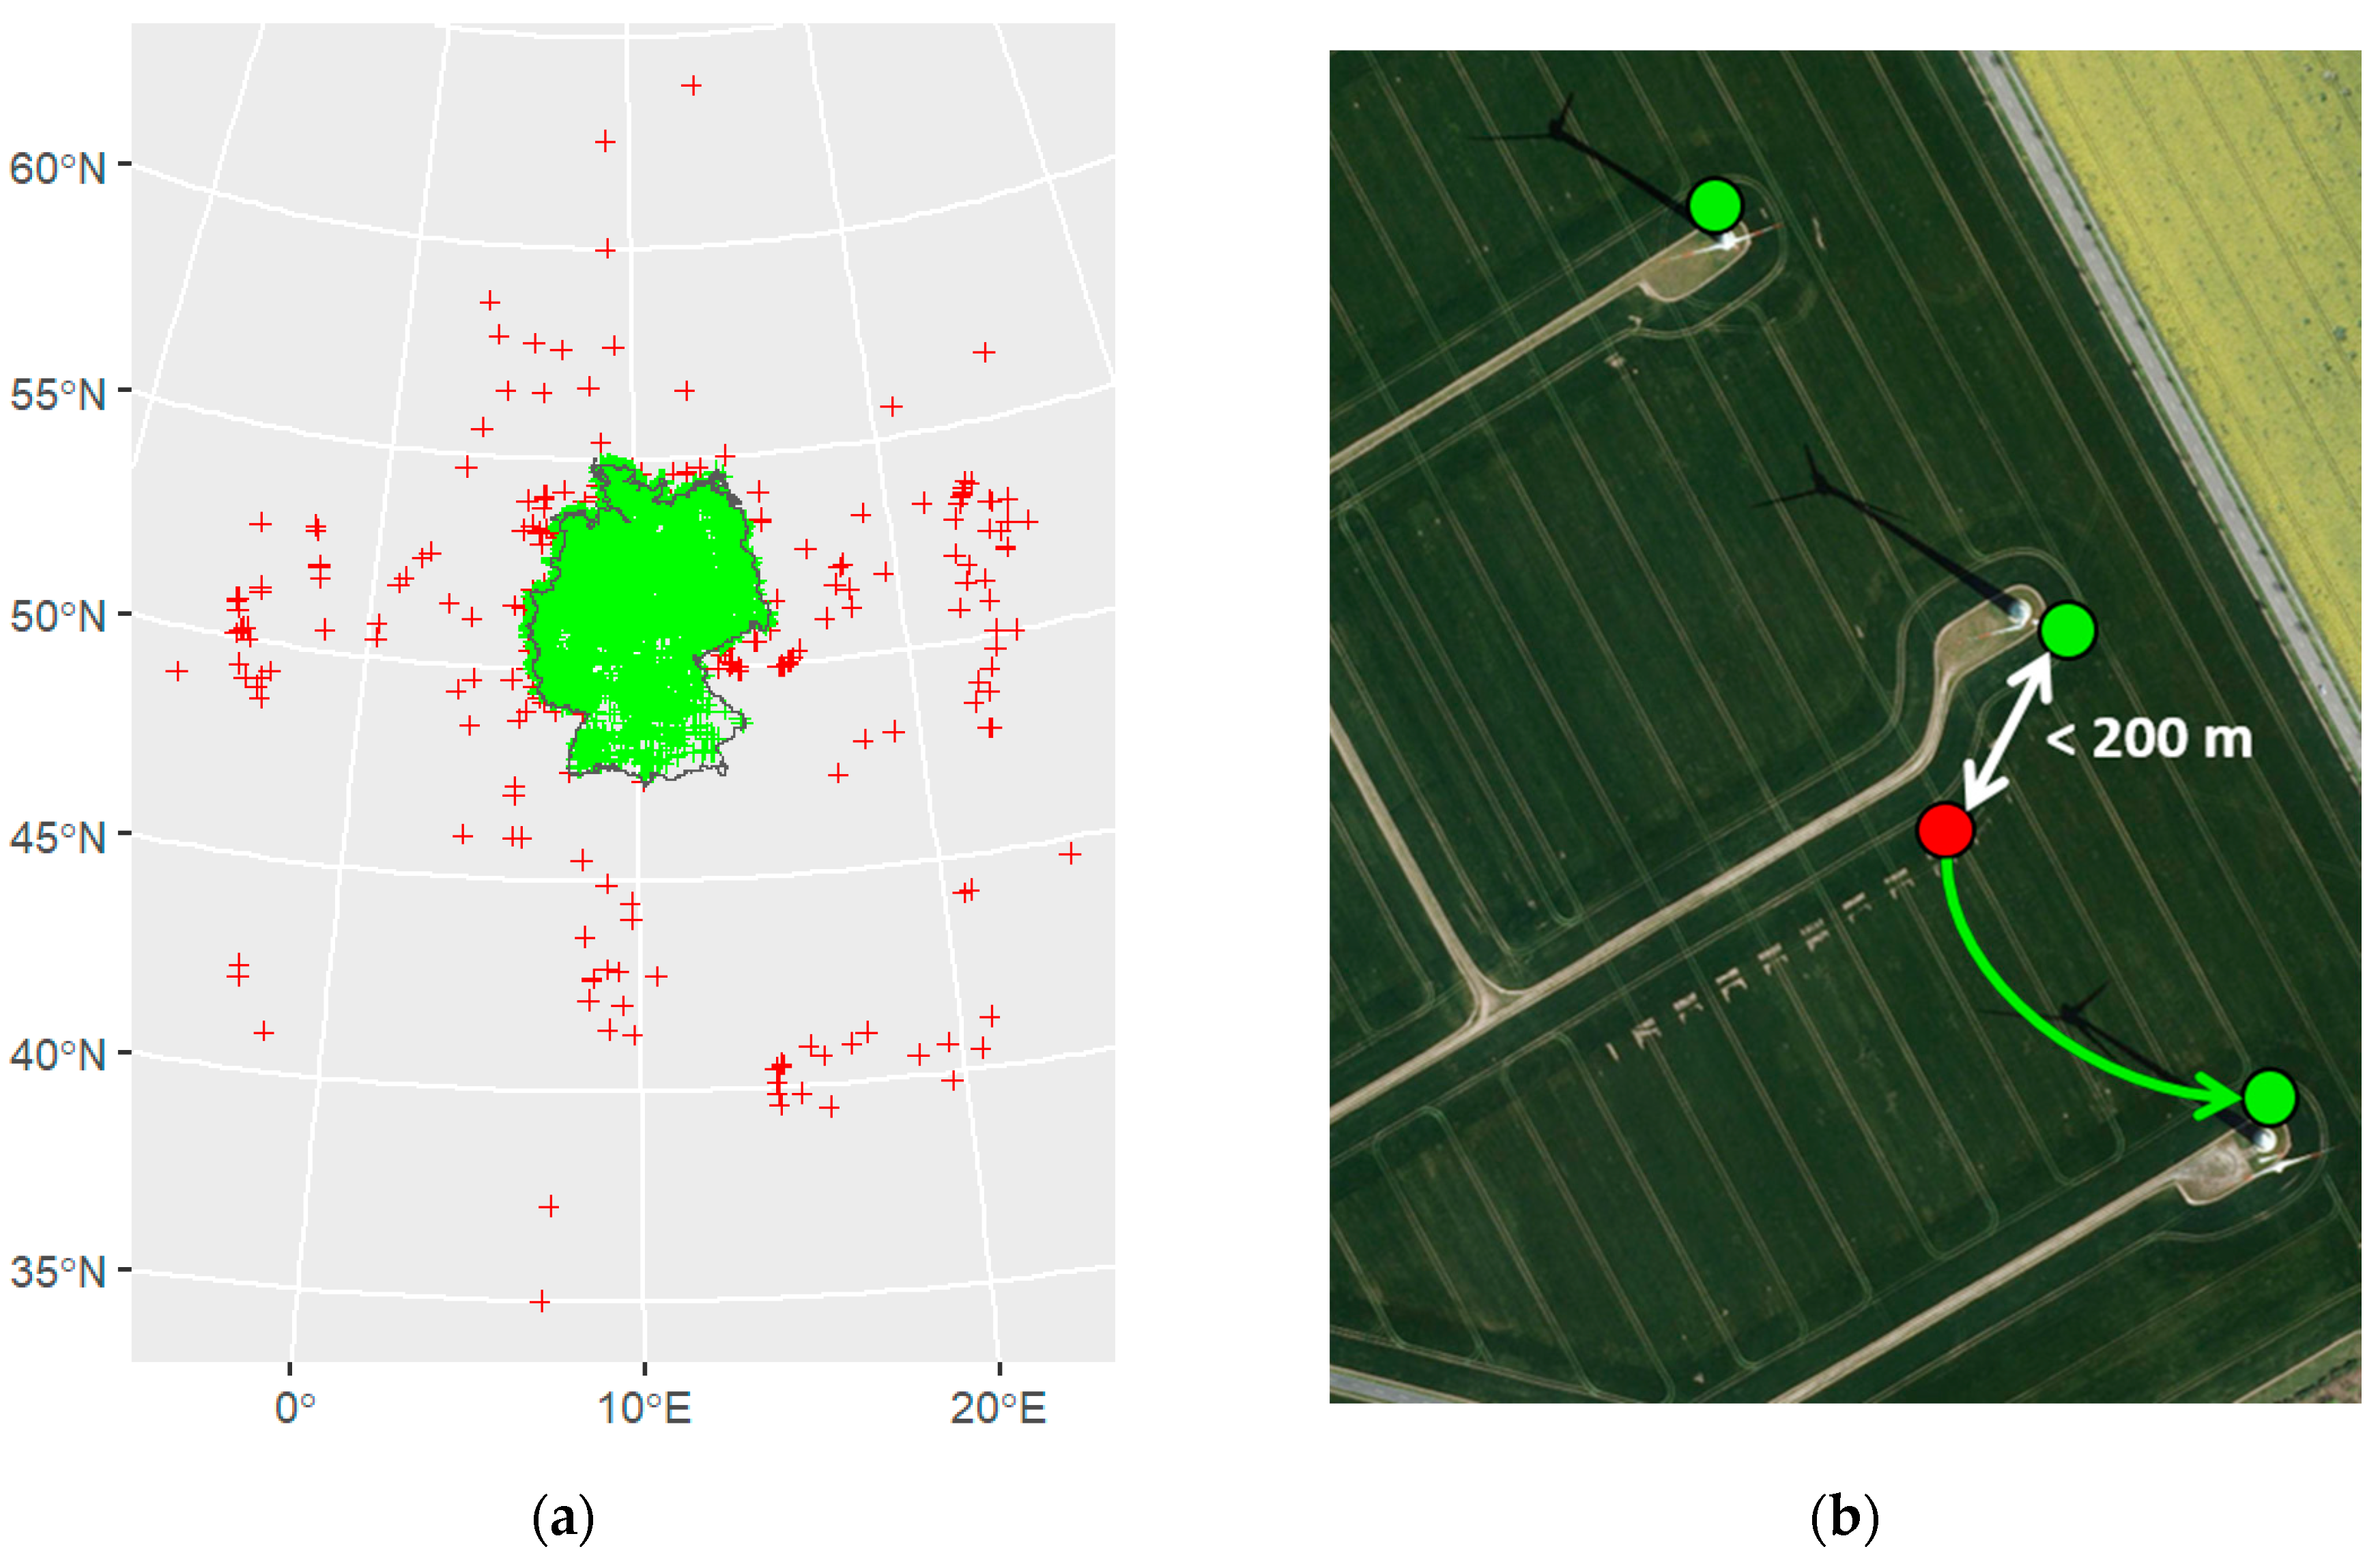
Table 3 gives an overview of the completeness of the initial data of onshore and offshore wind power plants. What looks like a reasonably complete data set at first sight turns out to be partially wrong on closer inspection, especially with regard to the geographical location of the wind power plants. For example, 500 of the onshore wind power plants had obviously incorrect geographic information (
Figure 1a). For this reason, the onshore wind power data were essentially subjected to a review and modified in several successive work steps. The offshore wind data set on the other hand were almost complete and error-free. Only three records had to be deleted because of wrong coordinates, which could not be corrected either.
Thus, the initial data set of onshore wind power plants was initially reduced by 691 entries after all records with missing and untraceable geo-coordinates were removed. This was done by a query to delete records without geo coordinates.
Table 4 documents the change in the onshore wind turbine data set during data processing. The records removed were small wind power plants with a generation capacity of less than 30 kW and a total generation capacity of about 5 MW. Although the total number of wind power plants in the data set decreased at this point, the total installed capacity increased by 37 MW, as some obviously incorrect information on installed capacity could be corrected.
The onshore wind power plants with obviously wrong coordinates were shifted to the location of the municipality stored in the initial data extract and then manually placed in their actual location with the help of aerial photographs (Google Maps) or by tracing the geo-information in the other data sources mentioned.
To verify the location accuracy of all other onshore wind turbines, an image recognition model for onshore wind turbines was trained using convolutional neural networks (CNN) and applied to the aerial images (from Google cloud service) of the given geo-coordinates of the wind turbines. For modelling, we used the Keras library and the TensorFlow framework as a backend as they are popular, can be used in R and seem to give the best results in binary image classification compared to other CNN approaches [
20,
21]. We choose a sequential model for binary classification (wind turbine present or not) and used three fully connected dense layer. The trained model provided sufficiently accurate results with an accuracy of 92% for a setting of 33 × 33 pixels. New installations from 2018 onwards could not be identified in most cases due to the fact that the aerial images provided by the Google Cloud service were older at the time of classification. Old installations that have already been dismantled before the time of classification could also not be identified as such. This leads to the fact that 7775 records had to be visually checked again manually. Of these, a total of 4786 wind power plants were manually corrected in their position because they contained either incorrect or inaccurate location information. Another 190 records with a total installed capacity of 330 MW could not be assigned to an exact location and were therefore removed from the data set.
In order to check whether there are still misplaced wind turbines, overlaps or duplicates of wind power plants, the distances to the nearest wind power plant were calculated in each case. Since the wind turbines should be at a distance of 2 to 3 times the rotor diameter from each other, depending on the wind direction, and the mean value of the rotor diameter of the data set was about 80 m, wind power plants that were less than 200 m apart were manually checked for correctness of position by aerial photograph comparison (
Figure 2b). However, wind turbines could be close to each other if repowering or new construction of the turbine took place at the same or a nearby site and the old turbine had a decommissioning date. The distance check allowed further misplaced wind turbines to be corrected manually and 221 duplicates with a total installed capacity of 412 MW to be identified, which were removed from the data set.
In a further step, missing or obviously incorrect information in the data, such as implausible hub heights or rotor diameters, has been deleted or, if possible, corrected by tracing the installation in the mentioned other available data sources with supposedly correct information. To check the plausibility of the hub height and rotor diameter, the hub heights were set in relation to the total height of the respective wind turbine (which is the sum of the hub height and half the rotor diameter) and checked for a value of less than 0.55 to ensure that the rotor blades are not longer than the hub height.
In a final step, still missing values for hub heights and rotor diameters were added using a method developed by [
9]. For this purpose, a random forest was trained and applied to the data set. We used six predictor variables, four of which are technical parameters (installed capacity, hub height, rotor diameter and year of commissioning) and two of which define geographical location (latitude and longitude). Hub height and rotor diameter each represented the response variable. Thus, 598 missing hub heights and 385 rotor diameters were filled in, covering 417 records with one and 283 records with two missing variable values each. A total of four random forest were carried out to fill the gaps and a 4-fold cross-model validation was performed for each trained random forest, with better predictions for rotor diameter following the RSME and R
2 (
Table 5).
The final data set of onshore wind turbines consists of 28,159 records with a total installed capacity of 54,905 MW. This is 1103 records less than the initial data set with a reduced total installed capacity of 728 MW, of which 56% of the capacity were identified as duplicates.
3.2. Photovoltaic Field Systems
Besides wind energy, solar energy is one of the most important sources of renewable energy. Thus, a number of Photovoltaic (PV) field systems have been built in recent years. These plants are elevated photovoltaic modules that are usually erected in the open countryside on arable land or grassland.
Since the CEMDR only contains point coordinates for the PV field systems, but the areal extent and size of these installations is important information depending on the context, these areas were mapped in the course of the data collection. For this purpose, existing area data of PV field systems were collected and merged from [
8,
22,
23] before their geometries were adjusted in a GIS software according to the following specifications:
After the manual adjustment of the geometries, the PV area data set contained polygons with a total area of 20,346 hectares and could be merged with the CEMDR data extract to transfer the system data to the mapped areas. However, before this, the CEMDR data were cleaned of records with incorrect or missing geo-coordinates.
Table 6 shows the completeness of the initial data of PV field systems of the CEMDR. Although the proportion of records without geo-coordinates is quite high at 32%, they only account for 0.002% of the total installed capacity and were therefore removed from the data set. These were mainly small PV systems that can be installed in home gardens, for example.
Thus, 7853 PV records remained for further processing (
Table 7).These records were first assigned one of ten categories of sky orientation (north, north-east, east, east-west, south-east, south, south-west, west, north-west or “sun tracked”) and one of five tilt levels from <20, 20–40, 40–60 to >60 or “sun tracked”, based on the information in the CEMDR extract.
After this initial data preparation, the system data were transferred to the mapped PV areas. However, since the PV records were not always geographically located exactly on the corresponding mapped PV areas in order to perform a simple geographical spatial join, an allocation algorithm with the following logic was first applied:
The CEMDR record with the smallest spatial distance to a mapped PV area belongs to this area if all other conditions are met as well.
The PV area and the PV record had to be located in the same municipality (we used the local administrative units (LAU)).
The ratio between the specified plant capacity and the area had to be within the tolerance range of 0.7 to 1.5 MW/ha.
No other record could be assigned to the mapped area under consideration of the rule 1.
If the conditions were not met, the record that was second closest to the PV area was tested and so on. In this way, 2048 PV records could initially be assigned to a PV area, which already corresponded to 26% of the entire PV data set.
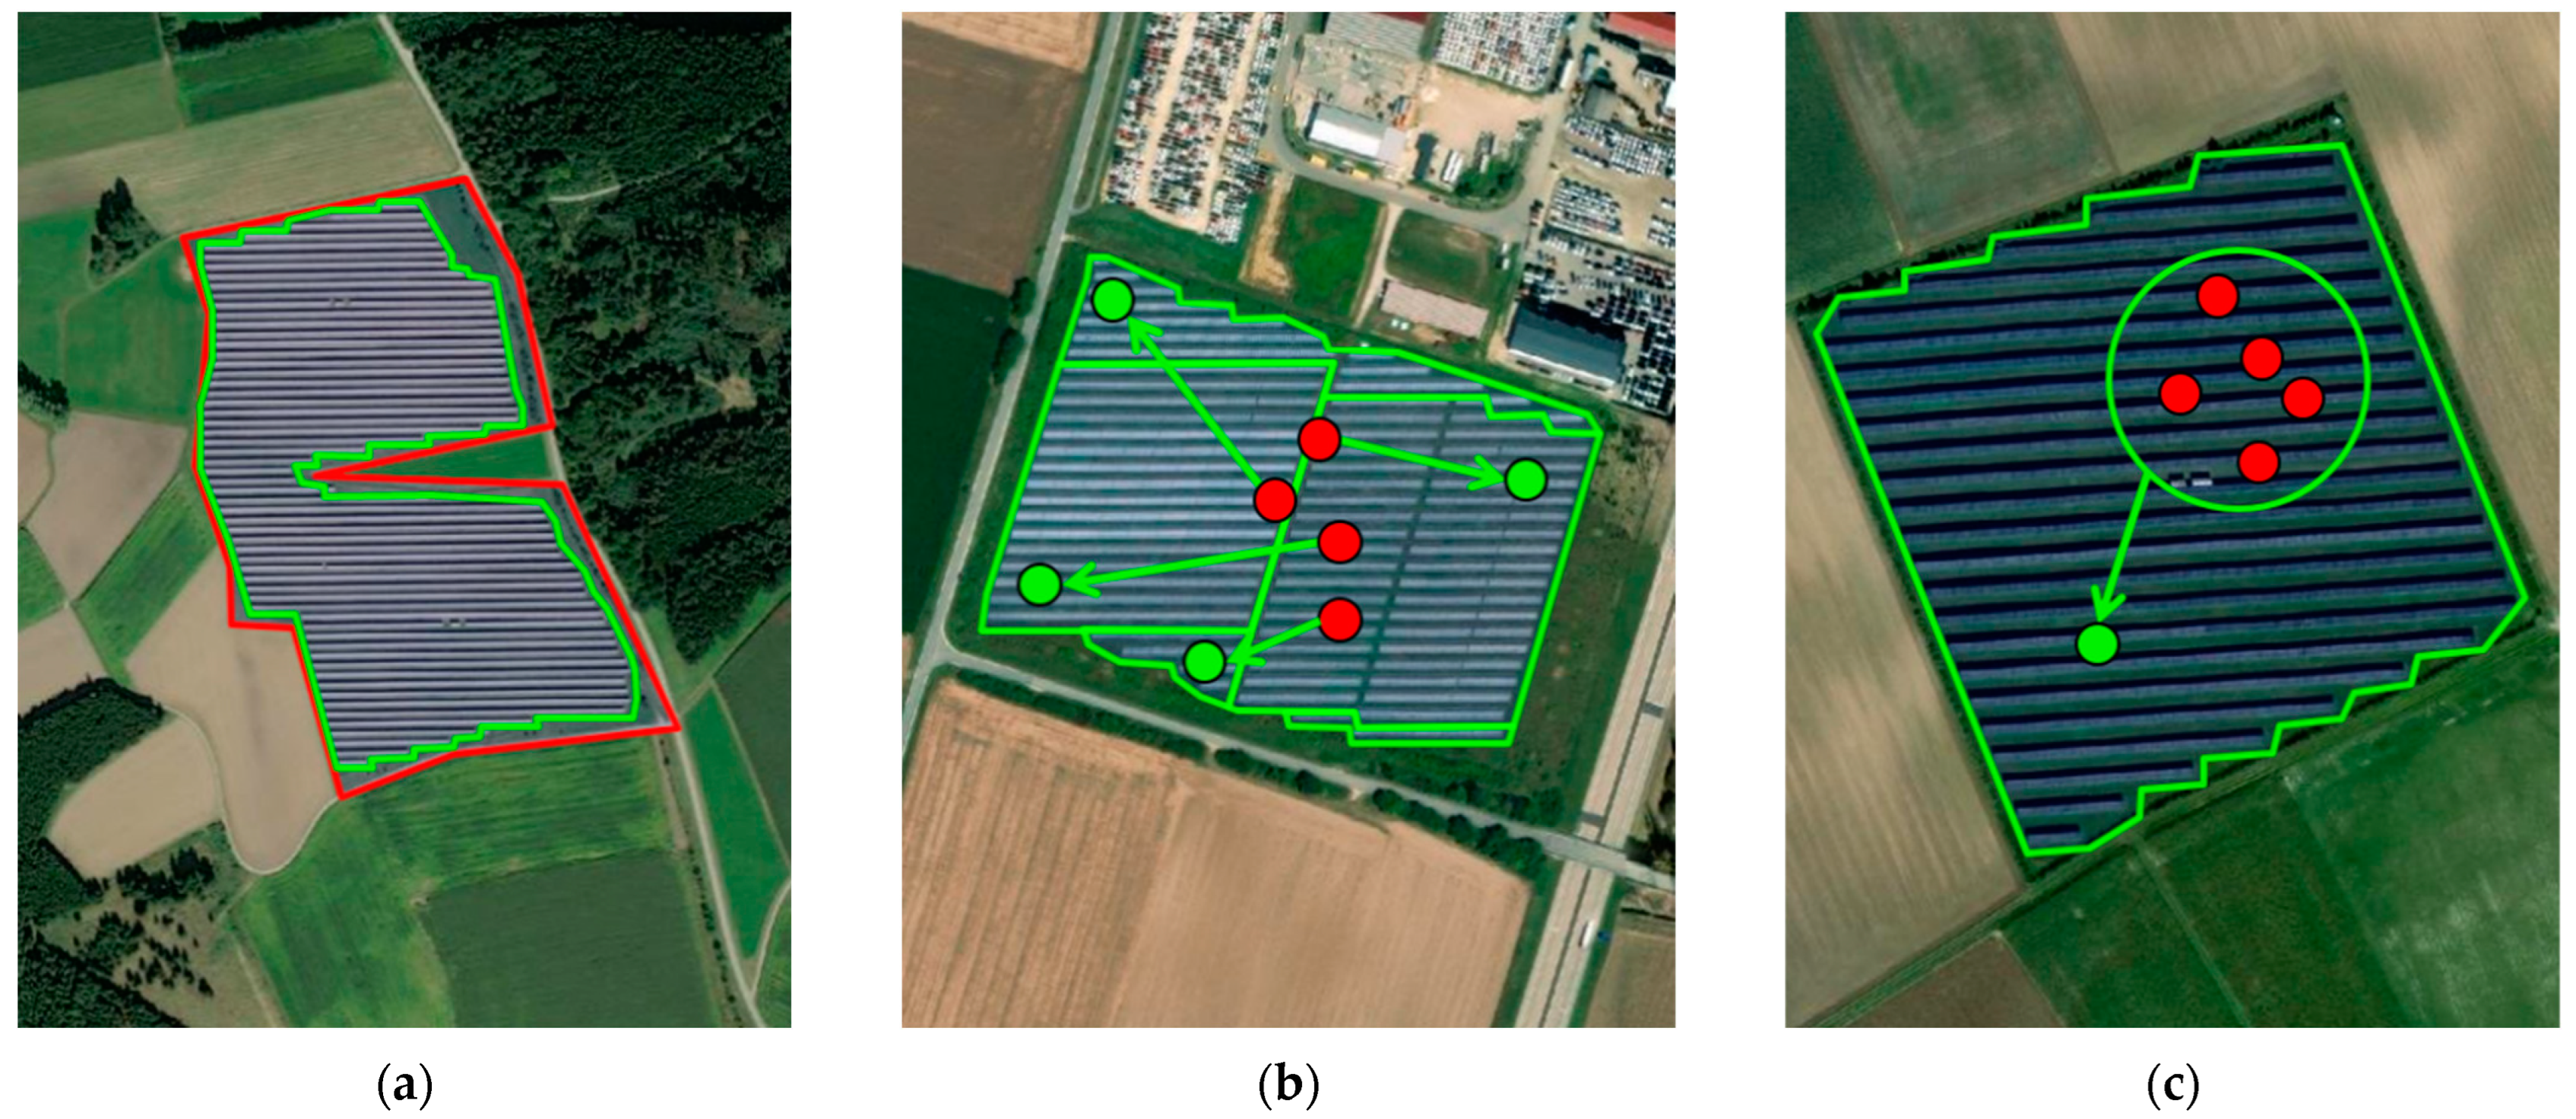
Records of PV field systems that could not be allocated by this algorithm were then in a further step manually assigned to a PV area in a GIS software. This brought the challenge of assigning them to the PV areas to which they actually belong, which was a process that was characterized by individual decisions, supported by additional information of the CEMDR (like field system names) and the use of aerial and satellite imagery (Google Maps or Sentinel Data). The manual allocation of PV data points to the mapped PV areas mainly affected PV field systems with initial incorrect coordinates or systems that had been expanded over time and therefore contained several records. If the latter was the case, the mapped areas of such contiguous PV field systems were manually subdivided in a GIS software into independent polygon geometries according to the number and information given in the associated PV records (
Figure 2b). Where available and necessary, past aerial imagery was used with Google Earth Pro to support allocation decisions regarding the determination of PV area development over time. Data points that could be consolidated or fell on a PV area that could not be further differentiated, were summarized if the time of commissioning was within one year (
Figure 2c). The most recent date was then taken as the commissioning date, as from this date the summarized system information is correct. In the end, 5805 PV records were manually checked and assigned to the obviously associated PV areas, of which ultimately 338 PV records could not be clearly allocated to a PV area and were therefore removed from the data set. This reduced the installed capacity of the PV data set by 269 MW. However, additional CEMDR data were included during this allocation procedure that were not considered PV field systems according to the CEMDR data extract but were classified as such by us. These included, for example, installations built on former landfill sites or in open-cast mining. The inserted data were given the attribute “Structural plants (other)” and in turn increased the total installed capacity of the PV data set by 392 MW.
In the course of the manual allocation, numerous PV areas that were not yet included in the PV area data set already compiled were also mapped and included in it, taking into account the mapping specifications introduced. Sentinel-2 satellite imagery was also used for this, which had the advantage of being more up-to-date compared to Google Maps. On the other hand, there was the disadvantage of lower ground resolution (at best 10 × 10 m). However, with the Sentinel-2 imagery, most PV installations could be detected and mapped with reasonable accuracy, although there were limitations with very small installations (<0.3 ha).
In total, about 3000 data points had to be manually shifted to the correct PV area and an additional PV area of 2564 hectares was mapped to which a PV record could be assigned. The final data set thus consisted of PV field systems with a total installed capacity of 13,807 MW and a total area of 22,910 hectares.
3.3. Bioenergy Plants
Bioenergy plays an important role as a renewable energy source to compensate for fluctuations in electricity generation from wind and solar energy. In this context, it encompasses various technologies for electricity generation that are based on the use of biomass. The data extract of the CEMDR showed that about 4% of the entries did not contain information on geo-coordinates (
Table 8). In addition, as with the wind power plant data, there were also several obviously incorrectly positioned bioenergy plants. However, unlike wind power plants or PV field systems, which are mostly located in open corridors, bioenergy plants can be located using a street address if no or incorrect geo-coordinates are provided, at least for those that have one stored in the initial data. For this purpose, the addresses of the records with missing geo-coordinates were converted into geo-coordinates using the geocoder of the Federal Agency for Cartography and Geodesy [
24].
In total, there were 838 records with no or obviously incorrect information on geo-coordinates in the initial CEMDR data of the bioenergy plants. For 90% of these records, only the center of the municipality were the plants are located could be geolocated due to insufficient address information, but not their actual site. These were mainly plants with an installed capacity of less than 100 kW. For the remaining 10%, the exact location could be determined.
In order to avoid overlaps of data points in the graphical representation of the plant locations (e.g., because several generation units are located at one site), data points lying on top of each other were offset by a few meters so that each data point can be identified individually in a map viewer. Thus, there were a total of 2313 cases of duplicate or multiple overlapping data points with a total number of 5977 entries. Checking the data set for duplicate entries in relation to the plant-specific information resulted in 6260 cases with the same technical parameters. However, it turns out that these were usually not duplicate entries in the true sense, but mostly twin units, i.e., plants with the same technical characteristics and operated at the same location. Nevertheless, it could not be ruled out that there are duplications.
To determine the main type of biomass used by the respective bioenergy plant, a total of 27 fuel types (Bark, Biodiesel, Biogas (on-site electricity generation), Biogenic liquid waste, Biogenic solid waste, Biomethane, Biomethanol, Burning liquor, Firewood, Landfill gas, Landscape wood, Liquid biogenic substances, Palm oil, Pellets (wood), Reclaimed wood, Sewage gas, Solid biogenic substances, Straw and straw pellets, Sulphite liquor, Turpentine, Vegetable oil, Warm fuels (biogenic commercial waste), Waste wood, Wood, Wood chips, Wood scraps (e.g., joineries), Wood shavings and sawdust) were included in the data set by reading out the initial CEMDR data, which in turn are classified into the three biomass groups gaseous biofuels, solid biofuels and liquid biofuels.
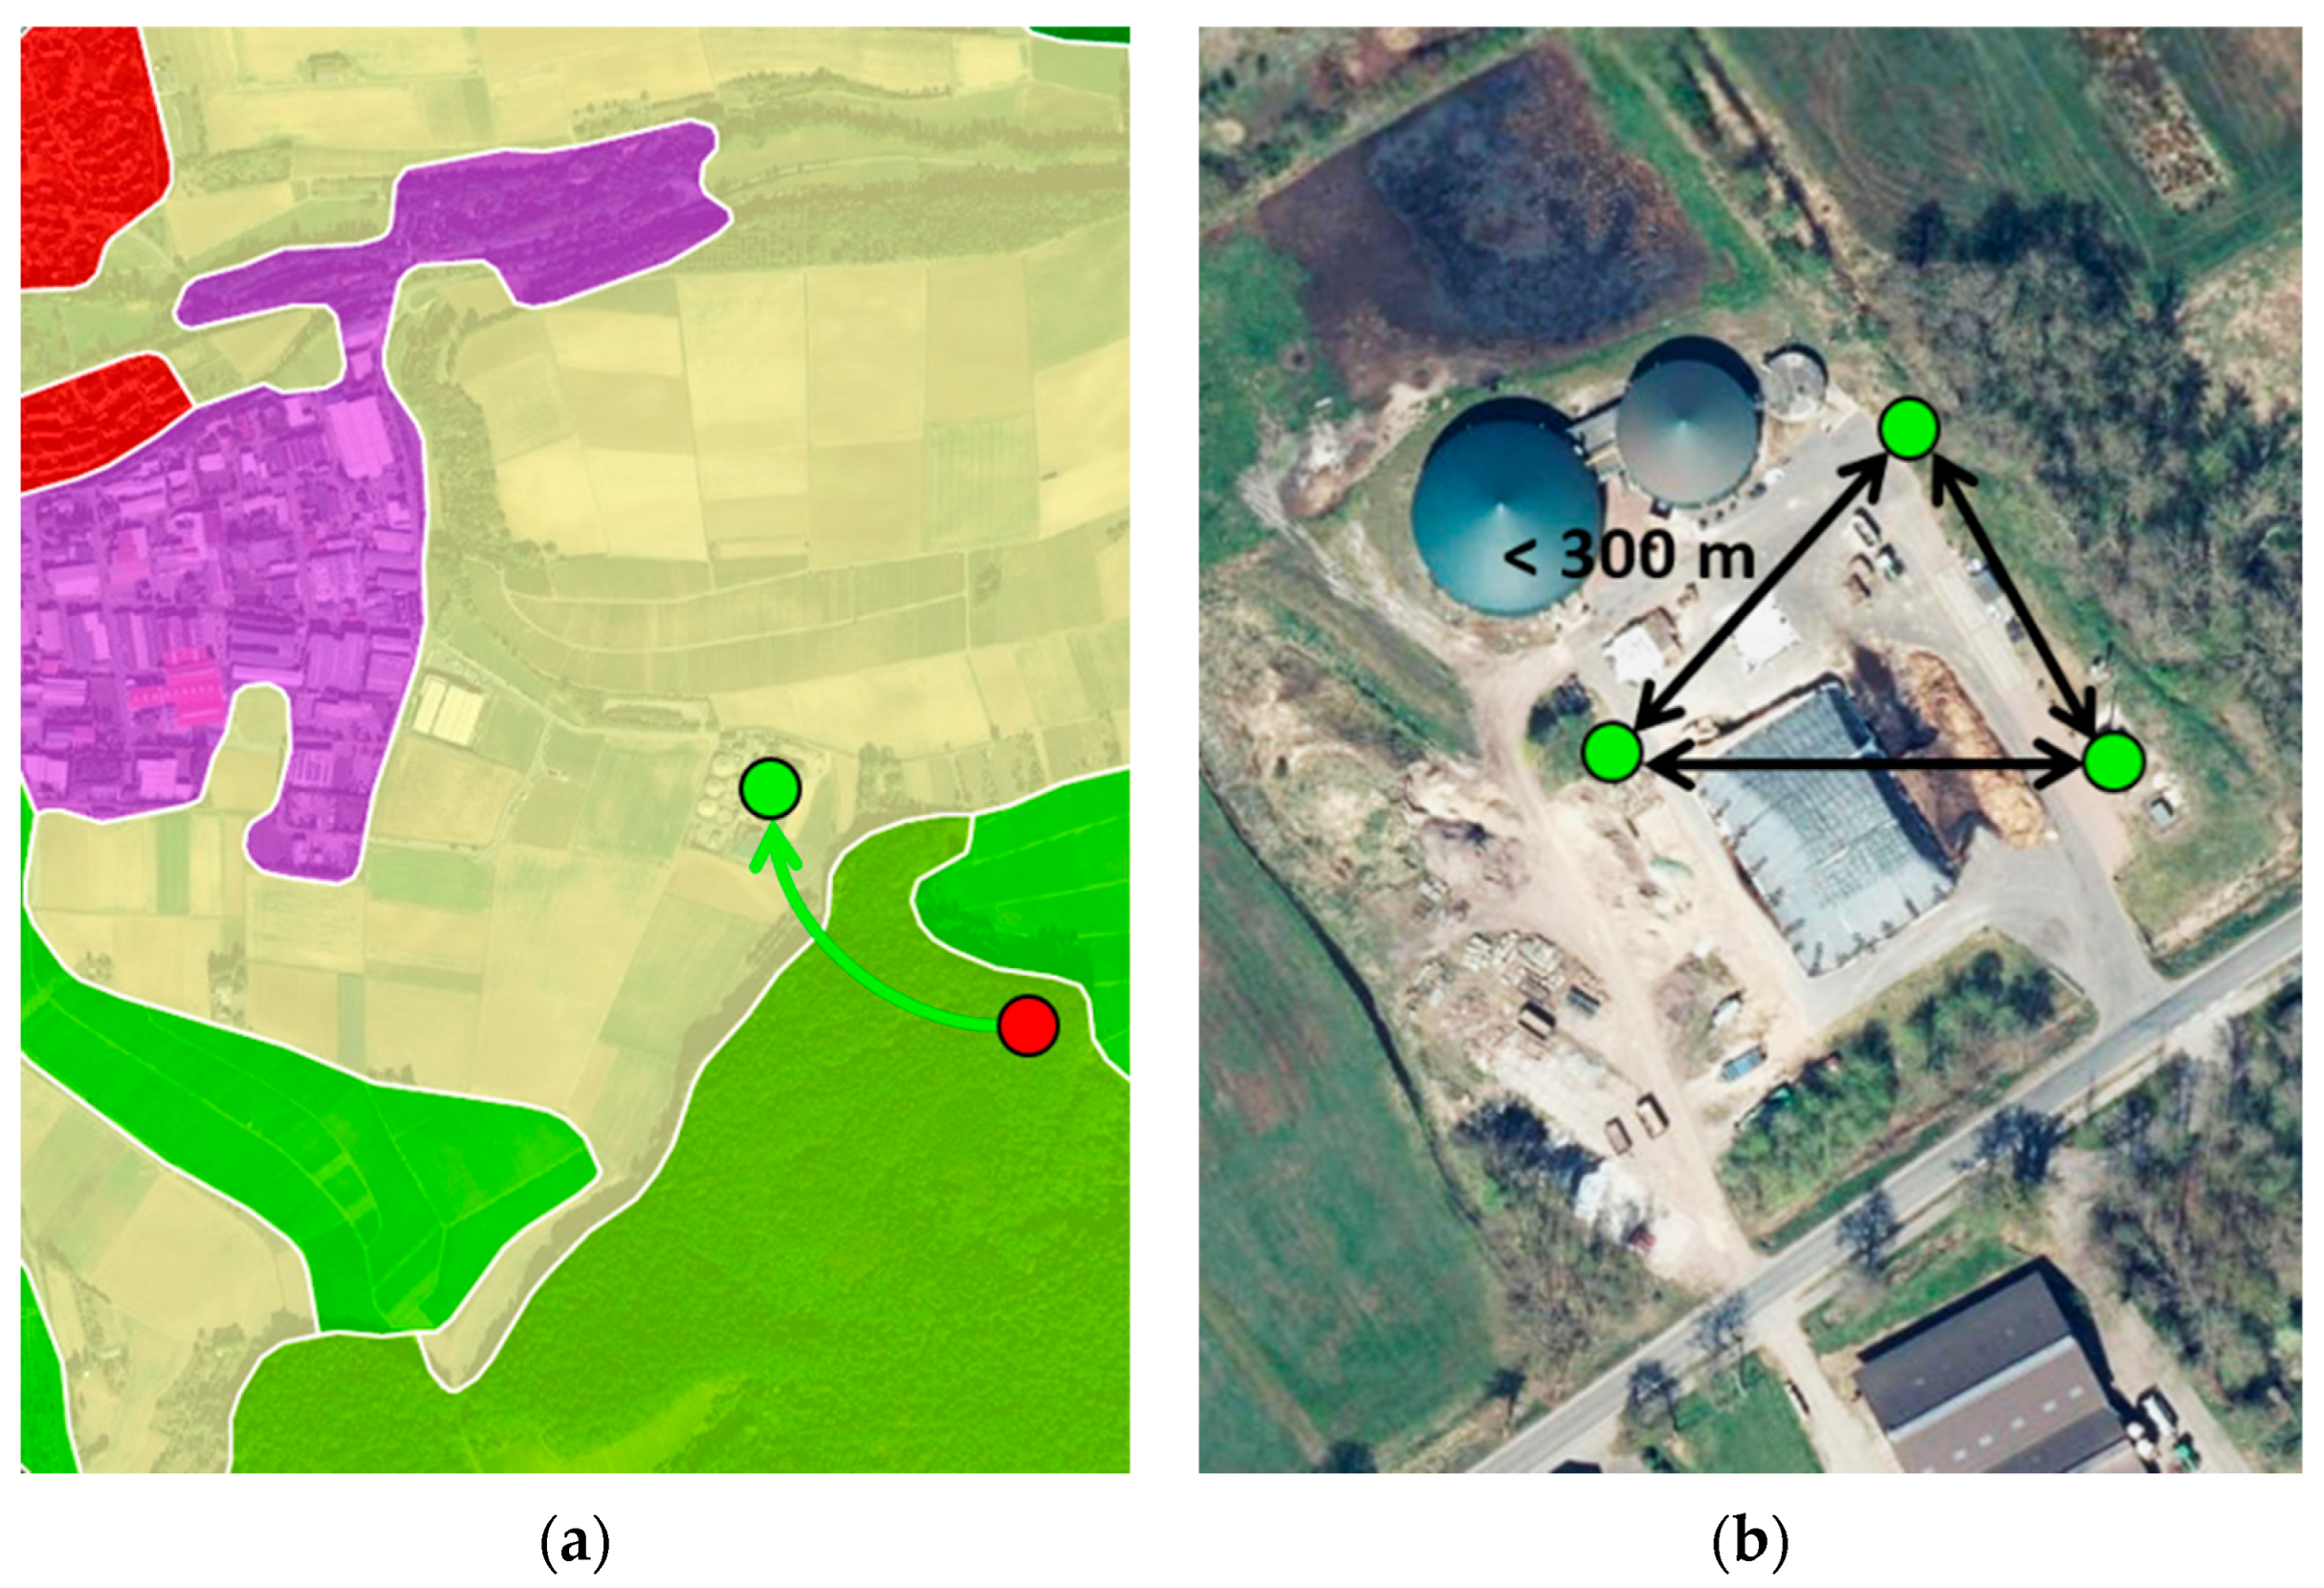
In the case of gaseous biofuels, 91% are biogas (on-site electricity generation), which in turn account for 84% of the total data set. To exclude erroneous localization due to incorrect geo-coordinates of these installations, they were spatially associated with the latest Corine Land Cover data set (CLC 2018) [
25]. Records that were located on land cover classes where they were not expected to be, such as forest, wetland or infrastructure, were manually, contextually checked. This led to a manual review of 1069 data sets where 296 records had incorrect geo-locations and were moved to the correct location based on the address in the original CEMDR record (
Figure 3a). Only 1 record had to be removed from the data set because its geo-location could not be determined.
The biogas plants for on-site electricity generation are generally supplied with gas from a biogas digester in the immediate vicinity. To obtain information about which biogas plants for on-site electricity generation belongs to the same biogas production site, the distance of all biogas on-site electricity generation plants to each other was calculated. Those plants that were less than 300 m away from each other (assuming that this distance covers a typical biogas production site) were grouped by an individual identifier to indicate that these plants are fed by the same biogas production site (
Figure 3b). This indexed 9701 virtual biogas production plants and corresponds approximately to the number of biogas production sites actually operated in Germany of 9692 for the year 2021 [
26]. The discrepancy between the virtually grouped records and reality is mainly due to the fact that the on-site electricity generation plants are not always located within the selected threshold of 300 m, but in some cases may be somewhat further away.
After correcting all obviously incorrect data, such as unrealistically high information about installed capacities, the final bioenergy plant data set consists of 19,940 records with a total capacity of 8493 MW.
Table 9 shows the distribution of the final bioenergy plant data set according to the main fuel groups of biomass used for generator operation, number of plants and installed capacity.
3.4. Hydropower Plants
Hydropower is probably one of the longest-used renewable energy sources. There are plants in Germany that have been in operation for over a hundred years. Geographically, there are a particularly large number of hydropower plants in southern Germany, as the conditions for hydropower utilisation are favourable here in the high runoff and precipitation regions of the low mountain ranges and the Alpine region.
In the initial CEMDR data set there were 36 apparently incorrectly located hydropower plants to which the correct geo-coordinates could be assigned. However, the data extract from the CEMDR also showed that 44% of the records do not contain information on geo-coordinates (
Table 10). The reason for this is the mainly private use of such plants with low installed generation capacities (less than 30 kW) which are therefore not fully published for data protection reasons [
10]. Nevertheless, address data with varying completeness were available for these installations in the CEMDR data extract, from which geo-coordinates could be determined with the help of the geocoder of the Federal Agency for Cartography and Geodesy [
24]. Unfortunately, for 3588 of these records, only the geo-coordinates of the centre of the municipality where the installations were located could be assigned. In addition, 15 hydropower generators were identified that are not located on the territory of the Federal Republic of Germany, but in the Alpine region of Austria. They all belong to a network of storage power plants with a total installed generator capacity of 639 MW.
The analysis of geographically overlapping records resulted in a total number of 3814 entries, distributed over 1294 cases of duplicate or multiple overlapping data points. They were all moved so that each data point could be identified individually in a map viewer. As with the bioenergy data set, no duplicate records were identified.
A total of five distinguishing features of hydropower plants were included in the data set, which were read from the original CEMDR data set. These were namely hydropower in drinking and service water systems, storage hydropower, wastewater hydropower and run-of-river hydropower. The latter are in turn divided into the three subtypes run-of-river power plants, diversion power plants and residual water power plants.
After correcting manifestly incorrect data and removing four records due to untraceable system data, the final hydropower data set consists of 8042 records with a total capacity of 5832 MW. In terms of the total number of hydropower records collected, run-of-river power plants account for 90%, with the group of run-of-river power plants with 54% followed by diversion power plants with 35% representing the largest subtypes (
Table 11). In relation to the total installed hydropower capacity, however, run-of-river hydropower only accounts for 75%. The reason for this is the large storage hydropower plants with a share of 23% of the total installed capacity.
4. Discussion and Conclusions
The compilation of the data set of onshore and offshore wind power plants, PV field systems, bioenergy plants as well as hydropower plants for renewable electricity generation has shown that a significant part of the initial CEMDR data extract was incorrect and therefore had to be corrected. For this purpose, existing methods (e.g., [
9]) were used, but new techniques (e.g., turbine image recognition, distance checks) were also introduced and further data sources were exploited to fill data gaps or locate misplaced renewable energy installations. In addition, the PV field systems data set was extended to include the corresponding areas taken up by the installations, which enables further analyses, e.g., the calculation of the area size or which land cover classes are affected by PV field plants. The latter aspect contributes to the research value of this particular data set of renewable power plants. In contrast to detailed regional and therefore decentralized data sets from regional planning associations, this data set presents the sites with detail on a national level. The data set is publicly available and can be found at [
11]. It is provided as geodata in GeoJSON format, a widely used data format for spatial vector data that can be read by common GIS software.
Compared to the official figures reported by the Federal Ministry for Economic Affairs and Climate Action (BMWK) in [
1], the compiled data set shows good agreement in terms of total installed capacity for 2020 (
Table 12). However, it should be noted that the official figures are based, among other sources, on the values recorded in the CEMDR [
27].
Even though the compiled data set is almost complete, there are plants that are missing, which may explain the discrepancy in the figures in
Table 12. This mainly concerns plants that (1) could not be assigned due to a lack of information and were therefore removed from the data set, (2) contained incorrect or outdated information in the CEMDR extract, and (3) were decommissioned before the official introduction of the CEMDR in 2017 and were therefore not included in the CEMDR data extract. However, according to our own estimates, the latter only affects a few plants, as most of the plants received a 20-year state subsidy with the introduction of the Renewable Energy Sources Act (EEG) in 2000 and should therefore most likely not be decommissioned before 2017. For plants for which no exact location could be determined, it was at least possible to identify the municipality in which they are located. This applies above all to small hydropower plants, but also to some bioenergy plants.
The compiled data set allows to obtain a very accurate picture of the spatial and temporal distribution of renewable energies in Germany, which can be helpful for monitoring the transformation of the energy system. It can be used for socio-economic and environmental questions in research, infrastructure planning or political discussions, in perspective also at the EU level. For example, it can be made clear, which regions are well advanced in the expansion of renewable energies and which regions still need development assuming at the same time that the natural conditions of the respective region are very diverse. Therefore, the data set might also help social science studies in analyzing questions of justice related to the energy transition, e.g., discussing the urban-rural and the interregional relationship. The data can also be used as basic data for plant-specific modelling of electricity yields with weather data, as developed by [
5,
6] for wind and PV plants.
To simplify the mapping of PV areas or the detection of renewable energy installations, Artificial Intelligence-based image recognition algorithms could be used in the future to speed up data processing, as already tested in a use case by [
29]. In addition, an application programming interface (API) could be established in the future to expose the data set and enable automatic retrieval and integration of the data into external applications [
30]. This would improve the applicability of the data set and would have the advantage over a file-based publication of the data set as individual GeoJSON files that users of an API would always be up to date with updates or changes and thus always have a consistent data set.
To update the data set, it can be extended by the desired period. All that is needed is a current data extract from the CEMDR, a comparison with the unique CEMDR number and the deposited time stamp in the existing data set to update it in case of a change and to add new records. The work presented here can help to ensure an efficient and comprehensible process of data preparation during updates.


